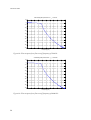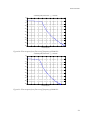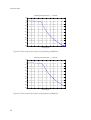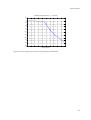
1
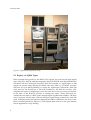
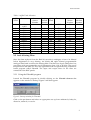
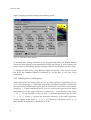
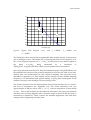
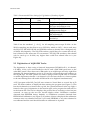
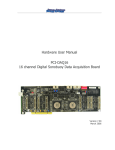
Transcription Method used for P-3C AQH4 Tapes
Paul A. Clarke, Trevor Jackson, and Peter Wade
Maritime Operations Division
Aeronautical and Maritime Research Laboratory
DSTO-GD-0248
ABSTRACT
Sonobuoy data is regularly obtained using the RAAF P-3C aircraft during DSTO trials.
This data is recorded on the aircraft using 28 track AQH4 tapes and needs to be
transcribed onto CDs for storage and analysis. The method used to transcribe analogue
sonobuoy data was recently upgraded. This document describes the equipment used
and the steps involved in transcribing this data.
RELEASE LIMITATION
Approved for public release
Published by
DSTO Aeronautical and Maritime Research Laboratory
PO Box 4331
Melbourne Victoria 3001 Australia
Telephone: (03) 9626 7000
Fax: (03) 9626 7999
© Commonwealth of Australia 2000
AR-011-524
July 2000
APPROVED FOR PUBLIC RELEASE
Transcription Method used for P-3C AQH4
Tapes
Executive Summary
During trials with the RAAF P-3C aircraft, sonobuoy data is stored on the aircraft using
28 track AQH4 Tapes. This data needs to be transcribed onto CDs for storage and
analysis. This transcription method for analogue sonobuoys has been improved. The
previous method required moving large data files between a number of different
computers before it was ready to be copied onto CD and had limited quality control
checking. The improvement required the purchase of an analogue to digital (A/D)
converter card and a number of FM cards for the AQH4 tape recorder.
•
•
•
•
•
Transcription of data from the AQH4 tapes onto CDs now involves the following steps:
Replay of the AQH4 Tape
Anti-alias filtering of the analogue signal
Digitisation of the analogue signal
Quality checking the data files
Writing the data onto CD for storage and analysis
This new method now has the digitisation, validation, and storage processes in one PC,
thus simplifying the transcription process. In addition, a commercial off the shelf
(COTS) software program called Cool Edit was purchased to check the data files. This
has improved the validation process, since it is user friendly, fast, and has a good
Graphic User Interface (GUI) to check the data quality.
This document describes the new transcription process, the required filter settings, and
the techniques for using the A/D card software.
Authors
Paul Clarke
Maritime Operations Division
____________________
Paul Clarke is a Professional Officer Class 2 in the Maritime
Operations Division at DSTO Salisbury. He joined DSTO in mid
1995, after completing a Bachelor of Science degree in
Oceanography and Meteorology at Flinders University and a
Bachelor of Engineering degree in Mechanical Engineering from
the University of South Australia. At DSTO Paul has worked on
underwater acoustics, including work on the effect the
environment has on acoustic propagation, various inversion
techniques used to get the geoacoustic sediment parameters, and
target strength measurement.
________________________________________________
Trevor Jackson
Maritime Operations Division
____________________
Trevor Jackson is a Senior Professional Officer in Maritime
Operations Division at DSTO Salisbury. He joined DSTO in 1988
after completing a Bachelor of Engineering in Electronics
Engineering at the South Australian Institute of Technology. At
DSTO Trevor has been responsible for hardware and software
engineering developments associated with complex trials and data
acquisition and analysis systems for various sonar systems,
including systems in service with the RAN. He has also actively
participated in a numerous trials and been involved with the
analysis of data collected during trials. Trevor is currently the head
of a section responsible for providing data acquisition and analysis
services to MOD Salisbury.
________________________________________________
Peter Wade
Maritime Operations Division
____________________
Peter Wade is a Technical Officer Level 3 in the Maritime
Operations Division at DSTO Salisbury. He joined DSTO then
WRE. in 1977 as an apprentice electrical fitter. After completing
his apprentice ship and an Associate Diploma in Electrical
Engineering he worked as an electro-mechanical draftsperson until
1996 when he became involved in underwater acoustic trials and
data analysis. Currently studying for a Degree in Computer
Science he currently performs most of the data transcription
associated with acoustic trials performed by Maritime Operations
Division.
________________________________________________
Contents
1. INTRODUCTION ............................................................................................................... 1
2. THE TRANSCRIPTION PROCESS................................................................................. 1
2.1 Replay of AQH4 Tapes ............................................................................................ 2
2.2 Anti-Aliasing Filter .................................................................................................. 3
2.2.1
Using the Filter488 program .................................................................... 3
2.2.2
Selecting the cut off frequency ................................................................ 4
2.3 Digitisation of AQH4 FM Tracks .......................................................................... 6
2.4 Validation of Data Digitised ................................................................................ 10
2.5 Storage of Digitised Data ...................................................................................... 14
3. CONCLUSIONS ................................................................................................................ 14
4. REFERENCES..................................................................................................................... 15
APPENDIX.A TESTING OF ANTI-ALIASING FILTER ............................................ 17
A.1. Experimental Set up for the Anti-Aliasing Filter Test ............................................ 17
A.2. Anti-Aliasing Filter Responses ................................................................................... 19
List of Figures
Figure 1: Digitisation Equipment Set up................................................................................. 2
Figure 2: Start up window for Filter488 .................................................................................. 3
Figure 3: Filter488 setting window .......................................................................................... 4
Figure 4: Typical Filter Response Curve, with f s = 40kHz , f N = 20kHz , and
f c = 16kHz .......................................................................................................................... 5
Figure 5: NI_Card_dll.exe main form...................................................................................... 7
Figure 6: Loading the file names .............................................................................................. 7
Figure 7: Sampling data............................................................................................................. 9
Figure 8: Unpacking Data ......................................................................................................... 9
Figure 9: Data saved................................................................................................................. 10
Figure 10: Spectrogram of a DIFAR signal using Cool Edit............................................... 11
Figure 11: Spectrogram of a Bathythermograph sonobuoy, zoomed in on the frequency
scale. ................................................................................................................................... 12
Figure 12: Time series of ambient noise from an SSQ-57A sonobuoy, zoomed it on the
amplitude scale................................................................................................................. 12
Figure 13: Spectrogram of a SUS charge recorded using a 40 dB attenuated SSQ-57A.
Three spikes can be seen showing the shock wave and two bubble pulses. ........... 13
Figure 14: Rooftop checker signal, zoomed in on the time scale. A spectrogram would
show a dominant line at 100 Hz..................................................................................... 14
Figure 15: Experimental set up used to test the anti-aliasing filter ................................... 17
Figure 16: Filter response for a filter cut-off frequency of 3000 Hz................................... 19
Figure 17: Filter response for a filter cut-off frequency of 5600 Hz................................... 19
Figure 18: Filter response for a filter cut-off frequency of 7100 Hz................................... 20
Figure 19: Filter response for a filter cut-off frequency of 14000 Hz................................. 20
Figure 20: Filter response for a filter cut-off frequency of 15000 Hz................................. 21
Figure 21: Filter response for a filter cut-off frequency of 16000 Hz................................. 21
Figure 22: Filter response for a filter cut-off frequency of 18000 Hz................................. 22
Figure 23: Filter response for a filter cut-off frequency of 20000 Hz................................. 22
Figure 24: Filter response for a filter cut-off frequency of 22500 Hz................................. 23
List of Tables
Table 1: AQH4 Track Allocation .............................................................................................. 3
Table 2: Recommended Filter Settings for Digitisation of Sonobuoy Signals ................... 6
Table 3: Settings used during the Anti-Aliasing Filter Measurement .............................. 18
DSTO-GD-0248
List of abbreviations
A/D
BNC
CD
COTS
DIFAR
DICASS
DIG
EEPROM
ESM
FM
GUI
ICS
PC
PCI
RAAF
RTC
SS1
SS2
SSQ
TCG
Analogue to Digital
Bayonet Nut Connector
Compact Disk
Commercial off-the-shelf
Directional Frequency Analysis and Recording
Directional Command Active Sonobuoy System
Digital
Electrically Erasable Programmable Read Only Memory
Electronic Support Warfare Measures
Frequency Modulated
Graphical User Interface
Internal Countermeasure Set
Personal Computer
Peripheral Component Interconnect
Royal Australian Air Force
rooftop checker
Sensor Station 1
Sensor Station 2
Sonobuoy
Time Code Generator
DSTO-GD-0248
1. Introduction
Sonobuoy data obtained using the RAAF P-3C aircraft is recorded onto AQH4 tapes
during a trial. This data then needs to be transcribed to CD, so it can be analysed and
archived. The method of transcribing analogue sonobuoy signals has been updated,
improving the ability to digitise multiple channels at the same time, and at a higher
sampling frequency.
The upgrade also reduced the time taken to transcribe the data to CD and improved
the ability to validate the data. This was done by combining the A to D card and CD
writer in one PC, so time is not wasted transferring the data between machines and
off the shelf software could be used to check the data.
As part of the upgrade, a Graphical User Interface (GUI) was written to simplify the
digitisation process. This report describes the new method used to transcribe and
validate the data.
2. The Transcription Process
The transcription of FM data from AQH4 tape to CD has a number of steps:
1. The FM tracks of the AQH4 tapes are replayed using a RACAL STOREHORSE
recorder. Each FM track produces an analogue data channel.
2. The analogue data is then low pass filtered, using a multi channel programmable
filter, to remove aliasing during the digitisation. The current filter has eight
channels, so a maximum of eight channels can be digitised at the current time.
3. The data is digitised and saved as a separate file for each AQH4 track of interest
on the PC's hard disk.
4. These files are then checked for errors by audio replay and displaying the data
graphically using 'Cool Edit'.
5. The data is written onto CD's for analysis and storage.
The RACAL recorder, filter, and PC have been installed in racks and connected to a
number of BNC connector panels (see Figure 1). This enables the different AQH4
tracks to be easily digitised. A second RACAL recorder also has been placed in the
racks, to enable duplication of tapes, but this is only possible for the FM tracks (see
Table 1).
1
DSTO-GD-0248
Figure 1: Digitisation Equipment Set up
2.1 Replay of AQH4 Tapes
Data recorded during trials, by the RAAF P-3C aircraft, are stored on 28 track AQH4
tapes. SSQ-57A, SSQ-36 bathythermograph, SSQ-53D DIFAR, and SSQ-62B DICASS
sonobuoys all have analogue electronics and are recorded on AQH4 tapes as FM
signals on specific tracks during the RAAF trials (see Table 1). A RACAL recorder
has been set up at MOD Salisbury to replay the AQH4 tape's FM tracks. Each FM
track used by the RAAF has a FM card installed in the RACAL recorder. This
simplifies the replay of AQH4 tapes since the cards do not have to be moved around
in the back of the RACAL recorder to change the tracks. These FM cards are
connected to the back of a BNC panel, displaying the AQH4 track numbers. The data
can be replayed off the tapes, with an analogue signal being produced for each FM
track. Changing tracks just requires changing the cables connected to the front of the
BNC connector panels (see Figure 1). These signals then need to be low pass filtered
before digitisation to stop aliasing.
2
DSTO-GD-0248
Table 1: AQH4 Track Allocation
AQH4
Track
1
2
3
4
5
6
7
8
9
10
11
12
13
14
Function
Sensor
Station
Number
Pilot Headset
or ICS
FM
SS1
FM
SS1
FM
SS1
FM
SS1
FM
SS1
DIG
SS1
SERVO
FM
SS1
FM
SS1
FM
SS1
FM
SS1
DIG
SS1
FM
ESM or SS2
Receiver AQH4
Module Track
Number
15
2
3
4
6
7
1&2
8
2
3
1
3&4
4
16
17
18
19
20
21
22
23
24
25
26
27
28
Function
DIG
FM
DIG
FM
DIG
FM
DIG
FM
DIG
SERVO
DIG
FM
TCG
FM
Sensor
Station
Number
SS1
Receiver
Module
Number
5&6
SS1
SS1
SS1
SS1
SS1
SS1
SS1
SS1
5
7&8
5
1&2
6
3&4
7
5&6
SS1
SS1
7&8
8
SS1
1
2.2 Anti-Aliasing Filter
Since the data replayed from the RACAL recorder is analogue, it has to be filtered
before digitisation to stop aliasing. An IOtech 488 eight channel programmable
analogue filter bank is used as the aliasing filter. The filters are 8-pole Chebyshev low
pass filters with programmable cut off frequencies from 1 Hz to 50 kHz. The cut-off
frequencies are the same for all of the eight filters and are specified using a Windows
based program called Filter488. The input and output lines for the filter are
connected to the BNC panels.
2.2.1 Using the Filter488 program
Launch the Filter488 program by double clicking on the Filter488 shortcut that
appears on the window’s desktop. Figure 2 will then appear.
Figure 2: Start up window for Filter488
Click on the yes button and select an appropriate set-up from ambient.ftr, bathy.ftr,
dicass.ftr, strum.ftr, or sus.ftr.
3
DSTO-GD-0248
Figure 3 displays the filter settings after selecting sus.ftr.
Figure 3: Filter488 setting window
To transmit these setting commands to the programmable filter, the Output Control
button has been selected in the immediate position (see Figure 3). After selecting the
output control to immediate, the filter settings will be set and the filter is ready for use.
To change the filter set-up, select File then Open and choose a new set-up from the
list. Select the Output Control to immediate to set the filter to the new set-up
parameters.
2.2.2 Selecting the cut off frequency
When selecting an anti-aliasing filter for use in a data acquisition application, the cut
off or corner frequency f c of the filter is normally the highest frequency of interest in
the signal being acquired (see Figure 4). The attenuation of the filter at the Nyquist
frequency f N is what determines the level of any aliasing that appears in the signal
being acquired. As the upper frequency of interest is f c , some aliasing in the region
f c to f N can be tolerated as long as there is sufficient attenuation in the band
f s − f c to f s , where f s denotes the sampling frequency in the data acquisition
process. Signals in the band f s − f c to f s are aliased to frequencies below f c , so
these must be attenuated by a minimum of 50 dB.
4
DSTO-GD-0248
10
0
-10
-20
fc
-30
-40
fN
-50
-60
fs
-70
-80
-90
0
5000 10000 15000 20000 25000 30000 35000 40000 45000 50000
Frequency (Hz)
Figure 4: Typical Filter Response Curve, with
f s = 40kHz ,
f N = 20kHz , and
f c = 16kHz .
The Chebychev filters used in the programmable filter module specify an attenuation
rate of 80 dB per octave. The simple rule of selecting the filter cut off frequency to be
80% of the Nyquist frequency (ie. f c = 0.4 f s ) would result in any aliased signals in
0 → 0.4 f s
being
attenuated
by
a
minimum
80(log 2 (0.6 ) − log 2 (0.4 )) ≈ 47 dB , which is an acceptable level of attenuation.
the
band
of
Since data obtained from SSQ-57A, SSQ-36 bathythermograph, SSQ-53D DIFAR, and
SSQ-62B DICASS sonobuoys are normally digitised at set rates (see Table 2), the antialiasing filter was characterised for each required sampling rate using the set up
described in Appendix A.1. This enabled correct settings for each desired sampling
frequency to be determined and applied during on-going data transcription work,
instead of relying on the 80 dB per octave as being correct.
The results obtained from the measurements showed that the filters do not achieve
this level of attenuation (see Appendix A.2). The actual attenuation rate was
approximately 66 dB per octave from f c to 2 f c , with an attenuation of about 42 dB
at 0.6 f s . This would normally not be sufficient attenuation, but since pre-whitened
sonobuoy data is being digitised with a dynamic range of about 30 dB, this level of
attenuation is satisfactory. Table 2 shows the standard digitisation rates and filter
settings used for digitising sonobuoy data.
5
DSTO-GD-0248
Table 2: Recommended Filter Settings for Digitisation of Sonobuoy Signals
Sampling Rate (Hz)
10000
20000
Filter cut off frequency
(Hz)
4000
8000
40000
16000
50000
22500
50000
22500
Signal type and application
Bathythermograph buoy
SSQ-57A & SSQ-57B sonobuoys for
SUS runs and ambient noise
SSQ-57A & SSQ-57B sonobuoys for
ambient noise analysis
SSQ-57A & SSQ-57B sonobuoys for
DICASS analysis
DICASS, DIFAR, and STRUM
sonobuoys
Table 2 has the standard f c = 0.4 f s for all sampling rates except 50 kHz. At the
50 kHz sampling rate the filter is set to 22.5 kHz, which is 0.45 f s , this is used since
the SSQ-57A, DICASS, DIFAR, and STRUM sonobuoys already have a designed rolloff below this frequency. The SSQ-57B sonobuoy signal does not contain this roll-off,
but is filtered at the same rate for convenience. The SSQ-57B sonobuoy data should
only be used up to 20 kHz; any higher data could have aliased data in it (see
Figure 24).
2.3 Digitisation of AQH4 FM Tracks
The digitisation is done using a National Instruments PCI-MIO-16E-1, 16 channel,
1.25 MHz, 12 bit, A/D card installed in the PC and a BNC-2090 panel next to the
other BNC panels. Since there are 16 FM tracks on an AQH4 tape and only eight filter
channels, the channel numbers on the A/D card do not match the track numbers on
the AQH4 tape. The BNC panels are used to change which AQH4 track is recorded
on which digitisation channel. A 16 channel A/D card was chosen so a future update
to the anti-aliasing filter will enable all FM tracks to be digitised simultaneously.
A GUI program called NI_Card_dll was written in Visual Basic to control the A/D
card. The main window is displayed when starting the program (see Figure 5). This
has the 16 channels in a frame in the top left, the operation buttons in the top right, a
frame for the type of digitisation in the bottom right, and a progress bar and text box
in the bottom left. The text box displays the process that is occurring or that has just
occurred. At start up the text box should display either 'Calibration constants
obtained from EEPROM factory defaults' or 'Calibration constants obtained from
EEPROM self calibration' (see Figure 5). If neither of these is displayed the calibration
constants were not obtained from the A/D cards EEPROM, so any data obtained is
not calibrated and the card should be either re-calibrated or repaired.
6
DSTO-GD-0248
First, choose the channels required and the names of files in which data is to be
saved. Each channel has a tick box, which tells the program which channels you
want digitised. When a channel is chosen you can add the file name by either
clicking the '...' button or the file name display area. This will open a standard 'save
file name' window. The file name chosen will be displayed after OK is pressed (see
Figure 6).
Figure 5: NI_Card_dll.exe main form
Figure 6: Loading the file names
A tick box can be unselected, if you no longer want that channel digitised. If the file
name has already been chosen, it will be greyed out and not used (see Figure 6).
7
DSTO-GD-0248
Next, the Scan Rate should be chosen. The Scan Rate is the digitisation rate for each
channel, not the combined rate (ie. if you want 4 channels digitised at 20kHz each,
the Scan Rate is 20000, while the combined rate would be 80000). The A/D card is
only capable of handling a combined digitisation rate of 1.25 MHz, but this high
speed can quickly overflow the card buffer, so a max speed of 1.0 MHz has been set
in the program.
The A/D card can digitise only at set rates, depending on the internal clocks in the
card. These set rates have been put in the program, so if you select a rate the program
will select the closest rate possible and display it in the scan rate text box.
The Duration of the digitisation can now be set. This has set intervals that can be
used due to the buffer sizes used. If the time duration does not match the buffer
length, it will be increased to fill the last buffer.
There is a pre-digitisation amplifier in the A/D card that is set by the program. The
default setting is 5 volts, which is the normal level required for digitising SSQ-57A
sonobuoys. If a different input voltage is required, it can be set between 0.05 and 10
volts using the Voltage put down window.
The only other setting required before digitisation is the DI/SE (differential or single
ended) setting. The anti-aliasing filter used has a common earth so single ended is
used. When a number of channels are being digitised without a common earth, the
differential setting can be used, but this reduces the number of channels to eight (ref
PCI E Series User Manual, July 1997).
The settings mentioned above could be set in any order, but the Scan Rate and
Duration could change if other settings are altered.
When all the settings are correct the AQH4 tape should be positioned to start at the
section to be digitised and played. When the tape is playing the Begin Sampling
button should be pressed. This will start the A/D card going with about a
one-second delay. The GUI will be disabled except for the Cancel Sampling button
(see Figure 7).
8
DSTO-GD-0248
Figure 7: Sampling data
During sampling, the program can be stopped by pressing the Cancel Sampling
button. The sampling process requires a large amount of computer resources to save
the data when it digitises. For this reason the screen saver or other programs that
could use up computer time should be stopped. The progress bar will display how
much longer the sampling has to go. During sampling, the data is recorded in a
temporary file, with all the channels in one file.
When the sampling has finished the data needs to be unpacked from the temporary
file and into the file names selected for each channel (see Figure 8). This is done using
a dll written in C giving a major speed improvement over Visual Basic.
Figure 8: Unpacking Data
9
DSTO-GD-0248
After the data has been unpacked, it is saved into the file names displayed as 16 bit
little endian binary data. The A/D card only digitises at 12 bit, but the data files are
saved as 16 bit since this is a more commonly used format. The text box then displays
'Data Unpacked and Saved' and the files saved are displayed in green (see Figure 9).
These files can not be over written until some change is made to the settings. This
stops you accidentally pressing the Begin Sampling button, clearing the data already
obtained.
Figure 9: Data saved
2.4 Validation of Data Digitised
The digitised data is validated using Cool Edit. Cool Edit enables the data to be
viewed as a time series or spectrogram, with an ability to zoom in on specific sections
of the data. The data can also be listened to on speakers connected to the PC. These
combined features enable the data to be quickly checked.
The different types of sonobuoys have specific features, which can be used to verify
if the sonobuoy was functioning correctly. Some examples are:
• The DIFAR and DICASS sonobuoys have two tones in the recorded signal, at
7.5 kHz and 15 kHz (ref. J. Savage 1991). These can be seen on a spectrogram (see
Figure 10).
• The SSQ-36 bathythermograph returns a tone that is dependent on the
temperature in the water (see Figure 11).
• The SSQ-57 sonobuoy is omnidirectional, so the signal looks similar to white
noise (see Figure 12). The standard SSQ-57 and 20 dB attenuated SSQ-57A
sonobuoy data can have some structure, due to shrimp, fish, and shipping noise.
Listening to these sonobuoys can quickly verify if the sonobuoy is working. 40,
10
DSTO-GD-0248
•
60, and 80 dB attenuated SSQ-57A sonobuoys tend to contain mostly electrical
noise, unless there is a strong signal source in the water.
Any SUS or DICASS signals in the data can also be used verify if the sonobuoy is
working (see Figure 13).
Figure 10: Spectrogram of a DIFAR signal using Cool Edit.
11
DSTO-GD-0248
Figure 11: Spectrogram of a Bathythermograph sonobuoy, zoomed in on the frequency scale.
Figure 12: Time series of ambient noise from an SSQ-57A sonobuoy, zoomed it on the
amplitude scale.
12
DSTO-GD-0248
Figure 13: Spectrogram of a SUS charge recorded using a 40 dB attenuated SSQ-57A. Three
spikes can be seen showing the shock wave and two bubble pulses.
To calibrate the SSQ-57 sonobuoys a rooftop checker (RTC) signal is recorded onto
the AQH4 tapes and digitised using the same equipment. This signal is a 100 Hz sine
wave (see Figure 14), so is easily checked to see if it was digitised correctly.
13
DSTO-GD-0248
Figure 14: Rooftop checker signal, zoomed in on the time scale. A spectrogram would show a
dominant line at 100 Hz.
2.5 Storage of Digitised Data
Since most of the digitised data files are large, the PC has a 650 MByte CD writer and
100 MByte zip drive installed. This enables the data to be easily stored onto CD for
later processing and archiving or copied to another PC using the zip drive.
The data files produced contain 16 bit little endian binary data. The A/D card only
digitises at 12 bit, but the data files are saved as 16 bit since this is a more commonly
used format.
3. Conclusions
This set-up enables simplified digitisation of the FM tracks on AQH4 tapes, by
combining the digitisation, validation, and storage process into one PC. Also
digitising many channels at once reduces the time used to digitise the required tracks
and gives synchronous data.
Testing of the anti-aliasing filter showed that the filter was not working at the level
expected but was good enough for the settings used (see Table 2). This filter is only
an eight-channel filter, which could be upgraded to include another eight channels
enabling all 16 FM channels to be digitised simultaneously.
14
DSTO-GD-0248
The validation of the digitised data files has also improved, by using a COTS
program called Cool Edit. Cool Edit enables the data to be viewed as a time series or
spectrogram, with the ability to zoom in on segments of data and listen to it.
4. References
John E. Savage, (1991-1992), Basic Introduction to Air ASW Acoustic Systems,
Mission Avionics Technology Department, Naval Air Development Center,
Warminster, PA, USA.
PCI E Series User Manual, (July 1997), National Instruments Corporation, Austin, TX
78730 - 5039, USA. Part Number 320945C-01.
SR785 Dynamic Signal Analyser (January 1998), Operating Manual and
Programming Reference, Stanford Research Systems, Sunnyvale, California 94098,
USA.
15
DSTO-GD-0248
16
DSTO-GD-0248
Appendix.A Testing of Anti-Aliasing Filter
A.1. Experimental Set up for the Anti-Aliasing Filter Test
To test the performance of the anti aliasing filters the Stanford Research Systems SR
785 Dynamic Signal Analyser was used to generate a test signal, which was fed
through the programmable filter. The generated test signal and the filter output were
both monitored by the signal analyser, and the filter response was obtained by
process of direct comparison of the filter input and output. Figure 15 shows the
experimental set up.
SR 785
IOTech 488
Test Signal
Filter
Figure 15: Experimental set up used to test the anti-aliasing filter
The analyser was set up to perform a swept sine measurement. In this configuration,
the analyser provided a sweeping sine wave source that swept a sine wave between
specified start and stop frequencies. This swept sine signal was fed from the analyser
source output into the input of the filter. The analyser also monitored this input
signal by connecting it to the analyser Ch 1 A input. The output of the filter was
monitored by connecting it to the analyser Ch 2 A input.
The measurement process was conducted as per the swept sine measurement process
specified on pages 1-45 – 1-46 of the SR785 Dynamic Signal Analyser Operating
Manual. Table 3 specifies the start and stop frequencies used for the measurement
process, along with the specified filter cut off frequencies.
17
DSTO-GD-0248
Table 3: Settings used during the Anti-Aliasing Filter Measurement
Start
(Hz)
10
10
10
10
10
10
10
10
10
18
frequency Stop
(Hz)
10000
16000
20000
40000
40000
50000
50000
50000
50000
frequency Filter cut-off frequency
(Hz)
3000
5600
7100
14000
15000
16000
18000
20000
22500
DSTO-GD-0248
A.2.
Anti-Aliasing Filter Responses
The following figures are the results obtained from the swept sine measurements for
the configurations listed in the Table 3.
Anti-aliasing filter performance - fc = 3000 Hz
10
0
-10
-20
-30
-40
-50
-60
-70
-80
-90
0
1000
2000
3000
4000 5000 6000
Frequency (Hz)
7000
8000
9000 10000
Figure 16: Filter response for a filter cut-off frequency of 3000 Hz
Anti-aliasing filter performance - fc = 5600 Hz
10
0
-10
-20
-30
-40
-50
-60
-70
-80
-90
0
1600
3200
4800
6400 8000 9600 11200 12800 14400 16000
Frequency (Hz)
Figure 17: Filter response for a filter cut-off frequency of 5600 Hz
19
DSTO-GD-0248
Anti-aliasing filter performance - fc = 7100 Hz
10
0
-10
-20
-30
-40
-50
-60
-70
-80
-90
0
2000
4000
6000
8000 10000 12000 14000 16000 18000 20000
Frequency (Hz)
Figure 18: Filter response for a filter cut-off frequency of 7100 Hz
Anti-aliasing filter performance - fc = 14000 Hz
10
0
-10
-20
-30
-40
-50
-60
-70
-80
-90
0
4000
8000 12000 16000 20000 24000 28000 32000 36000 40000
Frequency (Hz)
Figure 19: Filter response for a filter cut-off frequency of 14000 Hz
20
DSTO-GD-0248
Anti-aliasing filter performance - fc = 15000 Hz
10
0
-10
-20
-30
-40
-50
-60
-70
-80
-90
0
4000
8000 12000 16000 20000 24000 28000 32000 36000 40000
Frequency (Hz)
Figure 20: Filter response for a filter cut-off frequency of 15000 Hz
Anti-aliasing filter performance - fc = 16000 Hz
10
0
-10
-20
-30
-40
-50
-60
-70
-80
-90
0
5000 10000 15000 20000 25000 30000 35000 40000 45000 50000
Frequency (Hz)
Figure 21: Filter response for a filter cut-off frequency of 16000 Hz
21
DSTO-GD-0248
Anti-aliasing filter performance - fc = 18000 Hz
10
0
-10
-20
-30
-40
-50
-60
-70
-80
-90
0
5000 10000 15000 20000 25000 30000 35000 40000 45000 50000
Frequency (Hz)
Figure 22: Filter response for a filter cut-off frequency of 18000 Hz
Anti-aliasing filter performance - fc = 20000 Hz
10
0
-10
-20
-30
-40
-50
-60
-70
-80
-90
0
5000 10000 15000 20000 25000 30000 35000 40000 45000 50000
Frequency (Hz)
Figure 23: Filter response for a filter cut-off frequency of 20000 Hz
22
DSTO-GD-0248
Anti-aliasing filter performance - fc = 22500 Hz
10
0
-10
-20
-30
-40
-50
-60
-70
-80
-90
0
5000 10000 15000 20000 25000 30000 35000 40000 45000 50000
Frequency (Hz)
Figure 24: Filter response for a filter cut-off frequency of 22500 Hz
23
DSTO-GD-0248
24
Page classification: UNCLASSIFIED
DEFENCE SCIENCE AND TECHNOLOGY ORGANISATION
DOCUMENT CONTROL DATA
2. TITLE
1. PRIVACY MARKING/CAVEAT
(OF DOCUMENT)
3. SECURITY CLASSIFICATION (FOR
UNCLASSIFIED REPORTS THAT ARE LIMITED
RELEASE USE (L) NEXT TO DOCUMENT
CLASSIFICATION)
Transcription Method used for P-3C AQH4 Tapes
Document
Title
Abstract
(U)
(U)
(U)
4. AUTHOR(S)
5. CORPORATE AUTHOR
Paul A. Clarke, Trevor Jackson, and Peter Wade
Aeronautical and Maritime Research Laboratory
PO Box 4331
Melbourne Vic 3001 Australia
6a. DSTO NUMBER
6b. AR NUMBER
6c. TYPE OF REPORT
DSTO-GD-0248
AR-011-524
General Document
8. FILE NUMBER
9. TASK NUMBER
10. TASK SPONSOR
11. NO. OF PAGES
9505-19-75
NAV/98/167
DNW
24
7. DOCUMENT
DATE
July 2000
12. NO. OF
REFERENCES
3
13. URL
14. RELEASE AUTHORITY
http://www.dsto.defence.gov.au/corporate/reports/DSTO-GD-0248.pdf
Chief, Maritime Operations Division
15. SECONDARY RELEASE STATEMENT OF THIS DOCUMENT
Approved for public release
OVERSEAS ENQUIRIES OUTSIDE STATED LIMITATIONS SHOULD BE REFERRED THROUGH DOCUMENT EXCHANGE, PO BOX 1500, SALISBURY, SA 5108
16. DELIBERATE ANNOUNCEMENT
No Limitations
17. CASUAL ANNOUNCEMENT
18. DEFTEST DESCRIPTORS
Yes
Data analysis, Computer programming, Data processing, Acoustic data, Sonar signal processing
19. ABSTRACT
Sonobuoy data is regularly obtained using the RAAF P-3C aircraft during DSTO trials. This data is
recorded on the aircraft using 28 track AQH4 tapes and needs to be transcribed onto CDs for storage and
analysis. The method used to transcribe analogue sonobuoy data was recently upgraded. This document
describes the equipment used and the steps involved in transcribing this data.
Page classification: UNCLASSIFIED