1
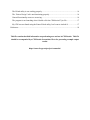
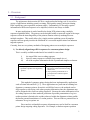
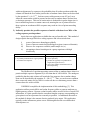
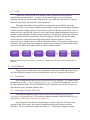
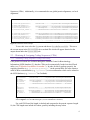
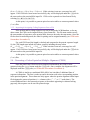
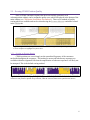
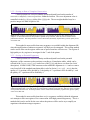
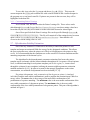
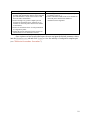
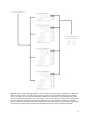
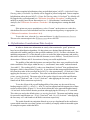
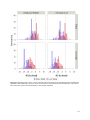
CEMAsuite Version 2 (2014) Courtney E. Lane, Michael G. Benton* * Cain Department of Chemical Engineering, Louisiana State University, Baton Rouge, LA, USA Contents 1 – Overview ................................................................................................................................... 1 1.1 – Background ........................................................................................................................ 1 1.2 – Goal .................................................................................................................................... 3 2 – User Manual .............................................................................................................................. 3 2.1 – Installation ......................................................................................................................... 3 2.2 – Importing a Protein MSA File ........................................................................................... 3 2.3 – Obtaining & Assigning Coding Sequences (CDSs) .......................................................... 4 2.3.1 – Obtaining Coding Sequences Using Fetch Utility ...................................................... 4 2.3.2 – Importing & Assigning Coding Sequences from a File .............................................. 5 2.4 – Generating a Codon-Equivalent Multiple Alignment (CEMA) ........................................ 5 2.5 – Scoring CEMA Position Quality ....................................................................................... 6 2.5.1 – Scoring on Percent Identity......................................................................................... 6 2.5.2 – Scoring on Runs of Complete Conservation ............................................................... 7 2.5.3 – Scoring on Potential Degeneracy ................................................................................ 7 2.5.4 – Scoring on Identity Runs & Potential Degeneracy ..................................................... 8 2.6 – Consensus Primer Design .................................................................................................. 8 2.6.1 – Customizing Primer3 Settings .................................................................................... 9 2.7 – Hybridization Stability Estimation .................................................................................... 9 3 – Hybridization Considerations/Data Analysis .......................................................................... 12 5 - Troubleshooting ....................................................................................................................... 16 The protein MSA file failed to load or loaded incorrectly. ...................................................... 16 The CDS file failed to load or loaded incorrectly. .................................................................... 16 The Efetch utility is not working properly................................................................................ 16 The “Primer Design” tab is not functioning properly. .............................................................. 16 General functionality errors are occurring. ............................................................................... 16 The program is not launching when I double-click the CEMAsuiteV2.jar file. ....................... 17 My CDS was not found using the Entrez Efetch utility, but I want to include it! .................... 17 References ..................................................................................................................................... 18 This file contains detailed information on performing user actions in CEMAsuite. This file should be accompanied by a CEMAsuite Screenshots file to for presenting example output results. https://sourceforge.net/projects/cemasuite/ 1 – Overview 1.1 – Background The polymerase chain reaction (PCR) is a staple molecular biology tool. It is used in a variety of applications including genetic screening, DNA quality control, molecular cloning, DNA sequencing, gene expression, and many others. Unfortunately, PCR usually requires information for the desired sequence to be amplified, which is not always available. In many applications it can be beneficial to design PCR primers using a multiple sequence alignment (MSA). The primers can be designed within a conserved region of the target sequence so that the annealing ability of the primers remains relatively unchanged across multiple templates. This usually allows for a single reaction condition across all template sequences and can greatly increase the likelihood of a successful amplification of an unknown targeted sequence. Currently, there are two primary methods of designing primers across multiple sequences: 1) Use directly aligned target DNA sequences for consensus primer design. This is a readily available method and is best suited for cases when: i) ii) iii) the target DNA is not a coding sequence there are many sequences available (large sample size, n) all of the sequence information for the experimental samples are known. Pros simple, rapid potential to produce low-degeneracy primers Cons if the sequences represent coding DNA, then codon information/reading frame is lost only 4 possible permutations for a given position in a DNA sequence (A, C, G, T) This method of consensus primer design has been implemented by applications such as PrimaClade and PriFi [1, 2]. These applications are proficient in returning lowdegeneracy consensus primers for nucleic acid MSAs; however, the methods used to align sequences risks losing vital codon grouping information since the alignments may not be designed with a focus on coding sequences. Because the codon information is lost for coding sequences in these methods, prediction of possible permutations of a given residue position is limited to the residues observed within the alignment column, unlike the known potential translations of a codon position. This can lead to a potential loss in robustness for a given primer set. Direct nucleic acid multiple sequence alignments may not be ideal for consensus primer design targeting coding sequences. For example, a random sequence position 1 within an alignment of n sequences, the probability that all residue positions within the column will match the first residue position due to random chance alone can be described by the equation: P = (4+1)(1-n). Such an event would represent a sort of Type I error where the conservation would be present, but due only to random chance and not from evolutionary pressures. This sort of conservation is undesirable in probe design since it has no influencing factors to remain conserved, meaning the use of primers based on these regions on an unknown DNA sequence may result in a loss of primer annealing ability. 2) Indirectly speculate the possible sequences of nucleic acids based on a MSA of the coding sequence protein product. Again, there are applications available that can perform this task. This method of design requires the target DNA be a coding sequence and is best suited when: i) ii) iii) iv) genes of interest are homologous globally genes of interest contain local homologous regions (conserved domains) there are few sequences available (small sample size, n) attempting to detect homologues in a group organisms with high biodiversity Pros robust 20 possible permutations for a given position in an amino acid sequence Cons usually high-degeneracy primers are produced loss in specificity products are typically less predictable in length (heterogeneous sizes) may require further conformation such as DNA sequencing The likelihood of a position appearing conserved due to random chance alone in a protein multiple sequence alignment is far less than that of a DNA MSA. The analogous probability that the entire column will match the first sequence due to random chance alone can be described by the equation: P = (20+1)(1-n). Thus, we can be more confident that a conserved amino acid in a MSA is conserved due to evolutionary pressure than a conserved nucleic acid in a MSA. CODEHOP exemplifies the implementation of this methodology [3]. This application utilizes protein MSAs and codon frequency tables to generate moderate-tohigh degeneracy primers. Because codon frequency tables are used in lieu of actual CDS information, it is quite possible that the consensus template sequence corresponding to a given primer was not represented as accurately as possible. An additional downside to this method of design is the amount of noise produced in its output. This application typically results in numerous primer sets to sift through before the user obtains their desired primer set. 2 1.2 – Goal CEMAsuite was developed in an attempt to find a compromise between the two methodologies mentioned above. Its intent is to aid in the design of a sort of minimumdegeneracy primer set which is robust enough for the assay while allowing the user to quickly balance the specificity and sensitivity of their primer set. This application addresses this problem by starting with a protein MSA, where the likelihood of “true” conservation is higher and generating a codon-equivalent multiple alignment (CEMA) using the coding sequence of each protein sequence within the protein MSA. Next, it enables the user to quickly and effectively score each position within the alignment using one of multiple scoring algorithms in order to assign a quality to each position. The Primer3[4] primer design program can then accept both the consensus sequence for this CEMA and the quality scores assigned to each position and design high-quality consensus primers. Selective degeneracy can be added by the user until the calculated stability of each primer-template pair is acceptable. This application also attempts to condense the vast amounts of information usually associated with MSAs into formats which are intuitive and discernable. Protein MSA Gather Coding Sequences Generate CEMA Score Consensus Sequence Consensus Primer Design Selectively Add Degeneracy Figure 1: CEMAsuite usage flow diagram. Alternatively, CEMAsuite can be used to quickly design primers by inspection. 2 – User Manual This program is intended for users with moderate experience in PCR and primer design. All of the following examples will be performed on the same set of sequences and primers. 2.1 – Installation Once downloaded and moved to the desired directory, the program (*.jar format) can be launched from the file ../dist/CEMAsuiteV2.jar. For proper functioning, do not move the files within this folder. It is recommended to create a shortcut to this jar file for future use, and a shortcut icon is included within the files. 2.2 – Importing a Protein MSA File Importing an alignment (clustal format) can be done by selecting FILE ►IMPORT ALIGNMENT or by pressing Ctrl+I. The resulting alignment should be displayed under PROTEIN MSA tab (see CEMAsuite Screenshots: Screenshot 1). Protein MSA files should be in clustal format as shown in Figure 2. For best results using the Fetch CDSs feature, the sequence identifiers should include proper accession identifiers. For more information, please read under 2.3 – Obtaining & Assigning Coding 3 Sequences (CDSs). Additionally, it is recommended to use global protein alignments, not local alignments. CLUSTAL O(1.1.0) multiple sequence alignment gi|399912868|gb|AFP55294.1| gi|40863|emb|CAA38872.1| gi|119454523|gb|EAW35671.1| gi|1100794|emb|CAA83241.1| gi|16330088|ref|NP_440816.1| MLDKSNLGSTPN-----------NNQPEGKASLWTA-AESANPFRQNEGLNNLNNDGNAV -----------------------------------------------------------MDSKSNLGSTQRNNNN-------NEQADQKANLWLA-AESANPFRKNERMVNPNNESNSM ----MTLDNNQELTYR-------NSQSLGQPGFSLA-VNSSNPFNHSGLNFGQNNDSKKI ----MTLNNDLPLNNIGFTGSGLNDGTEGLDDLFSSSIVDNEPLE-----ALVETPTFAS gi|399912868|gb|AFP55294.1| gi|40863|emb|CAA38872.1| gi|119454523|gb|EAW35671.1| gi|1100794|emb|CAA83241.1| gi|16330088|ref|NP_440816.1| PNEQSWSSDIVPSNAAKIKVIGVGGSGGNAINRMIDSEVSGVEFWAVNTDAQALTQSKAS -----MFEPMELTNDAVIKVIGVGGGGGNAVEHMVRERIEGVEFFAVNTDAQALRKTAVG PHEESWSTDIIPSNAAKIKVIGVGGSGGNAVNRMIESEVSGVEFWAVNTDAQALAQSKAL SVENNRIGEIVPGRVANIKVIGVGGGGGNAVNRMIESDVSGVEFWSINTDAQALTLAGAP PSPNLKRDQIVPSNIAKIKVIGVGGGGCNAVNRMIASGVTGIDFWAINTDSQALTNTNAP : . * ********.* **:::*: . : *::*:::***:*** : . Figure 2: Clustal file format example. To save this view select the FILE menu and choose SAVE ►PROTEIN MSA. This saves the current output in the PROTEIN MSA tab to an html file which will appear identical to the output shown under the PROTEIN MSA tab. 2.3 – Obtaining & Assigning Coding Sequences (CDSs) 2.3.1 – Obtaining Coding Sequences Using Fetch Utility If the protein accessions are available through the National Center for Biotechnology Information (NCBI) database [5], then the CDSs can be automatically fetched via their Efetch utility (see CEMAsuite Screenshots: Screenshot 3). In order for this to perform properly, the sequence identifiers (e.g., “gi|399912868|gb|AFP55294.1|”) in the protein MSA file must contain a valid NCBI accession number (e.g., “gi|399912868”) or accession number which can be related to the NCBI database (e.g., “AFP55294.1” for GenBank). A) gi|399912868 gi|40863 gi|119454523 gi|1100794 gi|16330088 B) AFP55294.1 CAA38872.1 EAW35671.1 CAA83241.1 NP_440816.1 MLDKSNLGSTPN-----------NNQPEGKASLWTA-AESANPFRQNEGLNNLNNDGNAV -----------------------------------------------------------MDSKSNLGSTQRNNNN-------NEQADQKANLWLA-AESANPFRKNERMVNPNNESNSM ----MTLDNNQELTYR-------NSQSLGQPGFSLA-VNSSNPFNHSGLNFGQNNDSKKI ----MTLNNDLPLNNIGFTGSGLNDGTEGLDDLFSSSIVDNEPLE-----ALVETPTFAS MLDKSNLGSTPN-----------NNQPEGKASLWTA-AESANPFRQNEGLNNLNNDGNAV -----------------------------------------------------------MDSKSNLGSTQRNNNN-------NEQADQKANLWLA-AESANPFRKNERMVNPNNESNSM ----MTLDNNQELTYR-------NSQSLGQPGFSLA-VNSSNPFNHSGLNFGQNNDSKKI ----MTLNNDLPLNNIGFTGSGLNDGTEGLDDLFSSSIVDNEPLE-----ALVETPTFAS Figure 3: Example sequence identifier formats which are accepted. Identifiers can be of the form found in Figure 2 or in A or B of this figure (or some combination of the three). For each CDS found, the length is checked and compared to the protein sequence length. So, the CDS length must include all codons, possibly including the stop codon 4 (LCDS = 3×(LProtein + 1)) or LCDS = 3×LProtein). If this criterion is not met, a message box will appear. If all CDSs have been located successfully, they will be displayed under the CDS tab in the same order as the protein MSA input file. CDSs can be exported to a fasta format file by selecting FILE ►EXPORT ►CDSS. At this point, it is possible to generate paired accession tables as comma separated values (*.csv) files. 2.3.2 – Importing & Assigning Coding Sequences from a File If the protein and/or coding sequences are not located in the NCBI database, or for any other reason, the CDSs can be imported from a fasta format file. The file must contain exactly the same number of sequences as the protein MSA, however the order does not matter. Once the file has been located and parsed, the order for pairing can be assigned manually (see CEMAsuite Screenshots: Screenshot 2). For each CDS found, the length is checked and compared to the protein sequence length. So, the CDS length must include all codons, possibly including the stop codon (LCDS = 3×(LProtein + 1)) or LCDS = 3×LProtein). If this criterion is not met, a message box will appear. If all CDSs have been located successfully, they will be displayed under the CDS tab in the same order as the protein MSA input file. At this point, it is possible to generate paired accession tables as comma separated values (*.csv) files. 2.4 – Generating a Codon-Equivalent Multiple Alignment (CEMA) Once the protein and CDSs have been imported and matched, the CEMA can be generated using the ALIGN button under the CEMA tab. Once complete, the alignment will be displayed under the CEMA tab (see CEMAsuite Screenshots: Screenshot 4). A CEMA is similar to a traditional DNA MSA, but it includes 2 additional lines of sequence information. The first is at the top and is the amino acid at the corresponding position in the protein alignment. These characters only appear where the protein alignment clustal input file designated a conserved position (i.e., columns with a “.”, “:”, or “*” under them). The second additional line is the consensus sequence with residues appearing in columns lacking gaps only, this sequence can be used for primer design. 5 2.5 – Scoring CEMA Position Quality Once a CEMA consensus sequence has been successfully generated, each column/position within it can be assigned a quality score which is displayed at the bottom of the main window (see CEMAsuite Screenshots: Screenshot 4). There are 4 methods of quality scoring which are available and can be selected using the SCORING METHOD combobox located in the CEMA tab. Figure 4: Region of example alignment covered within the following score examples. Regions depicted in score examples are highlighted in yellow above. 2.5.1 – Scoring on Percent Identity CEMA positions are scored simply on the normalized frequency of the consensus nucleotide throughout the sequences. This method is most useful when many sequences are available/within the alignment OR when the amplification of unknown sequences will likely not be attempted. This is the default scoring method. Figure 5: Plot of quality from highlighted region of Figure 4 scored using the Percent Identity method. The CDS residue for each position is printed on top of the bar, while the conserved amino acid is printed below the bars. 6 2.5.2 – Scoring on Runs of Complete Conservation CEMA positions are scored on identity and then adjusted based on the number of consecutive completely conserved positions within the location. The score adjustment value is controlled via the RUN WEIGHT slider of the CEMA tab. The run weight should always be a positive integer less than or equal to 100. Figure 6: Plot of quality from highlighted region of Figure 4 scored using the Identity Runs method and a run weight of 10. The CDS residue for each position is printed on top of the bar, while the conserved amino acid is printed below the bars. Note that positions of 100% conservation (denoted by capital letters) possess quality scores of less than 100. This method is most useful when many sequences are available/within the alignment OR when the amplification of unknown sequences will likely not be attempted. This scoring method can be used to filter out the regions where runs of perfect matches will not occur. The regions of high quality are key regions to investigate for the 3’ end of the primer. 2.5.3 – Scoring on Potential Degeneracy CEMA positions are scored on identity and then adjusted based on the potential degeneracy of the consensus codon positions according to 18 translation tables, which can be selected in the TRANSLATION TABLE combo box of the CEMA tab (hover over them for a brief description). In other words, if the consensus codon within the alignment is CGT and we want to score based off of the standard translation table (codes for Serine [CGN, AGR] ~ MGN), then the quality of C’s position will be divided by 2, the quality of G’s position will be divided by 1, and the quality of T’s position will be divided by 4. Figure 7: Plot of quality from highlighted region of Figure 4 scored using the Potential Degeneracy method and the standard translation table. The CDS residue for each position is printed on top of the bar, while the conserved amino acid is printed below the bars. Note that positions of 100% conservation (denoted by capital letters) possess quality scores of less than 100. This method is most useful when there are few sequences available/within the alignment as it attempts to filter out regions of low conservation AND high potential degeneracy. This is a method which can be useful for the cases where the primers will be used to try to amplify on organisms with unknown target sequences. 7 2.5.4 – Scoring on Identity Runs & Potential Degeneracy CEMA positions are scored using each of the 3 scoring methods described above. This method can help to discover regions of high conservation (from IDENTITY RUNS) with low potential degeneracy (from POTENTIAL DEGENERACY). Figure 8: Plot of quality from highlighted region of Figure 4 scored using the Runs & Degeneracy method with a block weight of 10 and the standard translation table. The CDS residue for each position is printed on top of the bar, while the conserved amino acid is printed below the bars. Note that positions of 100% conservation (denoted by capital letters) possess quality scores of less than 100. 2.6 – Consensus Primer Design While CEMAsuite does include a compiled Primer3 executable, it should be noted that the scored plot can greatly speed up the process of primer design by inspection if desired. CEMAsuite utilizes a compiled Primer3[4] executable (v2.3.6) for primer design and for which it provides a specialized interface, the PRIMER DESIGN tab. It should be noted that the functionality of this tab is only applicable to Windows and Mac OS -based machines (possibly other UNIX-based operating systems as well, but this remains untested). If this program is run on any other type of machine, then primers can be designed using other software, or inspection. The most convenient alternative would be to use Primer3plus online and export the consensus sequence with the quality information via (see CEMAsuite Screenshots: Screenshot 5) FILE ►EXPORT ►CONSENSUS & QUALITY from CEMAsuite. If using Primer3plus, it is recommended to keep the PRIMER_MAX_NS_ACCEPTED value set to zero as the consensus sequence output will mask gaps (‘-’) as generic (‘n’) bases for input into the primer design software. For the inputs, please reference the Primer3 documentation. One notable input is the minimum end quality. Briefly, the MIN END QUALITY input will set a threshold on the minimum quality score allowed in the 3’ end of the primer. If using an alternative method of primer input, simply design the primers, then select CUSTOM under the SET combo box on either the CEMA or HYBRIDIZATION tabs to input the primers as text (see CEMAsuite Screenshots: Screenshot 4). Once primers values have been entered into the FORWARD PRIMER and REVERSE PRIMER text fields they should appear highlighted in the score plot and on the top row of the CEMA (see CEMAsuite Screenshots: Screenshot 6). Primers should be entered 5’-to-3’ and the reverse primer should be the reverse complement of the template sequence. The primer text fields on both the CEMA tab and the HYBRIDIZATION tab update automatically with each other. 8 To save this view select the FILE menu and choose SAVE► CEMA . This saves the current output in the CEMA tab to an html file with a similar format as the visualized output in the program or to a text-based cema file. If primers are present in the text areas, they will be highlighted in the html file. 2.6.1 – Customizing Primer3 Settings As of version 2.0.8, the user can alter the Primer3 settings file. These values can be edited through SETTINGS► PRIMER3► EDIT CURRENT SETTINGS once these setting values have been edited by the user, they will remain set to that value until restored or altered again. One of four specific default Primer3 settings files can be specified through SETTINGS► PRIMER3► SELECT DEFAULT SETTINGS. This file will contain all of the settings desired to return upon a call to SETTINGS► PRIMER3► RESTORE DEFAULT SETTINGS. Note that this will overwrite the current setting values as well. 2.7 – Hybridization Stability Estimation One of the key elements of CEMAsuite is the ability to anneal the primers to each template and output an estimated Gibbs free energy for the designated conditions. This allows the user to pinpoint cases where the primer set is likely to fail and improve the primers as they see fit. It is recommended that the conditions set are the actual PCR reaction conditions and the annealing temperature of the thermal cycles. The algorithm for the thermodynamic parameter estimation first locates the primertemplate region (columns) with the least mismatches throughout ALL sequences for each primer. Next, it simulates annealing for each primer-template pair in this region (i.e., iterates down through the columns for new templates) utilizing the nearest-neighbor parameter estimation methods outlined in [6-14]. In order to account for the entropic dependence on the cation concentration, two methods of adjustment have been included [12, 15]. If a primer is degenerate, each permutation of that degenerate primer is simulated individually and the most stable conformation is used to populate the mean/min/max Gibbs free energy values. The mean value is the average of the most stable conformation of all permutations of a primer annealing. The minimum value is the most stable conformation of the most stable permutation of a degenerate primer. The maximum value is the most stable conformation of the least stable permutation of a degenerate primer. This part of the algorithm is outlined in Figure 9. 9 What this algorithm does: Iterates through all combinations of regions of matching and mismatching within a primer-template pair and calculates a ΔG(T) value in order to find the most stable conformation. Iterates through every primer-template pair and performs the calculation above within the set of columns for which the primer has the least number of mismatches. Iterates the calculation above for each permutation of a degenerate primer. Adjusts the entropy parameter for the presence of cations based on 1 of 2 methods in all cases. What this algorithm does not do: Perform higher-order structural analysis (hairpins, asymmetric loops etc…). Iterate outside the bounds of the set of columns for which the primer has the least number of mismatches in the alignment. Once a primer set has been decided upon, the user can input the desired parameter values into the HYBRIDIZATION tab and click SUBMIT to view the stability of each primer-template pair (see CEMAsuite Screenshots: Screenshot 7). 10 Figure 9: Primer-template annealing algorithm. First, all possible single-degeneracy permutations of a degenerate primer are created. Next, each of these single-degeneracy primers are used to simulate annealing to the template region. The stability of each potential hybridization conformation is estimated for each single-degeneracy primer via nearest neighbor thermodynamics (see text for details). The result is a Gibbs free energy value (kcal/mol) at the specified conditions as indicated by the numbers in parentheses next to each possible conformation. Statistical analysis is then performed on the most stable conformation of each single-degeneracy primer-template hybridization and returned as the output values associated with that particular degenerate primer-template hybridization. 11 Primer-template hybridizations where an individual primer’s ΔG(T) > Individual Primer Warning value (-6 kcal mol-1 by default) will be flagged in yellow background. Primer-template hybridizations where the total ΔG(T) > Primer Set Warning value (-16 kcal mol-1 by default) will be flagged with a red background (see CEMAsuite Screenshots: Screenshot 7) as they may be unlikely to amplify based on our data analysis (see 3 – Hybridization Considerations/Data Analysis). See CEMAsuire Screenshots: Screenshot 9 for adjusting these warning threshold values. If the primer set proves unsatisfactory, select “Custom” on the primer set combo box, which allows the user to edit individual base sites to incorporate degeneracy as appropriate (see CEMAsuite Screenshots: Screenshots 8 & 9). To save this view, select the FILE menu and choose SAVE► HYBRIDIZATION OUTPUT. This saves the current output in the HYBRIDIZATION tab to a text file. 3 – Hybridization Considerations/Data Analysis In order to obtain some information on exactly what constituted a “good” primer set based on our hybridization algorithms, 94 data points were obtained through literature and subjected to the stability analysis at the specified conditions [16-19]. For these calculations, the annealing temperature (TA) of the thermal cycles was used as the input temperature and positive detection was taken as it was cited within the literature (as were failures). Overall, there were 29 observations of failures and 65 observations of strong successful amplification. The stability of the individual primers was analyzed first, these were sorted based on the relative stabilities of the oligos within the set (i.e., one deemed “more stable” and one deemed “less stable”). The resulting ΔGi(TA) values were binned into 1 kcal mol-1 bins and plotted on a histogram, which is shown below (Figure 10). It was observed that strong amplification began to fail when the weaker of the two oligos had a ΔGi(TA) value approximately −6.0 kcal mol-1 when applying the Owczarzy et al. correction. This value was then used as the default individual primer warning threshold. The mean value of the weaker oligos for successful amplifications was −9.5 (±0.7) kcal mol-1 and −5.9 (±0.7) kcal mol-1 when applying the Owczarzy et al. and SantaLucia & Hicks corrections respectively. To see the effects of the overall binding ability of the primer set, the sum of the two binding energies (ΔG(TA) = ΔGF(TA) + ΔGR(TA)) was investigated and a histogram plot of those results are shown below (Figure 11). It was observed that this value approached approximately −16 kcal mol-1 before failures became prevalent when applying the Owczarzy et al. correction. This value was used as the default primer set warning threshold. The mean sum binding energy for successful amplification was −24 (±1.2) kcal mol-1 and −16 (±1.2) kcal mol-1 when applying the Owczarzy et al. and SantaLucia & Hicks corrections respectively. The results from this investigation allowed us to set up a benchmark for the notification system which warns the user when a primer set is unlikely to amplify within its intended region of a template sequence within the MSA. 12 The results of the data analysis are presented here so that the user may make an informed decision regarding their specific primer design criterion! 13 Figure 10: Histograms of the ΔGi(TA) values from data taken from literature and calculated using the hybridization algorithm within CEMAsuite. Detection value was based off of considerations listed within literature. The colored lines on the plot represent the normal density of each sample population. 14 Figure 11: Histograms of the sum of the forward and reverse ΔG(T A) values from data taken from literature and calculated using the hybridization algorithm within CEMAsuite. Detection value was based off of considerations listed within literature. The colored lines on the plot represent the normal density of each sample population. 15 5 - Troubleshooting The protein MSA file failed to load or loaded incorrectly. The problem is likely that the file parser failed to recognize your sequence identifiers or your sequence identifiers possessed white-space. Please alter the identifiers to a 1 word form and do not include the underscore character (unless it is part of an accession). The CDS file failed to load or loaded incorrectly. The problem is likely that the file parser failed to recognize your sequence identifiers or your sequence identifiers. Ensure you have the proper fasta format for the file. The Efetch utility is not working properly. Please make sure to review 2.3.1 – Obtaining Coding Sequences Using Fetch Utility and if the problem is not/cannot be resolved, try obtaining the coding sequences manually and importing them through a file. The “Primer Design” tab is not functioning properly. The primer3 executable called by this program has only been tested on Windows and MacOS -based machines. If you are not on such a machine this functionality may be lost, but the program will default to the UNIX-based compiled binary, please see 2.6 – Consensus Primer Design for alternative methods of primer design. If you are on a MacOS-based machine and experiencing …/mac/primer3_core Permission Denied errors, you need to allow permission to execute the primer3_core file. UNIX and UNIX-like systems generally will not execute a program unless it is marked with permission to execute. To allow permissions: From your finder, go to Applications>Utilities>Terminal and type in the following: chmod u+x <Directory>/CEMAsuite Release (dist)/resources/Primer3/mac/primer3_core Alternatively, you can type in the chmod u+x command and drag and drop the file specified above. This command only changes the permissions associated with the file; it does not change the security controls associated with the entire volume. This action should only need to be performed once for that user. NOTE: this may need to be repeated for newer versions. Also, an allow permission prompt which performs this task automatically will be issued for Mac OS computers upon initialization. General functionality errors are occurring. Please ensure that ALL files have remained within the same directory and relative location as they were originally distributed. If you would like to create a shortcut to the executable, please to do to the “CEMAsuiteV2.jar” file. 16 The program is not launching when I double-click the CEMAsuiteV2.jar file. This is a popular problem for Windows 7. You can either include the path for all java programs (https://docs.oracle.com/javase/tutorial/essential/environment/paths.html) to open with a double-click or alternatively you can launch the program from the command prompt by entering the proper directory (the directory where the CEMAsuiteV2.jar file is located) and commanding the following: java -jar CEMAsuiteV2.jar My CDS was not found using the Entrez Efetch utility, but I want to include it! CDS gathering could have failed for many reasons. The most common problem is the use of a partial CDS where the CDS includes a couple of extra nucleotides. Even if this is not your problem, the easiest way around this is detailed below. 1. Load desired protein alignment, use Efetch utility to gather all CDSs possible. a. Make a note of the accessions which fail to be properly obtained. 2. Export the CDSs using FILE ►EXPORT ►CDSS and save the incomplete collection. 3. Manually gather the erred accessions and edit the CDSs manually so they reflect ONLY and EXACTLY the coding portions of the related protein sequences in the alignment. In other words, 3 nucleotides per amino acid residue with an allowance of a full stop codon. a. The use of the DNAToolkit (FILE ►DNATOOLKIT should be quite useful for this step of the process. Especially for quickly editing a sequence into the required FASTA format. 4. Insert the corrected sequences into the FASTA format file previously exported using the Efetch utility. a. Order is not extremely important, as you can match them manually during import. b. NOTE: if you want the organism taxonomic information retained and handled, ensure the taxon is enclosed in brackets in the identifier (e.g., “>XYZ00000.1 geneA [GenusB speciesC]”). 5. Import the newly completed CDS collection FASTA file. a. You may consider overwriting the previous FASTA file with the accessions in proper order (automatically assigned once paired/imported). 17 References 1. 2. 3. 4. 5. 6. 7. 8. 9. 10. 11. 12. 13. 14. 15. 16. 17. Fredslund, J., et al., PriFi: using a multiple alignment of related sequences to find primers for amplification of homologs. Nucleic Acids Research, 2005. 33(suppl 2): p. W516-W520. Gadberry, M.D., et al., Primaclade—a flexible tool to find conserved PCR primers across multiple species. Bioinformatics, 2005. 21(7): p. 1263-1264. Rose, T.M., J.G. Henikoff, and S. Henikoff, CODEHOP (COnsensus-DEgenerate Hybrid Oligonucleotide Primer) PCR primer design. Nucleic Acids Res, 2003. 31(13): p. 37636. Rozen, S. and H. Skaletsky, Primer3 on the WWW for general users and for biologist programmers. Methods in molecular biology (Clifton, N.J.), 2000. 132: p. 365-386. Geer, L.Y., et al., The NCBI BioSystems database. Nucleic Acids Res, 2010. 38(Database issue): p. D492-6. Allawi, H.T. and J. SantaLucia, Thermodynamics and NMR of Internal G·T Mismatches in DNA. Biochemistry, 1997. 36(34): p. 10581-10594. Allawi, H.T. and J. SantaLucia, Thermodynamics of internal C.T mismatches in DNA. Nucleic Acids Research, 1998. 26(11): p. 2694-2701. Allawi, H.T. and J. SantaLucia, Nearest-Neighbor Thermodynamics of Internal A·C Mismatches in DNA: Sequence Dependence and pH Effects. Biochemistry, 1998. 37(26): p. 9435-9444. Allawi, H.T. and J. SantaLucia, Nearest Neighbor Thermodynamic Parameters for Internal G·A Mismatches in DNA. Biochemistry, 1998. 37(8): p. 2170-2179. Peyret, N., et al., Nearest-Neighbor Thermodynamics and NMR of DNA Sequences with Internal A·A, C·C, G·G, and T·T Mismatches. Biochemistry, 1999. 38(12): p. 3468-3477. SantaLucia, J., A unified view of polymer, dumbbell, and oligonucleotide DNA nearestneighbor thermodynamics. Proceedings of the National Academy of Sciences, 1998. 95(4): p. 1460-1465. SantaLucia, J. and D. Hicks, THE THERMODYNAMICS OF DNA STRUCTURAL MOTIFS. Annual Review of Biophysics and Biomolecular Structure, 2004. 33(1): p. 415440. SantaLucia J Jr and P. N., Method and system for predicting nucleic acid hybridization thermodynamics and computer-readable storage medium for use therein. World Intellectual Property Organization, 2001. WO 01/94611: p. Appendix. Bommarito, S., N. Peyret, and J.S. Jr, Thermodynamic parameters for DNA sequences with dangling ends. Nucleic Acids Research, 2000. 28(9): p. 1929-1934. Owczarzy, R., et al., Predicting Stability of DNA Duplexes in Solutions Containing Magnesium and Monovalent Cations. Biochemistry, 2008. 47(19): p. 5336-5353. de Roda Husman, A.-M., et al., The use of general primers GP5 and GP6 elongated at their 3′ ends with adjacent highly conserved sequences improves human papillomavirus detection by PCR. Journal of General Virology, 1995. 76(4): p. 1057-1062. Ishii, K. and M. Fukui, Optimization of Annealing Temperature To Reduce Bias Caused by a Primer Mismatch in Multitemplate PCR. Applied and Environmental Microbiology, 2001. 67(8): p. 3753-3755. 18 18. 19. Snijders, P.J.F., et al., The Use of General Primers in the Polymerase Chain Reaction Permits the Detection of a Broad Spectrum of Human Papillomavirus Genotypes. Journal of General Virology, 1990. 71(1): p. 173-181. Yamamoto, S. and S. Harayama, PCR amplification and direct sequencing of gyrB genes with universal primers and their application to the detection and taxonomic analysis of Pseudomonas putida strains. Applied and Environmental Microbiology, 1995. 61(3): p. 1104-9. 19