1
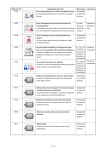
Additel/LogII Wireless Data Logging Software User Manual Additel Corporation 2013-8 Contents Chapter One: Overview......................................................................................................................... 3 1. Introduction ..............................................................................................................................3 2. System Requirements...............................................................................................................3 3. Software Installation ................................................................................................................3 Chapter Two: Functions ....................................................................................................................... 5 1. Automatic Scanning ..................................................................................................................6 2. Action Scope of Buttons ..........................................................................................................6 3. Settings .....................................................................................................................................7 4. Logging......................................................................................................................................9 5. Clear ..........................................................................................................................................9 6. Unit ...........................................................................................................................................9 7. View ....................................................................................................................................... 11 8. Data Manager ........................................................................................................................ 11 2 / 12 Chapter One: Overview 1. Introduction Additel/LogII Wireless is specially designed to collect real-time data of pressure units under test (UUT). It is a necessary software in pressure data logging. The features of Additel/LogII Wireless: It can automatically scan pressure gauges connected to the computer. Graphical interface can display the real-time pressure value and draw the curve for UUTS. Supports multiple instruments under test at the same time. To store pressure value according to the defined time. Supports data exporting in 3 formats. Multilingual user interface. 2. System Requirements Hardware Requirements CPU: Intel Pentium III (At least) Memory:1GB (At least) Hard Disk free space:2GB (At least) Hardware must has serial port Software Requirements Operating System: Windows XP/Windows 2003/Windows Vista/Windows7/Windows8 3. Software Installation First, Open the file Setup.exe to start the installation. Second, Install driver will detect whether the following components are installed in system or not. If not, they will be installed automatically; otherwise it will be skipped. 3 / 12 Windows Installer 3.1 Windows Imaging Component Microsoft .NET Framework 4 Third, The Wizard interface will appear as shown in below picture. Users can finish the installation by following this Wizard. Figure 1-1 When the installation is finished, the following icon will be shown on the desktop. As below picture 1-2. Figure 1-2 If your computer could not check out the Wireless Master, please installing the WMD970 driver for the Wireless Master which can be found in the installation CD ‘Tools\WMD970 Driver’ folder. 4 / 12 Chapter Two: Functions Start the software by double-clicking above icon, the main interface will be shown as below. Figure 2-1 The main interface consists of 5 parts: No. 1 Name Description Toolbar It includes all the functions. The list will display all the connected UUTs. It shows the 2 UUTs’ list UUTs’ information, real-time pressure value, real-time curve and main function buttons. 3 4 5 Real-time pressure This area will display the real-time pressure, max pressure, display area min pressure and average value of selected UUT. Pressure value curve display area Status bar This area shows the whole curve of selected UUT. This area shows information like prompt message and software version. 5 / 12 1. Automatic Scanning Once it starts, the software will automatically scan the connected UUTS without manual operation. And the relevant UUT information frame will be displayed in the UUTs’ list area (#2). The real-time pressure value and curve of selected UUT will be displayed separately in area #3 and #4 too. If the software cannot detect the connected UUT, please check the following items. Please check whether the WMD970 driver is installed and the Wireless Master station is connected correctly. Please check whether the UUT is turned on. Please check whether the Channel of UUT matches the software. Please make sure there is no other Wireless Master’s Channel occupied the Channel used by UUT. Please make sure there is no other software of PC occupied the serial port of instrument using. 2. Action Scope of Buttons The functions of “Log”, “Setting”, “Clear”, “Unit” and “Export” are same with the five buttons on the each frame of UUTs. And they are one to one correlate. As shown in picture 2-2. The difference is the buttons on the toolbar could control all the connected UUTs, however the buttons on each frame could only control the relevant one. 6 / 12 Figure 2-2 3. Settings Click the button on toolbar, the Settings interface appears as below. Figure 2-3 7 / 12 General Logging Interval It means the interval time between 2 stored data. Logging Duration Means the total time of the whole logging process will last. The default value will never stop the logging process, users can decide when to stop it according to requirements. Please set time before logging. Communication The default value of channel of the Wireless Master station is 1. Please change it in your mind. Format Chart Style To set the display mode of the Chart. Date Format To set the display mode of the Date. Click the button on UUT frame to enter the below window. There is another tab (Gauge Profile) in the Settings. 8 / 12 Figure 2-4 Gauge Profile Scale Reading multiplying factor (range: 0.900 to 1.100). Standard value should be 1.000. If display is 1.500, when we key-in the reading multiplying factor to 1.1. The display will change to read 1.650 (1.500 x 1.100) Reading offset value. If we offset the reading of 0.123, then all the reading will be minus 0.123 even you off the power and on again. It is different from the zeroing. Resolution Selection of Resolution. It is able to select the decimal point at which position. In the down list, you can select 5 or 6. 4. Logging Softwae will display the real-time pressure value and the real-time chart. However it has not stored these data yet, users need to click the “start all” under the “log” menu or to click the button on each frame of UUTs to start storing. When users want to stop storing data, they can click the “Stop All” under “Log” menu or buttons on each frame of UUTs. 5. Clear Users can delete the stored data by clicking button on toolbar or on each frame of UUTs. When the deleting operation is finished, it will re-start another logging task automatically. 6. Unit Users can define engineering unit by clicking button on toolbar. There is a field for users to define engineering unit by themselves. The Reference Unit can be kPa or PSI. 9 / 12 Figure 2-5 Users can change the pressure unit by clicking button on each frame of UUTs. If you want to change the current pressure unit , please select the Custom Mode. And in the Custom Mode you can finde the pressure unit which is defined by yourself. The Automatic Mode is checked in system by default. Figure 2-6 10 / 12 7. View There are 3 different kinds of view for the interface, Details, List and Classical. The default is Details, as shown in below picture 2-1. Users can switch among them as per requirements by clicking the buttons in the “view” menu. Figure 2-7 8. Data Manager Click button on the toolbar or buttons on each frame of UUTs to enter into the data managing window. This window includes the following functions. Search Users can search the stored data by setting time or inputting S/N of UUTs. Browse Users can view the details information of selected data by clicking the “Open” on toolbar or double-click it. Export The recorded data can be exported out as 3 formats, Excel workbook, XML Sheet and CSV Text File. Delete records Backup, recover or compress database. 11 / 12 Figure 2-8 12 / 12