1
To our customers,
Old Company Name in Catalogs and Other Documents
On April 1st, 2010, NEC Electronics Corporation merged with Renesas Technology
Corporation, and Renesas Electronics Corporation took over all the business of both
companies. Therefore, although the old company name remains in this document, it is a valid
Renesas Electronics document. We appreciate your understanding.
Renesas Electronics website: http://www.renesas.com
April 1st, 2010
Renesas Electronics Corporation
Issued by: Renesas Electronics Corporation (http://www.renesas.com)
Send any inquiries to http://www.renesas.com/inquiry.
Notice
1.
2.
3.
4.
5.
6.
7.
All information included in this document is current as of the date this document is issued. Such information, however, is
subject to change without any prior notice. Before purchasing or using any Renesas Electronics products listed herein, please
confirm the latest product information with a Renesas Electronics sales office. Also, please pay regular and careful attention to
additional and different information to be disclosed by Renesas Electronics such as that disclosed through our website.
Renesas Electronics does not assume any liability for infringement of patents, copyrights, or other intellectual property rights
of third parties by or arising from the use of Renesas Electronics products or technical information described in this document.
No license, express, implied or otherwise, is granted hereby under any patents, copyrights or other intellectual property rights
of Renesas Electronics or others.
You should not alter, modify, copy, or otherwise misappropriate any Renesas Electronics product, whether in whole or in part.
Descriptions of circuits, software and other related information in this document are provided only to illustrate the operation of
semiconductor products and application examples. You are fully responsible for the incorporation of these circuits, software,
and information in the design of your equipment. Renesas Electronics assumes no responsibility for any losses incurred by
you or third parties arising from the use of these circuits, software, or information.
When exporting the products or technology described in this document, you should comply with the applicable export control
laws and regulations and follow the procedures required by such laws and regulations. You should not use Renesas
Electronics products or the technology described in this document for any purpose relating to military applications or use by
the military, including but not limited to the development of weapons of mass destruction. Renesas Electronics products and
technology may not be used for or incorporated into any products or systems whose manufacture, use, or sale is prohibited
under any applicable domestic or foreign laws or regulations.
Renesas Electronics has used reasonable care in preparing the information included in this document, but Renesas Electronics
does not warrant that such information is error free. Renesas Electronics assumes no liability whatsoever for any damages
incurred by you resulting from errors in or omissions from the information included herein.
Renesas Electronics products are classified according to the following three quality grades: “Standard”, “High Quality”, and
“Specific”. The recommended applications for each Renesas Electronics product depends on the product’s quality grade, as
indicated below. You must check the quality grade of each Renesas Electronics product before using it in a particular
application. You may not use any Renesas Electronics product for any application categorized as “Specific” without the prior
written consent of Renesas Electronics. Further, you may not use any Renesas Electronics product for any application for
which it is not intended without the prior written consent of Renesas Electronics. Renesas Electronics shall not be in any way
liable for any damages or losses incurred by you or third parties arising from the use of any Renesas Electronics product for an
application categorized as “Specific” or for which the product is not intended where you have failed to obtain the prior written
consent of Renesas Electronics. The quality grade of each Renesas Electronics product is “Standard” unless otherwise
expressly specified in a Renesas Electronics data sheets or data books, etc.
“Standard”:
8.
9.
10.
11.
12.
Computers; office equipment; communications equipment; test and measurement equipment; audio and visual
equipment; home electronic appliances; machine tools; personal electronic equipment; and industrial robots.
“High Quality”: Transportation equipment (automobiles, trains, ships, etc.); traffic control systems; anti-disaster systems; anticrime systems; safety equipment; and medical equipment not specifically designed for life support.
“Specific”:
Aircraft; aerospace equipment; submersible repeaters; nuclear reactor control systems; medical equipment or
systems for life support (e.g. artificial life support devices or systems), surgical implantations, or healthcare
intervention (e.g. excision, etc.), and any other applications or purposes that pose a direct threat to human life.
You should use the Renesas Electronics products described in this document within the range specified by Renesas Electronics,
especially with respect to the maximum rating, operating supply voltage range, movement power voltage range, heat radiation
characteristics, installation and other product characteristics. Renesas Electronics shall have no liability for malfunctions or
damages arising out of the use of Renesas Electronics products beyond such specified ranges.
Although Renesas Electronics endeavors to improve the quality and reliability of its products, semiconductor products have
specific characteristics such as the occurrence of failure at a certain rate and malfunctions under certain use conditions. Further,
Renesas Electronics products are not subject to radiation resistance design. Please be sure to implement safety measures to
guard them against the possibility of physical injury, and injury or damage caused by fire in the event of the failure of a
Renesas Electronics product, such as safety design for hardware and software including but not limited to redundancy, fire
control and malfunction prevention, appropriate treatment for aging degradation or any other appropriate measures. Because
the evaluation of microcomputer software alone is very difficult, please evaluate the safety of the final products or system
manufactured by you.
Please contact a Renesas Electronics sales office for details as to environmental matters such as the environmental
compatibility of each Renesas Electronics product. Please use Renesas Electronics products in compliance with all applicable
laws and regulations that regulate the inclusion or use of controlled substances, including without limitation, the EU RoHS
Directive. Renesas Electronics assumes no liability for damages or losses occurring as a result of your noncompliance with
applicable laws and regulations.
This document may not be reproduced or duplicated, in any form, in whole or in part, without prior written consent of Renesas
Electronics.
Please contact a Renesas Electronics sales office if you have any questions regarding the information contained in this
document or Renesas Electronics products, or if you have any other inquiries.
(Note 1) “Renesas Electronics” as used in this document means Renesas Electronics Corporation and also includes its majorityowned subsidiaries.
(Note 2) “Renesas Electronics product(s)” means any product developed or manufactured by or for Renesas Electronics.
User’s Manual
SH-2A, SH-2 E200F
Emulator
User’s Manual
SH-2A, SH-2 E200F
R0E0200F1EMU00E
Renesas Microcomputer
Development Environment
System
Rev.10.00 2009.10
Rev. 10.00 Oct. 15, 2009 Page ii of xxii
REJ10J1003-1000
Notes regarding these materials
1. This document is provided for reference purposes only so that Renesas customers may select the appropriate
Renesas products for their use. Renesas neither makes warranties or representations with respect to the
accuracy or completeness of the information contained in this document nor grants any license to any
intellectual property rights or any other rights of Renesas or any third party with respect to the information in
this document.
2. Renesas shall have no liability for damages or infringement of any intellectual property or other rights arising
out of the use of any information in this document, including, but not limited to, product data, diagrams, charts,
programs, algorithms, and application circuit examples.
3. You should not use the products or the technology described in this document for the purpose of military
applications such as the development of weapons of mass destruction or for the purpose of any other military
use. When exporting the products or technology described herein, you should follow the applicable export
control laws and regulations, and procedures required by such laws and regulations.
4. All information included in this document such as product data, diagrams, charts, programs, algorithms, and
application circuit examples, is current as of the date this document is issued. Such information, however, is
subject to change without any prior notice. Before purchasing or using any Renesas products listed in this
document, please confirm the latest product information with a Renesas sales office. Also, please pay regular
and careful attention to additional and different information to be disclosed by Renesas such as that disclosed
through our website. (http://www.renesas.com )
5. Renesas has used reasonable care in compiling the information included in this document, but Renesas
assumes no liability whatsoever for any damages incurred as a result of errors or omissions in the information
included in this document.
6. When using or otherwise relying on the information in this document, you should evaluate the information in
light of the total system before deciding about the applicability of such information to the intended application.
Renesas makes no representations, warranties or guaranties regarding the suitability of its products for any
particular application and specifically disclaims any liability arising out of the application and use of the
information in this document or Renesas products.
7. With the exception of products specified by Renesas as suitable for automobile applications, Renesas
products are not designed, manufactured or tested for applications or otherwise in systems the failure or
malfunction of which may cause a direct threat to human life or create a risk of human injury or which require
especially high quality and reliability such as safety systems, or equipment or systems for transportation and
traffic, healthcare, combustion control, aerospace and aeronautics, nuclear power, or undersea communication
transmission. If you are considering the use of our products for such purposes, please contact a Renesas
sales office beforehand. Renesas shall have no liability for damages arising out of the uses set forth above.
8. Notwithstanding the preceding paragraph, you should not use Renesas products for the purposes listed below:
(1) artificial life support devices or systems
(2) surgical implantations
(3) healthcare intervention (e.g., excision, administration of medication, etc.)
(4) any other purposes that pose a direct threat to human life
Renesas shall have no liability for damages arising out of the uses set forth in the above and purchasers who
elect to use Renesas products in any of the foregoing applications shall indemnify and hold harmless Renesas
Technology Corp., its affiliated companies and their officers, directors, and employees against any and all
damages arising out of such applications.
9. You should use the products described herein within the range specified by Renesas, especially with respect
to the maximum rating, operating supply voltage range, movement power voltage range, heat radiation
characteristics, installation and other product characteristics. Renesas shall have no liability for malfunctions or
damages arising out of the use of Renesas products beyond such specified ranges.
10. Although Renesas endeavors to improve the quality and reliability of its products, IC products have specific
characteristics such as the occurrence of failure at a certain rate and malfunctions under certain use
conditions. Please be sure to implement safety measures to guard against the possibility of physical injury, and
injury or damage caused by fire in the event of the failure of a Renesas product, such as safety design for
hardware and software including but not limited to redundancy, fire control and malfunction prevention,
appropriate treatment for aging degradation or any other applicable measures. Among others, since the
evaluation of microcomputer software alone is very difficult, please evaluate the safety of the final products or
system manufactured by you.
11. In case Renesas products listed in this document are detached from the products to which the Renesas
products are attached or affixed, the risk of accident such as swallowing by infants and small children is very
high. You should implement safety measures so that Renesas products may not be easily detached from your
products. Renesas shall have no liability for damages arising out of such detachment.
12. This document may not be reproduced or duplicated, in any form, in whole or in part, without prior written
approval from Renesas.
13. Please contact a Renesas sales office if you have any questions regarding the information contained in this
document, Renesas semiconductor products, or if you have any other inquiries.
Rev. 10.00 Oct. 15, 2009 Page iii of xxii
REJ10J1003-1000
Rev. 10.00 Oct. 15, 2009 Page iv of xxii
REJ10J1003-1000
IMPORTANT INFORMATION
READ FIRST
• READ this user's manual before using this emulator product.
• KEEP the user's manual handy for future reference.
Do not attempt to use the emulator product until you fully understand its mechanism.
Emulator Product:
Throughout this document, the term "emulator product" shall be defined as the following
products produced only by Renesas Technology Corp. and Renesas Solutions Corp. excluding all
subsidiary products.
•
•
•
•
•
•
•
E200F main unit
External bus trace unit
EV-chip unit
Expansion profiling unit
Emulation memory unit
User system interface board
Trace cable
The user system or a host machine is not included in this definition.
Purpose of the Emulator Product:
This emulator product is a software and hardware development tool for systems employing the
Renesas microcomputer SH-2A, SH-2 series (hereinafter referred to as SH-2A, SH-2). This
emulator product must only be used for the above purpose.
Limited Applications:
This emulator product is not authorized for use in transportation, vehicular, medical (where
human life is potentially at stake), aerospace, nuclear, or undersea repeater applications. Buyers of
this emulator product must notify Renesas Technology Corporation, Renesas Solutions
Corporation or an authorized Renesas Technology product distributor before planning to use the
product in such applications.
Improvement Policy:
Renesas Technology Corp. (including its subsidiaries, hereafter collectively referred to as
Renesas) pursues a policy of continuing improvement in design, performance, and safety of the
emulator product. Renesas reserves the right to change, wholly or partially, the specifications,
design, user's manual, and other documentation at any time without notice.
Rev. 10.00 Oct. 15, 2009 Page v of xxii
REJ10J1003-1000
Target User of the Emulator Product:
This emulator product should only be used by those who have carefully read and thoroughly
understood the information and restrictions contained in the user's manual. Do not attempt to use
the emulator product until you fully understand its mechanism.
It is highly recommended that first-time users be instructed by users that are well versed in the
operation of the emulator product.
Users are required to be familiar with the basic knowledge for the electric circuits, logic
circuits, and microcomputers.
Precautions to be Taken when Using This Product:
1. This emulator is a development supporting unit for use in your program development and
evaluation stages. In mass-producing your program you have finished developing, be sure to
make a judgment on your own risk that it can be put to practical use by performing integration
test, evaluation, or some experiment else.
2. In no event shall Renesas Solutions Corporation be liable for any consequence arising from the
use of this emulator.
3. Renesas Solutions Corporation strives to renovate or provide a workaround for product
malfunction at some charge or without charge. However, this does not necessarily mean that
Renesas Solutions Corporation guarantees the renovation or the provision under any
circumstances.
4. This emulator has been developed by assuming its use for program development and
evaluation in laboratories. Therefore, it does not fall under the application of Electrical
Appliance and Material Safety Law and protection against electromagnetic interference when
used in Japan.
5. This emulator does not conform to safety standards such as UL or IEC. Be careful when you
take this emulator overseas.
6. Renesas cannot anticipate every possible circumstance that might involve a potential hazard.
The warnings in this user's manual and on the emulator product are therefore not all inclusive.
Therefore, you must use the emulator product safely at your own risk.
Rev. 10.00 Oct. 15, 2009 Page vi of xxii
REJ10J1003-1000
LIMITED WARRANTY
Renesas warrants its emulator products to be manufactured in
accordance with published specifications and free from defects in
material and/or workmanship. Renesas, at its option, will replace any
emulator products returned intact to the factory, transportation charges
prepaid, which Renesas, upon inspection, shall determine to be defective
in material and/or workmanship. The foregoing shall constitute the sole
remedy for any breach of Renesas’ warranty. See the Renesas warranty
booklet for details on the warranty period. This warranty extends only
to you, the original Purchaser. It is not transferable to anyone who
subsequently purchases the emulator product from you. Renesas is not
liable for any claim made by a third party or made by you for a third
party.
DISCLAIMER
RENESAS MAKES NO WARRANTIES, EITHER EXPRESS OR
IMPLIED, ORAL OR WRITTEN, EXCEPT AS PROVIDED
HEREIN, INCLUDING WITHOUT LIMITATION THEREOF,
WARRANTIES AS TO MARKETABILITY, MERCHANTABILITY,
FITNESS FOR ANY PARTICULAR PURPOSE OR USE, OR
AGAINST INFRINGEMENT OF ANY PATENT. IN NO EVENT
SHALL RENESAS BE LIABLE FOR ANY DIRECT, INCIDENTAL
OR CONSEQUENTIAL DAMAGES OF ANY NATURE, OR
LOSSES OR EXPENSES RESULTING FROM ANY DEFECTIVE
EMULATOR PRODUCT, THE USE OF ANY EMULATOR
PRODUCT, OR ITS DOCUMENTATION, EVEN IF ADVISED
OF THE POSSIBILITY OF SUCH DAMAGES. EXCEPT AS
EXPRESSLY STATED OTHERWISE IN THIS WARRANTY,
THIS EMULATOR PRODUCT IS SOLD "AS IS ", AND YOU
MUST ASSUME ALL RISK FOR THE USE AND RESULTS
OBTAINED FROM THE EMULATOR PRODUCT.
Rev. 10.00 Oct. 15, 2009 Page vii of xxii
REJ10J1003-1000
State Law:
Some states do not allow the exclusion or limitation of implied warranties or liability for
incidental or consequential damages, so the above limitation or exclusion may not apply to you.
This warranty gives you specific legal rights, and you may have other rights which may vary from
state to state.
The Warranty is Void in the Following Cases:
Renesas shall have no liability or legal responsibility for any problems caused by misuse,
abuse, misapplication, neglect, improper handling, installation, repair or modifications of the
emulator product without Renesas’ prior written consent or any problems caused by the user
system.
All Rights Reserved:
1. Circuitry and other examples described herein are meant merely to indicate the characteristics
and performance of Renesas’ semiconductor products. Renesas assumes no responsibility for
any intellectual property claims or other problems that may result from applications based on
the examples described herein.
2. No license is granted by implication or otherwise under any patents or other rights of any third
party or Renesas.
3. This user's manual and emulator product are copyrighted and all rights are reserved by
Renesas. No part of this user's manual, all or part, may be reproduced or duplicated in any
form, in hard-copy or machine-readable form, by any means available without Renesas’ prior
written consent.
Figures:
Some figures in this user's manual may show items different from your actual system.
Rev. 10.00 Oct. 15, 2009 Page viii of xxii
REJ10J1003-1000
SAFETY PAGE
READ FIRST
• READ this user's manual before using this emulator product.
• KEEP the user's manual handy for future reference.
Do not attempt to use the emulator product until you fully understand its mechanism.
DEFINITION OF SIGNAL WORDS
Either in the user's manual or on the product, several icons are used to insure proper
handling of this product and also to prevent injuries to you or other persons, or damage to
your properties. Their graphic images and meanings are given in this safety page. Be sure to
read this chapter before using the product.
This is the safety alert symbol. It is used to alert you to potential personal
injury hazards. Obey all safety messages that follow this symbol to avoid
possible injury or death.
DANGER
WARNING
CAUTION
CAUTION
DANGER indicates an imminently hazardous situation which, if not
avoided, will result in death or serious injury.
WARNING indicates a potentially hazardous situation which, if not
avoided, could result in death or serious injury.
CAUTION indicates a potentially hazardous situation which, if not
avoided, may result in minor or moderate injury.
CAUTION used without the safety alert symbol indicates a
potentially hazardous situation which, if not avoided, may result
in property damage.
NOTE emphasizes essential information.
In addition to the four above, the following are also used as appropriate.
Rev. 10.00 Oct. 15, 2009 Page ix of xxii
REJ10J1003-1000
means WARNING or CAUTION.
Example:
CAUTION AGAINST AN ELECTRIC SHOCK
means PROHIBITION.
Example:
DISASSEMBLY PROHIBITED
means A FORCIBLE ACTION.
Example:
UNPLUG THE POWER CABLE FROM THE RECEPTACLE.
Rev. 10.00 Oct. 15, 2009 Page x of xxii
REJ10J1003-1000
WARNING
Warnings for AC Power Supply:
• If
the attached AC power cable does not fit the
receptacle, do not alter the AC power cable and do not
plug it forcibly. Failure to comply may cause electric
shock and/or fire.
• Use
an AC power cable which complies with the safety
standard of the country.
• Do
not touch the plug of the AC power cable when your
hands are wet. This may cause electric shock.
• This
product is connected signal ground with frame
ground. If your developing product is transformless (not
having isolation transformer of AC power), this may cause
electric shock. Also, this may give an unrepairable
damage to this product and your developing one.
While developing, connect AC power of the product to
commercial power through isolation transformer in order
to avoid these dangers.
• If
other equipment is connected to the same branch
circuit care should be taken not to overload the circuit.
Refer to nameplate for electrical ratings.
•
When installing this equipment, insure that a reliable
ground connection is maintained.
Rev. 10.00 Oct. 15, 2009 Page xi of xxii
REJ10J1003-1000
WARNING
• If
you smell a strange odor, hear an unusual sound, or
see smoke coming from this product, then disconnect
power immediately by unplugging the AC power cable
from the outlet.
Do not use this as it is because of the danger of electric
shock and/or fire. In this case, contact your local
distributor.
• When
installing or connecting this product with other
equipment, shut down AC power or disconnect the AC
power cord from the equipment to prevent personal injury
or damage to the equipment.
Warnings to Be Taken for This Product:
•
Do not disassemble or modify this product. Personal
injury due to electric shock may occur if this product is
disassembled and modified.
• Make sure nothing falls into the cooling fan on the top
panel, especially liquids, metal objects, or anything
combustible.
Warning for Installation:
•
Do not set this product in water or areas of high
humidity. Make sure that the product does not get wet.
Spilling water or some other liquid into the product may
cause unrepairable damage.
Warning for Use Environment:
•
This equipment is to be used in an environment with a
maximum ambient temperature of 35°C. Care should be
taken that this temperature is not exceeded.
Rev. 10.00 Oct. 15, 2009 Page xii of xxii
REJ10J1003-1000
CAUTION
Cautions for AC Adapter:
• Use only the AC adapter included in this product
package.
•
The included AC adapter is for this emulator. Do not use
it for other product.
•
The DC plug on the included AC adapter has the below
polarity.
• The included AC adapter has no power supply switch.
The power is always applied to the AC adapter while
connecting the AC power cable.
Cautions to Be Taken for This Product:
•
Use caution when handling this product. Be careful not to
apply a mechanical shock.
•
Do not pull the main unit by the probe of the emulation
probe or the flexible cable which are connected to this
product. Excessive flexing or force of the flexible cable for
connecting this product to the emulation probe may break
connector.
Caution for Installation:
•
When in use do not place the emulator on its side.
Rev. 10.00 Oct. 15, 2009 Page xiii of xxii
REJ10J1003-1000
Rev. 10.00 Oct. 15, 2009 Page xiv of xxii
REJ10J1003-1000
Introduction
The High-performance Embedded Workshop is a powerful development environment for
embedded applications targeted at Renesas microcontrollers. The main features are:
• A configurable build engine that allows you to set-up compiler, assembler and linker options
via an easy to use interface.
• An integrated text editor with user customizable syntax coloring to improve code readability.
• A configurable environment to run your own tools.
• An integrated debugger which allows you to build and debug in the same application.
• Version control support.
The High-performance Embedded Workshop has been designed with two key aims; firstly to
provide you, the user, with a set of powerful development tools and, secondly, to unify and present
them in a way that is easy to use.
Rev. 10.00 Oct. 15, 2009 Page xv of xxii
REJ10J1003-1000
About This Manual
This manual describes preparation before using the emulator, emulator functions, debugging
functions specific to the emulator, tutorial, and emulator’s hardware and software specifications.
Refer to the High-performance Embedded Workshop User’s Manual for details on the information
on the basic usage of the High-performance Embedded Workshop, customization of the
environment, build functions, and debugging functions common to each High-performance
Embedded Workshop product.
This manual does not intend to explain how to write C/C++ or assembly language programs, how
to use any particular operating system or how best to tailor code for the individual devices. These
issues are left to the respective manuals.
Microsoft® and Windows® are registered trademarks of Microsoft Corporation.
Visual SourceSafe is a trademark of Microsoft Corporation.
IBM is a registered trademark of International Business Machines Corporation.
All brand or product names used in this manual are trademarks or registered trademarks of their
respective companies or organizations.
Document Conventions
This manual uses the following typographic conventions:
Table 1
Typographic Conventions
Convention
Meaning
[Menu->Menu Option]
Bold text with ‘->’ is used to indicate menu options
(for example, [File->Save As...]).
FILENAME.C
Uppercase names are used to indicate filenames.
“enter this string”
Used to indicate text that must be entered (excluding the “” quotes).
Key + Key
Used to indicate required key presses. For example, CTRL+N means
press the CTRL key and then, whilst holding the CTRL key down,
press the N key.
(The “how to” symbol)
When this symbol is used, it is always located in the left hand margin.
It indicates that the text to its immediate right is describing “how to”
do something.
Rev. 10.00 Oct. 15, 2009 Page xvi of xxii
REJ10J1003-1000
Contents
Section 1 Product Overview ................................................................................1
1.1
1.2
1.3
1.4
Components ...................................................................................................................... 4
Emulator Hardware Configuration.................................................................................... 5
Emulator Functions........................................................................................................... 20
1.3.1 Overview ............................................................................................................. 20
1.3.2 Event Detection Functions................................................................................... 23
1.3.3 Trace Functions ................................................................................................... 27
1.3.4 Break Function..................................................................................................... 29
1.3.5 Probe Function..................................................................................................... 30
1.3.6 Performance Measurement Function ................................................................... 31
1.3.7 Coverage Function............................................................................................... 34
1.3.8 Memory Access Functions................................................................................... 34
1.3.9 Stack Trace Function ........................................................................................... 36
1.3.10 User-interrupt Open Function during User Program Break ................................. 36
1.3.11 Online Help.......................................................................................................... 37
Environmental Conditions ................................................................................................ 37
Section 2 Setting Up the Emulator ......................................................................39
2.1
2.2
2.3
Flow Chart before Using the Emulator ............................................................................. 39
Installing Debugger........................................................................................................... 40
2.2.1 CD-R.................................................................................................................... 40
Connecting the Optional Units to the Emulator Main Unit Case...................................... 41
2.3.1 Connecting the E200F External Bus Trace Unit to the User System................... 41
2.3.2 Connecting the E200F Emulation Memory Unit to the Emulator Main Unit ...... 45
2.3.3 Connecting the Emulation Memory Unit to the User System.............................. 47
2.3.4 Connecting the E200F External Bus Trace Unit, Emulation Memory Unit,
and User System .................................................................................................. 48
2.3.5 Connecting the EV-chip Unit to the User System ............................................... 50
2.3.6 Connecting the E200F External Bus Trace Unit to the EV-chip Unit ................. 52
2.3.7 Connecting the E200F Emulation Memory Unit to the EV-chip Unit................. 54
2.3.8 Connecting the E200F External Bus Trace Unit, Emulation Memory Unit,
and EV-chip Unit................................................................................................. 56
2.3.9 Connecting the Probe H-UDI/AUD to the EV-chip Unit .................................... 57
2.3.10 Connecting the E200F Expansion Profiling Unit to the Main Unit Case ............ 58
2.3.11 Connecting the AC Adapter to the Emulator Main Unit Case ............................. 64
2.3.12 Connecting the Emulator to the Host Machine .................................................... 65
Rev. 10.00 Oct. 15, 2009 Page xvii of xxii
REJ10J1003-1000
2.4
2.5
Connecting the Emulator to the User System ................................................................... 67
2.4.1 Connecting the E200F H-UDI Probe to the User System.................................... 68
2.4.2 Connecting System Ground ................................................................................. 71
Changing the Settings ....................................................................................................... 72
2.5.1 Changing the Functions when Using the E200F Main Unit ................................ 73
2.5.2 Changing the Functions when Using the External Bus Trace Unit...................... 74
2.5.3 Changing the Functions when Using the Expansion Profiling Unit .................... 75
Section 3 Hardware Specifications......................................................................77
3.1
3.2
3.3
3.4
List of Specifications ........................................................................................................ 77
User System Interface Circuits ......................................................................................... 79
Reducing EMI Noise......................................................................................................... 82
Diagnostic Procedure........................................................................................................ 83
3.4.1 Installing the Diagnostic Program ....................................................................... 83
3.4.2 Executing the Diagnostic Program ...................................................................... 85
3.4.3 Creating a Log File .............................................................................................. 89
3.4.4 Updating the Diagnostic Program........................................................................ 91
Section 4 Preparations for Debugging.................................................................95
4.1
4.2
4.3
4.4
4.5
4.6
4.7
System Check ................................................................................................................... 95
Method for Activating High-performance Embedded Workshop..................................... 106
4.2.1 Creating the New Workspace (Toolchain Not Used)........................................... 107
4.2.2 Creating the New Workspace (Toolchain Used) ................................................. 111
4.2.3 Selecting an Existing Workspace......................................................................... 117
Setting at Emulator Activation.......................................................................................... 119
Debug Sessions ................................................................................................................. 121
4.4.1 Selecting a Session .............................................................................................. 121
4.4.2 Adding and Removing Sessions .......................................................................... 123
4.4.3 Saving Session Information ................................................................................. 126
Connecting the Emulator .................................................................................................. 127
Reconnecting the Emulator............................................................................................... 128
Ending the Emulator ......................................................................................................... 128
Section 5 Debugging ...........................................................................................131
5.1
Setting the Environment for Emulation ............................................................................ 131
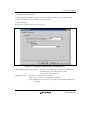
5.1.1 Opening the [Configuration] Dialog Box ............................................................ 131
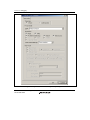
5.1.2 [General] Page ..................................................................................................... 132
5.1.3 [Main Board] Page............................................................................................... 134
5.1.4 [EVA Board] Page............................................................................................... 136
5.1.5 [Bus Board] Page................................................................................................. 137
Rev. 10.00 Oct. 15, 2009 Page xviii of xxii
REJ10J1003-1000
5.2
5.3
5.4
5.5
5.6
5.7
5.8
5.9
5.1.6 [Option Board] Page ............................................................................................ 141
5.1.7 Downloading to the Flash Memory ..................................................................... 143
5.1.8 Opening the [Memory Mapping] Dialog Box...................................................... 145
5.1.9 Changing the Memory Map Setting..................................................................... 147
5.1.10 [Multiplexed Address pins setting] Dialog Box................................................... 149
Downloading a Program ................................................................................................... 149
5.2.1 Downloading a Program ...................................................................................... 149
Viewing the Source Code ................................................................................................. 150
Viewing the Assembly-Language Code............................................................................ 155
5.4.1 Modifying the Assembly-Language Code ........................................................... 156
5.4.2 Viewing a Specific Address................................................................................. 157
5.4.3 Viewing the Current Program Counter Address .................................................. 157
Displaying Memory Contents in Realtime........................................................................ 158
5.5.1 Opening the [Monitor] Window .......................................................................... 158
5.5.2 Changing the Monitor Settings ............................................................................ 160
5.5.3 Temporarily Stopping Update of the Monitor ..................................................... 160
5.5.4 Deleting the Monitor Settings.............................................................................. 161
5.5.5 Monitoring Variables........................................................................................... 161
5.5.6 Hiding the [Monitor] Window ............................................................................. 161
5.5.7 Managing the [Monitor] Window........................................................................ 162
Viewing the Current Status............................................................................................... 163
Reading and Displaying the Emulator Information Regularly.......................................... 164
5.7.1 Opening the [Extended Monitor] Window .......................................................... 164
5.7.2 Selecting Items to be Displayed........................................................................... 165
Using the Eventpoints ....................................................................................................... 166
5.8.1 S/W Breakpoints.................................................................................................. 166
5.8.2 Eventpoints .......................................................................................................... 166
5.8.3 Opening the [Event] Window .............................................................................. 168
5.8.4 Setting S/W Breakpoints...................................................................................... 169
5.8.5 Setting Onchip Eventpoints ................................................................................. 171
5.8.6 Setting AUD Eventpoints .................................................................................... 177
5.8.7 Setting BUS Eventpoints ..................................................................................... 192
5.8.8 Setting Other Eventpoints.................................................................................... 202
5.8.9 Editing Breakpoint or Eventpoint ........................................................................ 207
5.8.10 Enabling Breakpoint or Eventpoint ..................................................................... 207
5.8.11 Disabling Breakpoint or Eventpoint .................................................................... 207
5.8.12 Deleting Breakpoint or Eventpoint ...................................................................... 207
5.8.13 Deleting All Breakpoints or Eventpoints ............................................................. 207
5.8.14 Viewing the Source Line for Breakpoints or Eventpoints ................................... 207
Viewing the Trace Information......................................................................................... 208
Rev. 10.00 Oct. 15, 2009 Page xix of xxii
REJ10J1003-1000
5.9.1 Opening the [Internal/AUD] Window ................................................................. 208
5.9.2 Opening the [BUS trace] Window....................................................................... 217
5.9.3 Acquiring External Bus Trace Information (BUS trace) ..................................... 218
5.9.4 Specifying Conditions or Modes for Acquiring Trace Information..................... 219
5.9.5 Hiding the [Trace] Column.................................................................................. 221
5.9.6 Searching for a Trace Record .............................................................................. 222
5.9.7 Clearing the Trace Information............................................................................ 229
5.9.8 Saving the Trace Information in a File ................................................................ 229
5.9.9 Viewing the [Editor] Window ............................................................................. 229
5.9.10 Trimming the Source ........................................................................................... 229
5.9.11 Temporarily Stopping Trace Acquisition ............................................................ 230
5.9.12 Restarting Trace Acquisition ............................................................................... 230
5.9.13 Extracting Records from the Acquired Information ............................................ 230
5.9.14 Analyzing Statistical Information ........................................................................ 238
5.9.15 Extracting Function Calls from the Acquired Trace Information ........................ 240
5.10 Viewing the Cache Contents............................................................................................. 241
5.10.1 Opening the [Cache] Window ............................................................................. 241
5.10.2 Modifying the Cache Contents ............................................................................ 242
5.10.3 Flushing the Cache Contents ............................................................................... 243
5.10.4 Searching the Cache Items................................................................................... 243
5.10.5 Continuing the Cache Search............................................................................... 244
5.10.6 Saving the Currently Displayed Contents............................................................ 244
5.11 Analyzing Performance .................................................................................................... 245
5.11.1 Opening the [Onchip Performance Analysis] Window ....................................... 245
5.11.2 Opening the [AUD Performance Analysis] Window........................................... 247
5.11.3 Hiding the Column .............................................................................................. 250
5.11.4 Starting Performance Data Acquisition ............................................................... 250
5.11.5 Deleting a Measurement Condition ..................................................................... 250
5.11.6 Deleting All Measurement Conditions ................................................................ 250
5.12 Viewing the Profile Information ....................................................................................... 251
5.12.1 Stack Information Files........................................................................................ 251
5.12.2 Profile Information Files...................................................................................... 253
5.12.3 Loading Stack Information Files ......................................................................... 254
5.12.4 Enabling the Profile ............................................................................................. 255
5.12.5 Specifying Measuring Mode................................................................................ 255
5.12.6 Executing the Program and Checking the Results ............................................... 255
5.12.7 [List] Sheet........................................................................................................... 256
5.12.8 [Tree] Sheet ......................................................................................................... 257
5.12.9 [Profile-Chart] Window....................................................................................... 260
5.12.10 Types and Purposes of Displayed Data................................................................ 260
Rev. 10.00 Oct. 15, 2009 Page xx of xxii
REJ10J1003-1000
5.12.11 Creating Profile Information Files ....................................................................... 261
5.12.12 Notes.................................................................................................................... 262
5.13 Viewing Realtime Profile Information.............................................................................. 264
5.13.1 Opening the [Realtime Profile] Window ............................................................. 270
5.13.2 Specifying the Measurement Range .................................................................... 271
5.13.3 Starting Measurement .......................................................................................... 272
5.13.4 Clearing Measurement Result.............................................................................. 272
5.13.5 Deleting Measurement Range.............................................................................. 272
5.13.6 Setting the Minimum Unit of the Measurement Time ......................................... 272
5.14 Using Multiple Debugging Platforms ............................................................................... 273
5.14.1 Distinguishing Two Emulators ............................................................................ 274
5.15 Acquiring Code Coverage................................................................................................. 276
5.15.1 Opening the [Code Coverage] Window............................................................... 276
5.15.2 Displaying a Source File...................................................................................... 281
5.15.3 Changing the Address to be Displayed ................................................................ 281
5.15.4 Changing the Coverage Range to be Displayed................................................... 282
5.15.5 Clearing the Coverage Information ..................................................................... 284
5.15.6 Saving the Coverage Information to a File .......................................................... 284
5.15.7 Loading Coverage Information from a File ......................................................... 285
5.15.8 Updating Coverage Information .......................................................................... 285
5.15.9 Preventing Update of Coverage Information ....................................................... 285
5.15.10 [Confirmation Request] Dialog Box .................................................................... 286
5.15.11 Displaying Code Coverage Information in the [Editor] Window ........................ 288
Section 6 Tutorial.................................................................................................289
6.1
6.2
6.3
6.4
6.5
6.6
6.7
6.8
6.9
6.10
6.11
6.12
6.13
Introduction....................................................................................................................... 289
Running the High-performance Embedded Workshop ..................................................... 290
Setting up the Emulator .................................................................................................... 290
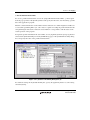
Setting the [Configuration] Dialog Box............................................................................ 291
Checking the Operation of the Target Memory for Downloading .................................... 292
Downloading the Tutorial Program .................................................................................. 294
6.6.1 Downloading the Tutorial Program ..................................................................... 294
6.6.2 Displaying the Source Program ........................................................................... 295
Setting an S/W Breakpoint................................................................................................ 296
Setting Registers ............................................................................................................... 297
Executing the Program...................................................................................................... 299
Reviewing Breakpoints..................................................................................................... 302
Referring to Symbols ........................................................................................................ 303
Viewing Memory.............................................................................................................. 304
Watching Variables........................................................................................................... 305
Rev. 10.00 Oct. 15, 2009 Page xxi of xxii
REJ10J1003-1000
6.14 Displaying Local Variables............................................................................................... 308
6.15 Stepping Through a Program ............................................................................................ 309
6.15.1 Executing [Step In] Command............................................................................. 309
6.15.2 Executing [Step Out] Command.......................................................................... 311
6.15.3 Executing [Step Over] Command........................................................................ 312
6.16 Forced Breaking of Program Executions .......................................................................... 314
6.17 Break Function.................................................................................................................. 315
6.17.1 S/W Break Function............................................................................................. 315
6.18 Break Function by an Eventpoint...................................................................................... 319
6.18.1 Setting the Break by an Onchip Eventpoint......................................................... 319
6.18.2 Setting the Sequential Onchip Eventpoint ........................................................... 324
6.19 Trace Functions................................................................................................................. 328
6.19.1 Displaying the [Internal/AUD] Window.............................................................. 330
6.19.2 Displaying the [BUS trace] Window ................................................................... 337
6.20 Stack Trace Function ........................................................................................................ 342
6.21 Download Function to the Flash Memory Area................................................................ 344
6.22 What Next? ....................................................................................................................... 349
Section 7 Troubleshooting...................................................................................351
Appendix A Menus............................................................................................353
Appendix B Command-Line Functions.............................................................357
Appendix C Notes on High-performance Embedded Workshop ...................... 359
Appendix D Repair Request Sheet ....................................................................363
Rev. 10.00 Oct. 15, 2009 Page xxii of xxii
REJ10J1003-1000
Section 1 Overview
Section 1 Product Overview
The High-performance Embedded Workshop is a graphical user interface intended to ease the
development and debugging of applications written in C/C++ programming language and
assembly language for Renesas microcomputers. Its aim is to provide a powerful yet intuitive way
of accessing, measuring, and modifying the debugging platform in which the application is
running.
The E200F emulator (hereafter referred to as the emulator) is a software and hardware
development support tool for application systems using the Renesas original microcomputer.
The emulator main unit case is connected, through the dedicated debugging interface, to the user
system. The user system can be debugged under the conditions similar to the actual application
conditions. The emulator enables debugging; the host machine for controlling the emulator must
be an IBM PC compatible machine with USB 1.1/2.0.
Rev. 10.00 Oct. 15, 2009 Page 1 of 366
REJ10J1003-1000
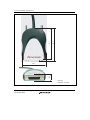
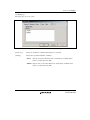
Section 1 Overview
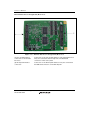
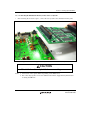
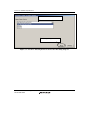
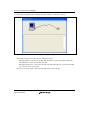
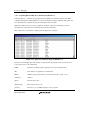
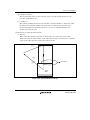
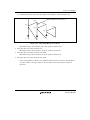
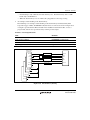
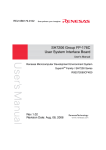
Figure 1.1 shows the system configuration using the emulator.
Figure 1.1 System Configuration with the Emulator
Note: The H-UDI is an interface compatible with the Joint Test Action Group (JTAG)
specifications.
Rev. 10.00 Oct. 15, 2009 Page 2 of 366
REJ10J1003-1000
Section 1 Overview
The emulator provides the following features:
• Various debugging functions
⎯ Various break and trace functions enable efficient debugging. Breakpoints and break
conditions can be set by the specific window, and trace information can be displayed on a
window. In addition, various emulation functions, such as performance and profiling
functions, are provided.
⎯ High-speed downloading is implemented by supporting USB 2.0.
⎯ Emulator functions can be changed by each debugging phase.
⎯ Various command-line functions can be used.
• Realtime emulation
Realtime emulation of the user system is enabled at the maximum operating frequency of the
CPU.
• Excellent operability
®
®
Using the High-performance Embedded Workshop on the Microsoft Windows 2000,
®
®
®
Microsoft Windows XP, or Windows Vista operating system enables user program
debugging using a pointing device such as a mouse. The High-performance Embedded
Workshop enables high-speed downloading of load module files.
• Debugging of the user system in the final development stage
The user system can be debugged under conditions similar to the actual application conditions.
• Compact debugging environment
When the emulator is used, a laptop computer can be used as a host machine, creating a
debugging environment in any place.
Rev. 10.00 Oct. 15, 2009 Page 3 of 366
REJ10J1003-1000
Section 1 Overview
CAUTION
READ the following warnings before using the emulator
product. Incorrect operation will damage the user system and
the emulator product. The USER PROGRAM will be LOST.
1. Check all components against the component list after unpacking the emulator.
2. Never place heavy objects on the casing.
3. Protect the emulator from excessive impacts and stresses. For details, refer to section 1.4,
Environmental Conditions.
4. When moving the host machine or user system, take care not to vibrate or damage it.
5. After connecting the cable, check that it is connected correctly. For details, refer to section 2,
Setting Up the Emulator.
6. Supply power to the connected equipment after connecting all cables. Cables must not be
connected or removed while the power is on.
1.1
Components
Check all the components after you have unpacked the box. For details on the emulator
components, refer to section 1.1 in the additional document, Supplementary Information on Using
the SHxxxx. If the components are not complete, contact Renesas sales office.
Rev. 10.00 Oct. 15, 2009 Page 4 of 366
REJ10J1003-1000
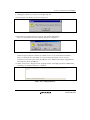
Section 1 Overview
1.2
Emulator Hardware Configuration
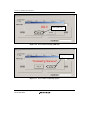
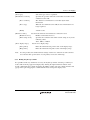
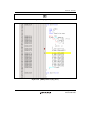
As shown in figure 1.2, the emulator consists of a main unit case, an external bus trace unit
(optional), an emulation memory unit (optional), an EV-chip unit (optional), an expansion
profiling unit (optional), a USB cable, an AC adapter, and an external probe. The emulator is
connected to the host machine via USB 2.0.
Figure 1.2 Emulator Hardware Configuration
Rev. 10.00 Oct. 15, 2009 Page 5 of 366
REJ10J1003-1000
Section 1 Overview
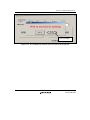
The names of sections of the emulator are explained below.
Emulator Front View:
Figure 1.3 Emulator Front View
(a) POWER LED:
Marked ‘PWR’. When this LED is lit, the emulator is supplied with
power.
(b) RUN LED:
Marked ‘RUN’. When this LED is lit, the user program is in operation.
(c) ACTION LED:
Marked ‘ACT’. When this LED is lit, the emulator is in operation.
Rev. 10.00 Oct. 15, 2009 Page 6 of 366
REJ10J1003-1000
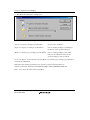
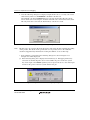
Section 1 Overview
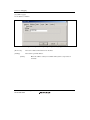
Emulator Rear-side View:
Figure 1.4 Emulator Rear-side View
(a) Power switch:
Marked ‘POWER’. Turning this switch to I (input) turns the
emulator on and O (output) turns the emulator off.
(b) DC plug:
Marked ‘DC IN’. This is a connector to input DC (+12 V) of the AC
adapter. Be sure to connect this plug to the provided AC adapter.
(c) External probe connector:
Marked ‘EXT’. This is a connector for the external probe. Be sure
to connect this connector to the provided external probe.
(d) Host-side connector (USB
connector):
Marked ‘
’. A connector (USB connector) for the host machine
is provided at the side of this mark. Be sure to connect this
connector to the provided USB cable.
Rev. 10.00 Oct. 15, 2009 Page 7 of 366
REJ10J1003-1000
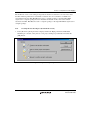
Section 1 Overview
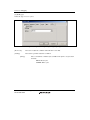
Emulator Right-side View:
Figure 1.5 Emulator Right-side View
(a) E200F logo plate:
A wine-red plate (R0E0200F1EMU00) dedicated for the emulator is
provided to be easily distinguished from other E200F main unit case.
(b) Analyzer unit connector:
Marked ‘ANALYZER I/F’. This is a connector for the analyzer unit.
Be sure to connect this connector to the dedicated analyzer cable
provided for the optional analyzer unit.
(c) External bus trace unit
connector:
Marked ‘TRACE I/F’. This is a connector for the external bus trace
unit. Be sure to connect this connector to the dedicated trace cable
provided for the optional external bus trace unit.
Rev. 10.00 Oct. 15, 2009 Page 8 of 366
REJ10J1003-1000
Section 1 Overview
Emulator Left-side View:
Figure 1.6 Emulator Left-side View
(a) Label for product
management:
The serial number, revision, and safety standard, etc. of the
emulator are written to. The contents differ depending on the time
when you purchased the product.
Rev. 10.00 Oct. 15, 2009 Page 9 of 366
REJ10J1003-1000
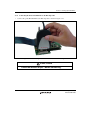
Section 1 Overview
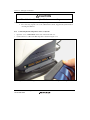
Probe H-UDI/AUD Upper View:
Figure 1.7 Probe H-UDI/AUD Upper View
(a) Screws for fastening the
probe H-UDI/AUD:
These screws fasten the user system and the probe H-UDI/AUD.
Rev. 10.00 Oct. 15, 2009 Page 10 of 366
REJ10J1003-1000
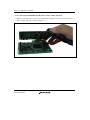
Section 1 Overview
Probe H-UDI/AUD Front View:
Figure 1.8 Probe H-UDI/AUD Front View
(a) H-UDI port connector for
user system:
This connector is used when the emulator is used as the on-chip
debugger (the same as that of the 36-pin E10A-USB).
Rev. 10.00 Oct. 15, 2009 Page 11 of 366
REJ10J1003-1000
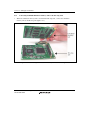
Section 1 Overview
Storing the Probe H-UDI/AUD:
Figure 1.9 Storing the Probe H-UDI/AUD
(a) Base unit for placing the
emulator vertically:
A base unit when the emulator is placed vertically. The probe HUDI/AUD can be stored when the emulator is not in use.
Rev. 10.00 Oct. 15, 2009 Page 12 of 366
REJ10J1003-1000
Section 1 Overview
EV-chip Unit (Optional) Upper View:
Figure 1.10 EV-chip Unit (Optional) Upper View
(a) External bus trace unit
connector 1:
Connectors for connecting the external bus trace unit. When only the
EV-chip is used, connect the optional trace cable.
(b) External bus trace unit
connector 2:
Connectors for connecting the external bus trace unit. When only the
EV-chip is used, these connectors are not used.
(c) Probe H-UDI/AUD
connector:
Connector for connecting the probe H-UDI/AUD.
Rev. 10.00 Oct. 15, 2009 Page 13 of 366
REJ10J1003-1000
Section 1 Overview
EV-chip Unit (Optional) Rear View:
Figure 1.11 EV-chip Unit (Optional) Rear View
(a) User system interface
connectors:
Connectors for the user system interface. They are connected to
the user system interface board that supports a package or the
dedicated connectors on the user system.
Rev. 10.00 Oct. 15, 2009 Page 14 of 366
REJ10J1003-1000
Section 1 Overview
External Bus Trace Unit (Optional) Upper View:
Figure 1.12 External Bus Trace Unit (Optional) Upper View
(a) Trace cable connectors:
Connectors for connecting the trace cable in the external bus trace
unit. Be sure to use the optional trace cable.
Rev. 10.00 Oct. 15, 2009 Page 15 of 366
REJ10J1003-1000
Section 1 Overview
External Bus Trace Unit (Optional) Rear View:
Figure 1.13 External Bus Trace Unit (Optional) Rear View
(a) User system interface
connectors for the external
bus trace:
Connectors for the user system interface of the external bus trace.
They are connected to the EV-chip unit or the dedicated
connectors on the user system.
(b) EV-chip unit interface
connectors:
Connectors for the EV-chip unit interface. They are connected to
the dedicated connectors on the EV-chip unit.
Rev. 10.00 Oct. 15, 2009 Page 16 of 366
REJ10J1003-1000
Section 1 Overview
Expansion Profiling Unit (Optional) Rear View:
Figure 1.14 Expansion Profiling Unit (Optional) Rear View
(a) Optional connectors in the
expansion profiling unit:
Connectors for the interface to connect the expansion profiling
unit and the main unit case. They are connected to the optional
connector on the main unit case.
Rev. 10.00 Oct. 15, 2009 Page 17 of 366
REJ10J1003-1000
Section 1 Overview
Emulation Memory Unit (Optional) Upper View:
Figure 1.15 Emulation Memory Unit (Optional) Upper View
(a) External bus trace unit
connector 1 [CN1]:
Connectors for connecting the external bus trace unit. When the
external bus trace unit is not used, connect the optional trace cable.
(b) External bus trace unit
connector 2 [CN4]:
Connectors for connecting the external bus trace unit. When the
external bus trace unit is not used, these connectors are not used.
Note: There are two types of emulation memory unit: R0E0200F1MSR00 (8 Mbytes) and
R0E0200F1MSR01 (16 Mbytes). In this manual, the 16-Mbyte emulation memory unit is
used for explanation.
Rev. 10.00 Oct. 15, 2009 Page 18 of 366
REJ10J1003-1000
Section 1 Overview
Emulation Memory Unit (Optional) Rear View:
Figure 1.16 Emulation Memory Unit (Optional) Rear View
(a) EV-chip unit interface
connector [CN2]:
Connectors for interfacing the EV-chip unit. They are connected to
the dedicated connectors on the EV-chip unit.
(b) User system interface
connector for the external
bus trace [CN5]:
Connectors for interfacing the user system for the external bus trace.
They are connected to the dedicated connector installed on the EVchip unit or the user system.
Rev. 10.00 Oct. 15, 2009 Page 19 of 366
REJ10J1003-1000
Section 1 Overview
1.3
Emulator Functions
This section describes the emulator functions. They differ depending on the device supported by
the emulator. For the usage of each function, refer to section 5, Debugging, or section 6, Tutorial.
1.3.1 Overview
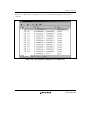
Table 1.1 gives a functional overview of the emulator.
For details on the functions of each product, refer to the online help.
Table 1.1 Emulator Functions
No.
Item
Function
1
User program execution
functions
•
Executes a program with the operating frequency within a
range guaranteed by devices.
•
Reset emulation
•
Step functions:
Single step (one step: one instruction)
Source-level step (one step: one-line source)
Step over (a break will not occur in a subroutine)
Step out (when the PC points to a location within a
subroutine, execution continues until it returns to the calling
function)
2
Reset function
•
Issues a power-on reset from the High-performance
Embedded Workshop to the device during break.
3
Event detection
functions
•
On-chip event detection function
•
AUD event detection function
•
External-bus event detection function
•
Other event detection functions
Execution time event detection
External probe event detection
•
Internal trace function at on-chip event detection
•
AUD trace function at AUD event detection
•
External bus trace function at external bus event detection
4
Trace functions
Rev. 10.00 Oct. 15, 2009 Page 20 of 366
REJ10J1003-1000
Section 1 Overview
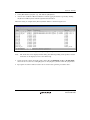
Table 1.1 Emulator Functions (cont)
No.
Item
Function
5
Break functions
•
Breaks at satisfaction of an S/W breakpoint condition
•
Breaks at on-chip event detection
•
Breaks at AUD event detection
•
Breaks at external-bus event detection
•
Breaks at other types of event detection
•
Breaks at overflow of a trace buffer
•
Forced break function
•
Uses a counter in the device to measure the number of
cycles that passes during point-to-point execution.
•
Uses an AUD event channel to measure the time or counts
of point-to-point, point-to-range, or range-to-range execution.
•
Measures the number of cycles that pass in executing
individual functions and lists them at the end of execution
from a ‘Go’ command.
•
Measures the execution time or execution counts of functions
in the address range specified by the user and lists them at
the end of execution from a ‘Go’ command.
•
Downloading to RAM
•
Downloading to flash memory
•
Single-line assembly
•
Reverse assembly (disassembly)
•
Reading of memory
•
Writing to memory
•
Automatic updating of a display of selected variables during
user program execution
•
Fill
•
Search
•
Move
•
Copy
•
Monitor (physical address)
•
Emulation memory
6
7
Performance
measurement function
Memory access functions
Rev. 10.00 Oct. 15, 2009 Page 21 of 366
REJ10J1003-1000
Section 1 Overview
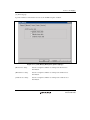
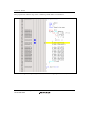
Table 1.1 Emulator Functions (cont)
No.
Item
Function
8
General/control register
access function
Read or write function of the general/control registers
9
Internal I/O register
access function
Read or write function of the internal I/O registers
10
Source-level debugging
function
Various source-level debugging functions
11
Command line function
Supports command input.
Batch processing is enabled when a file is created by arranging
commands in input order.
12
Help function
Describes the usage of each function or command syntax input
from the command line window.
The specific functions of the emulator are described in the next section.
Rev. 10.00 Oct. 15, 2009 Page 22 of 366
REJ10J1003-1000
Section 1 Overview
1.3.2 Event Detection Functions
The emulator has complex event detection functions in addition to the standard S/W breakpoints
of the High-performance Embedded Workshop.
(1) Events
In most practical debugging applications, the program or hardware errors that you are trying to
debug occur under a certain restricted set of circumstances. For example, a hardware error may
only occur after a specific area of memory has been accessed. Tracking down such problems using
simple S/W breakpoints can be very time-consuming.
With the emulator, the combination of the specified conditions such as address or data condition
can be defined as the eventpoint condition. When an eventpoint condition is satisfied, an event
will occur. The event detection function of the emulator can be used to detect a generated event
and control the operations of break, trace, and performance measurement start/end.
(2) Types of Events
The emulator has four types of events.
(a) On-chip event function (Onchip Event)
This is a function that uses an on-chip break controller and sets eventpoints according to the
information in the MCU. The eventpoints can be defined as a combination of one or more of the
following:
• Address condition
• Data condition
• Bus state condition
• Event count condition
For an operation when an event is detected, break, internal trace acquisition/acquisition
start/acquisition stop, or internal performance measurement start/end can be specified.
This function can be set in the [Onchip Event] sheet of the [Event] window.
Rev. 10.00 Oct. 15, 2009 Page 23 of 366
REJ10J1003-1000
Section 1 Overview
The emulator is used to set event conditions and the software trace in the [Onchip Event] sheet.
Table 1.2 lists the conditions of Event Condition.
Table 1.2 Types of Event Condition
Event Condition Type
Description
Address bus condition (Address)
Breaks when the MCU’s address bus value or the program
counter value matches the specified value
Data bus condition (Data)
Breaks when the MCU’s data bus value matches the
specified value. Byte, word, or longword can be specified as
the access data size.
Bus state condition
(Bus State)
There are two bus state condition settings:
Bus state condition: Breaks or acquires a trace when the
specified bus value is matched.
Read/Write condition: Breaks or acquires a trace when the
specified read/write condition is matched.
Count
Breaks when the conditions set are satisfied the specified
number of times.
Action
Selects the operation when a condition, such as setting a
break, trace, or performance start or end, is matched.
Note: The contents that can be set for the on-chip event differ depending on the product. For the
specifications of each product, refer to the additional document, Supplementary
Information on Using the SHxxxx, or the online help.
(b) AUD event function (AUD Event)
This is a function that sets eventpoints according to the information output from the AUD
interface. There are eight event detection channels. The eventpoints can be defined as a
combination of one or more of the following:
• Branch trace data condition
• Window trace data condition
• Software trace data condition
• Event count condition
• Delay condition after an event has occurred
For an operation when an event is detected, break, AUD trace acquisition/acquisition
start/acquisition stop, or AUD performance measurement start/end can be specified.
This function can be set in the [AUD Event] sheet of the [Event] window.
Rev. 10.00 Oct. 15, 2009 Page 24 of 366
REJ10J1003-1000
Section 1 Overview
Notes: 1. When a break is generated by detecting the AUD event, there is a delay of several
cycles from the time of detection to the break. If the delay from the generation of an
event to the break in the user system becomes a problem, use the on-chip event
function (Onchip event).
2. When the acquisition mode of the AUD trace is [Realtime trace], data that was not
output cannot be compared.
3. When debugging is performed without any connection to the EV-chip unit, a break
function cannot be selected in AUD event.
4. The contents that can be set for the AUD event differ depending on the product. For the
specifications of each product, refer to the online help.
[Supplementary]: AUD Function
When the AUD trace, AUD event, and AUD performance functions are used, AUD must be
enabled according to the following procedures.
• Debugging without any connection to the EV-chip unit
1. Set [AUD pin Select] on the [General] page of the [Configuration] dialog box.
2. Set [AUD clock] on the [General] page of the [Configuration] dialog box.
3. Set the AUD trace information acquisition condition for [Internal/AUD] trace.
• Debugging with a connection to the EV-chip unit
1. Set [AUD clock] on the [General] page of the [Configuration] dialog box.
2. Set the AUD trace information acquisition condition for [Internal/AUD] trace.
For the settings of the [Configuration] dialog box and [Internal/AUD] trace, refer to section 5.1,
Setting the Environment for Emulation, and section 6.19, Trace Functions.
(c) External bus event function (BUS Event)
This is a function that sets eventpoints according to the external bus of the MCU or pin
information such as an interrupt pin. There are six event detection channels. The eventpoints can
be defined as a combination of one or more of the following:
• External address bus condition
• External data bus condition
• Interrupt signal condition
• Event count condition
• Delay condition after an event has occurred
Rev. 10.00 Oct. 15, 2009 Page 25 of 366
REJ10J1003-1000
Section 1 Overview
For an operation when an event has been detected, a break or external bus trace
acquisition/acquisition start/acquisition stop can be specified.
This function can be set in the [BUS Event] sheet of the [Event] window.
Notes: 1. When a break is generated by detecting the external bus event, there is a delay of
several cycles from the time of detection to the break.
2. This function is optional; it is available after an external bus trace unit is purchased.
3. The contents that can be set for the external bus event differ depending on the product.
For the specifications of each product, refer to the online help.
(d) Other events (Other Event)
This function can be set in the [Other Event] sheet of the [Event] window.
•
Execution time event
A break occurs after the specified execution time has passed. There is one event detection
channel.
•
External probe event
There is one event detection channel. Eventpoints can be defined specifying four external
probe signals via the probe cable as the condition.
For an operation when an event has been detected, a break or AUD trace
acquisition/acquisition start/acquisition stop can be specified.
Note: There is a delay of several cycles from the time of detection to the break.
Rev. 10.00 Oct. 15, 2009 Page 26 of 366
REJ10J1003-1000
Section 1 Overview
1.3.3 Trace Functions
(1) Trace Functions
The emulator has mainly two trace functions:
• A function that acquires information outside the MCU such as the external bus by a trace
(a) Function to acquire information within the MCU by a trace
The acquired trace information is displayed in the [Internal/AUD] window.
The information to be acquired by a trace is an event that trace acquisition is selected as the
action condition in the channel on the [Onchip Event] sheet of the [Event] window. To store
such information, there are following three methods:
⎯ Function to store the information in a dedicated trace memory in the MCU
The maximum amount of information acquired by a trace that can be stored is 1024.
This function is enabled when the AUD pin is not connected to the emulator or the memory
cannot be used for tracing.
This function is hereafter called as the internal trace function or the Internal trace.
⎯ Function to output the information in realtime from the AUD pins
This is the large-capacity trace function that is useful when the AUD pins are connected to
the emulator. The emulator generates a break on the basis of the information output from
the AUD pins.
This function is hereafter called as the AUD trace function.
When a set of the branch source and branch destination instructions is one branch, the
maximum amount of information acquired by a trace is 262,144.
Note: The contents that can be acquired by a trace differ depending on the product. For
details on the specifications of each product, refer to the online help.
⎯ Software trace function
Note:
This function can be supported with SHC/C++ compiler (manufactured by
Renesas Technology Corp.; including OEM and bundle products) V7.0 or later.
When a specific instruction is executed, the PC value at execution and the contents of one
general register are acquired by trace. Describe the Trace(x) function (x is a variable
TM
name) to be compiled and linked beforehand. For details, refer to the SuperH RISC
engine C/C++ Compiler, Assembler, Optimizing Linkage Editor User’s Manual.
Rev. 10.00 Oct. 15, 2009 Page 27 of 366
REJ10J1003-1000
Section 1 Overview
When the load module is downloaded on the emulator and is executed while a software
trace function is valid, the PC value that has executed the Trace(x) function, the general
register value for x, and the source lines are displayed.
To activate the software trace function, double-click the event channel on the [AUD Event]
sheet of the [Event] window and select the [Software trace data] radio button of the
[General] page.
(b) Function to acquire information outside the MCU by a trace
The acquired trace information is displayed in the [BUS trace] window.
External Bus Trace Function (BUS trace):
This is a large-capacity trace function that is useful when the external bus pins of the MCU
are connected to the emulator. If an external memory is read from or written to, trace
information is output in realtime from the external bus pins.
The external bus trace acquisition, acquisition start, and acquisition end can be controlled
depending on the specified external-bus eventpoint condition. For setting eventpoints,
refer to section 5.8, Using the Eventpoints.
With this function, information of a maximum of 262,144 cycles can be acquired in each
bus cycle.
Notes: 1. This function is optional; it is available after an external bus trace unit is purchased.
2. The contents that can be acquired by a trace differ depending on the product. For
details on the specifications of each product, refer to the online help.
(2) Useful functions of the [Trace] window
The [Trace] window provides the following useful functions.
(a) Searches for the specified data.
(b) Extracts the specified data.
(c) Filters and displays again the specified data.
(d) Supplements the information from the branch destination address to the next branch source
address.
For the usage of those functions, refer to section 5.9, Viewing the Trace Information.
(e) Changes the trace settings during user program execution.
Trace settings can be changed during user program execution.
Rev. 10.00 Oct. 15, 2009 Page 28 of 366
REJ10J1003-1000
Section 1 Overview
1.3.4 Break Function
The emulator has the following seven break functions.
(a) S/W break function (BREAKPOINT)
Breaks the program at the specified address by replacing the dedicated instruction onto the
original instruction. This function cannot be set at a place other than RAM since a memory
write occurs.
This function can be set in the [Breakpoint] sheet of the [Event] window. It can also be set in
the [Editor] or [Disassembly] window by double-clicking on the line to be set in the [Editor]
column.
(b) On-chip event break function
Breaks when the specified event has been detected by the on-chip event detection function.
This function is available when the operation after detecting an event is set as ‘break’ in the
[Onchip Event] sheet of the [Event] window.
It can also be set in the [Editor] or [Disassembly] window by double-clicking on the line to be
set in the [Onchip event] column.
Note: On-chip event break settings can be changed during user program execution.
(c) AUD event break function
Breaks when the specified event has been detected by the AUD event detection function.
This function is available when the operation after detecting an event is set as ‘break’ in the
[AUD Event] sheet of the [Event] window.
It can also be set in the [Editor] or [Disassembly] window by double-clicking on the line to be
set in the [AUD Event] column.
(d) External bus event break function
Breaks when the specified event has been detected by the external bus event detection
function.
This function is available when the operation after detecting an event is set as ‘break’ in the
[BUS Event] sheet of the [Event] window.
It can also be set in the [Editor] or [Disassembly] window by double-clicking on the line to be
set in the [BUS Event] column.
Notes: 1. When a break is generated by detecting the external bus event, there is a delay of
several cycles from the time of detection to the break.
2. This function is optional; it is available after an external bus trace unit is purchased.
Rev. 10.00 Oct. 15, 2009 Page 29 of 366
REJ10J1003-1000
Section 1 Overview
3. The contents that can be set for the external bus event differ depending on the product.
For the specifications of each product, refer to the online help.
(e) Other event break functions
⎯ Execution time event detection function
⎯ External probe event detection function
Breaks when the specified event has been detected by other event detection functions.
This function is available when the operation after detecting an event is set as ‘break’ in the
[Other Event] sheet of the [Event] window.
(f) Trace break function generated by an overflow of the trace buffer
Breaks when the AUD trace buffer and external bus trace buffer in the emulator become full.
This function can be set in the [I-Trace/AUD-Trace acquisition] dialog box and the [BUS
acquisition] dialog box.
(g) Forced break function
Forcibly breaks the user program.
1.3.5 Probe Function
Six external probes can be placed on the emulator.
(1) Four input probes
Monitor input signals, break the user program, and start or end AUD tracing by satisfying the
specified condition. This can be set on the [Other Event] sheet of the [Event] window.
(2) One event output probe
Outputs the event signal when the event is detected. This can be set on the [Action] page of
the dialog box for setting the eventpoint.
Note: The events that can output the event signals differ depending on the product. For the
specifications of each product, refer to the online help.
(3) One GND
A probe for connecting the ground.
Rev. 10.00 Oct. 15, 2009 Page 30 of 366
REJ10J1003-1000
Section 1 Overview
1.3.6 Performance Measurement Function
The emulator has three types of performance measurement functions.
(1) On-chip Performance Analysis Function (Onchip Performance Analysis)
This function applies a counter in the device to measure the number of cycles from one
specified condition being satisfied until a next specified condition is satisfied.
Not only the number of cycles but also various items such as the number of cache misses can
be measured according to the supported devices.
Note: Items to be measured will differ depending on the product. For details on the
specifications of each product, refer to the additional document, Supplementary
Information on Using the SHxxxx, or the online help.
(a) Setting the performance measurement conditions
To set the performance measurement conditions, use the [Performance Analysis] dialog box
and the PERFORMANCE_SET command. When a channel line on the [Performance
Analysis] window is clicked with the right mouse button, the popup menu is displayed and the
[Performance Analysis] dialog box is displayed by selecting [Setting].
Note: For the command line syntax, refer to the online help.
(b) Specifying the measurement start/end conditions
To set the measurement start/end conditions, firstly, select [Ch1 to Ch2 PA] or [Ch2 to Ch1
PA] in the [Ch1, 2, 3] list of the [Combination action] dialog box that is opened by rightclicking [Combination action] on the [Event Condition] sheet of the [Event] window. Then,
specify the measurement start/end conditions for Ch1 and Ch2 of Event condition.
Notes: 1. When no measurement start/end conditions are specified, measurement is started by
executing a program and ended when a break condition is satisfied.
2.
When only the measurement start or end condition is specified, performance cannot be
measured. Be sure to specify both of the measurement start and end conditions.
3.
When the measurement start/end conditions are specified, step operation cannot be
performed.
• Measurement tolerance
⎯ The measured value includes tolerance.
⎯ Tolerance will be generated before or after a break.
Rev. 10.00 Oct. 15, 2009 Page 31 of 366
REJ10J1003-1000
Section 1 Overview
• Measurement items
Items are measured in the [Performance Analysis] dialog box for each channel from Ch1 to
Ch4. A maximum of four conditions can be specified at the same time.
Note: Items to be measured will differ depending on the product. For details on the
specifications of each product, refer to the additional document, Supplementary
Information on Using the SHxxxx, or the online help.
Each measurement condition is also counted when conditions in table 1.3 are generated.
Table 1.3 Performance Measurement Conditions to be Counted
Measurement Condition
Notes
Cache-on counting
Accessing the non-cacheable area is counted less than the actual
number of cycles and counts. Accessing the cacheable, and URAM areas is counted more than the actual number of cycles and
counts.
Branch count
The counter value is incremented by 2. This means that two cycles
are valid for one branch.
Notes: 1. In the non-realtime trace mode of the AUD trace and memory output trace, normal
counting cannot be performed because the generation state of the stall or the execution
cycle is changed.
2. Since the clock source of the counter is the CPU clock, counting also stops when the
clock halts in the sleep mode.
• Extension setting of the performance-result storing counter
The 32-bit counter stores the result of performance, and two counters can be used as a 64-bit
counter.
To set a 64-bit counter, check the [Enable] check box in the [Extend counter] group box of the
[Performance Analysis] dialog box for Ch1.
(c) Displaying the result of performance
The result of performance is displayed in the [Performance Analysis] window or the
PERFORMANCE_ANALYSIS command in hexadecimal (32 bits).
However, when the extension counter is enabled, it is displayed in hexadecimal (64 bits).
Note: If a performance counter overflows as a result of measurement, “********” will be
displayed.
Rev. 10.00 Oct. 15, 2009 Page 32 of 366
REJ10J1003-1000
Section 1 Overview
(d) Initializing the measured result
To initialize the measured result, select [Initialize] from the popup menu in the [Performance
Analysis] window or specify INIT with the PERFORMANCE_ANALYSIS command.
(2) AUD Performance Analysis Function (AUD Performance Analysis)
The emulator allows you to measure the time or count of execution between specified events in
the AUD event detection system. It is possible to set the resolution of the timer to any of the
following values:
20 ns, 100 ns, 400 ns, or 1.6 μs.
At 20 ns the maximum time that can be measured is about six hours, and at 1.6 μs the
maximum time is about 20 days.
(3) Profiling Function (Profile)
The profiling function is used to measure the performance of each function.
A function having low performance can be easily found if the statistics of the time for each
function are maintained.
Items that can be measured are the same as those for the on-chip performance measurement
function.
Notes: 1. Use of the profiling and on-chip performance analysis functions at the same time is not
possible. The [Can not use this function] error message dialog box will be displayed if
simultaneous use is attempted.
2. In this function, a break occurs whenever a branch is generated, and information is
collected to execute the user program again. Therefore, realtime emulation of the user
program will not be performed.
Rev. 10.00 Oct. 15, 2009 Page 33 of 366
REJ10J1003-1000
Section 1 Overview
(4) Realtime Profiling Function (Realtime Profile)
The performance of each function can be measured within the specified address range.
A function having low performance can be easily found if the statistics of the time for each
function are monitored.
In this function, performance information is collected without break. Therefore, realtime
emulation of the user program will be performed.
The specifiable address ranges are as follows:
•
When the expansion profiling unit is not connected: 512 kbytes to 4 Mbytes (8 blocks at
512 kbytes)
•
When the expansion profiling unit is connected: 512 kbytes to 12 Mbytes (24 blocks at
512 kbytes)
1.3.7 Coverage Function
The emulator displays the information on the executed instructions in the C/C++ and assemblylanguage levels to measure the C0 coverage.
1.3.8 Memory Access Functions
The emulator has the following memory access functions.
(1) Memory read/write function
[Memory] window: The memory contents are displayed in the window. Only the amount
specified when the [Memory] window is opened can be read. Since there is
no cache in the emulator, read cycles are always generated. If the memory is
written in the [Memory] window, read cycles in the range displayed in the
[Memory] window will occur for updating the window. When the [Memory]
window is not to be updated, change the setting in [Lock Refresh] from the
popup menu.
me command:
A command line function that reads or writes the specified amount of
memory at the specified address.
Rev. 10.00 Oct. 15, 2009 Page 34 of 366
REJ10J1003-1000
Section 1 Overview
(2) User program downloading function
A load module registered in the workspace can be downloaded. Such module can be selected
from [Download Module] in the [Debug] menu. Downloading is also possible by a popup menu
that is opened by right-clicking on the mouse at the load module in the workspace. The user
program is downloaded to the RAM or flash memory.
When downloading to the flash memory, select [Emulator] from the [Options] menu, open the
[Configuration] window, and perform required settings on the [Loading flash memory] page.
This function also downloads information required for source-level debugging such as debugging
information.
(3) Memory data uploading function
The specified amount of memory from the specified address can be saved in a file.
(4) Memory data downloading function
The memory contents saved in a file can be downloaded. Select [Load] from the popup menu in
the [Memory] window.
(5) Displaying the variable contents
The variable contents specified in the user program are displayed.
(6) Monitoring function
The emulator monitors a value in the area that has been accessed without suspending the execution
of program and displays it on the window.
(7) Emulation memory function
The emulator allocates the memory for emulation in the CS area.
Rev. 10.00 Oct. 15, 2009 Page 35 of 366
REJ10J1003-1000
Section 1 Overview
(8) Other memory operation functions
Other functions are as follows:
• Memory fill
• Memory copy
• Memory save
• Memory verify
• Memory search
• Internal I/O display
• Cache table display and edit (only for devices incorporating caches)
• Displaying label and variable names and their contents
For details, refer to the online help.
Notes: 1. Memory access during user program execution:
When a memory is accessed from the memory window, etc. during execution of the
user program, execution stops for the memory access and is then resumed. Therefore,
realtime emulation cannot be performed.
2.
Memory access during user program break:
The program can also be downloaded for the flash memory area by the emulator.
Other memory write operations are enabled for the RAM area. Therefore, an
operation such as memory write or BREAKPOINT should be set only for the RAM
area.
1.3.9 Stack Trace Function
The emulator uses the stack’s information to display the name of the calling function for a
function at the current program counter. This function can be used only when the load module
that has the Dwarf2-type debugging information is loaded.
1.3.10 User-interrupt Open Function during User Program Break
Some devices to be debugged enable all interrupts while executing emulation to the user. During a
user program break, it is possible to specify the mode whether or not the interrupt processing is
executed.
Rev. 10.00 Oct. 15, 2009 Page 36 of 366
REJ10J1003-1000
Section 1 Overview
1.3.11 Online Help
An online help explains the usage of each function or the command syntax that can be entered
from the command line window.
Select [Emulator Help] from the [Help] menu to view the emulator help.
1.4
Environmental Conditions
CAUTION
Observe the conditions listed in tables 1.4 and 1.5 when
using the emulator. Failure to do so will cause illegal
operation in the user system, the emulator product, and the
user program.
Table 1.4 Environmental Conditions
Item
Specifications
Temperature
Operating: +10°C to +35°C
Storage: –10°C to +50°C
Humidity
Operating: 35% RH to 80% RH, no condensation
Storage: 35% RH to 80% RH, no condensation
Vibration
Operating:
2.45 m/s max.
2
Storage:
4.9 m/s max.
2
Transportation: 14.7 m/s max.
Ambient gases
No corrosive gases may be present
2
Rev. 10.00 Oct. 15, 2009 Page 37 of 366
REJ10J1003-1000
Section 1 Overview
Table 1.5 lists the acceptable operating environments.
Table 1.5 Operating Environments
®
Item
Windows 2000 or
®
32-Bit Editions of Windows XP
Host computer
IBM PC or compatible machine with USB 1.1/2.0 (Full-Speed).
CPU
Pentium III (1 GHz) or higher
recommended
Pentium 4 (3 GHz), Core™ 2 Duo
(1 GHz), or higher recommended
Minimum memory
capacity
128 Mbytes or more (512 Mbytes
or more recommended; at least
10 times the size of the load
module file)
1.5 Gbyte or more recommended
(at least 10 times the size of the
load module file)
Hard-disk capacity
Installation disk capacity: 100 Mbytes or more. (Prepare an area at
least double the memory capacity (four-times or more recommended)
as the swap area.)
Pointing device such as
mouse
Connectable to the host computer; compatible with Windows 2000,
®
®
Windows XP, or Windows Vista .
Display
Monitor resolution: 1024 x 768 or higher
AC-input power supply
Voltage: AC 100 V ± 10%
Frequency: 50/60 Hz
Consumption power: 48 W
CD-ROM drive
Required to install the High-performance Embedded Workshop for the
emulator or refer to the emulator user’s manual.
®
®
®
Rev. 10.00 Oct. 15, 2009 Page 38 of 366
REJ10J1003-1000
32-Bit Editions of Windows
®
Vista
Section 2 Setting Up the Emulator
Section 2 Setting Up the Emulator
2.1
Flow Chart before Using the Emulator
Unpack the emulator and prepare it for use as follows:
WARNING
READ the reference sections shaded in figure 2.1 before
using the emulator product. Incorrect operation will damage
the user system and the emulator product. The USER
PROGRAM will be LOST.
Reference
Component list
Unpack the emulator
Check the components against the component list
Set up the emulator
- Connect the optional board
- Install the HEW
Section 2
Turn on the user system
Section 4
Setting up
the emulator
Starting the
emulator
Turn on the emulator
Start the HEW
Figure 2.1 Emulator Preparation Flow Chart
Rev. 10.00 Oct. 15, 2009 Page 39 of 366
REJ10J1003-1000
Section 2 Setting Up the Emulator
2.2
Installing Debugger
2.2.1 CD-R
The root directory of the CD-R contains a setup program for installing the emulator’s software.
The folders contain the files and programs listed below.
Table 2.1 Contents of the CD-R Directories
Directory Name
Contents
®
Description
Dlls
Microsoft runtime library
A runtime library for the High-performance
Embedded Workshop. The version is checked
at installation and this library is copied to the
hard disk as part of the installation process.
Drivers
E200F emulator driver
USB drivers for the E200F emulator.
Help
Online help for the E200F
emulator
An online help file. This is copied to the hard
disk as part of the installation process.
Manual
E200F emulator manuals
E200F emulator user’s manuals. They are
provided as PDF files.
Execute HewInstMan.exe from the root directory of the CD-R to start the installation wizard.
Follow the cues given by the installation wizard to install the software.
Note: When a driver is installed in Windows® XP, a warning message on the Windows® logo
test may be displayed, but it is not a problem. Select [Continue Anyway] to proceed with
driver installation. When executing the program under Windows Vista®, log on with
administrative rights.
Rev. 10.00 Oct. 15, 2009 Page 40 of 366
REJ10J1003-1000
Section 2 Setting Up the Emulator
2.3
Connecting the Optional Units to the Emulator Main Unit Case
Optional units are included in the emulator. This section describes how to connect the optional
units that are mainly used to the E200F main unit case.
When the external bus trace unit, EV-chip unit, or emulation memory unit is used, the trace cable
(separately purchased) is required.
The connection methods of the optional units differ depending on the supported MCU. For details,
refer to the additional document, Supplementary Information on Using the SHxxxx, for each
MCU.
2.3.1 Connecting the E200F External Bus Trace Unit to the User System
•
Open the cover of TRACE I/F on the side of the main unit case.
•
Connect the trace cable provided for the external bus trace unit to the emulator as shown in
figure 2.2.
Rev. 10.00 Oct. 15, 2009 Page 41 of 366
REJ10J1003-1000
Section 2 Setting Up the Emulator
Figure 2.2 Connecting the Trace Cable to E200F
•
Connect the external bus trace unit to the trace cable (CN1 side).
Rev. 10.00 Oct. 15, 2009 Page 42 of 366
REJ10J1003-1000
Section 2 Setting Up the Emulator
Figure 2.3 Connecting the Trace Cable to the External Bus Trace Unit
Rev. 10.00 Oct. 15, 2009 Page 43 of 366
REJ10J1003-1000
Section 2 Setting Up the Emulator
•
After checking the location of pin 1, connect the user system to the external bus trace unit.
Figure 2.4 Connecting the User System to the External Bus Trace Unit
CAUTION
Check the location of pin 1 before connecting.
Notes:
1.
Connection of the signals differs depending on the MCU used.
2.
To connect the signals to the user system, refer to the additional document,
Supplementary Information on Using the SHxxxx.
Rev. 10.00 Oct. 15, 2009 Page 44 of 366
REJ10J1003-1000
Section 2 Setting Up the Emulator
2.3.2 Connecting the E200F Emulation Memory Unit to the Emulator Main Unit
•
Open the cover of TRACE I/F on the side of the main unit case.
•
Connect the trace cable provided for the external bus trace unit to the emulator as shown in
figure 2.5.
Figure 2.5 Connecting the Trace Cable to E200F
Rev. 10.00 Oct. 15, 2009 Page 45 of 366
REJ10J1003-1000
Section 2 Setting Up the Emulator
•
Connect the emulation memory unit to the trace cable (CN1 side).
Figure 2.6 Connecting the Trace Cable to the Emulation Memory Unit
Rev. 10.00 Oct. 15, 2009 Page 46 of 366
REJ10J1003-1000
Section 2 Setting Up the Emulator
2.3.3 Connecting the Emulation Memory Unit to the User System
•
After checking the location of pin 1, connect the user system to the emulation memory unit.
Figure 2.7 Connecting the User System to the Emulation Memory Unit
CAUTION
Check the location of pin 1 before connecting.
Notes: 1. Connection of the signals differs depending on the MCU used.
2. For connecting signals, refer to the additional document, Supplementary Information
on Using the SHxxxx.
Rev. 10.00 Oct. 15, 2009 Page 47 of 366
REJ10J1003-1000
Section 2 Setting Up the Emulator
2.3.4
Connecting the E200F External Bus Trace Unit, Emulation Memory Unit, and User
System
•
When the external bus trace unit is used with the emulation memory unit, firstly connect the
external bus trace unit to the emulation memory unit (figure 2.8) and then to the user system
(figure 2.10).
Figure 2.8 Connecting the External Bus Trace Unit to the Emulation Memory Unit
Rev. 10.00 Oct. 15, 2009 Page 48 of 366
REJ10J1003-1000
Section 2 Setting Up the Emulator
•
After checking the location of pin 1, connect the external bus trace unit, emulation memory
unit, and trace cable.
Figure 2.9 Connecting the External Bus Trace Unit, Emulation Memory Unit, and Trace
Cable
•
After checking the location of pin 1, connect the external bus trace unit, emulation memory
unit, and user system.
Figure 2.10 Connecting the External Bus Trace Unit, Emulation Memory Unit, and User
System
Rev. 10.00 Oct. 15, 2009 Page 49 of 366
REJ10J1003-1000
Section 2 Setting Up the Emulator
CAUTION
Check the location of pin 1 before connecting.
Notes: 1. Connection of the signals differs depending on the MCU used.
2. For connecting signals, refer to the additional document, Supplementary Information
on Using the SHxxxx.
2.3.5 Connecting the EV-chip Unit to the User System
•
Open the cover of TRACE I/F on the side of the main unit case.
•
Connect the trace cable to the EV-chip unit as shown in figure 2.11.
Figure 2.11 Connecting the Trace Cable to E200F when Using the EV-chip Unit
Rev. 10.00 Oct. 15, 2009 Page 50 of 366
REJ10J1003-1000
Section 2 Setting Up the Emulator
•
Connect the EV-chip unit to the trace cable (CN1 side).
Figure 2.12 Connecting the Trace Cable to the EV-chip Unit
•
Install the user system interface board (separately purchased) to connect the user system.
CAUTION
Check the location of pin 1 before connecting.
Rev. 10.00 Oct. 15, 2009 Page 51 of 366
REJ10J1003-1000
Section 2 Setting Up the Emulator
2.3.6 Connecting the E200F External Bus Trace Unit to the EV-chip Unit
•
When the external bus trace unit is used with the EV-chip unit, connect the external bus trace
unit to the EV-chip unit as shown in figure 2.13.
Figure 2.13 Connecting the External Bus Trace Unit to the EV-chip Unit
Rev. 10.00 Oct. 15, 2009 Page 52 of 366
REJ10J1003-1000
Section 2 Setting Up the Emulator
•
After checking the location of pin 1, connect the user system to the external bus trace unit.
Figure 2.14 Connecting the User System to the External Bus Trace Unit
CAUTION
Check the location of pin 1 before connecting.
Rev. 10.00 Oct. 15, 2009 Page 53 of 366
REJ10J1003-1000
Section 2 Setting Up the Emulator
2.3.7
•
Connecting the E200F Emulation Memory Unit to the EV-chip Unit
When the emulation memory unit is used with the EV-chip unit, connect the emulation
memory unit to the EV-chip unit (figure 2.15).
Figure 2.15 Connecting the Emulation Memory Unit to the EV-chip Unit
Rev. 10.00 Oct. 15, 2009 Page 54 of 366
REJ10J1003-1000
Section 2 Setting Up the Emulator
•
After checking the location of pin 1, connect the EV-chip unit, emulation memory unit, and
trace cable.
Figure 2.16 Connecting the Emulation Memory Unit, EV-chip Unit, and Trace Cable
CAUTION
Check the location of pin 1 before connecting.
Rev. 10.00 Oct. 15, 2009 Page 55 of 366
REJ10J1003-1000
Section 2 Setting Up the Emulator
2.3.8 Connecting the E200F External Bus Trace Unit, Emulation Memory Unit, and EVchip Unit
•
When the external bus trace unit is used with the emulation memory unit and EV-chip unit, as
shown in figure 2.17, connect them in the positions of (a), (b), and (c) for the external bus trace
unit, emulation memory unit, and EV-chip unit, respectively.
•
After checking the location of pin 1, connect the external bus trace unit, emulation memory
unit, and EV-chip unit.
Figure 2.17 Connecting the External Bus Trace Unit, Emulation Memory Unit, and EVchip Unit
CAUTION
Check the location of pin 1 and the position of each unit
before connecting.
Rev. 10.00 Oct. 15, 2009 Page 56 of 366
REJ10J1003-1000
Section 2 Setting Up the Emulator
2.3.9 Connecting the Probe H-UDI/AUD to the EV-chip Unit
•
Connect the probe H-UDI/AUD to the EV-chip unit as shown in figure 2.18.
Figure 2.18 Connecting the Probe H-UDI/AUD to the EV-chip Unit
CAUTION
Check the location of pin 1 before connecting.
Rev. 10.00 Oct. 15, 2009 Page 57 of 366
REJ10J1003-1000
Section 2 Setting Up the Emulator
2.3.10 Connecting the E200F Expansion Profiling Unit to the Main Unit Case
•
Remove the screw for fastening the base unit.
Figure 2.19 Screw for the Base Unit for Placing the Emulator Vertically
Rev. 10.00 Oct. 15, 2009 Page 58 of 366
REJ10J1003-1000
Section 2 Setting Up the Emulator
Figure 2.20 Removing the Base Unit for Placing the Emulator Vertically
Rev. 10.00 Oct. 15, 2009 Page 59 of 366
REJ10J1003-1000
Section 2 Setting Up the Emulator
•
Remove two screws on the rear side of the main unit case.
Figure 2.21 Screws for the Main Unit Case
Rev. 10.00 Oct. 15, 2009 Page 60 of 366
REJ10J1003-1000
Section 2 Setting Up the Emulator
•
Remove the main unit case as shown in figure 2.22.
Figure 2.22 Removing the Main Unit Case
Rev. 10.00 Oct. 15, 2009 Page 61 of 366
REJ10J1003-1000
Section 2 Setting Up the Emulator
•
After checking the location of pin 1, connect the expansion profiling unit to the main unit case.
Figure 2.23 Connecting the Expansion Profiling Unit to the Main Unit Case
Rev. 10.00 Oct. 15, 2009 Page 62 of 366
REJ10J1003-1000
Section 2 Setting Up the Emulator
•
Fasten the expansion profiling unit with screws provided.
Figure 2.24 Fastening the Expansion Profiling Unit to the Main Unit Case
•
Close the cover of the main unit case to be fastened with two screws.
•
Fasten the screw of the base unit.
Rev. 10.00 Oct. 15, 2009 Page 63 of 366
REJ10J1003-1000
Section 2 Setting Up the Emulator
2.3.11 Connecting the AC Adapter to the Emulator Main Unit Case
Connect the provided AC adapter to the main unit case.
Figure 2.25 Connecting the AC Adapter to the Main Unit Case
Connect the provided AC adapter to the connector to input DC (+12 V) of the AC adapter marked
‘DC IN’.
WARNING
Be sure to use the AC adapter dedicated for E200F.
Failure to do so will result in a FIRE HAZARD and will damage
the user system or the emulator product.
Rev. 10.00 Oct. 15, 2009 Page 64 of 366
REJ10J1003-1000
Section 2 Setting Up the Emulator
2.3.12 Connecting the Emulator to the Host Machine
This section describes how to connect the emulator to the host machine. For the position of each
connector of the emulator, refer to section 1.2, Emulator Hardware Configuration.
Notes: 1. When [Add New Hardware Wizard] is displayed, select the [Search for the best driver
for your device. (Recommended)] radio button and then the [Specify a location] check
box to select the path to be searched for drivers. The location must be specified as
<Drive>:\DRIVERS. (<Drive> is the CD drive letter.)
2. When a driver is installed in Windows® XP, a warning message on the Window® logo
test may be displayed, but it is not a problem. Select [Continue Anyway] to proceed
with driver installation.
3. Be sure to install the software for the emulator before putting the emulator in place.
WARNING
Always switch OFF the emulator product and the user
system before connecting or disconnecting any CABLES
except for the USB interface cable. Failure to do so will result
in a FIRE HAZARD and will damage the user system and the
emulator product or will result in PERSONAL INJURY.
The USER PROGRAM will be LOST.
Rev. 10.00 Oct. 15, 2009 Page 65 of 366
REJ10J1003-1000
Section 2 Setting Up the Emulator
The emulator is connected to the host machine via the USB 1.1/2.0. Figure 2.26 shows the system
configuration.
Figure 2.26 System Configuration when Connecting the Emulator to the Host Machine
Rev. 10.00 Oct. 15, 2009 Page 66 of 366
REJ10J1003-1000
Section 2 Setting Up the Emulator
2.4
Connecting the Emulator to the User System
Use the procedure below to connect the emulator to the user system, or to disconnect them when
moving the emulator or the user system.
1. Check that the emulator is turned off.
2. Connect the probe H-UDI/AUD connector to the user system.
3. Fasten the probe H-UDI/AUD to the user system with the screws.
(1) The connector must be installed to the user system. Table 2.2 shows the recommended H-UDI
port connector for the emulator.
Table 2.2 Recommended Connector
Connector
Type Number
Manufacturer
Specifications
36-pin connector
DX10M-36S
Hirose Electric Co., Ltd.
Screw type
DX10M-36SE,
DX10G1M-36SE
Lock-pin type
(2) The pin assignments of the connector are shown in section 2 in the additional document,
Supplementary Information on Using the SHxxxx.
(3) Connect pins 2, 4, 6, 8, 10, 12, 14, 16, 18, 20, 22, 24, 26, 28, 30, 32, 33, 34, and 36 (when
using the 36-pin user system interface cable) of the H-UDI port connector to GND on the PCB.
These pins are used as electrical GND and to monitor the connection of the H-UDI port
connector. Note the pin assignments of the H-UDI port connector.
Rev. 10.00 Oct. 15, 2009 Page 67 of 366
REJ10J1003-1000
Section 2 Setting Up the Emulator
2.4.1 Connecting the E200F H-UDI Probe to the User System
Connect the H-UDI probe to the user system as shown in figure 2.27.
Figure 2.27 Connecting the H-UDI Probe to the User System
Rev. 10.00 Oct. 15, 2009 Page 68 of 366
REJ10J1003-1000
Section 2 Setting Up the Emulator
Fasten the user system and the H-UDI probe with screws as shown in figure 2.28.
Figure 2.28 Fastening the User System and the H-UDI Probe
CAUTION
Note that the pin number assignments of the connector
differ from those of the connector manufacturer.
Notes:
1.
Connection of the signals differs depending on the package. For details, refer to the
MCU’s pin assignments.
2.
The range of communication that the emulator operates at is different depending on
the MCU used.
3.
To connect the signals from the connector, refer to section 2 in the additional
document, Supplementary Information on Using the SHxxxx.
Rev. 10.00 Oct. 15, 2009 Page 69 of 366
REJ10J1003-1000
Section 2 Setting Up the Emulator
4.
When developing user systems, do not connect the TDI and TDO signals of the
device to the boundary scan loop, or separate them by using a switch (figure 2.29).
H-UDI
port
SHxxxx
TDI
H-UDI
TDO
JTAG
port
IC
TDI
IC
TDO TDI
TAP
IC
TDI
TDO
TAP
TDO
TAP
Boundary scan loop
User system
TDI: Test data input
TDO: Test data output
TAP: Test access port
Figure 2.29 User System Example
Rev. 10.00 Oct. 15, 2009 Page 70 of 366
REJ10J1003-1000
Section 2 Setting Up the Emulator
2.4.2 Connecting System Ground
WARNING
Separate the frame ground from the signal ground at the
user system. Failure to do so will result in a FIRE HAZARD
and will damage the user system and the emulator product or
will result in PERSONAL INJURY.
The emulator's signal ground is connected to the user system's signal ground. In the emulator, the
signal ground and frame ground are connected. In the user system, connect the frame ground only;
do not connect the signal ground to the frame ground (figure 2.30).
Signal line
Host machine
E200F main unit case
Trace unit
User system
Logic
Power
supply
Signal ground
Frame ground
GND
GND
Figure 2.30 Connecting System Ground
Rev. 10.00 Oct. 15, 2009 Page 71 of 366
REJ10J1003-1000
Section 2 Setting Up the Emulator
2.5
Changing the Settings
In the emulator, it is possible to change the emulator function flexibly depending on the user’s
request for debugging.
When the High-performance Embedded Workshop is activated and connected to the emulator, the
required functions can be selected. At this time, the following dialog box will be displayed.
Figure 2.31 [Function select] Dialog Box
The following sections describe the contents that can be selected in this dialog box.
Note: For details on each function, refer to section 1.3, Emulator Functions.
Rev. 10.00 Oct. 15, 2009 Page 72 of 366
REJ10J1003-1000
Section 2 Setting Up the Emulator
2.5.1 Changing the Functions when Using the E200F Main Unit
Select the item in the [Main board mode setting] combo box of the [Function select] dialog box.
Figure 2.32 [Function select] Dialog Box
• [RealProfile Area1 (function mode)]: Measures accumulation of execution time of each
function; the subroutine execution time is not included.
• [RealProfile Area1 (nest mode)]: Measures accumulation of execution time of each function;
the subroutine execution time is also included.
• [Coverage (4M)]: Acquires the information on the C0 coverage in the 4-Mbyte areas.
Note: Using the realtime profiling and coverage functions increases the ranges that can be set
with the expansion profiling unit.
Rev. 10.00 Oct. 15, 2009 Page 73 of 366
REJ10J1003-1000
Section 2 Setting Up the Emulator
2.5.2 Changing the Functions when Using the External Bus Trace Unit
Select the item in the [Bus board mode setting] combo box of the [Function select] dialog box.
Figure 2.33 [Function select] Dialog Box
• [Trace/break 6ch (Trace 242144 cycles)]: Uses the channel for detecting the external bus event
as a break.
• [Emulation memory (4M, Trace 8192 cycles)]: Uses the external emulation memory function
(4 Mbytes x 1 block).
Note: When the external bus trace unit is not connected to the emulator, this combo box is
displayed in gray.
Rev. 10.00 Oct. 15, 2009 Page 74 of 366
REJ10J1003-1000
Section 2 Setting Up the Emulator
2.5.3 Changing the Functions when Using the Expansion Profiling Unit
Select the item in the [Option board mode setting] combo box of the [Function select] dialog box.
Figure 2.34 [Function select] Dialog Box
• [RealProfile Area2 (function mode)]: Measures accumulation of execution time of each
function; the subroutine execution time is not included.
• [RealProfile Area2 (nest mode)]: Measures accumulation of execution time of each function;
the subroutine execution time is also included.
• [Coverage (8M)]: Acquires the information on the C0 coverage in the 8-Mbyte areas.
Note: When the expansion profiling unit is not connected to the emulator, this combo box is
displayed in gray.
Rev. 10.00 Oct. 15, 2009 Page 75 of 366
REJ10J1003-1000
Section 2 Setting Up the Emulator
Rev. 10.00 Oct. 15, 2009 Page 76 of 366
REJ10J1003-1000
Section 3 Hardware Specifications
Section 3 Hardware Specifications
3.1
List of Specifications
Table 3.1 lists the external dimensions and mass of the emulator main unit and optional units.
Figure 3.1 shows the external dimensions of the probe head of the emulator main unit.
Table 3.1 External Dimensions and Mass
No.
Item
Specification
1
External dimensions of E200F main unit case
195 x 130 x 45 (mm)
Mass of E200F main unit case
490 (g)
External dimensions of E200F external bus trace unit
90 x 125 x 15.2 (mm)
Mass of E200F external bus trace unit
83 (g)
2
3
External dimensions of E200F expansion profiling unit
98 x 115 x 15.2 (mm)
Mass of E200F expansion profiling unit
52 (g)
External dimensions of E200F EV-chip unit
110 x 125 x 15.2 (mm)
Mass of E200F EV-chip unit
110 (g)
5
External dimensions of user system interface board
60 x 90 x 26 (mm)
Mass of user system interface board
45 (g)
6
External dimensions of E200F emulation memory unit
90 x 125 x 15.2 (mm)
Mass of E200F emulation memory unit
R0E0200F1MSR00: 81 (g)
R0E0200F1MSR01: 85 (g)
4
Rev. 10.00 Oct. 15, 2009 Page 77 of 366
REJ10J1003-1000
84.7
79.7
Section 3 Hardware Specifications
22.4
84.7
Unit: mm
Tolerance: ±0.5 mm
Figure 3.1 External Dimensions of the Probe H-UDI/AUD
Rev. 10.00 Oct. 15, 2009 Page 78 of 366
REJ10J1003-1000
Section 3 Hardware Specifications
3.2
User System Interface Circuits
Figures 3.2 and 3.3 show user system interface circuits. Use them as a reference to determine the
value of the pull-up resistance.
Note: The IC with UVCC power supply operates at 3.3 V or VCC (3.3 to 5.0 V) from the H-UDI
port connector.
Rev. 10.00 Oct. 15, 2009 Page 79 of 366
REJ10J1003-1000
Section 3 Hardware Specifications
Emulator control circuit
3.3 V User connector
UVCC
10 kΩ
74AVCA16245
22 Ω
B A
74LVC2G125
Vcc
A Y
74ALVC16245
Vcc
B A
10 kΩ
22 Ω
TCK
74LVC2G125
Vcc
TRST
ASEBRKAK
A Y
74ALVC16245
Vcc
B A
TMS
10 kΩ
22 Ω
TDO
74LVC2G125
Vcc
A Y
74LVC2G125
Vcc
A Y
10 kΩ
22 Ω
TDI
74LVC2G125
Vcc
Y A
74ALVC16245
10 kΩ
Vcc
B A
22 Ω
74LVC2G125
Vcc
A Y
Figure 3.2 User System Interface Circuits (H-UDI)
Rev. 10.00 Oct. 15, 2009 Page 80 of 366
REJ10J1003-1000
RESET
Section 3 Hardware Specifications
3.3 V User connector
Emulator control circuit
UVCC
74ALVC16245
Vcc
10 kΩ
22 Ω
A B
AUDCK
74LVC2G125
Vcc
A Y
10 kΩ
74ALVC16245
Vcc
22 Ω
A B
AUDATA[3:0]
74LVC2G125
Vcc
A Y
10 kΩ
74ALVC16245
Vcc
22 Ω
A B
AUDSYNC
74LVC2G125
Vcc
A Y
10 kΩ
74ALVC16245
Vcc
22 Ω
A B
AUDMD
74LVC2G125
Vcc
A Y
10 kΩ
74ALVC16245
Vcc
22 Ω
A B
AUDRST
74LVC2G125
Vcc
A Y
Figure 3.3 User System Interface Circuits (AUD)
Rev. 10.00 Oct. 15, 2009 Page 81 of 366
REJ10J1003-1000
Section 3 Hardware Specifications
3.3
Reducing EMI Noise
To prevent EMI noise, enclose the EV-chip unit in a case at usage, as shown in figure 3.4.
The recommended material of the case is iron plated with nickel or resin internally plated with
nickel.
The case must be large enough to include the EV-chip unit, the external bus trace unit, the
emulation memory unit, the probe head, and the user system.
Figure 3.4 Countermeasure for EMI Noise
Note: EMI stands for Electrical Magnetic Interference.
Rev. 10.00 Oct. 15, 2009 Page 82 of 366
REJ10J1003-1000
Section 3 Hardware Specifications
3.4
Diagnostic Procedure
This section describes how to set up and execute the diagnostic program and output the result.
For the SH-2A, SH-2 E200F emulator, when serial numbers 0001 to 0103 are shown on the
product management seal, be sure to update the version of the diagnostic program on first
execution of that program after it has been installed. This update will be completed at one time.
For the products with serial number 0104 or later, the diagnostic program needs not be updated.
3.4.1 Installing the Diagnostic Program
(1) Opening \SOT\TM_MENU.exe
Execute TM_MENU.exe from the sot directory of the CD-R. A screen for selecting the device
shown in figure 3.5 is displayed.
(2) Selecting device series
Select the device series in use from the combo box and click the [NEXT] button.
(3) Installing the diagnostic program according to the installation wizard
An installer of the diagnostic program for the selected device series is started.
Follow the cues given by the installation wizard to install the software.
When executing the program under Windows Vista®, log on with administrator rights.
(4) Adding the device series
When several device series are added to the diagnostic program, execute TM_MENU.exe
again after the end of program installation to select new device series. At this time, select the
same folder for the installation directory as that for initial installation.
Rev. 10.00 Oct. 15, 2009 Page 83 of 366
REJ10J1003-1000
Section 3 Hardware Specifications
Select the device series in use.
Click the [NEXT] button.
Figure 3.5 Screen for Selecting the Device Series after Executing Setup.exe
Rev. 10.00 Oct. 15, 2009 Page 84 of 366
REJ10J1003-1000
Section 3 Hardware Specifications
3.4.2 Executing the Diagnostic Program
The following describes how to execute the diagnostic program.
1. Connect the emulator to the host machine.
Note: When the diagnostic program is used, do not connect the user system nor user system
interface board to the emulator.
2. Turn on the emulator.
3. Select [E200F TM] -> [E200F TM] from [Programs] in the [Start] menu.
4. The diagnostic program of the emulator is started and the initial screen (figure 3.6) is
displayed.
Select the component that has been
connected.
Select the memory capacity.
Select the target device series.
Figure 3.6 Initial Screen of the E200F System Operation Test
5. Select [COMPONENT]. The component to be selected must be connected to the emulator. The
check boxes for [COMPONENT] indicate as follows:
[Main]: Emulator main unit
[OPTION]: Expansion profiling unit
[TRC]: External bus trace unit
[EVA]: EV-chip unit
[Memory]: Emulation memory unit
Note: Do not select [TARGET] ([TARGET] is used for jigs for the shipment test).
Rev. 10.00 Oct. 15, 2009 Page 85 of 366
REJ10J1003-1000
Section 3 Hardware Specifications
6. When the EV-chip unit has been connected, select the target device series in [Select Cpu].
7. When the emulation memory unit has been connected, select the corresponding memory
capacity in [Select Memory Type]. The items for this combo box indicate the products as
follows:
[8Mbyte]: 8-Mbyte emulation memory unit
[16Mbyte]: 16-Mbyte emulation memory unit
8. Click the [USER TEST MODE] button. Do not select [QA TEST MODE].
9. When the emulator enters USER TEST MODE, the screen shown in figure 3.7 is displayed.
10. When clicking [UNIT ONLY], items that can be tested are selected.
11. Click the [START] button.
Rev. 10.00 Oct. 15, 2009 Page 86 of 366
REJ10J1003-1000
Section 3 Hardware Specifications
12. When loading FPGA is completed, the test will begin.
Select [UNIT ONLY].
Figure 3.7 Screen for Selecting Test
Note: Do not disconnect the USB cable during the test.
Rev. 10.00 Oct. 15, 2009 Page 87 of 366
REJ10J1003-1000
Section 3 Hardware Specifications
13. When the test is executed, ‘Testing’ is shown at the left of [STATUS].
14. When the test is successfully completed, ‘Test OK!’ is displayed.
15. Select [BACK] to exit the diagnostic program.
Indicating that the test is
being executed.
Figure 3.8 Screen Showing ‘Testing’
After the test has been
completed normally,
select [BACK] to exit the
program.
Rev. 10.00 Oct. 15, 2009 Page 88 of 366
REJ10J1003-1000
Section 3 Hardware Specifications
3.4.3
Creating a Log File
Indicating that the test
has been failed.
Figure 3.9 Screen Showing Failure of the Test (1)
If the test is failed, ‘Test NG!’ (figure 3.9) or ‘Status = xxxx xxxx Error’ (figure 3.10) is shown.
In this case, the emulator may be malfunctioned. Send a log file created according to the
following procedures and contents of a failure to the sales office.
• How to create a log file
1. Click the [FILE LOG] button.
2. A log file ‘F001_SHxxxx.log’ is created under the directory for installing the diagnostic
program (C:\Program Files\E200F F1 TM, if no directory is specified).
3. Send the log file to the sales office.
Rev. 10.00 Oct. 15, 2009 Page 89 of 366
REJ10J1003-1000
Section 3 Hardware Specifications
Indicating that a problem
occurred at the start of the
diagnostic program and the
test was not started.
Figure 3.10 Screen Showing Failure of the Test (2)
Example of the E200F TM error log
*** E200F Emulator T/M ERROR LOG ***
TM Version 2.0.00
ICE CODE F001
Board Number 0001
Device SH7200
Date 2007/01/01
No.
STATUS
NG Address
NG Data
03
0318
A8000004
00000040
Rev. 10.00 Oct. 15, 2009 Page 90 of 366
REJ10J1003-1000
NG
Section 3 Hardware Specifications
3.4.4 Updating the Diagnostic Program
The following describes how to update the diagnostic program.
1. Connect the emulator to the host machine.
2. Turn on the emulator.
3. Select [E200F TM] -> [E200F TM] from [Programs] in the [Start] menu.
4. The diagnostic program of the emulator is started and the initial screen (figure 3.11) is
displayed.
5. Select [TM Version Up].
Select [TM Version Up].
Figure 3.11 Initial Screen of the E200F Diagnostic Program
6. When [TM Version Up] is started, the screen shown in figure 3.12 is displayed.
7. Select [VER UP].
8. When updating the program is executed and completed, the screen shown in figure 3.13 is
displayed.
(If the screen shown in figure 3.14 is displayed, the latest diagnostic program has been
updated. In this case, select [CLOSE] and execute the E200F diagnostic program.)
9. Select [CLOSE].
10. The initial screen of the E200F diagnostic program is displayed (figure 3.11).
11. Execute the diagnostic program with the procedure as described in section 3.4.2, Executing the
Diagnostic Program.
Rev. 10.00 Oct. 15, 2009 Page 91 of 366
REJ10J1003-1000
Section 3 Hardware Specifications
Select [VER UP].
Figure 3.12 Screen after Selecting [VER UP]
Select [CLOSE].
Figure 3.13 Screen when Completing Update
Rev. 10.00 Oct. 15, 2009 Page 92 of 366
REJ10J1003-1000
Section 3 Hardware Specifications
Select [CLOSE].
Figure 3.14 Screen Displayed when the Latest Version has been Updated
Rev. 10.00 Oct. 15, 2009 Page 93 of 366
REJ10J1003-1000
Section 3 Hardware Specifications
Rev. 10.00 Oct. 15, 2009 Page 94 of 366
REJ10J1003-1000
Section 4 Preparations for Debugging
Section 4 Preparations for Debugging
4.1
System Check
When the software is executed, use the procedure below to check that the emulator is connected
correctly. Here, use the workspace for a tutorial provided on the product.
• Connecting the emulator
1. Connect the emulator to the host machine.
2. Connect the user system interface cable to the connector of the emulator.
3. Connect the user system interface cable to the connector in the user system.
4. Turn on the user system.
5. Turn on the emulator.
6. Select [Renesas] -> [High-performance Embedded Workshop] -> [High-performance
Embedded Workshop] from [Programs] in the [Start] menu.
Figure 4.1 [Start] Menu
Note: The [High-performance Embedded Workshop] -> [Tools] is not displayed depending on
the user’s environment.
Rev. 10.00 Oct. 15, 2009 Page 95 of 366
REJ10J1003-1000
Section 4 Preparations for Debugging
7. The [Welcome!] dialog box is displayed.
Figure 4.2 [Welcome!] Dialog Box
[Create a new project workspace] radio button:
Creates a new workspace.
[Open a recent project workspace] radio button:
Uses an existing workspace and displays
the history of the opened workspace.
[Browse to another project workspace] radio button:
Uses an existing workspace; this radio
button is used when the history of the
opened workspace does not remain
To use a workspace for the tutorial, select the [Browse to another project workspace] radio button
and click the [OK] button.
When the [Open workspace] dialog box is opened, specify the following directory:
<Directory where the OS has been installed>\WorkSpace\Tutorial\E200\xxxx\Tutorial
Here, ‘xxxx’ means the name of the target MCU.
Rev. 10.00 Oct. 15, 2009 Page 96 of 366
REJ10J1003-1000
Section 4 Preparations for Debugging
After the directory has been specified, select the following file and click the [Open] button.
Figure 4.3 [Open Workspace] Dialog Box
8. The [CPU Select] dialog box is displayed.
Figure 4.4 [CPU Select] Dialog Box
Select the CPU from the drop-down list and click the [OK] button.
Rev. 10.00 Oct. 15, 2009 Page 97 of 366
REJ10J1003-1000
Section 4 Preparations for Debugging
9. The [Select Emulator mode] dialog box is displayed depending on the MCU used.
Figure 4.5 [Select Emulator mode] Dialog Box
Select the MCU name in use from the [Device] drop-down list box. The following items are
selected in the [Mode] group box.
⎯ E200F Emulator
The E200F emulator for the specified MCU is activated. Debugging the program is
enabled.
⎯ Writing Flash memory
The user program is programmed to the flash memory. Debugging the program is disabled.
To download the load module, register it in the workspace.
Rev. 10.00 Oct. 15, 2009 Page 98 of 366
REJ10J1003-1000
Section 4 Preparations for Debugging
10. The [Function select] dialog box is displayed.
Figure 4.6 [Function select] Dialog Box
Select the emulator function to be used. For the items to be selected, refer to section 2.5,
Changing the Settings.
Rev. 10.00 Oct. 15, 2009 Page 99 of 366
REJ10J1003-1000
Section 4 Preparations for Debugging
11. The [Connecting] dialog box is displayed and the emulator connection is started.
Figure 4.7 [Connecting] Dialog Box
The emulator supports the following two debugging modes:
⎯ Debugging with a connection to the EV-chip unit which connects the emulator main unit
and H-UDI port connector to the EV-chip unit
⎯ Debugging without any connection to the EV-chip unit which directly connects the H-UDI
port connector to the user system
The system check procedures shown below differ between those modes.
Rev. 10.00 Oct. 15, 2009 Page 100 of 366
REJ10J1003-1000
Section 4 Preparations for Debugging
• Debugging without any connection to the EV-chip unit
(1) The dialog box is displayed as shown in figure 4.8.
Figure 4.8 Dialog Box of the RESET Signal Input Request Message
(2) Input the reset signal from the user system, and click the [OK] button.
If no reset signal is detected, the following dialog box is displayed.
Figure 4.9 [Can not find /RESET signal] Dialog Box
When the [Ignore] button is clicked, the emulator issues a reset in the CPU for initiation.
However, this method is unavailable for some products. For details, refer to section 3,
Software Specifications when Using the SHxxxx, in the additional document, Supplementary
Information on Using the SHxxxx.
(3) When "Connected" is displayed in the [Output] window of the High-performance Embedded
Workshop, the emulator initiation is completed.
Figure 4.10 [Output] Window
Rev. 10.00 Oct. 15, 2009 Page 101 of 366
REJ10J1003-1000
Section 4 Preparations for Debugging
• Debugging with a connection to the EV-chip unit
(1) The dialog box is displayed as shown in figure 4.11.
Figure 4.11 [Select Emulation] Dialog Box
Make the required settings for the EV-chip unit. Select the settings to be used and click the
[OK] button.
Rev. 10.00 Oct. 15, 2009 Page 102 of 366
REJ10J1003-1000
Section 4 Preparations for Debugging
Note: The items that can be set in this dialog box depend on the emulator in use. For details,
refer to the online help.
(2) When "Connected" is displayed in the [Output] window of the High-performance Embedded
Workshop, the emulator initiation is completed.
Figure 4.12 [Output] Window
Notes: 1. When using the MCU with flash memory, the dialog box shown in figure 4.13 is
opened. Input the clock value.
The clock value is the frequency of the crystal oscillator connected to the target MCU
or the external clock that has been input to that MCU.
Figure 4.13 [Clock] Dialog Box
Rev. 10.00 Oct. 15, 2009 Page 103 of 366
REJ10J1003-1000
Section 4 Preparations for Debugging
2. After the following dialog box is displayed, input the ID code as a security code for the
flash memory. However, H’FFFFFFFF is disabled as the ID code.
Input this ID code when [E200F Emulator] is selected and the [New ID code] check
box is unselected on activating the emulator. If the ID code is not matched or the [New
ID code] check box is selected, the flash memory contents are erased.
Figure 4.14 [ID Code] Dialog Box
Note: The ID code to be set in the [ID Code] dialog box and setting the ID code differ depending
on the product. For details on the specification of each product, refer to the additional
document, Supplementary Information on Using the SHxxxx, or the on-line help.
3. If the emulator is not initiated, the following dialog boxes shown in figures 4.15
through 4.18 will be displayed.
(a) If the following dialog box is displayed and method (2) of ‘Debugging without any
connection to the EV-chip unit’ above is unavailable, the power of the user system
may not be input or the RESET signal may not be input to the device. Check the input
circuits for the power of the user system and the reset pin.
Figure 4.15 [Can not find /RESET signal] Dialog Box
Rev. 10.00 Oct. 15, 2009 Page 104 of 366
REJ10J1003-1000
Section 4 Preparations for Debugging
(b) If the following dialog box is displayed, the user system may be turned off or the HUDI port connector may not be correctly connected. Check that the user system is
turned on and the H-UDI port connector is connected.
Figure 4.16 [Check the connection] Dialog Box
(c) If the following dialog box is displayed, the device may not correctly operate. Check
if there are reasons for illegal device operation.
Figure 4.17 [COMMUNICATION TIMEOUT ERROR] Dialog Box
Figure 4.18 [Error JTAG boot] Dialog Box
4. If the emulator is not activated due to other reasons, a message box corresponding to
the status is displayed. Use the message as a reference to check the wiring on the
board.
Rev. 10.00 Oct. 15, 2009 Page 105 of 366
REJ10J1003-1000
Section 4 Preparations for Debugging
4.2
Method for Activating High-performance Embedded Workshop
To activate the High-performance Embedded Workshop, follow the procedure listed below.
1. Connect the emulator to the host machine and the user system, then turn on the user system.
2. Select [High-performance Embedded Workshop] from [Renesas High-performance Embedded
Workshop] of [Programs] in the [Start] menu.
3. The [Welcome!] dialog box is displayed.
Figure 4.19 [Welcome!] Dialog Box
[Create a new project workspace] radio button:
Creates a new workspace.
[Open a recent project workspace] radio button:
Uses an existing workspace and displays
the history of the opened workspace.
[Browse to another project workspace] radio button:
Uses an existing workspace; this radio
button is used when the history of the
opened workspace does not remain.
In this section, we describe the following three ways to start up the High-performance Embedded
Workshop:
• [Create a new project workspace] - a toolchain is not in use
• [Create a new project workspace] - a toolchain is in use
• [Browse to another project workspace]
Rev. 10.00 Oct. 15, 2009 Page 106 of 366
REJ10J1003-1000
Section 4 Preparations for Debugging
The method to create a new workspace depends on whether a toolchain is or is not in use. Note
that this emulator product does not include a toolchain. Use of a toolchain is available in an
environment where the H8S, H8/300 series C/C++ compiler package or the SuperH™ RISC
engine C/C++ compiler package has been installed. For details on this, refer to the manual
attached to the H8S, H8/300 series C/C++ compiler package or the SuperH™ RISC engine C/C++
compiler package.
4.2.1
Creating the New Workspace (Toolchain Not Used)
1. In the [Welcome!] dialog box that is displayed when the High-performance Embedded
Workshop is activated, select [Create a new project workspace] radio button and click the
[OK] button.
Figure 4.20 [Welcome!] Dialog Box
Rev. 10.00 Oct. 15, 2009 Page 107 of 366
REJ10J1003-1000
Section 4 Preparations for Debugging
2. The Project Generator is started. In this section, we omit description of the settings for the
toolchain.
If you have not purchased the toolchain, the following dialog box is displayed.
Figure 4.21 [New Project Workspace] Dialog Box
[Workspace Name] edit box: Enter the new workspace name.
[Project Name] edit box:
Enter the project name. When the project name is the same as
the workspace name, it needs not be entered.
[Directory] edit box:
Enter the directory name in which the workspace will be created.
Click the [Browse…] button to select a directory.
Other list boxes are used for setting the toolchain; the fixed information is displayed when the
toolchain has not been installed.
Click the [OK] button.
Rev. 10.00 Oct. 15, 2009 Page 108 of 366
REJ10J1003-1000
Section 4 Preparations for Debugging
3. Select the target platform of the session file. The following dialog box is displayed.
Figure 4.22 [Setting the Target System for Debugging] Dialog Box
The target for the session file used when the High-performance Embedded Workshop is
activated must be selected here. Check the box against the target platform and then click the
[Next] button.
Rev. 10.00 Oct. 15, 2009 Page 109 of 366
REJ10J1003-1000
Section 4 Preparations for Debugging
4. Set the configuration file name. The configuration file saves the state of High-performance
Embedded Workshop except for the emulator.
Figure 4.23 [Setting the Debugger Options] Dialog Box
If multiple target platforms were selected in the [Setting the Target System for Debugging]
dialog box shown in figure 4.22, set the name of a configuration file for each of them, each
time clicking the [Next] button to proceed to the next target.
Setting of the configuration file name is the end of the emulator settings.
Click the [Finish] button to display the [Summary] dialog box. Pressing the [OK] button
activates the High-performance Embedded Workshop.
5. After the High-performance Embedded Workshop has been activated, the emulator is
automatically connected. The message “Connected” is displayed on the [Debug] tab in the
[Output] window to indicate the completion of connection.
Rev. 10.00 Oct. 15, 2009 Page 110 of 366
REJ10J1003-1000
Section 4 Preparations for Debugging
4.2.2 Creating the New Workspace (Toolchain Used)
1. In the [Welcome!] dialog box that is displayed when the High-performance Embedded
Workshop is activated, select [Create a new project workspace] radio button and click the
[OK] button.
Figure 4.24 [Welcome!] Dialog Box
Rev. 10.00 Oct. 15, 2009 Page 111 of 366
REJ10J1003-1000
Section 4 Preparations for Debugging
2. Creation of a new workspace is started. If you have purchased the toolchain, the following
dialog box is displayed.
Figure 4.25 [New Project Workspace] Dialog Box
[Workspace Name] edit box:
Enter the new workspace name.
[Project Name] edit box:
Enter the project name. When the project name is the
same as the workspace name, it needs not be entered.
[Directory] edit box:
Enter the directory name in which the workspace will be
created. Click the [Browse…] button to select a directory.
[CPU family] drop-down list box: Select the target CPU family.
[Tool chain] drop-down list box:
Select the target toolchain name when using the toolchain.
Otherwise, select [None].
[Project type] list box:
Select the project type to be used.
Note: When [Demonstration] is selected in the emulator, note the following:
The [Demonstration] is a program for the simulator. When using a program to be
generated, delete the Printf statement.
Rev. 10.00 Oct. 15, 2009 Page 112 of 366
REJ10J1003-1000
Section 4 Preparations for Debugging
3. Make the required setting for the toolchain. When the setting has been completed, the
following dialog box is displayed.
Figure 4.26 [New Project –7/9– Setting the Target System for Debugging] Dialog Box
The target platform for the session file used when the High-performance Embedded Workshop
is activated must be selected here. Check the box against the target platform and then click the
[Next] button.
Rev. 10.00 Oct. 15, 2009 Page 113 of 366
REJ10J1003-1000
Section 4 Preparations for Debugging
4. Set the configuration file name. The configuration saves the state of High-performance
Embedded Workshop except for the emulator.
Figure 4.27 [New Project –8/9– Setting the Debugger Options] Dialog Box
This is the end of the emulator setting.
Exit the Project Generator according to the instructions on the screen. The High-performance
Embedded Workshop is activated.
Rev. 10.00 Oct. 15, 2009 Page 114 of 366
REJ10J1003-1000
Section 4 Preparations for Debugging
5. After the High-performance Embedded Workshop has been activated, connect the emulator.
However, it is not needed to connect the emulator immediately after the High-performance
Embedded Workshop has been activated.
To connect the emulator, use one of the methods (a) and (b) below. For operation during
connection, refer to section 4.1, System Check.
(a) Connecting the emulator after the setting at emulator activation
Select [Debug settings] from the [Options] menu to open the [Debug Settings] dialog box. It is
possible to register the download module or the command chain that is automatically executed
at activation. For details on the [Debug Settings] dialog box, refer to section 4.3, Setting at
Emulator Activation.
After the [Debug Settings] dialog box has been set, when the dialog box is closed, the emulator
is connected.
(b) Connecting the emulator without the setting at emulator activation
The emulator can be easily connected by switching the session file that the setting for the
emulator use has been registered.
Rev. 10.00 Oct. 15, 2009 Page 115 of 366
REJ10J1003-1000
Section 4 Preparations for Debugging
Figure 4.28 Selecting the Session File
In the list box that is circled in figure 4.28, select the session file name including the character
string that has been set in the [Target name] text box in figure 4.27, [New Project –8/9– Setting
the Debugger Options] dialog box. The setting for using the emulator has been registered in this
session file.
After selected, the emulator is automatically connected.
Rev. 10.00 Oct. 15, 2009 Page 116 of 366
REJ10J1003-1000
Section 4 Preparations for Debugging
4.2.3 Selecting an Existing Workspace
1. In the [Welcome!] dialog box that is displayed when the High-performance Embedded
Workshop is activated, select [Browse to another project workspace] radio button and click the
[OK] button.
Figure 4.29 [Welcome!] Dialog Box
Rev. 10.00 Oct. 15, 2009 Page 117 of 366
REJ10J1003-1000
Section 4 Preparations for Debugging
2. The [Open Workspace] dialog box is displayed. Select a directory in which you have created a
workspace.
After that, select the workspace file (.hws) and press the [Open] button.
Figure 4.30 [Open Workspace] Dialog Box
3. This activates the High-performance Embedded Workshop and recovers the state of the
selected workspace at the time it was saved.
When the saved state information of the selected workspace includes connection to the
emulator, the emulator will automatically be connected. To connect the emulator when the
saved state information does not include connection to the emulator, refer to section 4.5,
Connecting the Emulator.
Rev. 10.00 Oct. 15, 2009 Page 118 of 366
REJ10J1003-1000
Section 4 Preparations for Debugging
4.3
Setting at Emulator Activation
When the emulator is activated, the command chain can be automatically executed. It is also
possible to register multiple load modules to be downloaded. The registered load modules are
displayed on the workspace window.
1. Select [Debug settings] from the [Options] menu to open the [Debug Settings] dialog box.
Figure 4.31 [Debug Settings] Dialog Box ([Target] Page)
2. Select the product name to be connected in the [Target] drop-down list box.
3. Select the format of the load module to be downloaded in the [Default Debug Format] dropdown list box, then register the corresponding download module in the [Download Modules]
list box.
Note:
Here, no program has been downloaded. For downloading, refer to section 5.2,
Downloading a Program.
4. Click the [Options] tab.
Rev. 10.00 Oct. 15, 2009 Page 119 of 366
REJ10J1003-1000
Section 4 Preparations for Debugging
Figure 4.32 [Debug Settings] Dialog Box ([Options] Page)
The command chain that is automatically executed at the specified timing is registered. The
following three timings can be specified:
• At connecting the emulator
• Immediately before downloading
• Immediately after downloading
Specify the timing for executing the command chain in the [Command batch file load timing]
drop-down list box. In addition, register the command-chain file that is executed at the specified
timing in the [Command Line Batch Processing] list box.
Rev. 10.00 Oct. 15, 2009 Page 120 of 366
REJ10J1003-1000
Section 4 Preparations for Debugging
4.4
Debug Sessions
The High-performance Embedded Workshop stores all of your builder options into a
configuration. In a similar way, the High-performance Embedded Workshop stores your debugger
options in a session. The debugging platforms, the programs to be downloaded, and each
debugging platform’s options can be stored in a session.
Sessions are not directly related to a configuration. This means that multiple sessions can share
the same download module and avoid unnecessary program rebuilds.
Each session’s data should be stored in a separate file in the High-performance Embedded
Workshop project. Debug sessions are described in detail below.
4.4.1 Selecting a Session
The current session can be selected in the following two ways:
• From the toolbar
Select a session from the drop-down list box (figure 4.33) in the toolbar.
Figure 4.33 Toolbar Selection
Rev. 10.00 Oct. 15, 2009 Page 121 of 366
REJ10J1003-1000
Section 4 Preparations for Debugging
• From the dialog box
1. Select [Debug -> Debug Sessions…]. This will open the [Debug Sessions] dialog box
(figure 4.34).
Figure 4.34 [Debug Sessions] Dialog Box
2. Select the session you want to use from the [Current session] drop-down list.
3. Click the [OK] button to set the session.
Rev. 10.00 Oct. 15, 2009 Page 122 of 366
REJ10J1003-1000
Section 4 Preparations for Debugging
4.4.2 Adding and Removing Sessions
A new session can be added by copying settings from another session or removing a session.
• To add a new empty session
1. Select [Debug -> Debug Sessions…] to display the [Debug Sessions] dialog box (figure
4.34).
2. Click the [Add…] button to display the [Add new session] dialog box (figure 4.35).
3. Check the [Add new session] radio button.
4. Enter a name for the session.
5. Click the [OK] button to close the [Debug Sessions] dialog box.
6. This creates a file with the name entered in step 4. If a file with this name already exists,
an error is displayed.
Figure 4.35 [Add new session] Dialog Box
Rev. 10.00 Oct. 15, 2009 Page 123 of 366
REJ10J1003-1000
Section 4 Preparations for Debugging
• To import an existing session into a new session file
1. Select [Options -> Debug Sessions…] to display the [Debug Sessions] dialog box (figure
4.34).
2. Click the [Add…] button to display the [Add new session] dialog box (figure 4.35).
3. Check the [Use an existing session file] radio button.
4. Enter a name for the session.
5. Enter the name of an existing session file that you would like to import into the existing
project or click the [Browse] button to select the file location.
If the [Open and maintain link to session file] check box is not checked, the imported new
session file is generated in the project directory.
If the [Open and maintain link to session file] check box is checked, a new session file is
not generated in the project directory but is linked to the current session file.
If the [Make session file link read only] check box is checked, the linked session file is
used as read-only.
6. Click the [OK] button to close the [Debug Sessions] dialog box.
• To remove a session
1. Select [Options -> Debug Sessions…] to display the [Debug Sessions] dialog box (figure
4.34).
2. Select the session you would like to remove.
3. Click the [Remove] button.
Note that the current session cannot be removed.
4. Click the [OK] button to close the [Debug Sessions] dialog box.
• To view the session properties
1. Select [Options -> Debug Sessions…] to display the [Debug Sessions] dialog box (figure
4.34).
2. Select the session you would like to view the properties for.
3. Click the [Properties] button to display the [Session Properties] dialog box (figure 4.36).
Rev. 10.00 Oct. 15, 2009 Page 124 of 366
REJ10J1003-1000
Section 4 Preparations for Debugging
Figure 4.36 [Session Properties] Dialog Box
• To make a session read-only
1. Select [Options -> Debug Sessions…] to display the [Debug Sessions] dialog box (figure
4.34).
2. Select the session you would like to make read-only.
3. Click the [Properties] button to display the [Session Properties] dialog box (figure 4.36).
4. Check the [Read only] check box to make the link read-only. This is useful if you are
sharing debugger-setting files and you do not want data to be modified accidentally.
5. Click the [OK] button.
• To save a session with a different name
1. Select [Options -> Debug Sessions…] to display the [Debug Sessions] dialog box (figure
4.34).
2. Select the session you would like to save.
3. Click the [Save as…] button to display the [Save Session] dialog box (figure 4.37).
4. Browse to the new file location.
5. If you want to export the session file to another location, leave the [Maintain link] check
box unchecked. If you would like the High-performance Embedded Workshop to use this
location instead of the current session location, check the [Maintain link] check box.
6. Click the [Save] button.
Rev. 10.00 Oct. 15, 2009 Page 125 of 366
REJ10J1003-1000
Section 4 Preparations for Debugging
Figure 4.37 [Save Session] Dialog Box
4.4.3 Saving Session Information
• To save a session
Select [File -> Save Session].
Rev. 10.00 Oct. 15, 2009 Page 126 of 366
REJ10J1003-1000
Section 4 Preparations for Debugging
4.5
Connecting the Emulator
Select either of the following two ways to connect the emulator:
(a) Connecting the emulator after the setting at emulator activation
Select [Debug settings] from the [Options] menu to open the [Debug Settings] dialog box.
It is possible to register the download module or the command chain that is automatically
executed at activation. For details on the [Debug Settings] dialog box, refer to section 4.3,
Setting at Emulator Activation.
When the dialog box is closed after setting the [Debug Settings] dialog box, the emulator
will automatically be connected.
(b) Connecting the emulator without the setting at emulator activation
Connect the emulator by simply switching the session file to one in which the setting for
the emulator use has been registered.
Figure 4.38 Selecting the Session File
Rev. 10.00 Oct. 15, 2009 Page 127 of 366
REJ10J1003-1000
Section 4 Preparations for Debugging
In the list box that is circled in figure 4.38, select the session file name including the character
string that has been set in the [Target name] text box in figure 4.27, [New Project –8/9– Setting
the Debugger Options] dialog box. The setting for using the emulator has been registered in this
session file.
After the session file name is selected, the emulator will automatically be connected. For details
on the session file, refer to section 4.4, Debug Sessions.
4.6
Reconnecting the Emulator
When the emulator is disconnected, use the following way for reconnection:
Select [Build -> Debug -> Connect] or click the [Connect] toolbar button (
connected.
). The emulator is
Note: The emulator must be selected in the [Target] drop-down list box of the [Debug Settings]
dialog box (see figure 4.32, [Debug Settings] Dialog Box ([Target] Page)) that is opened
by selecting [Debug settings] from the [Options] menu.
4.7
Ending the Emulator
When using the toolchain, the emulator can be exited by using the following two methods:
• Canceling the connection of the emulator being activated
• Exiting the High-performance Embedded Workshop
(1) Canceling the connection of the emulator being activated
Select [Disconnect] from the [Debug] menu or click the [Disconnect] toolbar button (
).
(2) Exiting the High-performance Embedded Workshop
Select [Exit] from the [File] menu.
A message box is displayed. If necessary, click the [Yes] button to save a session. After
saving a session, the High-performance Embedded Workshop exits. If not necessary, click the
[No] button to exit the High-performance Embedded Workshop.
Rev. 10.00 Oct. 15, 2009 Page 128 of 366
REJ10J1003-1000
Section 4 Preparations for Debugging
Figure 4.39 Message Box
Rev. 10.00 Oct. 15, 2009 Page 129 of 366
REJ10J1003-1000
Section 4 Preparations for Debugging
Rev. 10.00 Oct. 15, 2009 Page 130 of 366
REJ10J1003-1000
Section 5 Debugging
Section 5 Debugging
This section describes the debugging operations and their related windows and dialog boxes.
5.1
Setting the Environment for Emulation
The method for setting the environment for emulation is described here. This environment must be
set correctly before debugging is started.
5.1.1
Opening the [Configuration] Dialog Box
Selecting [Setup -> Emulator -> System…] or clicking the [Emulator System] toolbar button (
opens the [Configuration] dialog box.
)
Rev. 10.00 Oct. 15, 2009 Page 131 of 366
REJ10J1003-1000
Section 5 Debugging
5.1.2 [General] Page
Sets the emulator operation conditions.
Figure 5.1 [Configuration] Dialog Box ([General] Page)
Rev. 10.00 Oct. 15, 2009 Page 132 of 366
REJ10J1003-1000
Section 5 Debugging
Items that can be displayed in this page are listed below.
[Mode]
Displays the MCU name.
[Emulation mode]
Selects the emulation mode when user program is executed.
[Step option]
Sets the step interrupt option.
[Disable interrupts during single step execution]:
*1
Disables interrupts during step execution.
[Enable interrupts during single step execution]:
*1
Enables interrupts during step execution.
[Read/Write on the fly]
Enables or disables reading from or writing to memory during
emulation.
[Disable]:
Disables reading from and writing to memory during emulation.
[H-UDI Read/Write]:
Uses the H-UDI to read from or write to memory during
emulation. Realtime emulation is slightly affected.
[Short Break Read/Write]:
A break occurs whenever data are read from or written to
memory. Realtime emulation is affected.
[AUD clock]
A clock used in acquiring AUD traces. If its frequency is set too
low, complete data may not be acquired during realtime tracing.
Set the frequency not to exceed the upper limit for the MCU's
AUD clock. The AUD clock is only needed for using emulators
that have an AUD trace function. For the upper limit for the
AUD clock, refer to section 3.2.3, Notes on Using the JTAG (HUDI) Clock (TCK) and AUD Clock (AUDCK), in the additional
document, Supplementary Information on Using the SHxxxx.
[AUD pin Select]
Sets the pin that is shared with the AUD pin.
[JTAG clock]
A communication clock used except for acquiring AUD trace. If
its frequency is set too low, the speed of downloading will be
lowered. Set the frequency not to exceed the upper limit for the
MCU's guaranteed TCK range. For the upper limit for TCK,
refer to section 3.2.3, Notes on Using the JTAG (H-UDI) Clock
(TCK) and AUD Clock (AUDCK), in the additional document,
Supplementary Information on Using the SHxxxx.
Rev. 10.00 Oct. 15, 2009 Page 133 of 366
REJ10J1003-1000
Section 5 Debugging
Notes: 1. Includes interrupts in a break.
2. The items that can be set in this dialog box depend on the emulator in use. For details,
refer to the online help.
5.1.3
[Main Board] Page
Sets the main unit case operation conditions.
Figure 5.2 [Configuration] Dialog Box ([Main Board] Page)
Rev. 10.00 Oct. 15, 2009 Page 134 of 366
REJ10J1003-1000
Section 5 Debugging
Items that can be displayed in this page are listed below.
[Multi analysis mode setting]
Displays the emulator functions.
Settings cannot be changed; if they are to be changed, the
emulator must be activated again.
[RealProfile Area 1 (function mode)]:
The realtime profiling function (measurement mode: function
mode) has been selected.
[RealProfile Area 1 (nest mode)]:
The realtime profiling function (measurement mode: nest
mode) has been selected.
[Coverage (4M)]:
The coverage function is selected.
[AUD data bus width]
*1
Sets the AUD data bus width.
The bus width can be selected as 4 bits or 8 bits.
Notes: 1. In some products, the bus width will be fixed. For the specifications of each product,
refer to the online help.
2. The items that can be set in this dialog box depend on the emulator in use. For details,
refer to the online help.
Rev. 10.00 Oct. 15, 2009 Page 135 of 366
REJ10J1003-1000
Section 5 Debugging
5.1.4 [EVA Board] Page
Sets the EV-chip unit operation conditions.
Note: When the EV-chip unit is not connected to the emulator, this page is not displayed.
Items that can be displayed in this page are listed below.
[Change Emulation in start up]
Displays the [Select Emulation] dialog box when the emulator is
activated by connecting the EV-chip unit.
[User Signals]
Enables the reset, NMI, wait, and bus request signals output
from the user system.
[Multiplexed pins setting...]
Sets the pins that have been set by the pin function controller
(PFC). The following functions can be implemented by correctly
setting the pins corresponding to the signals:
•
Monitoring function
•
Memory map function
•
External bus trace function performed by detecting the
external bus event
•
External bus break function performed by detecting the
external bus event
Select the pin that is set by the PFC.
Note: The items that can be set in this dialog box depend on the emulator in use. For details, refer
to the online help.
Rev. 10.00 Oct. 15, 2009 Page 136 of 366
REJ10J1003-1000
Section 5 Debugging
5.1.5 [Bus Board] Page
Sets the external bus trace unit operation conditions.
Note: When the external bus trace unit is not connected to the emulator, this page is not
displayed.
Figure 5.3 [Configuration] Dialog Box ([Bus Board] Page)
Rev. 10.00 Oct. 15, 2009 Page 137 of 366
REJ10J1003-1000
Section 5 Debugging
Items that can be displayed in this page are listed below.
[Bus board mode setting]
Displays the debugging functions on the external bus trace unit.
Settings cannot be changed; if they are to be changed, the
emulator must be activated again.
[Trace/break 6ch (Trace 262144 cycles)]:
The external bus trace or break function (event detection
channels: six) has been selected.
[Performance 6ch]:
The external bus trace function has been selected
(measurement channels: six).
[Use emulation memory (4M, Trace 8192 cycles)]:
The external emulation memory function (4 Mbytes x 1 block)
has been selected. The 8192 bys cycles can be acquired by a
trace.
[Multiplexed pins setting...]
Selects the state of the multiplexed pins.
[Memory type setting...]
Selects the type of memory for each area. Select [Normal] for
other than SRAM with byte control.
Notes: 1. The items that can be set in this dialog box depend on the emulator in use. For details,
refer to the online help.
2. When the external bus trace unit is not connected to the emulator, this page is not
displayed.
Rev. 10.00 Oct. 15, 2009 Page 138 of 366
REJ10J1003-1000
Section 5 Debugging
Clicking the [Multiplexed pins setting...] button opens the [Multiplexed pins setting] dialog box.
Select the pin name according to the state of the multiplexed pin.
Figure 5.4 [Multiplexed pins setting] Dialog Box
Note: The items that can be set in this dialog box depend on the emulator in use. For details,
refer to the online help.
Rev. 10.00 Oct. 15, 2009 Page 139 of 366
REJ10J1003-1000
Section 5 Debugging
Clicking the [Memory type setting...] button opens the [Memory type setting] dialog box. Set the
memory type on the board.
Figure 5.5 [Memory type setting] Dialog Box
Note: This dialog box differs depending on the product. For details, refer to the online help.
Rev. 10.00 Oct. 15, 2009 Page 140 of 366
REJ10J1003-1000
Section 5 Debugging
5.1.6 [Option Board] Page
Sets the expansion profiling unit operation conditions.
Note: When the expansion profiling unit is not connected to the emulator, this page is not
displayed.
Figure 5.6 [Configuration] Dialog Box ([Option Board] Page)
Rev. 10.00 Oct. 15, 2009 Page 141 of 366
REJ10J1003-1000
Section 5 Debugging
Item that can be displayed in this page is listed below.
[Option board mode setting]
Displays the functions of the expansion profiling unit. Settings
cannot be changed; if they are to be changed, the emulator
must be activated again.
[RealProfile Area 2 (function mode)]:
The realtime profiling function (measurement mode: function
mode) has been selected.
[RealProfile Area 2 (nest mode)]:
The realtime profiling function (measurement mode: nest mode)
has been selected.
[Coverage (8M)]:
The coverage function has been selected. The 8-Mbyte area
can be measured.
Rev. 10.00 Oct. 15, 2009 Page 142 of 366
REJ10J1003-1000
Section 5 Debugging
5.1.7
Downloading to the Flash Memory
Sets the emulator operation conditions for downloading the external flash memory.
For details, refer to section 6.21, Download Function to the Flash Memory Area.
Figure 5.7 [Configuration] Dialog Box ([Loading flash memory] Page)
Rev. 10.00 Oct. 15, 2009 Page 143 of 366
REJ10J1003-1000
Section 5 Debugging
Items that can be displayed in this page are listed below.
[Loading flash memory]
Sets Enable for flash memory downloading. At Enable, when
the flash memory is downloaded on the High-performance
Embedded Workshop, the write module is always called.
[Disable]: Not download to the flash memory
[Enable]: Download to the flash memory
[Erasing flash memory]
Sets Enable for erasing before the flash memory is written. At
Enable, the erase module is called before calling the write
module.
[Disable]: Not erase the flash memory
[Enable]: Erase the flash memory
[File name]
Sets the write/erase module name. The file that has been set is
loaded to the RAM area before loading to the flash memory.
[Bus width of flash memory]
Sets the bus width of the flash memory.
[Flash memory erasing time]
Sets the TIMEOUT value at flash memory erasing. Increase the
value if erasing requires much time although the default time is
three minutes. The values that can be set are as follows: D'0
(minimum) and D’65535 (maximum). Only positive integers can
be input.
[Entry point]
Sets the calling destination address of the write/erase module.
(It must be RAM address.)
[All erasing module address]: Enters the calling destination
address of the erase module.
[Writing module address]:
Enters the calling destination
address of the write module.
[Access size]:
Selects the access size of the
RAM area that is used for loading the write/erase module.
Rev. 10.00 Oct. 15, 2009 Page 144 of 366
REJ10J1003-1000
Section 5 Debugging
5.1.8 Opening the [Memory Mapping] Dialog Box
Selecting [Setup -> Emulator -> Memory Resource…] or clicking the [Emulator Memory
Resource] toolbar button (
) opens the [Memory Mapping] dialog box.
Figure 5.8 [Memory Mapping] Dialog Box
Rev. 10.00 Oct. 15, 2009 Page 145 of 366
REJ10J1003-1000
Section 5 Debugging
This dialog box displays the current memory map and the state of the emulation memory.
[Edit...]:
Displays the [Edit Memory Mapping] dialog box, allowing the user to modify
the address range and attributes of a memory map.
[Reset]:
Resets the map memory to its default settings.
[Reset All]:
Resets all the memory map to its default settings.
[Close]:
Closes the dialog box.
The memory configuration of the device being emulated is shown on the [Memory] sheet of the
[Status] window.
Notes: 1. When the external bus trace unit or emulation memory unit is not connected to the
emulator, this page is not displayed.
2. The items that can be set in this dialog box depend on the emulator in use. For details,
refer to the online help.
3. The items to be displayed in this dialog box depend on the emulator in use. For details,
refer to the online help.
Rev. 10.00 Oct. 15, 2009 Page 146 of 366
REJ10J1003-1000
Section 5 Debugging
5.1.9 Changing the Memory Map Setting
Clicking the [Edit…] button on the [Memory Mapping] dialog box after selecting the information
on the memory map setting you want to change opens the [Edit Memory Mapping] dialog box.
Figure 5.9 [Edit Memory Mapping] Dialog Box
Use this dialog box to change the address range and attributes of a memory map.
[From]:
Enter the start address of the map range.
[Setting]:
Enter the memory map setting.
The choices given are listed below.
•
EMULATION AREA – 32 bit: The data bus width is 32 bits.
•
EMULATION AREA – 32 bit Read-Only:
This area is write-protected and the data bus width is 32 bits.
•
EMULATION AREA – 16 bit: The data bus width is 16 bits.
•
EMULATION AREA – 16 bit Read-Only:
This area is write-protected and the data bus width is 16 bits.
•
EMULATION AREA – 8 bit: The data bus width is 8 bits.
Rev. 10.00 Oct. 15, 2009 Page 147 of 366
REJ10J1003-1000
Section 5 Debugging
•
EMULATION AREA – 8 bit Read Only:
This area is write-protected and the data bus width is 8 bits.
•
USER AREA: This area is specified as the user area.
[Multiplexed Address pins setting] button:
•
The [Multiplexed Address pins setting] dialog box is opened to set the states
of the use of multiplexed address pins.
•
Selecting [- Emulation memory unit MAP n -] in the [Memory Mapping]
dialog box enables the [Multiplexed Address pins setting] button.
•
The states of the use of multiplexed address pins must be set for each 4Mbyte emulation memory that has been installed on the emulation memory
unit.
Notes: 1. The minimum unit for mapping the memory is fixed to 4 Mbytes.
2. When the external bus trace unit is connected to the emulator, the 4-Mbyte memory
can be allocated to one area.
When the 8-Mbyte emulation memory unit is connected to the emulator, the 4-Mbyte
memory can be allocated to two areas.
When the 16-Mbyte emulation memory unit is connected to the emulator, the 4-Mbyte
memory can be allocated to four areas.
Therefore, the 4-Mbyte memory can be allocated to a maximum of five areas (one area
for the external bus trace unit and four areas for the emulation memory unit).
3. When using the emulation memory that has been installed on the emulation memory
unit, be sure to set the states of the use of multiplexed address pins.
4. The performance of the emulation memory differs whether it is installed on the
external bus trace unit or on the emulation memory unit. Note the settings of the bus
state controller (BSC).
5. The external bus trace unit and the emulation memory unit are optional.
6. This dialog box differs depending on the product. For details, refer to the online help.
Rev. 10.00 Oct. 15, 2009 Page 148 of 366
REJ10J1003-1000
Section 5 Debugging
5.1.10 [Multiplexed Address pins setting] Dialog Box
Set this dialog box depending on the state of the use of multiplexed address pin.
[Address pins] group box:
Select the states of the use of address bus pins that depend on the
target MCU. Set [MASK] for the multiplexed pins that are not used
as the address bus pins.
Note: To set the emulation memory that has been installed on the emulation memory unit, the
content of this setting is used. If the [Address pins] group box is illegally set, the
emulation memory will not be allocated correctly.
5.2
Downloading a Program
This section describes how to download a program and view it as source code or assemblylanguage mnemonics.
Note: After a break has occurred, the High-performance Embedded Workshop displays the
location of the program counter (PC). In most cases, for example if an Elf/Dwarf2-based
project is moved from its original path, the source file may not be automatically found. In
this case, the High-performance Embedded Workshop will open a source file browser
dialog box to allow you to manually locate the file.
5.2.1 Downloading a Program
A load module to be debugged must be downloaded.
To download a program, select the load module from [Debug -> Download] or select [Download]
from the popup menu opened by clicking the right-hand mouse button on the load module in
[Download modules] of the [Workspace] window.
Notes: 1. Before downloading a program, it must be registered to the High-performance
Embedded Workshop as a load module. For registration, refer to section 4.3, Setting at
Emulator Activation.
2. To download a program to the external RAM or emulation memory, the bus controller
and ports must be initially set in the area for downloading. Especially, check that the
initialization of SDRAM or the setting of the bus width is appropriate for the user
system.
Rev. 10.00 Oct. 15, 2009 Page 149 of 366
REJ10J1003-1000
Section 5 Debugging
5.3
Viewing the Source Code
Select your source file and click the [Open] button to make the High-performance Embedded
Workshop open the file in the integrated editor. It is also possible to display your source files by
double-clicking on them in the [Workspace] window.
Figure 5.10 [Editor] Window
Rev. 10.00 Oct. 15, 2009 Page 150 of 366
REJ10J1003-1000
Section 5 Debugging
In this window, the following items are shown on the left as line information.
The first column (Line number): Line number information
The second column (Source address column): Address information
The third column (Onchip event column): On-chip event information
The fourth column (AUD event column): AUD event information
The fifth column (BUS event column): External bus event information
The sixth column (CodeCoverage column): Coverage information
The seventh column (S/W breakpoint column): PC, bookmark, and breakpoint information
Note: When the external bus trace unit is not connected to the emulator, the BUS event column
is not displayed.
• Source address column
When a program is downloaded, an address for the current source file is displayed on the Source
address column. These addresses are helpful when setting the PC value or breakpoints.
• Onchip event column
The Onchip event column displays the following item:
: An address condition for the on-chip event is set. The number of address conditions that can
be set is the same as that of on-chip event channels at which the address condition can be set.
The bitmap symbol above is shown by double-clicking the Onchip event column. This is also set
by using the popup menu.
Figure 5.11 Popup Menu for the Onchip Event Column
Rev. 10.00 Oct. 15, 2009 Page 151 of 366
REJ10J1003-1000
Section 5 Debugging
Note: The contents of the Onchip event column are erased when conditions other than the
address condition are added to each channel by using the [Edit] menu or in the [Event]
window.
• AUD event column
The AUD event column displays the following item:
: An AUD break is set.
: An AUD sequential break is set.
: An AUD trace acquisition is set.
: An AUD trace start is set.
: An AUD trace stop is set.
: An AUD trace sequential stop is set.
: An AUD performance start is set.
: An AUD performance stop is set.
The bitmap symbols for break above are shown by double-clicking the AUD event column. These
are also set by using the popup menu.
Figure 5.12 Popup Menu for the AUD Event Column
Note: The contents of the AUD event column are erased when conditions other than the address
condition are added to each channel by using the [Edit] menu or in the [Event] window.
Rev. 10.00 Oct. 15, 2009 Page 152 of 366
REJ10J1003-1000
Section 5 Debugging
• BUS event column
The BUS event column displays the following item:
: An external bus break is set.
: An external bus sequential break is set.
: An external bus trace acquisition is set.
: An external bus trace start is set.
: An external bus trace stop is set.
: An external bus trace sequential stop is set.
The bitmap symbols for break above are shown by double-clicking the BUS event column. These
are also set by using the popup menu.
Figure 5.13
Popup Menu for the BUS event Column
Note: The contents of the BUS event column are erased when conditions other than the address
condition are added to each channel by using the [Edit] menu or in the [Event] window.
• S/W Breakpoints column
S/W Breakpoints column displays the following items:
: A bookmark is set.
: An S/W breakpoint is set.
: PC location
Rev. 10.00 Oct. 15, 2009 Page 153 of 366
REJ10J1003-1000
Section 5 Debugging
To switch off a column in all source files
1. Click the right-hand mouse button on the [Editor] window.
2. Click the [Define Column Format…] menu item.
3. The [Global Editor Column States] dialog box is displayed.
4. A check box indicates whether the column is enabled or not. If it is checked, the column is
enabled. If the check box is gray, the column is enabled in some files and disabled in
others. Deselect the check box of a column you want to switch off.
5. Click the [OK] button for the new column settings to take effect.
Figure 5.14 [Global Editor Column States] Dialog Box
To switch off a column in one source file
1. Open the source file which contains the column you want to remove and click the righthand mouse button on the [Editor] window.
2. Click the [Columns] menu item to display a cascaded menu item. The columns are
displayed in this popup menu. If a column is enabled, it has a tick mark next to its name.
Clicking the entry will toggle whether the column is displayed or not.
Rev. 10.00 Oct. 15, 2009 Page 154 of 366
REJ10J1003-1000
Section 5 Debugging
5.4
Viewing the Assembly-Language Code
Click the right-hand mouse button on the [Editor] window to open the popup menu and select [Go
to Disassembly] to open the [Disassembly] window at the address that corresponds to the current
source file.
If you do not have a source file, but want to view code in the assembly-language level, either
choose [View -> Disassembly…] or click the [Disassembly] toolbar button ( ). The
[Disassembly] window opens at the current PC location and shows [Address] and [Code]
(optional) which show the disassembled mnemonics (with labels when available).
Figure 5.15 [Disassembly] Window
In this window, the following items are shown on the left as information on lines.
The first column (On Chip Break column): On-chip event information
The second column (AUD event column): AUD event information
Rev. 10.00 Oct. 15, 2009 Page 155 of 366
REJ10J1003-1000
Section 5 Debugging
The third column (BUS event column): BUS event information
The fourth column (S/W breakpoint column): PC and S/W breakpoint information
The fifth column (Disassembly address column): Address information
The sixth column (Object code column): Object code information
The seventh column (Label column): Label information
Usage of these columns is the same as that in the window for display of source codes.
5.4.1
Modifying the Assembly-Language Code
The [Assembler] dialog box opens by double-clicking on the instruction that you want to change.
You can modify the assembly-language code.
Figure 5.16 [Assembler] Dialog Box
The address, instruction code, and mnemonic are displayed. Enter a new instruction or edit the old
instruction in the [Mnemonics] field. Pressing the [Enter] key will replace the memory content
with the new instruction and move on to the next instruction. Clicking the [OK] button will
replace the memory content with the new instruction and close the dialog box. Clicking the
[Cancel] button or pressing the [Esc] key will close the dialog box.
Note: The assembly-language display is disassembled from the actual machine code in the
memory. If the memory contents are changed, the dialog box (and the [Disassembly]
window) will show the new assembly-language code, but the display content of the
[Editor] window will not be changed. This is the same even if the source file contains an
assembly codes.
Rev. 10.00 Oct. 15, 2009 Page 156 of 366
REJ10J1003-1000
Section 5 Debugging
5.4.2 Viewing a Specific Address
When you are viewing your program in the [Disassembly] window, you may want to look at
another area of your program's code. Rather than scrolling through a lot of code in the program,
you can go directly to a specific address. Select [Set Address…] from the popup menu, and the
dialog box shown in figure 5.17 is displayed.
Figure 5.17 [Set Address] Dialog Box
Enter the address or label name in the [Address] edit box and either click on the [OK] button or
press the Enter key. A label name can also be specified as the address. The [Disassembly] window
will be updated to show the code at the new address. When an overloaded function or a class name
is entered, the [Select Function] dialog box opens for you to select a function.
5.4.3 Viewing the Current Program Counter Address
Wherever you can enter an address or value into the High-performance Embedded Workshop, you
can also enter an expression. If you enter a register name prefixed by the hash character, the
contents of that register will be used as the value in the expression. Therefore, if you open the [Set
Address] dialog box and enter the expression #pc, the [Editor] or [Disassembly] window will
display the current PC address. It also allows the offset of the current PC to be displayed by
entering an expression with the PC register plus an offset, e.g., #PC+0x100.
Rev. 10.00 Oct. 15, 2009 Page 157 of 366
REJ10J1003-1000
Section 5 Debugging
5.5
Displaying Memory Contents in Realtime
Use the [Monitor] window to monitor the memory contents during user program execution.
5.5.1 Opening the [Monitor] Window
To open the [Monitor] window, select [View -> CPU -> Monitor -> Monitor Setting...] or click the
[Monitor] toolbar button (
) to display the [Monitor Setting] dialog box.
Figure 5.18 [Monitor Setting] Dialog Box
Rev. 10.00 Oct. 15, 2009 Page 158 of 366
REJ10J1003-1000
Section 5 Debugging
[Name]:
Decides the name of the monitor window.
[Options]:
Sets monitor conditions.
[Address]:
Sets the start address for monitoring.
[Size]:
Sets the range for monitoring.
[Access]:
Sets the access size to be displayed in the monitor window.
[Auto-Refresh at rate]:
Sets the interval for acquisition by monitoring.
[Reading the Initial Value]:
Selects reading of the values in the monitored area when the
monitor window is opened.
[Color]:
Sets the method to update monitoring and the attribute of colors.
[Change Indicator]:
Selects how to display the values that have changed during
monitoring (available when [Reading the Initial Value] has
been selected).
No change: No color change.
Change: Color is changed according to the [Foreground] and
[Background] options.
Gray: Those data with values that have not been changed are
displayed in gray.
Appear: A value is only displayed after changed.
[Foreground]:
Sets the color used for display (available when [Change] has
been selected).
[Background]:
Sets the background color (available when [Change] has been
selected).
[Mayfly]:
A check in this box selects restoration of the color of those
data which have not been updated in a specified interval to the
color selected in the [Background] option. The specified
interval is the interval for monitor acquisition (available when
[Change], [Gray], or [Appear] has been selected).
[Detail]:
Not supported in the emulator.
Rev. 10.00 Oct. 15, 2009 Page 159 of 366
REJ10J1003-1000
Section 5 Debugging
[History]:
Displays the previous settings.
Note: Selection of the foreground or background color may not be available depending on the
operating system in use.
After setting, clicking the [OK] button displays the [Monitor] window.
Figure 5.19 [Monitor] Window
During user program execution, the display is updated according to the setting value of the autoupdate interval.
Note: Select [Refresh] from the popup menu when data is not displayed correctly after changing
the address or content of memory.
5.5.2 Changing the Monitor Settings
Selecting [Monitor Settings...] from the popup menu of the [Monitor] window displays the
[Monitor Setting] dialog box, which allows the settings to be changed.
Colors, the size of accesses, and the display format can be easily changed from [Color] or [Access]
of the popup menu.
5.5.3 Temporarily Stopping Update of the Monitor
During user program execution, the display of the [Monitor] window is automatically updated
according to the auto-update interval. Select [Lock Refresh] from the popup menu of the
[Monitor] window to stop the update of display. The characters in the address section are
displayed in black, and the update of display is stopped.
Selecting [Lock Refresh] again from the popup menu cancels the stopped state.
Rev. 10.00 Oct. 15, 2009 Page 160 of 366
REJ10J1003-1000
Section 5 Debugging
5.5.4 Deleting the Monitor Settings
Selecting [Close] from the popup menu of the [Monitor] window to be deleted closes the
[Monitor] window and deletes the monitor settings.
5.5.5 Monitoring Variables
Using the [Watch] window refers to the value of any variables.
When the address of the variable registered in the [Watch] window exists within the monitoring
range that has been set by the Monitor function, the value of the variable can be updated and
displayed.
This function allows checking the content of a variable without affecting the realtime operation.
5.5.6 Hiding the [Monitor] Window
When using the Monitor function to monitor the value of a variable from the [Watch] window,
hide the [Monitor] window for the effective use of the screen.
The current monitoring information is listed as the submenu when selecting [Display -> CPU ->
Monitor]. The list consists of the [Monitor] window name and the address to start monitoring.
When the left of the list is checked, the [Monitor] window is being displayed.
Selecting items of the [Monitor] window you want to hide from the monitor setting list displays no
[Monitor] window and removes the check mark at the left of the list.
To display the [Monitor] window again, select the hidden the [Monitor] window.
Figure 5.20 Monitor Setting List
Rev. 10.00 Oct. 15, 2009 Page 161 of 366
REJ10J1003-1000
Section 5 Debugging
5.5.7 Managing the [Monitor] Window
Selecting [Display -> CPU -> Monitor -> Windows Select…] displays the [Windows Select]
dialog box. In this window, the current monitoring condition is checked and the new monitoring
condition is added, edited, and deleted in succession.
Selecting multiple monitoring conditions enables a temporary stop of update, hiding, and deletion.
Figure 5.21 [Windows Select] Dialog Box
[Add]:
Adds a new monitoring condition.
[Edit]:
Changes the settings of the selected [Monitor] window (disabled when selecting
multiple items).
[Lock Refresh/Unlock Refresh]:
Automatically updates or stops updating the display of the selected [Monitor]
window.
[Hide/UnHide]: Displays or hides the selected [Monitor] window.
[Remove]:
Removes the selected monitoring conditions.
[Close]:
Closes this dialog box.
Rev. 10.00 Oct. 15, 2009 Page 162 of 366
REJ10J1003-1000
Section 5 Debugging
5.6
Viewing the Current Status
Choose [View -> CPU -> Status] or click the [View Status] toolbar button (
[Status] window and see the current status of the debugging platform.
) to open the
Figure 5.22 [Status] Window
The [Status] window has three sheets:
• [Memory] sheet
Contains information about the current memory status including the memory-mapping
resources and the areas used by the currently loaded object file.
• [Platform] sheet
Contains information about the current status of the debugging platform, typically including
MCU type and emulation mode, and the state of execution.
• [Events] sheet
Contains information about the current event (breakpoint) status, including resource
information.
Rev. 10.00 Oct. 15, 2009 Page 163 of 366
REJ10J1003-1000
Section 5 Debugging
5.7
Reading and Displaying the Emulator Information Regularly
Use the [Extended Monitor] window to know the changing information on the emulator no matter
the user program is running or halted.
Note: The Extended Monitor function does not affect the execution of the user program since it
monitors the signal output from the user system or the MCU.
5.7.1 Opening the [Extended Monitor] Window
Selecting [View -> CPU -> Extended Monitor] or clicking the [Extended Monitor] toolbar button
(
) displays this window.
Figure 5.23 [Extended Monitor] Window
Note: The items that can be set in this window depend on the emulator in use. For details, refer
to the online help.
Rev. 10.00 Oct. 15, 2009 Page 164 of 366
REJ10J1003-1000
Section 5 Debugging
5.7.2 Selecting Items to be Displayed
Selecting [Properties…] from the popup menu displays the [Extended Monitor Configuration]
dialog box.
Figure 5.24 [Extended Monitor Configuration] Dialog Box
This dialog box allows the user to set the items to be displayed in the [Extended Monitor] window.
Rev. 10.00 Oct. 15, 2009 Page 165 of 366
REJ10J1003-1000
Section 5 Debugging
5.8
Using the Eventpoints
The emulator has the eventpoint function that performs breaking, tracing, and execution time
measurement by specifying more complex conditions along with the S/W breakpoints standard for
the High-performance Embedded Workshop.
5.8.1 S/W Breakpoints
When the instruction of the specified address is fetched, the user program is stopped. Up to 1000
points can be set.
5.8.2 Eventpoints
Eventpoints can be used for higher-level conditions such as the data condition as well as
specification of the single address. Up to four eventpoints can be set in the emulator.
(1) Onchip Eventpoint
This is a function that sets eventpoints according to the information in the MCU.
For an operation when an event is detected, break, internal trace acquisition/acquisition
start/acquisition stop, or internal performance measurement start/end can be specified.
A combination of one or more of the Onchip Eventpoints enables specifying more complex
sequential conditions.
This function can be set in the [Onchip Event] sheet of the [Event] window.
Note: The contents to be set will differ depending on the product. For details, refer to the on-line
help for each product.
(2) AUD Eventpoint
This is a function that sets eventpoints according to the information output from the AUD
interface. There are eight event detection channels.
For an operation when an event is detected, break, AUD trace acquisition/acquisition
start/acquisition stop, or AUD performance measurement start/end can be specified.
A combination of one or more of the AUD evenpoints enables specifying more complex
sequential conditions.
This function can be set in the [AUD Event] sheet of the [Event] window.
Rev. 10.00 Oct. 15, 2009 Page 166 of 366
REJ10J1003-1000
Section 5 Debugging
(3) BUS Eventpoint
This is a function that sets eventpoints according to the external bus of the MCU or information on
the pin such as an interrupt pin. There are six event detection channels.
For an operation when an event is detected, break or external bus trace acquisition/acquisition
start/acquisition stop can be specified.
A combination of one or more of the BUS evenpoints enables specifying more complex sequential
conditions.
This function can be set in the [BUS Event] sheet of the [Event] window.
Notes: 1. When the external bus trace unit is not connected to the emulator, this function is not
supported.
2. When the function of the external bus trace unit is changed, the number of event
detection channels is changed. For details, refer to section 5.1.5, [Bus Board] Page.
(4) Other Eventpoint
This function can be set in the [Other Event] sheet of the [Event] window.
(a) Execution time eventpoint
Eventpoints can be defined specifying the program execution time as the condition. There is
one event detection channel.
For an operation when an event is detected, break can be specified.
(b) External probe eventpoint
Eventpoints can be defined specifying four external probe signals via the probe cable as the
condition. There is one event detection channel.
For an operation when an event is detected, break or AUD trace acquisition/acquisition
start/acquisition stop can be specified.
Rev. 10.00 Oct. 15, 2009 Page 167 of 366
REJ10J1003-1000
Section 5 Debugging
5.8.3 Opening the [Event] Window
Select [View -> Code -> Eventpoints] or click the [Eventpoints] toolbar button (
[Event] window.
) to open the
The [Event] window has the following five sheets:
[Breakpoint] sheet:
Displays the settings made for S/W breakpoints. It is also possible to
set, modify, and cancel S/W breakpoints.
[Onchip Event] sheet:
Displays or sets the settings made for on-chip event channels.
[AUD Event] sheet:
Displays or sets the settings made for AUD event channels.
[BUS Event] sheet:
Displays or sets the settings made for external bus event channels.
[Other Event] sheet:
Displays or sets the settings made for other event channels.
Rev. 10.00 Oct. 15, 2009 Page 168 of 366
REJ10J1003-1000
Section 5 Debugging
5.8.4 Setting S/W Breakpoints
It is possible to display, modify, and add S/W breakpoints on the [Breakpoint] sheet.
Figure 5.25 [Event] Window ([Breakpoint] Sheet)
Items that can be displayed in the sheet are listed below.
[Type]
Breakpoint
[State]
Whether the breakpoint is enabled or disabled
[Condition] An address that the breakpoint is set
Address = Program counter (Corresponding file name, line, and symbol name)
[Action]
Operation of the emulator when a break condition is satisfied
Break: Breaks program execution
Rev. 10.00 Oct. 15, 2009 Page 169 of 366
REJ10J1003-1000
Section 5 Debugging
Select [Add...] or the S/W breakpoint displayed in this window and then select [Edit...] from the
popup menu to display the [Breakpoint] dialog box.
Figure 5.26 [Breakpoint] Dialog Box
This dialog box specifies address conditions of S/W breakpoints.
A breakpoint address to be set is specified in the [Value] edit box. The PC register can also be
specified such as #PC. Up to 1000 breakpoints can be specified.
The contents to be set differ depending on the product. For details, refer to the on-line help for
each product.
When [Value] is selected, if an overloaded function or class name including a member function is
specified in address, the [Select Function] dialog box opens.
Clicking the [OK] button sets the specified breakpoint conditions. Clicking the [Cancel] button
closes this dialog box without setting the break conditions.
Rev. 10.00 Oct. 15, 2009 Page 170 of 366
REJ10J1003-1000
Section 5 Debugging
5.8.5 Setting Onchip Eventpoints
On the [Onchip Event] sheet, the settings for Onchip Eventpoints are displayed and modified.
Figure 5.27 [Event] Window ([Onchip Event] Sheet)
Since the number of event detection channels and the contents to be set differ depending on the
product, refer to the online help for each product.
Items that can be displayed in the sheet are listed below.
[Type]
On-chip event channel number and type
[State]
Whether the eventpoint is enabled or disabled
[Condition] A condition that satisfies an eventpoint. The displayed contents differ depending on
the channel.
[Action]
Operation of the emulator when an eventpoint condition is satisfied. The displayed
contents differ depending on the channel.
Rev. 10.00 Oct. 15, 2009 Page 171 of 366
REJ10J1003-1000
Section 5 Debugging
When an event channel is double-clicked or selected and [Edit...] is selected from the popup menu
in this window, the [Event condition x] dialog box is opened and eventpoint conditions can be
modified.
Figure 5.28 [Event condition x] Dialog Box ([Address] Page)
For details on the [Event condition x] dialog box, refer to the online help for each product.
Rev. 10.00 Oct. 15, 2009 Page 172 of 366
REJ10J1003-1000
Section 5 Debugging
Setting Conditions on [Combination action]:
The user can set a sequential condition as the order of conditions on multiple channels being
satisfied. Selecting [Combination action] from the popup menu of the [Onchip Event] sheet opens
the [Combination action] dialog box, which allows the user to specify the order of conditions
being satisfied.
How to Set [Combination action]:
Figure 5.29 [Combination action] Dialog Box ([Ch 1,2,3] Combo Box)
Figure 5.30 [Combination action] Dialog Box ([Ch 4,5] Combo Box)
Rev. 10.00 Oct. 15, 2009 Page 173 of 366
REJ10J1003-1000
Section 5 Debugging
(a) Indicates the channel name for setting conditions.
(b) Select a condition from the followings.
[Don’t care]:
Sets no condition.
[Break:Ch 3-2-1]:
A break occurs when the conditions on channels 3, 2,
and 1 are satisfied in this order.
[Break:Ch 3-2-1, Reset point]:
A break occurs when the conditions on channels 3, 2,
and 1 are satisfied in this order. This condition is
reset when the reset point condition is satisfied.
[Break:Ch 2-1]:
A break occurs when the conditions on channels 2
and 1 are satisfied in this order.
[Break:Ch 2-1, Reset point]:
A break occurs when the conditions on channels 2
and 1 are satisfied in this order. This condition is
reset when the reset point condition is satisfied.
[I-Trace stop: Ch 3-2-1]:
Trace acquisition stops when the conditions on
channels 3, 2, and 1 are satisfied in this order.
[I-Trace stop: Ch 3-2-1, Reset point]: Trace acquisition stops when the conditions on
channels 3, 2, and 1 are satisfied in this order. This
condition is reset when the reset point condition is
satisfied.
[I-Trace stop: Ch 2-1]:
Trace acquisition stops when the conditions on
channels 2 and 1 are satisfied in this order.
[I-Trace stop: Ch 2-1, Reset point]:
Trace acquisition stops when the conditions on
channels 2 and 1 are satisfied in this order. This
condition is reset when the reset point condition is
satisfied.
[Ch 2 to Ch 1 PA]:
After the condition on channel 2 is satisfied, the
emulator analyzes the performance until the
condition on channel 1 is satisfied.
[Ch 1 to Ch 2 PA]:
After the condition on channel 1 is satisfied, the
emulator analyzes the performance until the
condition on channel 2 is satisfied.
[I-Trace: Ch 4 to Ch 5 PtoP]:
After the condition on channel 4 is satisfied, the
emulator acquires trace information until the
condition on channel 5 is satisfied.
[I-Trace: Ch 4 to Ch 5 PtoP,
After the condition on channel 4 is satisfied, the
Power on reset]:
emulator acquires trace information until the
condition on channel 5 is satisfied. A power-on reset
validates this condition.
Set the event condition for each channel in the [Event Condition] dialog box.
Rev. 10.00 Oct. 15, 2009 Page 174 of 366
REJ10J1003-1000
Section 5 Debugging
Usage Example of Sequential Break Extension Setting: A tutorial program provided for the
product is used as an example. For the tutorial program, refer to section 6, Tutorial.
The conditions of Event Condition are set as follows:
1. Ch1
Breaks address H’00001086 when the condition [Prefetch address break after executing] is
satisfied.
2. Ch2
Breaks address H’00001068 when the condition [Prefetch address break after executing] is
satisfied.
3. Ch3
Breaks address H’00001058 when the condition [Prefetch address break after executing] is
satisfied.
Note: Do not set other channels.
4. Set the contents of the [Ch1, 2, 3] list box for [Break: Ch 3-2-1] on the [Combination action]
dialog box.
5. Enable the condition of Event Condition 1 from the popup menu that is opened by rightclicking on the [Event Condition] sheet.
Rev. 10.00 Oct. 15, 2009 Page 175 of 366
REJ10J1003-1000
Section 5 Debugging
Then, set the program counter and stack pointer (PC = H’00000800, R15 = H’FFF9F000) in the
[Registers] window and click the [Go] button. If this does not execute normally, issue a reset and
execute the above procedures.
The program is executed up to the condition of Ch1 and halted. Here, the condition is satisfied in
the order of Ch3 -> 2 -> 1.
Figure 5.31 [Editor] Window at Execution Halted (Sequential Break)
Note: The items that can be set in the [Combination action] dialog box depend on the emulator
in use. For details, refer to the online help.
Rev. 10.00 Oct. 15, 2009 Page 176 of 366
REJ10J1003-1000
Section 5 Debugging
5.8.6 Setting AUD Eventpoints
On the [AUD Event] sheet, the settings for AUD Eventpoints are displayed and modified.
Figure 5.32 [Event] Window ([AUD Event] Sheet)
Using eight event detection channels sets eight eventpoints.
Notes: 1. Since the AUD eventpoint condition is set according to the information in the MCU
output from the AUD pin, the AUD trace information acquisition condition must be
set. Set the AUD trace information acquisition condition for the AUD eventpoint
condition.
2. When debugging is performed without any connection to the EV-chip unit, a break
function cannot be selected in AUD event.
Items that can be displayed in the sheet are listed below.
[Type]
AUD event channel number and type
Normal: Standard event channel
Delay: Event channel that delay conditions can be set
Reset: Event channel that can be set as the reset point of the AUD sequential
event
[State]
Whether the eventpoint is enabled or disabled
Enable: Valid
Disable: Invalid
Rev. 10.00 Oct. 15, 2009 Page 177 of 366
REJ10J1003-1000
Section 5 Debugging
[Condition] A condition that satisfies an eventpoint. The displayed contents differ depending on
the channel.
[Action]
Operation of the emulator when an eventpoint condition is satisfied. The displayed
contents differ depending on the channel.
When an event channel is double-clicked or selected and [Edit...] is selected from the popup menu
in this window, the [Chx] dialog box is displayed.
The [Chx] dialog box consists of the [General], [Branch], [Window], [Software], [SystemBus],
[Count], [Delay], and [Action] pages.
The combination of the conditions set in each page is set as the detection condition of eventpoints.
Rev. 10.00 Oct. 15, 2009 Page 178 of 366
REJ10J1003-1000
Section 5 Debugging
(1) [General] page
Specifies AUD trace information used to set the AUD Eventpoint condition.
Figure 5.33 [Chx (Delay)] Dialog Box ([General] Page)
[Branch trace data]:
Sets the eventpoint condition according to the branch trace
information.
[Window trace data]:
Sets the eventpoint condition according to the window trace
information.
[Software trace data]:
Sets the eventpoint condition according to the software trace
information.
Rev. 10.00 Oct. 15, 2009 Page 179 of 366
REJ10J1003-1000
Section 5 Debugging
(2) [Branch] page
Specifies the type and address conditions of the branch trace.
Figure 5.34 [Chx (Delay)] Dialog Box ([Branch] Page)
[Branch type]:
Sets branch types.
[Source/Destination]:
Sets no branch type.
[Source]:
Sets the branch-source address condition.
[Destination]:
Sets the branch-destination address condition.
[Address]:
Sets address conditions.
[Don’t care]:
Sets no address condition.
[Address]:
Sets the single address.
[Range]:
Sets the address range.
Rev. 10.00 Oct. 15, 2009 Page 180 of 366
REJ10J1003-1000
Section 5 Debugging
[Start]:
Sets the single address or the start address of the address range.
[End]:
Sets the end address of the address range.
[Outside]:
Sets other value than that has been set for the single address or address
range as the condition.
Notes: 1. This page is only displayed when [Branch trace data] is specified on the [General]
page.
2. The address range can only be specified for AUD event channels Ch1 and Ch2.
3. The mask address can be input for [Start] when the single address is specified.
4. The mask address cannot be input for [Start] and [End] when the address range is
specified.
Rev. 10.00 Oct. 15, 2009 Page 181 of 366
REJ10J1003-1000
Section 5 Debugging
(3) [Window] page
Specifies the address and data conditions of the window trace.
Figure 5.35 [Chx (Delay)] Dialog Box ([Window] Page)
[Address]:
Sets the address condition.
[Don’t care]:
Sets no address condition.
[Address]:
Sets the single address.
[Range]:
Sets the address range.
[Start]:
Sets the single address or the start address of the address range.
[End]:
Sets the end address of the address range.
[Outside]:
Sets other value than that has been set for the single address or address
range as the condition.
Rev. 10.00 Oct. 15, 2009 Page 182 of 366
REJ10J1003-1000
Section 5 Debugging
[Data]:
Sets the data condition.
[Don’t care]:
Sets no data condition.
[Read/Write]: Sets the read or write cycle as the condition.
[Read]:
Sets the read cycle as the condition.
[Write]:
Sets the write cycle as the condition.
[Value]:
Sets the data bus value (mask data can be input).
[Byte]:
Sets the byte access as the condition.
[Word]:
Sets the word access as the condition.
[32 bit]:
Sets the 32-bit access as the condition.
[64 bit]:
Sets the 64-bit access as the condition.
[Outside]:
Sets other value than that has been set for [Value] as the condition.
Notes: 1. This page is only displayed when [Window trace data] is specified on the [General]
page.
2. The address range can only be specified for AUD event channels Ch1 and Ch2.
3. The mask address can be input for [Start] when the single address is specified.
4. The mask address cannot be input for [Start] and [End] when the address range is
specified.
Rev. 10.00 Oct. 15, 2009 Page 183 of 366
REJ10J1003-1000
Section 5 Debugging
(4) [Software] page
Specifies the address and data conditions of the software trace.
Figure 5.36 [Chx (Delay)] Dialog Box ([Software] Page)
[Address]:
Sets the address condition.
[Don’t care]:
Sets no address condition.
[Address]:
Sets the single address.
[Range]:
Sets the address range.
[Start]:
Sets the single address or the start address of the address range.
[End]:
Sets the end address of the address range.
[Outside]:
Sets other value than that has been set for the single address or address
range as the condition.
Rev. 10.00 Oct. 15, 2009 Page 184 of 366
REJ10J1003-1000
Section 5 Debugging
[Data]:
Sets the data condition.
[Don’t care]:
Sets no data condition.
[Value]:
Sets the data bus value (mask data can be input).
[Outside]:
Sets other value than that has been set for [Value] as the condition.
Notes: 1. This page is only displayed when [Software trace data] is specified on the [General]
page.
2. The address range can only be specified for AUD event channels Ch1 and Ch2.
3. The mask address can be input for [Start] when the single address is specified.
4. The mask address cannot be input for [Start] and [End] when the address range is
specified.
Rev. 10.00 Oct. 15, 2009 Page 185 of 366
REJ10J1003-1000
Section 5 Debugging
(5) [Count] page
Specifies the satisfaction count conditions.
Figure 5.37 [Chx (Delay)] Dialog Box ([Count] Page)
[Don’t care]:
Sets no satisfaction count.
[numbers]:
Sets a value as the satisfaction count condition; D’1 to D’65535 is
available.
Note: If [Trace get] is selected on the [Action] page, this page will not be displayed.
Rev. 10.00 Oct. 15, 2009 Page 186 of 366
REJ10J1003-1000
Section 5 Debugging
(6) [Delay] page
Sets the delay cycle from the event detection to the AUD trace stop.
Figure 5.38 [Chx (Delay)] Dialog Box ([Delay] Page)
[Don’t care]:
Sets no delay condition.
[Delay]:
Sets the delay cycle counts; D’1 to D’262143 is available.
[Clock]:
Sets a cycle for delay measurement.
[100ns]:
Specifies 100 ns as one cycle.
[number of trace information]: Specifies a set of AUD trace information
as one cycle.
Note: This page is only displayed when AUD event channel Ch2 is selected and [Trace stop] is
specified on the [Action] page.
Rev. 10.00 Oct. 15, 2009 Page 187 of 366
REJ10J1003-1000
Section 5 Debugging
(7) [Action] page
Sets the operation after the condition has been satisfied.
Figure 5.39 [Chx (Reset)] Dialog Box ([Action] Page)
Rev. 10.00 Oct. 15, 2009 Page 188 of 366
REJ10J1003-1000
Section 5 Debugging
[Break]:
Breaks after conditions have been matched.
[Trace]:
Enables [Trace option] and sets the AUD trace operation.
[Trace start]: Starts AUD trace after conditions have been matched.
[Trace stop]: Stops AUD trace after conditions have been matched.
[Trace get]: Acquires AUD trace after conditions have been matched.
[Performance start]:
Starts or ends AUD performance measurement after conditions
have been matched. When this option is selected, [Performance
option] is enabled and the time interval of the performance
measurement can be specified.
Sampling time: Specifies the time interval of the AUD
performance measurement as any of the following values:
20 ns, 100 ns, 400 ns, or 1.6 μs
[Enable output trigger]: Specifies whether or not the trigger is output after conditions have
been matched.
Notes: 1. For AUD performance measurement, two AUD event channels are used to start and
stop measurement. When an event channel is specified for performance measurement,
the related channels (Ch1 to Ch2, Ch3 to Ch4, Ch5 to Ch6, and Ch7 to Ch8) must also
be specified.
2. The [Performance option] is only displayed for AUD event channels Ch1, Ch3, Ch5,
and Ch7.
Rev. 10.00 Oct. 15, 2009 Page 189 of 366
REJ10J1003-1000
Section 5 Debugging
(8) [Sequential AUD Event] dialog box
The sequential AUD event occurs when all the AUD Eventpoint conditions are satisfied in the
specified order.
AUD event channel Ch1 can be specified as the reset point. When the reset point is passed, the
satisfied eventpoint condition is disabled and checking the first eventpoint condition is started.
Figure 5.40 [Sequential AUD Event] Dialog Box
[Don’t care]:
Sets no sequential AUD event condition.
[Channel select]:
Specifies the order that the sequential AUD event is satisfied.
[Channel 3 -> 2]:
After conditions have been matched in the order of AUD event channel
3 -> 2, a sequential AUD event occurs.
[Channel 4 -> 3 -> 2]:
After conditions have been matched in the order of AUD event channel
4 -> 3 -> 2, a sequential AUD event occurs.
Rev. 10.00 Oct. 15, 2009 Page 190 of 366
REJ10J1003-1000
Section 5 Debugging
[Channel 5 -> 4 -> 3 -> 2]:
After conditions have been matched in the order of AUD event channel
5 -> 4 -> 3 -> 2, a sequential AUD event occurs.
[Channel 6 -> 5 -> 4 -> 3 -> 2]:
After conditions have been matched in the order of AUD event channel
6 -> 5 -> 4 -> 3 -> 2, a sequential AUD event occurs.
[Channel 7 -> 6 -> 5 -> 4 -> 3 -> 2]:
After conditions have been matched in the order of AUD event channel
7 -> 6 -> 5 -> 4 -> 3 -> 2, a sequential AUD event occurs.
[Channel 8 -> 7 -> 6 -> 5 -> 4 -> 3 -> 2]:
After conditions have been matched in the order of AUD event channel
8 -> 7 -> 6 -> 5 -> 4 -> 3 -> 2, a sequential AUD event occurs.
[Sequential reset]: Selects whether or not AUD event channel Ch1 is used as the reset
point.
[Disable]: Not used as the reset point.
[Enable]: Used as the reset point.
[Action]:
Specifies the operation after the sequential AUD event has been
detected.
[Break]: Breaks after the sequential AUD event has been detected.
[Trace stop]: Stops AUD trace after the sequential AUD event has been
detected.
Note: When the sequential AUD event condition is set and the eventpoint condition is edited
with the AUD event channel that has been selected for [Channel select], the [Action] page
cannot be modified. To modify the settings of the [Action] page, cancel the sequential
AUD event condition.
Rev. 10.00 Oct. 15, 2009 Page 191 of 366
REJ10J1003-1000
Section 5 Debugging
5.8.7 Setting BUS Eventpoints
On the [BUS Event] sheet, the settings for BUS Eventpoints are displayed and modified.
Figure 5.41 [Event] Window ([BUS Event] Sheet)
Using six event detection channels sets six eventpoints.
Notes: 1. When the external bus trace unit is not connected to the emulator, this function is not
supported.
2. When the debugging function of the external bus trace unit is set again, the number of
event detection channels changes.
Items that can be displayed in the sheet are listed below.
[Type]
External bus event channel number and type
Normal: Standard event channel
Delay: Event channel that delay conditions can be set
Reset: Event channel that can be set as the reset point of the external bus
sequential event
[State]
Whether the eventpoint is enabled or disabled
Enable: Valid
Disable: Invalid
Rev. 10.00 Oct. 15, 2009 Page 192 of 366
REJ10J1003-1000
Section 5 Debugging
[Condition] A condition that satisfies an eventpoint. The displayed contents differ depending on
the channel.
[Action]
Operation of the emulator when an eventpoint condition is satisfied. The displayed
contents differ depending on the channel.
When an event channel is double-clicked or selected and [Edit...] is selected from the popup menu
in this window, the [Chx] dialog box is displayed.
The [Chx] dialog box consists of the [Address], [Data], [Interrupt], [Count], [Delay], and [Action]
pages.
The combination of the conditions set in each page is set as the detection condition of eventpoints.
Rev. 10.00 Oct. 15, 2009 Page 193 of 366
REJ10J1003-1000
Section 5 Debugging
(1) [Address] page
Specifies the address condition.
Figure 5.42 [Chx (Delay)] Dialog Box ([Address] Page)
[Address]:
Sets the address condition.
[Don’t care]:
Sets no address condition.
[Address]:
Sets the single address.
[Range]:
Sets the address range.
[Start]:
Sets the single address or the start address of the address range (mask
address can be input).
[End]:
Sets the end address of the address range (mask address can be input).
[Outside]:
Sets other value than that has been set for the single address or address
range as the condition.
Rev. 10.00 Oct. 15, 2009 Page 194 of 366
REJ10J1003-1000
Section 5 Debugging
(2) [Data] page
Specifies the data bus condition.
Figure 5.43 [Chx (Delay)] Dialog Box ([Data] Page)
[Data]:
[Don’t care]:
Sets the data condition.
Sets no data condition.
[Read/Write]: Sets the read or write cycle as the condition.
[Read]:
Sets the read cycle as the condition.
[Write]:
Sets the write cycle as the condition.
[Value]:
Sets the data bus value (mask data can be input).
[Outside]:
Sets other value than that has been set for [Value] as the condition.
Rev. 10.00 Oct. 15, 2009 Page 195 of 366
REJ10J1003-1000
Section 5 Debugging
(3) [Interrupt] page
Specifies the signal conditions of NMI and external interrupts.
Figure 5.44 [Chx (Delay)] Dialog Box ([Interrupt] Page)
[Don’t care]:
Sets no signal condition.
[High]:
Satisfies a condition when the signal is high.
[Low]:
Satisfies a condition when the signal is low.
Note: The external interrupt signal differs depending on the supported MCU. For details, refer to
the online help.
Rev. 10.00 Oct. 15, 2009 Page 196 of 366
REJ10J1003-1000
Section 5 Debugging
(4) [Count] page
Specifies the satisfaction count condition.
Figure 5.45 [Chx (Delay)] Dialog Box ([Count] Page)
[Don’t care]:
Sets no satisfaction count.
[numbers]:
Sets a value as the satisfaction count condition; D’1 to D’65535 is
available.
Note: If [Trace get] is selected on the [Action] page, this page will not be displayed.
Rev. 10.00 Oct. 15, 2009 Page 197 of 366
REJ10J1003-1000
Section 5 Debugging
(5) [Delay] page
Sets the delay cycle from the event detection to the external bus trace stop.
Figure 5.46 [Chx (Delay)] Dialog Box ([Delay] Page)
[Don’t care]:
Sets no delay condition.
[Delay]:
Sets the delay cycle counts; D’1 to D’262143 is available.
Note: This page is only displayed when external bus event channel Ch2 is selected and [Trace
stop] is specified on the [Action] page.
Rev. 10.00 Oct. 15, 2009 Page 198 of 366
REJ10J1003-1000
Section 5 Debugging
(6) [Action] page
Sets the operation after the condition has been satisfied.
Figure 5.47 [Chx (Delay)] Dialog Box ([Action] Page)
[Break]:
Breaks after conditions have been matched.
[Trace]:
Enables [Trace option] and sets the external bus trace operation.
[Trace start]: Starts external bus trace after conditions have been matched.
[Trace stop]: Stops external bus trace after conditions have been matched.
[Trace get]: Acquires external bus trace after conditions have been
matched.
Rev. 10.00 Oct. 15, 2009 Page 199 of 366
REJ10J1003-1000
Section 5 Debugging
(7) [Sequential BUS Event] dialog box
The sequential bus event occurs when all the BUS Eventpoint conditions are satisfied in the
specified order.
Bus event channel Ch1 can be specified as the reset point. When the reset point is passed, the
satisfied eventpoint condition is disabled and checking the first eventpoint condition is started.
Figure 5.48 [Sequential BUS Event] Dialog Box
[Don’t care]:
Sets no Sequential BUS Event condition.
[Channel select]:
Specifies the order that the Sequential BUS Event is satisfied.
[Channel 3 -> 2]:
After conditions have been matched in the order of bus event channel 3
-> 2, a Sequential BUS Event occurs.
[Channel 4 -> 3 -> 2]:
After conditions have been matched in the order of bus event channel 4
-> 3 -> 2, a Sequential BUS Event occurs.
[Channel 5 -> 4 -> 3 -> 2]:
After conditions have been matched in the order of bus event channel 5
-> 4 -> 3 -> 2, a Sequential BUS Event occurs.
Rev. 10.00 Oct. 15, 2009 Page 200 of 366
REJ10J1003-1000
Section 5 Debugging
[Channel 6 -> 5 -> 4 -> 3 -> 2]:
After conditions have been matched in the order of bus event channel 6
-> 5 -> 4 -> 3 -> 2, a Sequential BUS Event occurs.
[Sequential reset]: Selects whether or not bus event channel Ch1 is used as the reset point.
[Disable]: Not used as the reset point.
[Enable]: Used as the reset point.
[Action]:
Specifies the operation after the Sequential BUS Event has been
detected.
[Break]: Breaks after the Sequential BUS Event has been detected.
[Trace stop]: Stops external bus trace after the Sequential BUS Event
has been detected.
Note: When the Sequential BUS Event condition is set and the eventpoint condition is edited
with the bus event channel that has been selected for [Channel select], the [Action] page
cannot be modified. To modify the settings of the [Action] page, cancel the Sequential
BUS Event condition.
Rev. 10.00 Oct. 15, 2009 Page 201 of 366
REJ10J1003-1000
Section 5 Debugging
5.8.8 Setting Other Eventpoints
On the [Other Event] sheet, the settings for Other Eventpoints are displayed and modified.
Figure 5.49 [Event] Window ([Other Event] Sheet)
Items that can be displayed in the sheet are listed below. The display content will be added
depending on the status of the optional units in use.
[Type]
Other event channel
Probe: External probe event channel
Runtime Count: Execution-time event channel
[State]
Whether the eventpoint is enabled or disabled
Enable: Valid
Disable: Invalid
[Condition] A condition that satisfies an eventpoint. The displayed contents differ depending on
the channel.
[Action]
Operation of the emulator when an eventpoint condition is satisfied. The displayed
contents differ depending on the channel.
When an event channel is double-clicked or selected and [Edit...] is selected from the popup menu
in this window, the dialog box for setting conditions is displayed. The displayed contents of this
dialog box differ depending on the event channel.
Rev. 10.00 Oct. 15, 2009 Page 202 of 366
REJ10J1003-1000
Section 5 Debugging
(1) [Probe] dialog box
Double-clicking the [Probe] event channel displays this dialog box. Conditions of the eventpoint
can be set on the [Condition] and [Action] pages.
(a) [Condition] page:
Specifies four external probe signal conditions via the external probe cable.
Figure 5.50 [Probe] Dialog Box ([Condition] Page)
[Operation]:
Specifies how to combine the probe signal conditions.
[AND]: Determines whether or not the condition is satisfied by AND
operation of the probe signal condition.
[OR]: Determines whether or not the condition is satisfied by OR operation
of the probe signal condition.
[Probe 1 to 4]:
Specifies the probe signal conditions.
[Don’t care]: Specifies no probe signal condition.
[High]:
Satisfies the condition when the probe signal is high.
[Low]:
Satisfies the condition when the probe signal is low.
Rev. 10.00 Oct. 15, 2009 Page 203 of 366
REJ10J1003-1000
Section 5 Debugging
(b) [Action] page:
Sets the operation after the condition has been satisfied.
Figure 5.51 [Probe] Dialog Box ([Action] Page)
[Break]:
Breaks after conditions have been matched.
[Trace]:
Enables [AUD trace option] and sets the AUD trace operation.
[Trace start]: Starts AUD trace after conditions have been matched.
[Trace stop]: Stops AUD trace after conditions have been matched.
[Trace filter]: Sets the filter condition for acquiring AUD trace after
conditions have been matched.
Rev. 10.00 Oct. 15, 2009 Page 204 of 366
REJ10J1003-1000
Section 5 Debugging
(2) [Runtime Count] dialog box
Double-clicking the [Runtime Count] event channel displays this dialog box. Conditions of the
eventpoint can be set on the [Condition] and [Action] pages.
(a) [Condition] page:
Specifies the execution time of the user program.
Figure 5.52 [Runtime Count] Dialog Box ([Condition] Page)
[The minimum time to be measured]:
[Runtime count]:
Specifies the resolution of the timer for execution time
measurement as any of the following values:
20 ns, 100 ns, 400 ns, or 1.6 μs
Specifies the execution time conditions.
[Don’t care]: Specifies no execution time condition.
[Cycle]: Enters the measurement cycle counts; D’0 to D’1099511627775 is
available.
Rev. 10.00 Oct. 15, 2009 Page 205 of 366
REJ10J1003-1000
Section 5 Debugging
(b) [Action] page:
Sets the operation after the condition has been satisfied.
Figure 5.53 [Runtime Count] Dialog Box ([Action] Page)
[Break]:
Breaks after conditions have been matched.
Rev. 10.00 Oct. 15, 2009 Page 206 of 366
REJ10J1003-1000
Section 5 Debugging
5.8.9
Editing Breakpoint or Eventpoint
Select a break condition to be modified, and choose [Edit...] from the popup menu to open the
dialog box for the point, which allows the user to modify the breakpoints or eventpoints. The
[Edit...] menu is only available when one breakpoint or eventpoint is selected.
5.8.10
Enabling Breakpoint or Eventpoint
Select a breakpoint or an eventpoint and choose [Enable] from the popup menu to enable the
selected breakpoint or eventpoint.
5.8.11
Disabling Breakpoint or Eventpoint
Select a breakpoint or an eventpoint and choose [Disable] from the popup menu to disable the
selected breakpoint or eventpoint. When a breakpoint or an eventpoint is disabled, a condition will
not be satisfied when the specified conditions have been satisfied.
5.8.12
Deleting Breakpoint or Eventpoint
Select a breakpoint or an eventpoint and choose [Delete] from the popup menu to delete the
selected breakpoint or eventpoint. To retain the break condition but not have it cause an event
when its conditions are met, use the [Disable] option (see section 5.8.11, Disabling Breakpoint or
Eventpoint).
5.8.13
Deleting All Breakpoints or Eventpoints
Choose [Delete All] from the popup menu to delete all breakpoints or eventpoints.
5.8.14
Viewing the Source Line for Breakpoints or Eventpoints
Select a breakpoint or an eventpoint and choose [Go to Source] from the popup menu to open the
[Editor] or [Disassembly] window at the address of the breakpoint or eventpoint. The [Go to
Source] menu is only available when one breakpoint or eventpoint that has the corresponding
source file is selected.
Rev. 10.00 Oct. 15, 2009 Page 207 of 366
REJ10J1003-1000
Section 5 Debugging
5.9
Viewing the Trace Information
In the emulator, there are functions to acquire information within and outside the MCU by a trace.
The emulator acquires three types of trace information: internal trace (Internal trace), AUD trace
(AUD trace), and external bus trace (BUS trace).
The information on the Internal trace and AUD trace is displayed on the [Internal/AUD] window.
The information on the BUS trace is displayed on the [BUS trace] window.
For the description on the trace function, refer to section 6.19, Trace Functions.
5.9.1 Opening the [Internal/AUD] Window
To display the [Trace Window Type] dialog box, choose [View -> Code -> Trace] or click the
[Trace] toolbar button ( ).
Figure 5.54 [Trace Window Type] Dialog Box
Selecting [Internal/AUD] and clicking the [OK] button displays the [Internal/AUD] window.
Rev. 10.00 Oct. 15, 2009 Page 208 of 366
REJ10J1003-1000
Section 5 Debugging
(1) Acquiring Internal Trace Information (Internal trace)
Selecting the [Set…] menu in the popup menu of the [Internal/AUD] window displays the [ITrace/AUD-Trace acquisition] dialog box. When [Internal trace] is selected in [Trace Type]
within the dialog box, the trace information is acquired by using the internal trace function.
When the emulator does not set the acquisition condition of the trace information, the trace
information is acquired by the internal trace function in default.
The acquired trace information is displayed in the [Internal/AUD] window.
Figure 5.55 [Internal/AUD] Window (Type 1) (Internal Trace)
Some MCUs to be debugged display the items below. For details on the specifications of each
product, refer to the additional document, Supplementary Information on Using the SHxxxx, or
the online help.
[PTR]
The trace buffer pointer (+0 for the last executed instruction)
[IP]
The amount of acquired trace information
[Master] (Bus Master)
Type of bus master accessed
[Type]
Type of trace information:
BRANCH: Branch source
DESTINATION: Branch destination
MEMORY: Memory access
S_TRACE: Executed Trace(x) function
LOST: Lost trace information (only in the realtime mode)
[Branch Type]
Type of branch (only when the branch trace is acquired):
GENERAL: General branch
SUBROUTINE: Subroutine branch
EXCEPTION: Exception branch
Rev. 10.00 Oct. 15, 2009 Page 209 of 366
REJ10J1003-1000
Section 5 Debugging
[Bus]
The bus which was being accessed
[R/W]
Whether the generated data is associated with read or write access
[Address]
Address
[Data]
The data of the generated data access. When [Type] is S_TRACE, value x, a
variable of function Trace(x), is displayed.
[Instruction]
Instruction mnemonic
[Source]
The C/C++ or assembly-language source program
[Label]
Label information
Rev. 10.00 Oct. 15, 2009 Page 210 of 366
REJ10J1003-1000
Section 5 Debugging
(2) Acquiring AUD Trace Information (AUD trace)
Selecting the [Set…] menu in the popup menu of the [Internal/AUD] window displays the [ITrace/AUD-Trace acquisition] dialog box. When [AUD trace] is selected in [Trace Type] within
the dialog box, the trace information is acquired by using the AUD trace function.
Figure 5.56 [Internal/AUD] Window (Type 2) (AUD Trace)
This window displays the following trace information items (some of this information will not be
displayed in some products):
[PTR]
The AUD trace buffer pointer (+0 for the last executed instruction)
[IP]
The amount of acquired trace information
[Type]
Type of trace information:
BRANCH: Branch source
DESTINATION: Branch destination
MEMORY: Memory access
S_TRACE: Executed Trace(x) function
LOST: Lost trace information (only in the realtime mode)
[Bus]
The bus which was being accessed
[R/W]
Whether the generated data is associated with read or write access
[Address]
Address
Rev. 10.00 Oct. 15, 2009 Page 211 of 366
REJ10J1003-1000
Section 5 Debugging
[Data]
The data of the generated data access. When [Type] is S_TRACE, value x, a
variable of function Trace(x), is displayed.
[Instruction]
Instruction mnemonic
[Timestamp]
Time stamp value
[Source]
The C/C++ or assembly-language source program
[Label]
Label information
[Timestamp-Difference] Difference value of the time stamp
Note: Since the displayed contents differ depending on the product, refer to each product’s
online help. Some MCUs supported may not have the AUD trace function.
Rev. 10.00 Oct. 15, 2009 Page 212 of 366
REJ10J1003-1000
Section 5 Debugging
(3) Specifying Conditions or Modes for Acquiring Trace Information
The capacity of the trace buffer is limited. When the buffer becomes full, the oldest trace
information is overwritten. Setting the trace acquisition condition allows acquisition of useful
trace information and effective use of the trace buffer.
The trace information acquisition conditions are implemented by eventpoints, and acquisition
start, acquisition end, and acquisition can be controlled. For setting eventpoints, refer to section
5.8, Using the Eventpoints.
The trace information acquisition mode is set in the [I-Trace/AUD-Trace acquisition] dialog box
that is displayed by selecting [Set…] from the popup menu.
Rev. 10.00 Oct. 15, 2009 Page 213 of 366
REJ10J1003-1000
Section 5 Debugging
Figure 5.57 [I-Trace/AUD-Trace acquisition] Dialog Box
Rev. 10.00 Oct. 15, 2009 Page 214 of 366
REJ10J1003-1000
Section 5 Debugging
[Trace type]:
Selects the type of trace function.
[I-Trace]
Selects the internal trace function.
[AUD function]
Selects the AUD trace function.
[I-Trace mode]:
Sets the mode when the internal trace function is used.
[Type]
When checked, the bus and branch are selected and set as the
condition for acquiring trace.
[Acquisition]
When those boxes are checked, only the internal information that
matches the checked condition are acquired.
[When trace buffer full]
Selects the operation when the trace buffer becomes full.
[Trace continue]
[Trace stop]
[Break]
[AUD mode]:
Overwrites the old trace information to
acquire the latest trace information.
Acquires no information.
A break occurs.
Sets the mode when the AUD trace function is used.
[Branch trace]
When checked, the branch source and destination addresses are
set as the condition.
[Window trace]
Uses the window trace function. When this box is checked,
information on memory accesses within the specified range is
acquired.
[AUD mode 1]
Selects the operating mode for consecutive trace acquisition.
[Realtime trace]
Some trace information are not acquired.
[Non realtime trace] The CPU stops operations until the
acquisition is completed.
[AUD mode 2]
Selects the operation when the trace buffer becomes full.
[Trace continue]
[Trace stop]
[Break]
[AUD mode 3]
Overwrites the old trace information to
acquire the latest trace information.
Acquires no information.
A break occurs.
Sets the mode when the AUD trace function is used.
[Enable free trace] When checked, the settings of the AUD
eventpoint are ignored and the whole
trace information is acquired.
[Time stamp clock] Specifies the resolution of the timer for
time stamp as any of the following values:
20 ns, 100 ns, 400 ns, or 1.6 μs
Rev. 10.00 Oct. 15, 2009 Page 215 of 366
REJ10J1003-1000
Section 5 Debugging
[AUD trace display range]: Sets the trace display range when the AUD trace function is
used.
[Start pointer]
Enter the numerical start pointer value of the
display range.
[End pointer]
Enter the numerical end pointer value of the
display range.
Notes: 1. When [Internal trace] is selected, [AUD MODE], [AUD mode 1], [AUD mode 2],
[AUD mode 3], and [AUD trace display range] are disabled.
2. [AUD MODE], [AUD mode 1], [AUD mode 2], [AUD mode 3], and [AUD trace
display range] are enabled only when [AUD trace] is selected.
3. Refer to the online help of each product because available trace acquisition conditions
depend on the product.
4. Some MCUs do not have the AUD trace function.
Clicking the [OK] button stores the settings. Clicking the [Cancel] button closes this dialog box
without modifying the settings.
Rev. 10.00 Oct. 15, 2009 Page 216 of 366
REJ10J1003-1000
Section 5 Debugging
5.9.2 Opening the [BUS trace] Window
To display the [Trace Window Type] dialog box, choose [View -> Code -> Trace] or click the
[Trace] toolbar button ( ).
Figure 5.58 [Trace Window Type] Dialog Box
Selecting [BUS trace] and clicking the [OK] button displays the [BUS trace] window.
Notes: 1. When the external bus trace unit is not connected to the emulator, the external bus trace
function is not supported.
2. When the function of the external bus trace unit is changed, the number of bus cycles
that can be acquired by the external bus trace is changed. For details, refer to section
5.1.5, [Bus Board] Page.
3. Not only the BUS trace but also other trace functions can be displayed in this window
depending on the product. For details on the specifications of each product, refer to the
online help.
Rev. 10.00 Oct. 15, 2009 Page 217 of 366
REJ10J1003-1000
Section 5 Debugging
5.9.3 Acquiring External Bus Trace Information (BUS trace)
Selecting the [Set…] menu in the popup menu of the [BUS trace] window displays the [BUS
acquisition] dialog box. When [BUS trace] is selected in [Trace Type] within the dialog box, the
trace information is acquired by using the external bus trace function.
When the emulator does not set the acquisition condition of the trace information, the trace
information is acquired by the external bus trace function in default.
The acquired trace information is displayed in the [BUS trace] window.
Figure 5.59 [BUS trace] Window (Type 1) (BUS Trace)
Items that can be displayed in this window are listed below. For details on the specifications of
each product, refer to the online help.
[PTR]
The bus trace buffer pointer (+0 for the last executed instruction)
[IP]
The amount of acquired trace information
[R/W]
Whether the generated data is associated with read or write access
[Address]
Address
[Data]
The data bus value
[Timestamp]
Time stamp of bus cycle
[Source]
The C/C++ or assembly-language source program
Rev. 10.00 Oct. 15, 2009 Page 218 of 366
REJ10J1003-1000
Section 5 Debugging
[Label]
Label information
[Timestamp-Difference] Difference value of the time stamp
5.9.4 Specifying Conditions or Modes for Acquiring Trace Information
The capacity of the trace buffer is limited. When the buffer becomes full, the oldest trace
information is overwritten. Setting the trace acquisition condition allows acquisition of useful
trace information and effective use of the trace buffer.
The trace information acquisition conditions are implemented by eventpoints and acquisition start,
acquisition end, and acquisition can be controlled. For setting eventpoints, refer to section 5.8,
Using the Eventpoints.
The trace information acquisition mode is set in the [BUS acquisition] dialog box that is displayed
by selecting [Set…] from the popup menu.
Rev. 10.00 Oct. 15, 2009 Page 219 of 366
REJ10J1003-1000
Section 5 Debugging
Figure 5.60 [BUS acquisition] Dialog Box
Rev. 10.00 Oct. 15, 2009 Page 220 of 366
REJ10J1003-1000
Section 5 Debugging
[Trace type]:
Selects the type of trace acquisition.
[BUS buffer over flow]:
Specifies the operation when the external bus trace buffer of the
emulator becomes full.
[Trace continue]
The oldest trace information is overwritten by the latest
information.
[Trace stop]
When the trace buffer becomes full, the trace information is no
longer acquired.
[Break]
A break occurs.
[BUS trace mode]:
Sets the mode when the external bus trace function is used.
[Enable free trace]
Enables external-bus free trace.
[Time stamp clock]
Specifies the resolution of the timer for time stamp as any of the
following values:
20 ns, 100 ns, or 400 ns
[Trace display range]:
Sets the trace display range.
[Start pointer]
Enters the numerical start pointer value of the display range.
[End pointer]
Enters the numerical end pointer value of the display range.
Note: In some products, this window allows settings of other trace functions as well as the bus
trace function. For specifications of each product, refer to the online help.
5.9.5 Hiding the [Trace] Column
It is possible to hide any column not necessary in the [Trace] window. Selecting a column you
want to hide from the popup menu displayed by clicking the right-hand mouse button on the
header column hides that column. To display the hidden column, select the column from the said
popup menu again. Dragging the column with the mouse changes the display order.
Rev. 10.00 Oct. 15, 2009 Page 221 of 366
REJ10J1003-1000
Section 5 Debugging
5.9.6 Searching for a Trace Record
Use the [Trace Find] dialog box to search for a trace record. To open this dialog box, choose
[Find...] from the popup menu.
The [Trace Find] dialog box has the following options:
Table 5.2
[Trace Find] Dialog Box Pages
Page
Description
[General]
Sets the range for searching.
[Address]
Sets an address condition.
[Data]
Sets a data condition.
[Type]
Selects the type of trace information.
[Bus]
Selects the type of a bus.
[R/W]
Selects the type of access cycles.
Note: Items other than [General] and [Address] depend on the emulator in use. For details, refer
to the online help.
Clicking the [OK] button after setting conditions in those pages stores the settings and starts
searching. Clicking the [Cancel] button closes this dialog box without setting conditions.
When a trace record that matches the search conditions is found, the line for the trace record will
be highlighted. When no matching trace record is found, a message dialog box will appear.
Only the trace information that satisfies all the conditions set in above pages will be searched.
If a search operation is successful, selecting [Find Next] from the popup menu will move to the
next found item.
Rev. 10.00 Oct. 15, 2009 Page 222 of 366
REJ10J1003-1000
Section 5 Debugging
(1) [General] page
Set the range for searching.
Figure 5.61 [Trace Find] Dialog Box ([General] Page)
[Trace search range]:
Sets the range for searching.
[Not designation]:
Searches for information that does not match the conditions
set in other pages when this box is checked.
[Upward search]:
Searches upwards when this box is checked.
[Start PTR]:
Enters a PTR value to start a search.
[End PTR]:
Enters a PTR value to end a search.
Note: Along with setting the range for searching, PTR values to start and end searching can be
set in the [Start PTR] and [End PTR] options, respectively.
Rev. 10.00 Oct. 15, 2009 Page 223 of 366
REJ10J1003-1000
Section 5 Debugging
(2) [Address] page
Set an address condition.
Figure 5.62 [Trace Find] Dialog Box ([Address] Page)
[Don't care]:
Detects no address when this box is checked.
[Setting]:
Detects the specified address.
[Value]:
Enter the address value (not available when [Don’t care] has been
checked).
Rev. 10.00 Oct. 15, 2009 Page 224 of 366
REJ10J1003-1000
Section 5 Debugging
(3) [Data] page
Set a data condition.
Figure 5.63 [Trace Find] Dialog Box ([data] Page)
[Don't care]:
Detects no data when this box is checked.
[Setting]:
Detects the specified data.
[Value]:
Enter the data value (not available when [Don’t care] has been checked).
Rev. 10.00 Oct. 15, 2009 Page 225 of 366
REJ10J1003-1000
Section 5 Debugging
(4) [R/W] page
Select the type of access cycles.
Figure 5.64 [Trace Find] Dialog Box ([R/W] Page)
[Don't care]:
Detects no read/write condition when this box is checked.
[Setting]:
Detects the specified read/write condition.
[String]:
Select a read/write condition (not available when [Don’t care] has been
checked).
READ: Read cycle
WRITE: Write cycle
Rev. 10.00 Oct. 15, 2009 Page 226 of 366
REJ10J1003-1000
Section 5 Debugging
(5) [Type] page
Select the type being accessed. The selection is not available when a time stamp is acquired.
Figure 5.65 [Trace Find] Dialog Box ([Type] Page)
[Don't care]:
Detects no type condition when this box is checked.
[Setting]:
Detects the specified type condition.
[String]:
Select a type condition (not available when [Don’t care] has been
checked).
Rev. 10.00 Oct. 15, 2009 Page 227 of 366
REJ10J1003-1000
Section 5 Debugging
(6) [Bus] page
Select the status of a bus.
Figure 5.66 [Trace Find] Dialog Box ([Bus] Page)
[Don't care]:
Detects no bus condition when this box is checked.
[Setting]:
Detects the specified bus condition.
[String]:
Select a bus condition (not available when [Don’t care] has been
checked).
Rev. 10.00 Oct. 15, 2009 Page 228 of 366
REJ10J1003-1000
Section 5 Debugging
5.9.7
Clearing the Trace Information
When [Clear] is selected from the popup menu, the trace buffer that stores the trace information
becomes empty.
5.9.8 Saving the Trace Information in a File
Select [Save...] from the popup menu to open the [Save As] file dialog box, which allows the user
to save the information displayed in the [Trace] window as a text file. A range can be specified
based on the [PTR] number (saving the complete buffer may take several minutes). Note that this
file cannot be reloaded into the [Trace] window.
Note: In filtering of trace information, the range to be saved cannot be selected. All the trace
information displayed in the [Trace] window after filtering will be saved. Select a filtering
range on the [General] page in the [Trace Filter] dialog box if you want to save the
selected range. For details on the filtering function, refer to section 5.9.13, Extracting
Records from the Acquired Information.
5.9.9
Viewing the [Editor] Window
The [Editor] window corresponding to the selected trace record can be displayed in the following
two ways:
• Select a trace record and choose [View Source] from the popup menu.
• Double-click a trace record.
The [Editor] or [Disassembly] window opens and the selected line is marked with a cursor.
5.9.10 Trimming the Source
Choose [Trim Source] from the popup menu to remove the white space from the left side of the
source.
When the white space is removed, a check mark is shown to the left of the [Trim Source] menu.
To restore the white space, choose [Trim Source] while the check mark is shown.
Rev. 10.00 Oct. 15, 2009 Page 229 of 366
REJ10J1003-1000
Section 5 Debugging
5.9.11 Temporarily Stopping Trace Acquisition
To temporarily stop trace acquisition during execution of the user program, select [Halt] from the
popup menu. This stops trace acquisition and updates the trace display. Use this method to check
the trace information without stopping execution of the user program.
5.9.12 Restarting Trace Acquisition
To restart trace acquisition being stopped during execution of the user program, select [Restart]
from the popup menu.
5.9.13 Extracting Records from the Acquired Information
Use the filtering function to extract the records you need from the acquired trace information. The
filtering function allows the trace information acquired by hardware to be filtered by software.
Unlike the settings made in the [Trace Acquisition] dialog box for acquiring trace information by
conditions, changing the settings for filtering several times to filter the acquired trace information
allows easy extraction of necessary information, which is useful for analysis of data. The content
of the trace buffer will not be changed even when the filtering function is used. Acquiring useful
information as much as possible by the [Trace Acquisition] settings improves the efficiency in
analysis of data because the capacity of the trace buffer is limited.
Use the filtering function in the [Trace Filter] dialog box. To open the [Trace Filter] dialog box,
select [Filter…] from the popup menu.
The [Trace Filter] dialog box has the following pages:
Table 5.3
[Trace Filter] Dialog Box Pages
Page
Description
[General]
Selects the range for filtering.
[Address]
Sets address conditions.
[Data]
Sets data conditions.
[Type]
Selects the type of trace information.
[Bus]
Selects the type of a bus.
[R/W]
Selects the type of access cycles.
Note: Items other than [General] and [Address] depend on the emulator in use. For details, refer
to the online help.
Rev. 10.00 Oct. 15, 2009 Page 230 of 366
REJ10J1003-1000
Section 5 Debugging
Set filtering conditions and then press the [OK] button. This starts filtering according to the
conditions. Clicking the [Cancel] button closes the [Trace Filter] dialog box, which holds the
settings at the time when the dialog box was opened.
In filtering, only the trace information that satisfies one or more filtering conditions set in the
above pages will be displayed in the [Trace] window.
Filtering conditions can be changed several times to analyze data because the content of the trace
buffer is not changed by filtering.
Rev. 10.00 Oct. 15, 2009 Page 231 of 366
REJ10J1003-1000
Section 5 Debugging
(1) [General] page
Set the range for filtering.
Figure 5.67 [Trace Filter] Dialog Box ([General] Page)
[Don't care other pages]: Only selects the cycle number when this box is checked. Other options
become invalid.
[Enable Filter]:
Enables the filter when this box is checked.
[Not designation]:
Filters information that does not match the conditions set in those pages
when this box is checked.
[Trace display range]:
Sets the range for filtering.
[Start PTR]:
[End PTR]:
Enters a PTR value to start filtering.
Enters a PTR value to end filtering.
Note: Along with setting the range for filtering, PTR values to start and end filtering can be set
in the [Start PTR] and [End PTR] options, respectively.
Rev. 10.00 Oct. 15, 2009 Page 232 of 366
REJ10J1003-1000
Section 5 Debugging
(2) [Address] page
Set address conditions.
Figure 5.68 [Trace Filter] Dialog Box ([Address] Page)
[Don't care]:
Detects no address when this box is checked.
[Setting]:
Detects the specified address.
[Point]: Specifies a single address (not available when [Don’t care] has been checked).
[Range]: Specifies an address range (not available when [Don’t care] has been checked).
[From]: Enter a single address or the start of the address range (not available when
[Don’t care] has been checked).
[To]:
Enter a single address or the end of the address range (only available when
[Range] has been selected).
Note: Along with setting the address range, the start and end of the address range can be set in
the [From] and [To] options, respectively.
Rev. 10.00 Oct. 15, 2009 Page 233 of 366
REJ10J1003-1000
Section 5 Debugging
(3) [Data] page
Set a data condition.
Figure 5.69 [Trace Filter] Dialog Box ([data] Page)
[Don't care]:
Detects no data when this box is checked.
[Setting]:
Detects the specified data.
[Point]: Specifies single data (not available when [Don’t care] has been checked).
[Range]: Specifies a data range (not available when [Don’t care] has been checked).
[From]: Enter single data or the minimum value of the data range (not available when
[Don’t care] has been checked).
[To]:
Enter the maximum value of the data range (only available when [Range] has
been selected).
Note: Along with setting the data range, the minimum and maximum values can be set in the
[From] and [To] options, respectively.
Rev. 10.00 Oct. 15, 2009 Page 234 of 366
REJ10J1003-1000
Section 5 Debugging
(4) [R/W] page
Select the type of access cycles.
Figure 5.70 [Trace Filter] Dialog Box ([R/W] Page)
[Don't care]:
Detects no read/write condition when this box is checked.
[Setting]:
Detects the specified read/write condition.
READ:
Detects read cycles when this box is checked (not available when
[Don’t care] has been checked).
WRITE: Detects write cycles when this box is checked (not available when
[Don’t care] has been checked).
Rev. 10.00 Oct. 15, 2009 Page 235 of 366
REJ10J1003-1000
Section 5 Debugging
(5) [Type] page
Select the type being accessed. The selection is not available when a time stamp is acquired.
Figure 5.71 [Trace Filter] Dialog Box ([Type] Page)
[Don't care]:
Detects no type condition when this box is checked.
[Setting]:
Detects the specified type condition (not available when [Don’t care] has been
checked).
Rev. 10.00 Oct. 15, 2009 Page 236 of 366
REJ10J1003-1000
Section 5 Debugging
(6) [Bus] page
Select the status of a bus. The selection is not available when a time stamp is acquired.
Figure 5.72 [Trace Filter] Dialog Box ([Bus] Page)
[Don't care]:
Detects no bus condition when this box is checked.
[Setting]:
Detects the specified bus condition (not available when [Don’t care] has been
checked).
Rev. 10.00 Oct. 15, 2009 Page 237 of 366
REJ10J1003-1000
Section 5 Debugging
5.9.14 Analyzing Statistical Information
Choose [Statistic…] from the popup menu to open the [Statistic] dialog box and analyze statistical
information under the specified conditions.
Figure 5.73 [Statistic] Dialog Box
[Statistic Analysis]:
Setting required for analysis of statistical information.
[Default]:
Sets a single input value or character string.
[Range]:
Sets the input value or character string as a range.
[Item]:
Sets the item for analysis.
[Start]:
Sets the input value or character string. To set a range, the start value
must be specified here.
Rev. 10.00 Oct. 15, 2009 Page 238 of 366
REJ10J1003-1000
Section 5 Debugging
[End]:
Specify the end value if a range has been set (only available when
[Range] has been selected).
[Set]:
Adds a new condition to the current one.
[New]:
Creates a new condition.
[Result] button: Obtains the result of statistical information analysis.
[Clear]:
Initializes the settings.
[Result] list box: Clears all conditions and results of statistical information analysis.
[Close]:
Closes this dialog box. All the results displayed in the [Result] list will
be cleared.
This dialog box allows the user to analyze statistical information concerning the trace information.
Set the target of analysis in [Item] and the input value or character string by [Start] and [End].
Click the [Result] button after setting a condition by pressing the [New] or [Add] button to
analyze the statistical information and display its result in the [Result] list.
Note: In this emulator, only [PTR] can be set as a range. Each of other items must be specified
as a character string. In analysis of statistical information, character strings are compared
with those displayed in the [Trace] window. Only those that completely match are
counted. Note, however, that this test is not case sensitive. The number of blanks will not
be cared either.
Rev. 10.00 Oct. 15, 2009 Page 239 of 366
REJ10J1003-1000
Section 5 Debugging
5.9.15 Extracting Function Calls from the Acquired Trace Information
To extract function calls from the acquired trace information, select [Function Call…] from the
popup menu. The [Function Call Display] dialog box will be displayed.
Figure 5.74 [Function Call Display] Dialog Box
[Setting]:
Selects whether or not to extract function calls.
[Enable]:
Extracts function calls.
[Disable]:
Does not extract function calls.
When [Enable] is selected, only the cycles that include function calls are extracted for display
from the acquired trace information. The content of the trace buffer is not changed by extraction of
function calls. Using this function for the trace information that includes function calls allows the
user to know the order of function calls.
Rev. 10.00 Oct. 15, 2009 Page 240 of 366
REJ10J1003-1000
Section 5 Debugging
5.10 Viewing the Cache Contents
The [Cache] window is used to display the cache contents in an MCU with cache. The [Cache]
window differs according to the MCU. Read the description corresponding to the MCU.
5.10.1 Opening the [Cache] Window
Figure 5.75 [Cache] Window
Choose [View -> CPU -> Cache] or click the [Cache] toolbar button [ ] to open the [Select
Cache] dialog box (figure 5.76) for selecting the cache window type to be displayed.
Figure 5.76 [Select Cache] Dialog Box
Rev. 10.00 Oct. 15, 2009 Page 241 of 366
REJ10J1003-1000
Section 5 Debugging
This dialog box selects the cache to be displayed. Select one of the following cache types:
[Instruction cache]
Opens the instruction cache window.
[Operand cache]
Opens the operand cache window.
Clicking the [OK] button displays the selected cache window. Clicking the [Cancel] button closes
the dialog box without opening the [Cache] window.
The following items are displayed in the [Instruction Cache] window:
[Entry]
Entry number in the instruction cache (depends on the cache capacity)
[V]
Validity bit. When this bit is 1, the entry is valid.
[U]
Update bit. When this bit is 1, the entry has been written to.
[Tag Address]
Tag address
[Longword0] to
[Longword4]
Longword data 0 to 4 set to the operand cache entry
5.10.2 Modifying the Cache Contents
Selecting [Modify…] from the pop-up menu with a cache item selected opens the dialog box to
modify the selected cache item.
Note that during execution of an instruction, the [Modify…] menu is disabled and the cache items
cannot be modified.
Figure 5.77 [Set Tag Address] Dialog Box
This dialog box allows the currently selected cache item to be modified. The selected cache item
and entry number are displayed in the caption of the dialog box. The way number is also displayed
for a cache with ways. The item name in the dialog box displays the selected cache item.
Rev. 10.00 Oct. 15, 2009 Page 242 of 366
REJ10J1003-1000
Section 5 Debugging
Clicking the [OK] button stores the newly entered contents in the cache. Clicking the [Cancel]
button closes the dialog box without storing the newly entered contents in the cache.
A value can be directly input in the window.
5.10.3 Flushing the Cache Contents
Selecting [Flush] from the pop-up menu flushes cache. All V, U, and LRU bits are cleared to 0
and all cache entries are invalidated.
Note that during execution of an instruction, the [Flush] menu is disabled and cache cannot be
flushed.
5.10.4 Searching the Cache Items
Selecting [Find…] from the pop-up menu opens the [Find Cache] dialog box in which a cache
item can be searched for in column units.
Note that during execution of an instruction, the [Find…] menu is disabled and the cache item
cannot be searched for.
Figure 5.78 [Find Cache] Dialog Box
This dialog box searches for a cache item. The following search conditions can be specified:
[Find Column]
Item to be searched for
[Find Value]
Value to be searched for
After setting the search conditions, the search can be started by clicking the [OK] button. As a
result, the matching entry is highlighted.
Rev. 10.00 Oct. 15, 2009 Page 243 of 366
REJ10J1003-1000
Section 5 Debugging
Clicking the [Cancel] button closes the dialog box without searching for a cache item.
5.10.5 Continuing the Cache Search
The next matching cache item can be searched for with the search conditions that have previously
been set. In the state where a matching cache item was found in the preceding search, select [Find
Next] from the pop-up menu.
Note that during execution of an instruction, the [Find Next] menu is disabled and the next
matching cache item cannot be searched for.
5.10.6 Saving the Currently Displayed Contents
The contents currently displayed in the window can be saved in a text file. Select [Save to File…]
from the pop-up menu.
Rev. 10.00 Oct. 15, 2009 Page 244 of 366
REJ10J1003-1000
Section 5 Debugging
5.11
Analyzing Performance
Use the performance analysis function to measure execution performance.
The emulator has two types of performance analysis functions: on-chip performance analysis
(Onchip Performance Analysis) and AUD performance analysis (AUD Performance Analysis).
5.11.1 Opening the [Onchip Performance Analysis] Window
To open the [Onchip Performance Analysis] window, choose [View -> Performance ->
Performance Analysis] or click the [PA] toolbar button ( ) to open the [Select Performance
Analysis Type] dialog box.
Figure 5.79 [Select Performance Analysis Type] Dialog Box
Select [Onchip Performance] and click the [OK] button to open the [Performance Analysis]
window.
Figure 5.80 [Performance Analysis] Window (Onchip Performance)
The Onchip Performance Analysis function does not affect the realtime operation because it uses
the performance measurement function in the MCU.
Rev. 10.00 Oct. 15, 2009 Page 245 of 366
REJ10J1003-1000
Section 5 Debugging
Note: The measurement conditions and the number of channels for the on-chip performance
analysis function differ depending on the product. For details, refer to the online help of
each product.
When a measurement channel is double-clicked or selected and [Set...] is selected from the popup
menu in this window, the [Performance Analysis] dialog box is opened and measurement
conditions can be modified.
Figure 5.81 [Performance Analysis] Dialog Box
For details on the [Performance Analysis] dialog box, refer to the online help for each product.
Rev. 10.00 Oct. 15, 2009 Page 246 of 366
REJ10J1003-1000
Section 5 Debugging
5.11.2 Opening the [AUD Performance Analysis] Window
To open the [AUD Performance Analysis] window, choose [View -> Performance -> Performance
Analysis] or click the [PA] toolbar button ( ) to open the [Select Performance Analysis Type]
dialog box.
Figure 5.82 [Select Performance Analysis Type] Dialog Box
Select [AUD Performance] and click the [OK] button to open the [Performance Analysis] window.
Figure 5.83 [Performance Analysis] Window (AUD Performance)
The AUD Performance Analysis function does not affect the realtime operation because it
measures execution performance in the specified range by using the circuit for hardware
performance measurement on the emulator main unit case.
The start and end conditions of the measurement channel of the AUD Performance Analysis use
one AUD event channel, respectively. Four measurement channels use eight AUD event channels.
Note: Since the AUD performance function is implemented according to the information in the
MCU output from the AUD pin, the AUD trace information acquisition condition must be
set. Set the AUD trace information acquisition condition.
Rev. 10.00 Oct. 15, 2009 Page 247 of 366
REJ10J1003-1000
Section 5 Debugging
When a measurement channel is double-clicked or selected and [Set...] is selected from the popup
menu in this window, the [Performance Analysis AUD Channel x] dialog box is opened and
measurement conditions can be modified.
Figure 5.84 [Performance Analysis AUD Channel x] Dialog Box
[Start Point [aud event chx]]:
Displays the start pointer condition of the measurement channel.
[End Point [aud event chx]]:
Displays the end pointer condition of the measurement channel.
[Set]:
Displays the dialog box to set the AUD event channel for the
start or end pointer.
[Sampling time]:
Specifies the resolution of the measurement timer as any of the
following values:
20 ns, 100 ns, 400 ns, or 1.6 μs
Rev. 10.00 Oct. 15, 2009 Page 248 of 366
REJ10J1003-1000
Section 5 Debugging
Clicking the [Set] button opens the dialog box to set the corresponding AUD event channel to
modify the measurement start or end condition.
Figure 5.85 Editing the AUD Performance Analysis Measurement Condition (Dialog Box
for Setting the AUD Event)
Notes: 1. When the AUD performance analysis function is used, set [Performance start/stop] on
the [Action] page of each channel.
2. When the measurement condition is modified, the contents are reflected on the [AUD
Event] sheet in the [Event] window.
Rev. 10.00 Oct. 15, 2009 Page 249 of 366
REJ10J1003-1000
Section 5 Debugging
5.11.3 Hiding the Column
It is possible to hide any column not necessary in the [Performance Analysis] window. Selecting a
column you want to hide from the popup menu displayed by clicking the right-hand mouse button
on the header column hides that column. To display the hidden column, select the column from
the said popup menu again.
5.11.4 Starting Performance Data Acquisition
Executing the user program clears the result of previous measurement and automatically starts
measuring execution performance according to the conditions that have been set. Stopping the user
program displays the result of measurement in the [Performance Analysis] window.
5.11.5 Deleting a Measurement Condition
Select [Reset] from the popup menu with a measurement condition selected to delete the
condition.
5.11.6 Deleting All Measurement Conditions
Select [Reset All] from the popup menu to delete all the conditions that have been set.
Rev. 10.00 Oct. 15, 2009 Page 250 of 366
REJ10J1003-1000
Section 5 Debugging
5.12
Viewing the Profile Information
The profiling function enables function-by-function measurement of the performance of the
application program in execution. This makes it possible to identify parts of an application
program that degrade its performance and the reasons for such degradation.
The High-performance Embedded Workshop displays the results of measurement in three
windows, according to the method and purpose of viewing the profile data.
5.12.1 Stack Information Files
The profiling function allows the High-performance Embedded Workshop to read the stack
information files (extension: “.SNI”) which are output by the optimizing linker (ver. 7.0 or later).
Each of these files contains information related to the calling of static functions in the
corresponding source file. Reading the stack information file makes it possible for the Highperformance Embedded Workshop to display this information to do with the calling of functions
without executing the user application (i.e. before measuring the profile data). However, this
feature is not available when [Setting->Only Executed Functions] is checked in the pop-up menu
of the [Profile] window.
When the High-performance Embedded Workshop does not read any stack information files, the
data about the functions executed during measurement will be displayed by the profiling function.
To make the linker create a stack information file, choose [Options -> SuperH Risc engine
Standard Toolchain...], and select [Other] from the [Category] list box and check the [Stack
information output] box in the [Link/Library] page of the [Standard Toolchain] dialog box.
Rev. 10.00 Oct. 15, 2009 Page 251 of 366
REJ10J1003-1000
Section 5 Debugging
Figure 5.86 [Standard Toolchain] Dialog Box (1)
Rev. 10.00 Oct. 15, 2009 Page 252 of 366
REJ10J1003-1000
Section 5 Debugging
5.12.2 Profile Information Files
To create a profile information file, choose the [Output Profile Information Files…] menu option
from the pop-up menu of the [Profile] window and specify the file name, after measuring a profile
data of the application program.
This file contains information on the number of times functions are called and global variables are
accessed. The optimizing linker (ver. 7.0 or later) is capable of reading the profile information file
and optimizing the allocation of functions and variables in correspondence with the status of the
actual operation of the program.
To input the profiler information file to the linker, choose [Optimize] from the [Category] list box
and check the [Include Profile] box in the [Link/Library] page of the [Standard Toolchain] dialog
box, and specify the name of the profile information file.
Figure 5.87 [Standard Toolchain] Dialog Box (2)
To enable the settings in the [Include Profile] box, specify the [Optimize] list box as some setting
other than [None].
Rev. 10.00 Oct. 15, 2009 Page 253 of 366
REJ10J1003-1000
Section 5 Debugging
5.12.3 Loading Stack Information Files
You can select whether or not to read the stack information file in a message box for confirmation
that is displayed when a load module is loaded. Clicking the [OK] button of the message box loads
the stack information file. The message box for confirmation will be displayed when:
• There are stack information files (extension: “*.SNI”).
• The [Load Stack Information Files (SNI files)] check box is checked in the [Confirmation]
page of the [Options] dialog box (figure 5.88) that can be opened by choosing [Tools
->Options…] from the main menu.
Figure 5.88 [Options] Dialog Box
Rev. 10.00 Oct. 15, 2009 Page 254 of 366
REJ10J1003-1000
Section 5 Debugging
5.12.4 Enabling the Profile
Choose [View->Performance->Profile] to open the [Profile] window.
Choose [Enable Profiler] from the pop-up menu of the [Profile] window. The item on the menu
will be checked.
5.12.5 Specifying Measuring Mode
You can specify whether to trace functions calls while profile data is acquired. When function
calls are traced, the relations of function calls during user program execution are displayed as a
tree diagram. When not traced, the relations of function calls cannot be displayed, but the time for
acquiring profile data can be reduced.
To stop tracing function calls, choose [Disable Tree (Not traces function call)] from the pop-up
menu in the [Profile] window (a check mark is shown to the left of the menu item).
When acquiring profile data of the program in which functions are called in a special way, such as
task switching in the operating system, stop tracing function calls.
5.12.6 Executing the Program and Checking the Results
After the user program has been executed and execution has been halted, the results of
measurement are displayed in the [Profile] window.
The [Profile] window has two sheets; a [List] sheet and a [Tree] sheet.
Rev. 10.00 Oct. 15, 2009 Page 255 of 366
REJ10J1003-1000
Section 5 Debugging
5.12.7 [List] Sheet
This sheet lists functions and global variables and displays the profile data for each function and
variable.
Figure 5.89 [List] Sheet
Clicking the column header sorts the items in an alphabetical or ascending order. Double-clicking
the [Function/Variable] or [Address] column displays the source program corresponding to the
address in the line.
Right-clicking on the mouse within the window displays a pop-up menu. For details on this popup menu, refer to section 5.12.8, [Tree] Sheet.
Rev. 10.00 Oct. 15, 2009 Page 256 of 366
REJ10J1003-1000
Section 5 Debugging
5.12.8 [Tree] Sheet
This sheet displays the relation of function calls along with the profile data that are values when
the function is called. This sheet is available when [Disable Tree (Not traces function call)] is not
selected from the pop-up menu in the [Profile] window.
Figure 5.90 [Tree] Sheet
Double-clicking a function in the [Function] column expands or reduces the tree structure display.
The expansion or reduction is also provided by the “+” or “-“ key. Double-clicking the [Address]
column displays the source program corresponding to the specific address.
Right-clicking on the mouse within the window displays a pop-up menu. Supported menu options
are described in the following:
• View Source
Displays the source program or disassembled memory contents for the address in the selected
line.
• View Profile-Chart
Displays the [Profile-Chart] window focused on the function in the specified line.
• Enable Profiler
Toggles acquisition profile data. When profile data acquisition is active, a check mark is
shown to the left of the menu text.
Rev. 10.00 Oct. 15, 2009 Page 257 of 366
REJ10J1003-1000
Section 5 Debugging
• Not trace the function call
Stops tracing function calls while profile data is acquired. This menu is used when acquiring
profile data of the program in which functions are called in a special way, such as task
switching in the operating system.
To display the relation of function calls in the [Tree] sheet of the [Profile] window, acquire
profile data without selecting this menu. In addition, do not select this menu when optimizing
the program by the optimizing linkage editor using the acquired profile information file.
• Find…
Displays the [Find Text] dialog box to find a character string in the [Function] column. Search
is started by inputting a character string to be found in the edit box and clicking [Find Next] or
pressing the Enter key.
• Find Data…
Displays the [Find Data] dialog box.
Figure 5.91 [Find Data] Dialog Box
By selecting the column to be searched in the [Column] combo box and the search type in the
[Find Data] group and entering [Find Next] button or Enter key, search is started. If the [Find
Next] button or the Enter key is input repeatedly, the second larger data (the second smaller
data when the Minimum is specified) is searched for.
• Clear Data
Clears the number of times functions are called and profile data. Data in the [List] sheet of the
[Profile] window and the data in the [Profile-Chart] window are also cleared.
• Output Profile Information Files…
Displays the [Save Profile Information Files] dialog box. Profiling results are saved in a profile
information file (.pro extension). The optimizing linkage editor optimizes user programs
according to the profile information in this file. For details of the optimization using the profile
information, refer to the manual of the optimizing linkage editor.
Rev. 10.00 Oct. 15, 2009 Page 258 of 366
REJ10J1003-1000
Section 5 Debugging
Note: If profile information has been acquired by choosing the [Not trace the function call]
menu, the program cannot be optimized by the optimizing linkage editor.
• Output Text File…
Displays the [Save Text of Profile Data] dialog box. Displayed contents are saved in a text file.
• Setting
This menu has the following submenus (the menus available only in the [List] sheet are also
included).
⎯ Show Functions/Variables
Displays both functions and global variables in the [Function/Variable] column.
⎯ Show Functions
Displays only functions in the [Function/Variable] column.
⎯ Show Variables
Displays only global variables in the [Function/Variable] column.
⎯ Only Executed Functions
Only displays the executed functions. If a stack information file (.sni extension) output
from the optimizing linkage editor does not exist in the directory where the load module is
located, only the executed functions are displayed even if this check box is not checked.
⎯ Include Data of Child Functions
Sets whether or not to display information for a child function called in the function as
profile data.
• Properties...
Sets the items to be measured.
Rev. 10.00 Oct. 15, 2009 Page 259 of 366
REJ10J1003-1000
Section 5 Debugging
5.12.9 [Profile-Chart] Window
The [Profile-Chart] window displays the relation of calls for a specific function. This window
displays the specified function in the middle, with the callers of the function on the left and the
callees of the function on the right. The numbers of times the function calls the called functions or
is called by the calling functions are also displayed in this window.
Figure 5.92 [Profile-Chart] Window
5.12.10 Types and Purposes of Displayed Data
The profiling function is able to acquire the following information:
Address
You can see the locations in memory to which the functions are allocated.
Sorting the list of functions and global variables in order of their addresses
allows the user to view the way the items are allocated in the memory space.
Size
Sorting in order of size makes it easy to find small functions that are frequently
called. Setting such functions as inline may reduce the overhead of function
calls. If you execute larger functions, more of the cache memory will need to be
updated. This information allows you to check if those functions that may cause
cache misses are frequently called.
Stack Size
When there is deep nesting of function calls, pursue the route of the function
calls and obtain the total stack size for all of the functions on that route to
estimate the amount of stack being used.
Rev. 10.00 Oct. 15, 2009 Page 260 of 366
REJ10J1003-1000
Section 5 Debugging
Times
Sorting by the number of calls or accesses makes it easy to identify the
frequently called functions and frequently accessed global variables.
Profile Data
Measurement of a variety of MCU-specific data is also available as well as items
that can be measured with the performance measurement function. For details,
refer to the online help.
5.12.11 Creating Profile Information Files
To create a profile information file, choose the [Output Profile Information Files…] menu option
from the pop-up menu. The [Save Profile Information Files] dialog box is displayed. Pressing the
[Save] button after selecting a file name will write the profile information to the selected file.
Pressing the [Save All] button will write the profile information to all of the profile information
files.
Figure 5.93 [Save Profile Information Files] Dialog Box
Rev. 10.00 Oct. 15, 2009 Page 261 of 366
REJ10J1003-1000
Section 5 Debugging
5.12.12 Notes
1. Tolerances
The profiling function internally breaks user program execution, collects the measured data,
and re-executes the user program.
Since the function also counts when the measured item is generated at break or re-execution,
tolerances will be included in the measured profile value.
The measured value of this function should be the reference.
2. Functions that cannot be used while the profiling function is being used
(a) On-chip performance analysis function
The on-chip performance analysis function cannot be used when the profiling function is
enabled.
(b) Step function
When the profiling function is enabled, do not use the step function. The profile data
cannot be measured correctly.
(c) Internal trace function
When the profiling function is enabled, it is invalid to select the internal trace mode as all
items of the internal trace mode are internally selected. Do not use the internal trace when
the profiling function is enabled.
(d) Continuous trace function (only for the supported devices)
When the profiling function is enabled, do not use the continuous trace function that is used
in the internal trace function. The profile data cannot be measured correctly.
(e) Halt function
When the profiling function is enabled, do not use the halt function of the internal, AUD,
and external bus traces.
(f) Memory access during user program execution
When the profiling function is enabled, memory access is disabled during user program
execution.
(g) When the profiling function is used, a break occurs if a branch instruction is generated.
Accordingly, the realtime emulation will not be performed. In addition, since the emulator
firmware is controlled on generation of a break, the executed result of the branch
instruction may be displayed on the [Internal/AUD/Usermemory trace] window when the
execution is returned to the user program from the emulator firmware. In this case,
**EML** is displayed.
Rev. 10.00 Oct. 15, 2009 Page 262 of 366
REJ10J1003-1000
Section 5 Debugging
3. Others
(a) When the profiling function is used, an internal break occurs in the execution of the user
program. Therefore, the measurement result of AUD performance analysis will contain
errors.
(b) When the profiling function is used, the contents that have been set in the on-chip
performance measurement function or data that has been measured will be deleted.
(c) Since the profiling function is implemented with the internal break, it takes a long time to
start and end the user program execution.
Rev. 10.00 Oct. 15, 2009 Page 263 of 366
REJ10J1003-1000
Section 5 Debugging
5.13
Viewing Realtime Profile Information
The realtime profiling function is used to measure the execution performance in the specified
range of the application program in a function unit. This function is effective to investigate the
position and the cause of the lowered performance in the application program.
The realtime profiling function does not affect the realtime operation because it measures the
performance by using the profiler measurement circuit on the main unit case and expansion
profiling unit of the emulator.
The following shows the realtime profiling measurement modes:
• Function mode
This function does not include the subroutine execution time when accumulation of the
function execution time is displayed.
• Nest mode
This function includes the subroutine execution time when accumulation of the function
execution time is displayed.
Determine which mode is to be used in the [Function select] dialog box that is displayed when the
emulator is activated.
Note: There are following restrictions in the realtime profiling function.
(1) Restrictions on all the realtime profiling functions
(i) Areas to be measured
In the emulator, 512 kbytes are considered as a unit to acquire the profiling information on
all the functions in the areas of a maximum of 24 blocks.
The hardware of the emulator has a maximum of three types of memory for measuring
eight blocks to implement the realtime profiling function.
Note that the adjacent address areas can be set in each block, however, it is impossible to
set a function of which address ranges are extended on the eight-block boundaries. If such a
function is set, a warning message will be displayed and correct measurement will not be
performed.
(ii) Inline expansion
When the functions are inline-expanded in accordance with optimization of the compiler,
they are not displayed in the [Realtime Profile] window.
Rev. 10.00 Oct. 15, 2009 Page 264 of 366
REJ10J1003-1000
Section 5 Debugging
(iii) Recursive function
The execution time of the recursive function can be correctly measured, however, the
execution count will be once.
(iv) AUD trace
The realtime profiling function uses the data that is output in AUD trace. Therefore, when
the function is used in the realtime trace mode, the trace data may be lost and correct
measurement will not be performed. In such a case, it is recommended that the nonrealtime trace mode be used.
(2) Restrictions on using the function mode
(i) Tail call
When a tail call is used for a function as shown below, the return value of the callee
function becomes the return address of the caller function. The execution time or execution
counts of the callee function cannot be measured correctly.
f( ){
g( );
}
No branch
g( ){
RTS
NOP
}
Figure 5.94 Tail Call (Function Mode)
Rev. 10.00 Oct. 15, 2009 Page 265 of 366
REJ10J1003-1000
Section 5 Debugging
(ii) Relationships between the Go-start address, break address, and measurable ranges
f( ){
Starts execution from function g
g( ){
h( ){
g( );
k( ){
h( );
k( );
}
}
}
}
Figure 5.95 Measurable Ranges (Function Mode)
Measurable ranges when a break occurs at the position of black circle:
• Execution time and counts of functions h and k
Measurable ranges when a break occurs at the position of red circle:
• Execution time and counts of functions h and k
Measurable ranges when a break occurs at the position of blue circle:
• Execution time and counts of functions h and k
• Execution time of function g; counts cannot be measured.
It is recommended that a break occur within the function where execution is started. When
execution returns to the upper function, the execution counts of the function cannot be
measured.
Rev. 10.00 Oct. 15, 2009 Page 266 of 366
REJ10J1003-1000
Section 5 Debugging
(3) Restrictions on using the nest mode
(i) Tail call
⎯ When a tail call is used for a function as shown below, the return value of the callee
function becomes the return address of the caller function. The execution time of the callee
function cannot be measured correctly but the execution counts can be measured.
f( ){
g( );
}
No branch
g( ){
RTS
NOP
}
Figure 5.96 Tail Call (Nest Mode)
Rev. 10.00 Oct. 15, 2009 Page 267 of 366
REJ10J1003-1000
Section 5 Debugging
⎯ There is a restriction when the tail call is used to call another function from the function
that has been called by the tail call. If the tail call occurs continuously, three-step
measurement will be correctly performed.
f( ){
g( ){
h( ){
g( );
h( );
}
}
k( ){
k( );
}
}
Step 1
Step 2
Step 3
Figure 5.97 Restriction on Call
(ii) Nesting functions
If 32-step or more calls are generated from the top function within the range to be
measured, correct measurement will not be performed. A warning message will be
displayed.
(iii) Calling from a function outside the measurement range
Correct measurement will not be performed if a function outside the measurement range
calls a function to be measured and the callee function cannot return correctly to the caller
function.
Even if the callee function returns correctly to the caller function, correct measurement will
not be performed if other functions are called within three instructions from the return
address.
Rev. 10.00 Oct. 15, 2009 Page 268 of 366
REJ10J1003-1000
Section 5 Debugging
(iv) Relationships between the Go-start address, break address, and measurable ranges
f( ){
Starts execution from function g
g( ){
h( ){
g( );
k( ){
h( );
k( );
}
}
}
}
Figure 5.98 Measurable Ranges (Nest Mode)
Measurable ranges when a break occurs at the position of black circle:
• Execution time and counts of function h
Measurable ranges when a break occurs at the position of red circle:
• Execution time and counts of functions h and k
Measurable ranges when a break occurs at the position of blue circle:
• Execution time and counts of functions h and k
It is recommended that a break occur within the function where execution is started. When
execution returns to the upper function, the execution counts of the function cannot be
measured.
Rev. 10.00 Oct. 15, 2009 Page 269 of 366
REJ10J1003-1000
Section 5 Debugging
5.13.1 Opening the [Realtime Profile] Window
Select [View -> Performance -> Realtime Profile] to open the [Realtime Profile] window.
Clicking the column header changes the ascending or descending order of items in displayed
contents.
Figure 5.99 [Realtime Profile] Window
The following information can be acquired:
Address
You can see the locations in memory to which the functions are allocated.
Size
Sorting in order of size makes it easy to find small functions that are frequently
called. Setting such functions as inline may reduce the overhead of function
calls. If you execute larger functions, more of the cache memory will need to be
updated. This information allows you to check if those functions that may
cause cache misses are frequently called.
Count
The number of times that functions have been called is displayed.
Times
The total execution time is displayed.
Rev. 10.00 Oct. 15, 2009 Page 270 of 366
REJ10J1003-1000
Section 5 Debugging
5.13.2 Specifying the Measurement Range
Clicking the right-hand mouse button on the window displays the popup menu. When [Add
Range] is selected from the popup menu, the [EDIT] dialog box opens to specify the measurement
range of realtime profile.
Figure 5.100 [EDIT] Dialog Box
When the expansion profiling unit is connected to the emulator, it is possible to measure the
profile information within the 6-Mbyte ranges in total. When the expansion profiling unit is not
connected to the emulator, it is possible to measure the profile information within the 2-Mbyte
ranges in total.
In the emulator, 512 kbytes are considered as a unit to acquire the profiling information on all the
functions in the eight-block areas. Addresses to be specified for each block need not be adjacent.
When the expansion profiling unit is connected to the emulator, 16 blocks of 512 kbytes are added
and the 24-block areas can be measured in total.
The measured data in each block is displayed on each page of the [Realtime Profile] window. To
switch the page to be displayed, select that page and click the [OK] button in the [Select Page]
dialog box that is opened by selecting [Select Page] from the popup menu of the [Realtime
Profile] window.
Rev. 10.00 Oct. 15, 2009 Page 271 of 366
REJ10J1003-1000
Section 5 Debugging
Figure 5.101 [Select Page] Dialog Box
5.13.3 Starting Measurement
When the user program is executed, measurement is started.
When the user program is halted, the measurement result is displayed in the [Realtime Profile]
window.
5.13.4 Clearing Measurement Result
Selecting [Clear Data] from the popup menu clears the measurement result of the [Column] and
[Time] columns.
5.13.5 Deleting Measurement Range
Selecting [Delete] from the popup menu deletes all the specified measurement range and clears the
measurement result.
5.13.6 Setting the Minimum Unit of the Measurement Time
In the emulator, it is possible to change the minimum unit of the measurement time as any of 20
ns, 100 ns, 400 ns, or 1.6 μs.
At 20 ns, the maximum time that can be measured is about three hours.
At 100 ns, the maximum time that can be measured is about 15 hours.
At 400 ns, the maximum time that can be measured is about 61 hours.
Rev. 10.00 Oct. 15, 2009 Page 272 of 366
REJ10J1003-1000
Section 5 Debugging
At 1.6 μs, the maximum time that can be measured is about 244 hours.
To change the minimum unit, select [Set] from the popup menu of the [Realtime Profile] window
and open the [Properties] dialog box.
Figure 5.102 [Properties] Dialog Box
Note: Be sure to set the following when using the realtime profiling function:
• [I-Trace/AUD-Trace acquisition] dialog box that is opened by selecting [Set] from the
popup menu of the [Trace] window:
[Trace mode] page
[Trace type]: Select [AUD Trace].
[AUD mode]: Select the [Branch trace] check box.
[AUD Branch trace] page
[Acquire normal branch instruction trace]: Select this check box.
[Acquire subroutine branch instruction trace]: Select this check box.
[Acquire exception branch instruction trace]: Select this check box.
5.14
Using Multiple Debugging Platforms
Multiple debugging platforms can be operated at the same time in the High-performance
Embedded Workshop.
When selecting [Renesas High-performance Embedded Workshop] -> [High-performance
Embedded Workshop] from [Programs] in the [Start] menu to initiate another High-performance
Embedded Workshop, two emulators can be used separately for debugging.
Rev. 10.00 Oct. 15, 2009 Page 273 of 366
REJ10J1003-1000
Section 5 Debugging
5.14.1 Distinguishing Two Emulators
Connect two emulators to the USB connector. Then, initiate the High-performance Embedded
Workshop using the tutorial workspace. The following message is displayed.
Figure 5.103 Message for Driver Selection
Click the [OK] button. The following dialog box will appear.
Figure 5.104 [Driver Details] Dialog Box (1)
Rev. 10.00 Oct. 15, 2009 Page 274 of 366
REJ10J1003-1000
Section 5 Debugging
Select [E7/E10 Emulator USB Driver] from the [Driver] drop-down list box and open the
[Channel] drop-down list box. Channel information for two emulators is displayed in the
[Channel] drop-down list box as shown below.
Figure 5.105 [Driver Details] Dialog Box (2)
Information displayed in figure 5.105 is the information of the USB connector to which the
emulators are connected.
Note: The displayed character strings of the information depend on the host computer's
environment.
Check which of the character strings of information show emulators.
Select [<no driver selected>] in the [Driver] drop-down list box and disconnect one emulator from
the USB connector. After that, select [E7/E10 Emulator USB Driver] in the [Driver] drop-down
list box. Only information on the USB connector that the emulator is connected to is displayed in
the [Channel] drop-down list box.
The above procedures are used to discern which of the emulators are indicated by the displayed
character strings of information in the [Channel] drop-down list box.
Rev. 10.00 Oct. 15, 2009 Page 275 of 366
REJ10J1003-1000
Section 5 Debugging
When initiating the High-performance Embedded Workshop, in the [Channel] drop-down list box,
select the information on the USB connector of the emulator that is connected to the master CPU.
Initiate the High-performance Embedded Workshop using the normal procedures.
When initiating the slave High-performance Embedded Workshop, in the [Channel] drop-down
list box, select the information on the USB connector of the emulator that is connected to the slave
CPU.
5.15
Acquiring Code Coverage
The emulator acquires code coverage information (C0 coverage) from the address range specified
by the user and displays the results.
Note: Be sure to set the following when measuring the code coverage:
• [I-Trace/AUD-Trace acquisition] dialog box that is opened by selecting [Set] from
the popup menu of the [Trace] window:
[Trace Mode] page
[Trace mode]: Select [AUD Trace].
[AUD mode]: Check the [Branch trace] check box.
[AUD Branch trace] page
[Acquire normal branch instruction trace]: Check this check box.
[Acquire subroutine branch instruction trace]: Check this check box.
[Acquire exception branch instruction trace]: Check this check box.
5.15.1 Opening the [Code Coverage] Window
Select [View -> Code -> Code Coverage…] or click the [Code Coverage] toolbar button ( ). The
following dialog box opens when the coverage function is used for the first time after initiation of
the emulator.
Figure 5.106 [Coverage Acquisition Range Setting] Dialog Box
Rev. 10.00 Oct. 15, 2009 Page 276 of 366
REJ10J1003-1000
Section 5 Debugging
[Enable]:
Checking this box allows acquisition of code coverage
information.
[Coverage acquisition start address (Mainboard, 4M)]:
The emulator specifies the measurement start address in the
range of 4 Mbytes.
[Coverage acquisition start address (Optionboard, 8M)]:
The emulator specifies the measurement start address in the
range of 8 Mbytes. This function is only available when the
expansion profiling unit is connected to the emulator.
[OK]:
Closes this dialog box by setting the specified condition.
[Cancel]:
Closes this dialog box without setting the specified condition.
This dialog box will only be displayed once after initiation of the emulator. To open this dialog
box, select [Hardware Settings…] from the popup menu of the [Code Coverage] window. When
the [Coverage Acquisition Range Setting] dialog box is closed, the [Open Coverage] dialog box
appears.
Figure 5.107 [Open Coverage] Dialog Box
Rev. 10.00 Oct. 15, 2009 Page 277 of 366
REJ10J1003-1000
Section 5 Debugging
In this dialog box, specify a range to be shown in the [Code Coverage] window.
[New Window]:
Specifies a new coverage range.
[Start address]:
Enter the start address of coverage information to be
displayed (in hexadecimal when the prefix is
omitted).
[End address]:
Enter the end address of coverage information to be
displayed (in hexadecimal when the prefix is
omitted).
[File]:
Specifies a source file that has “.C” or “.CPP” as its file type
name from the current project. This allows a function included
in the specified file to be set as the coverage range. “.C” will
be automatically specified if the file type name is omitted.
Files with a type name other than “.C” or “.CPP” cannot be
specified here. A placeholder or the [Browse…] button can be
used.
[Open a recent coverage file]:
Lists a maximum of four files that were saved most recently.
Select one from the list.
[Browse to another coverage file]: Allows specification of a file that is not included in the list.
Clicking the [OK] button in this dialog box opens the [Code Coverage] window. The display
format differs depending on whether the address range or source file is specified.
Rev. 10.00 Oct. 15, 2009 Page 278 of 366
REJ10J1003-1000
Section 5 Debugging
[Code Coverage] Window (Specifying an Address)
Figure 5.108 [Code Coverage] Window (Specifying an Address)
The [Code Coverage] window is divided into two by the splitter.
• Left-hand window
Displays the coverage range and statistical information of the coverage. The items are displayed as
follows:
[Range]:
Address range
[Statistic]:
C0 coverage value (in percentage)
The percentage will be displayed in the [Statistic] column by selecting [Percentage] from the
popup menu on the left-hand window.
Figure 5.109 Percentage Shown in the [Code Coverage] Window
Rev. 10.00 Oct. 15, 2009 Page 279 of 366
REJ10J1003-1000
Section 5 Debugging
• Right-hand window
Displays coverage information at the C/C++ or assembly-language level. The items are displayed
as follows:
[Executed]:
1 (the instruction was executed) or 0 (the instruction was not executed)
[Address]:
Instruction address
[Assembler]:
Disassembled program
[Source]:
C/C++ or assembly source program
[Code Coverage] Window (Specifying a Source File)
Figure 5.110 [Code Coverage] Window (Specifying a Source File)
This window is divided into two by the splitter.
• Left-hand window
Displays the coverage range and statistical information of the coverage. The items are displayed as
follows:
[Functions]:
Function to be selected for coverage
[Statistic]:
C0 coverage value (in percentage)
The percentage will be displayed in the [Statistic] column by selecting [Percentage] from the
popup menu in the left-hand window. Clicking the column tab allows the function names or C0
coverage values to be listed in descending or ascending order.
Rev. 10.00 Oct. 15, 2009 Page 280 of 366
REJ10J1003-1000
Section 5 Debugging
• Right-hand window
Displays coverage information of the function selected by double-clicking on the left-hand
window at the C/C++ or assembly-language level. The items are displayed as follows:
[Executed]:
1 (the instruction was executed) or 0 (the instruction was not executed)
[Address]:
Instruction address
[Assembler]:
Disassembled program
[Source]:
C/C++ or assembly source program
5.15.2 Displaying a Source File
Selecting [Display a Source File] from the popup menu opens the [Editor] window, which displays
the source file for the address at the cursor location on the [Code Coverage] window.
5.15.3 Changing the Address to be Displayed
Selecting [Go To Address…] from the popup menu opens the [Go To Address] dialog box, which
allows the user to change the address to be displayed in the [Code Coverage] window.
Figure 5.111 [Go To Address] Dialog Box
Rev. 10.00 Oct. 15, 2009 Page 281 of 366
REJ10J1003-1000
Section 5 Debugging
5.15.4 Changing the Coverage Range to be Displayed
• When the coverage range for display has been specified by address
Selecting [Set Range…] from the popup menu opens the [Coverage Display Range] dialog box,
which allows the user to change the condition for acquisition of information on executed
instructions.
Figure 5.112 [Coverage Display Range] Dialog Box
The following items can be specified.
[Start Address]: Start address (in hexadecimal when the prefix is omitted)
[End Address]:
End address (in hexadecimal when the prefix is omitted)
Clicking the [OK] button changes the coverage range to be displayed.
Rev. 10.00 Oct. 15, 2009 Page 282 of 366
REJ10J1003-1000
Section 5 Debugging
• When the coverage range for display has been specified by a source file
Selecting [Set Range…] from the popup menu opens the [Coverage Display Range] dialog box,
which allows the user to change the condition for acquisition of information on executed
instructions.
Figure 5.113 [Coverage Display Range] Dialog Box (Specifying a Source File)
The following item can be specified.
[File]:
Specifies a source file that has “.C” or “.CPP” as its file type name from the current
project. This allows a function included in the specified file to be set as the coverage
range. “.C” will be provided if the file type name is omitted. Files with a type name other
than “.C” or “.CPP” cannot be specified here. A placeholder or the [Browse…] button
can be used.
Clicking the [OK] button changes the coverage range to be displayed.
Rev. 10.00 Oct. 15, 2009 Page 283 of 366
REJ10J1003-1000
Section 5 Debugging
5.15.5 Clearing the Coverage Information
• Clearing the coverage information of the specified range
Selecting [Clear Coverage Range…] from the popup menu opens the [Clear Coverage Range]
dialog box.
Figure 5.114 [Clear Coverage Range] Dialog Box
Enter the start and end addresses of the range to be cleared. Clicking the [OK] button clears the
coverage information of the selected range.
• Clearing all the coverage information
Selecting [Clear the Entire Coverage] from the popup menu clears all the coverage information.
5.15.6 Saving the Coverage Information to a File
Selecting [Save Data…] from the popup menu opens the [Save Coverage Data] dialog box.
Figure 5.115 [Save Coverage Data] Dialog Box
Specify the location of the coverage information file to be saved and its name. A placeholder or
the [Browse…] button can be used. If the file extension is omitted, “.COV” will automatically be
added as the file extension. An error message will appear if a file extension other than “.COV” or
“.TXT” is entered.
Rev. 10.00 Oct. 15, 2009 Page 284 of 366
REJ10J1003-1000
Section 5 Debugging
5.15.7 Loading Coverage Information from a File
Selecting [Load Data…] from the popup menu opens the [Load Data] dialog box.
Figure 5.116 [Load Data] Dialog Box
Specify the location of the coverage information file to be loaded. A placeholder or the
[Browse…] button can be used. The only file extension available is “.COV”. An error message
will appear if any other file extension is entered.
Note: If the coverage range has been specified by a source file, the saved “.COV” file cannot be
loaded.
5.15.8 Updating Coverage Information
Selecting [Refresh] from the popup menu updates the content of the [Code Coverage] window.
5.15.9 Preventing Update of Coverage Information
Selecting [Lock Refresh] from the popup menu prevents update of the [Code Coverage] window
while the user program execution is stopped. This also prevents access to the emulator for
acquisition of coverage information.
Rev. 10.00 Oct. 15, 2009 Page 285 of 366
REJ10J1003-1000
Section 5 Debugging
5.15.10 [Confirmation Request] Dialog Box
• Clearing code coverage information or closing the [Code Coverage] window
A confirmation dialog box appears before clearing code coverage information or closing the [Code
Coverage] window.
Figure 5.117 [Confirmation Request] Dialog Box
When [Save Coverage Data] is checked, the coverage data can be saved into a file before clearing.
Clicking the [OK] button clears the coverage information.
• When [File -> Save Session] has been selected
When one or more [Code Coverage] windows are open, the number of [Save Code Coverage]
dialog boxes to be opened is the same as that of the [Code Coverage] window(s). The data of the
windows can be saved separately or together.
Rev. 10.00 Oct. 15, 2009 Page 286 of 366
REJ10J1003-1000
Section 5 Debugging
Figure 5.118 [Save Code Coverage] Dialog Box
Clicking [No To All] closes this dialog box without saving any coverage information. Clicking
[Yes To All] saves data of all the [Code Coverage] windows into one file.
Rev. 10.00 Oct. 15, 2009 Page 287 of 366
REJ10J1003-1000
Section 5 Debugging
5.15.11 Displaying Code Coverage Information in the [Editor] Window
Highlighting the Code Coverage column that corresponds to a source line where an instruction has
been executed allows the coverage information to also be displayed in the [Editor] window. If the
user changes any setting regarding the coverage information in the [Code Coverage] window, the
content of the corresponding Code Coverage column will also be updated.
Figure 5.119 [Code Coverage] Column
Rev. 10.00 Oct. 15, 2009 Page 288 of 366
REJ10J1003-1000
Section 6 Tutorial
Section 6 Tutorial
6.1
Introduction
This section describes the main functions of the emulator by using a tutorial program.
The tutorial program is based on the C++ program that sorts ten random data items in ascending or
descending order. The tutorial program performs the following actions:
• The main function generates random data to be sorted.
• The sort function sorts the generated random data in ascending order.
• The change function then sorts the data in descending order.
The file tutorial.cpp contains source code for the tutorial program. The file
Tutorial.abs is a compiled load module in the Dwarf2 format.
Notes: 1. Operation of Tutorial.abs is big endian. For little-endian operation,
Tutorial.abs must be recompiled. After recompilation, the addresses may differ
from those given in this section.
2.
This section describes general usage examples for the emulator. For the specifications
of particular products, refer to the additional document, Supplementary Information
on Using the SHxxxx, or the online help.
3.
The operation address of Tutorial.abs attached to each product differs depending
on the product.
Rev. 10.00 Oct. 15, 2009 Page 289 of 366
REJ10J1003-1000
Section 6 Tutorial
6.2
Running the High-performance Embedded Workshop
To run the High-performance Embedded Workshop, refer to section 4.1, System Check.
6.3
Setting up the Emulator
The clocks which are used for data communications must be set up on the emulator before the
program is downloaded.
• AUD clock
A clock used in acquiring AUD traces.
If its frequency is set too low, complete data may not be acquired during realtime tracing.
Set the frequency not to exceed the upper limit for the MCU’s AUD clock.
The AUD clock is only needed for using emulators that have an AUD trace function.
• JTAG (H-UDI) clock (TCK)
A communication clock used except for acquiring AUD trace.
If its frequency is set too low, the speed of downloading will be lowered.
Set the frequency not to exceed the upper limit for the MCU’s guaranteed TCK range.
For details of the limitations on both clocks, refer to the section of Notes on Using the JTAG (HUDI) Clock (TCK) and AUD Clock (AUDCK), in the additional document, Supplementary
Information on Using the SHxxxx. The following is a description of the procedure used to set the
clocks.
Rev. 10.00 Oct. 15, 2009 Page 290 of 366
REJ10J1003-1000
Section 6 Tutorial
6.4
Setting the [Configuration] Dialog Box
• Select [Emulator] then [Systems…] from the [Options] menu to set a communication clock.
The [Configuration] dialog box is displayed.
Figure 6.1 [Configuration] Dialog Box
• Set appropriate values in the [AUD clock] and [JTAG clock] combo boxes. The clock also
operates with the default value.
Rev. 10.00 Oct. 15, 2009 Page 291 of 366
REJ10J1003-1000
Section 6 Tutorial
Note: The items that can be set in this dialog box differ depending on the product. For details on
the settings for each product, refer to the online help.
• Click the [OK] button to set a configuration.
6.5
Checking the Operation of the Target Memory for Downloading
Check that the destination memory area for downloading is operating correctly.
When the destination memory is SDRAM or DRAM, a register in the bus controller of the target
microcomputer must be set before downloading. Set the bus controller correctly in the [IO]
window according to the memory type to be used.
When the required settings, such as the settings for the bus controller, have been completed,
display and edit the contents of the destination memory in the [Memory] window to check that the
memory is operating correctly.
Note: The above way of checking the operation of memory may be inadequate. It is
recommended that a program for checking the memory be created.
• Select [Memory…] from the [CPU] submenu of the [View] menu and enter H’00000000 in
the [Display Address] edit box.
Figure 6.2 [Format] Dialog Box
Rev. 10.00 Oct. 15, 2009 Page 292 of 366
REJ10J1003-1000
Section 6 Tutorial
• Click the [OK] button. The [Memory] window is displayed and shows the specified memory
area.
Figure 6.3 [Memory] Window
• Placing the mouse cursor on a point in the display of data in the [Memory] window and
double-clicking allows the values at that point to be changed. Data can also be directly edited
around the current position of the text cursor.
Rev. 10.00 Oct. 15, 2009 Page 293 of 366
REJ10J1003-1000
Section 6 Tutorial
6.6
6.6.1
Downloading the Tutorial Program
Downloading the Tutorial Program
Download the object program to be debugged.
• Select [Download module] from [Tutorial.abs] under [Download modules].
Figure 6.4 Downloading the Tutorial Program
Rev. 10.00 Oct. 15, 2009 Page 294 of 366
REJ10J1003-1000
Section 6 Tutorial
6.6.2 Displaying the Source Program
The High-performance Embedded Workshop allows the user to debug a user program at the
source level.
• Double-click [tutorial.cpp] under [C++ source file].
Figure 6.5 [Editor] Window (Displaying the Source Program)
• Select a font and size that are legible from the [Format…] option in the [Setup] menu if
necessary.
Initially the [Editor] window shows the start of the user program, but the user can use the scroll
bar to scroll through the user program and look at the other statements.
Rev. 10.00 Oct. 15, 2009 Page 295 of 366
REJ10J1003-1000
Section 6 Tutorial
6.7
Setting an S/W Breakpoint
An S/W breakpoint is a simple debugging function.
The [Editor] window provides a very simple way of setting an S/W breakpoint at any point in a
program. For example, to set an S/W breakpoint at the sort function call:
• Select by double-clicking the [S/W Breakpoints] column on the line containing the sort
function call.
Figure 6.6 [Editor] Window (Setting an S/W Breakpoint)
The symbol • will appear on the line containing the sort function. This shows that an S/W
breakpoint has been set.
Note: The S/W breakpoint cannot be set in the ROM area.
Rev. 10.00 Oct. 15, 2009 Page 296 of 366
REJ10J1003-1000
Section 6 Tutorial
6.8
Setting Registers
Set values of the program counter and the stack pointer before executing the program.
• Select [Registers] from the [CPU] submenu of the [View] menu. The [Register] window is
displayed.
Figure 6.7 [Register] Window
Rev. 10.00 Oct. 15, 2009 Page 297 of 366
REJ10J1003-1000
Section 6 Tutorial
• To change the value of the program counter (PC), double-click the value area in the [Register]
window with the mouse. The following dialog box is then displayed, and the value can be
changed. Set the program counter to H’00000800 in this tutorial program, and click the [OK]
button.
Figure 6.8 [Register] Dialog Box (PC)
• Change the value of the stack pointer (SP) in the same way. Set H’FF9F000 for the value of
the stack pointer in this tutorial program.
Figure 6.9 [Register] Dialog Box (R15)
Rev. 10.00 Oct. 15, 2009 Page 298 of 366
REJ10J1003-1000
Section 6 Tutorial
6.9
Executing the Program
Execute the program as described in the following:
• To execute the program, select [Go] from the [Debug] menu, or click the [Go] button on the
toolbar.
Figure 6.10 [Go] Button
When the program execution is started, ‘**RUNNING’ is displayed on the status bar, and then
the executed PC address is displayed in the products that support the MCU status acquisition
function. The program will be executed up to the breakpoint that has been set, and an arrow will
be displayed in the [S/W Breakpoints] column to show the position that the program has halted,
with the message [BREAKPOINT] in the status bar.
Notes: 1. When the source file is displayed after a break, a path of the source file may be
inquired. The location of the source file is as follows:
<Directory where the OS has been installed>\WorkSpace\Tutorial\E200\xxxx\Tutorial.
2. If program execution is failed, select [Reset CPU] from the [Debug] menu, reset the
device, and restart the procedure from figure 6.8.
Rev. 10.00 Oct. 15, 2009 Page 299 of 366
REJ10J1003-1000
Section 6 Tutorial
Figure 6.11 [Editor] Window (Break State)
Rev. 10.00 Oct. 15, 2009 Page 300 of 366
REJ10J1003-1000
Section 6 Tutorial
The user can see the cause of the break that occurred last time in the [Status] window.
• Select [Status] from the [CPU] submenu of the [View] menu. After the [Status] window is
displayed, open the [Platform] sheet, and check the Status of Cause of last break.
Figure 6.12 [Status] Window
Note: The items that can be displayed in this window differ depending on the product. For the
items that can be displayed, refer to the online help.
Rev. 10.00 Oct. 15, 2009 Page 301 of 366
REJ10J1003-1000
Section 6 Tutorial
6.10
Reviewing Breakpoints
The user can see all the breakpoints set in the program in the [Event] window.
• Select [Eventpoints] from the [Code] submenu of the [View] menu. The [Event] window is
displayed. Select the [Breakpoint] sheet.
Figure 6.13 [Event] Window
The popup menu, opened by clicking the [Event] window with the right-hand mouse button,
allows the user to set or change breakpoints, define new breakpoints, and delete, enable, or
disable breakpoints.
Rev. 10.00 Oct. 15, 2009 Page 302 of 366
REJ10J1003-1000
Section 6 Tutorial
6.11
Referring to Symbols
The [Label] window can be used to display the information on symbols in modules.
Select [Label] from the [Symbol] submenu of the [View] menu. The [Label] window is displayed
so that the user can refer to the addresses of symbols in modules.
Figure 6.14 [Label] Window
Rev. 10.00 Oct. 15, 2009 Page 303 of 366
REJ10J1003-1000
Section 6 Tutorial
6.12
Viewing Memory
When the label name is specified, the user can view the memory contents that the label has been
registered in the [Memory] window. For example, to view the memory contents corresponding to
_main in word size:
• Select [Memory …] from the [CPU] submenu of the [View] menu, enter _main in the
[Display Address] edit box.
Figure 6.15 [Format] Dialog Box
• Click the [OK] button. The [Memory] window showing the specified area of memory is
displayed.
Figure 6.16 [Memory] Window
Rev. 10.00 Oct. 15, 2009 Page 304 of 366
REJ10J1003-1000
Section 6 Tutorial
6.13
Watching Variables
As the user steps through a program, it is possible to watch that the values of variables used in the
user program are changed. For example, set a watch on the long-type array a declared at the
beginning of the program, by using the following procedure:
• Click the left of displayed array a in the [Editor] window to position the cursor.
• Select [Instant Watch...] with the right-hand mouse button.
The following dialog box will be displayed.
Figure 6.17 [Instant Watch] Dialog Box
• Click the [Add] button to add a variable to the [Watch] window.
Figure 6.18 [Watch] Window (Displaying the Array)
Rev. 10.00 Oct. 15, 2009 Page 305 of 366
REJ10J1003-1000
Section 6 Tutorial
The user can also add a variable to the [Watch] window by specifying its name.
• Click the [Watch] window with the right-hand mouse button and select [Add Watch…] from
the popup menu.
The following dialog box will be displayed. Enter variable i.
Figure 6.19 [Add Watch] Dialog Box
• Click the [OK] button.
The [Watch] window will now also show variable i.
Figure 6.20 [Watch] Window (Displaying the Variable)
Rev. 10.00 Oct. 15, 2009 Page 306 of 366
REJ10J1003-1000
Section 6 Tutorial
The user can click mark ‘+’ at the left side of array a in the [Watch] window to watch all the
elements.
Figure 6.21 [Watch] Window (Displaying Array Elements)
Rev. 10.00 Oct. 15, 2009 Page 307 of 366
REJ10J1003-1000
Section 6 Tutorial
6.14
Displaying Local Variables
The user can display local variables in a function using the [Locals] window. For example, we
will examine the local variables in the main function, which declares four local variables: a, j, i,
and p_sam.
• Select [Locals] from the [Symbol] submenu of the [View] menu. The [Locals] window is
displayed.
The [Locals] window shows the local variables in the function currently pointed to by the program
counter, along with their values. Note, however, that the [Locals] window is initially empty
because local variables are yet to be declared.
Figure 6.22 [Locals] Window
• Click mark ‘+’ at the left side of array a in the [Locals] window to display the elements.
• Refer to the elements of array a before and after the execution of the sort function, and
confirm that random data is sorted in descending order.
Rev. 10.00 Oct. 15, 2009 Page 308 of 366
REJ10J1003-1000
Section 6 Tutorial
6.15
Stepping Through a Program
The High-performance Embedded Workshop provides a range of step menu commands that allow
efficient program debugging.
Table 6.1
Step Option
Menu
Command
Description
Step In
Executes each statement, including statements within functions.
Step Over
Executes a function call in a single step.
Step Out
Steps out of a function, and stops at the statement following the statement in the
program that called the function.
Step…
Steps the specified times repeatedly at a specified rate.
6.15.1 Executing [Step In] Command
The [Step In] command steps into the called function and stops at the first statement of the called
function.
• To step through the sort function, select [Step In] from the [Debug] menu, or click the [Step
In] button on the toolbar.
Figure 6.23 [Step In] Button
Rev. 10.00 Oct. 15, 2009 Page 309 of 366
REJ10J1003-1000
Section 6 Tutorial
Figure 6.24 [Editor] Window (Step In)
• The highlighted line moves to the first statement of the sort function in the [Editor] window.
Rev. 10.00 Oct. 15, 2009 Page 310 of 366
REJ10J1003-1000
Section 6 Tutorial
6.15.2 Executing [Step Out] Command
The [Step Out] command steps out of the called function and stops at the next statement of the
calling statement in the main function.
• To step out of the sort function, select [Step Out] from the [Debug] menu, or click the [Step
Out] button on the toolbar.
Note: It takes time to execute this function. When the calling source is clarified, use [Go To
Cursor].
Figure 6.25 [Step Out] Button
Rev. 10.00 Oct. 15, 2009 Page 311 of 366
REJ10J1003-1000
Section 6 Tutorial
Figure 6.26 [HEW] Window (Step Out)
The data of variable a displayed in the [Watch] window is sorted in ascending order.
6.15.3
Executing [Step Over] Command
The [Step Over] command executes a function call as a single step and stops at the next statement
of the main program.
• Move to the change function following the procedures described in section 6.15.1, Executing
[Step In] Command.
• To step through all statements in the change function at a single step, select [Step Over] from
the [Debug] menu, or click the [Step Over] button on the toolbar.
Rev. 10.00 Oct. 15, 2009 Page 312 of 366
REJ10J1003-1000
Section 6 Tutorial
Figure 6.27 [Step Over] Button
Figure 6.28 [HEW] Window (Step Over)
Rev. 10.00 Oct. 15, 2009 Page 313 of 366
REJ10J1003-1000
Section 6 Tutorial
6.16
Forced Breaking of Program Executions
The High-performance Embedded Workshop can force a break in the execution of a program.
• Cancel all breaks.
• To execute the remaining sections of the main function, select [Go] from the [Debug] menu
or the [Go] button on the toolbar.
Figure 6.29 [Go] Button
• The program goes into an endless loop. To force a break in execution, select [Halt] from the
[Debug] menu or the [Stop] button on the toolbar.
Figure 6.30 [Stop] Button
Rev. 10.00 Oct. 15, 2009 Page 314 of 366
REJ10J1003-1000
Section 6 Tutorial
6.17
Break Function
The emulator has S/W break functions and break functions by eventpoints. With the Highperformance Embedded Workshop, an S/W breakpoint can be set using the [Breakpoint] sheet of
the [Event] window. The eventpoint condition setting can be set by the event type using the
[Onchip Event], [AUD Event], [Other Event], and [BUS Event] sheets.
An overview and setting of the break function are described below.
6.17.1 S/W Break Function
The emulator can set S/W breakpoints. Other methods for setting an S/W breakpoint than in
section 6.7, Setting an S/W Breakpoint, are described below.
• Select [Eventpoints] from the [Code] submenu of the [View] menu. The [Event] window is
displayed.
• Select the [Breakpoint] sheet.
Figure 6.31 [Event] Window (Before S/W Breakpoint Setting)
Rev. 10.00 Oct. 15, 2009 Page 315 of 366
REJ10J1003-1000
Section 6 Tutorial
• Click the [Event] window with the right-hand mouse button and select [Add…] from the
popup menu.
• Enter the address on the line that has ‘p_sam->s0=a[0];’ in the [Address] edit box.
Figure 6.32 [Breakpoint] Dialog Box
Notes: 1. This dialog box differs with the product. For the items of each product, refer to the
online help.
2. For some MCUs, the address value to be entered in the [Address] edit box is not
H'1076. In such cases, specify the address where “p_sam->s0=a[0];” (tutorial.cpp/48)
is located.
• Click the [OK] button.
Rev. 10.00 Oct. 15, 2009 Page 316 of 366
REJ10J1003-1000
Section 6 Tutorial
The S/W breakpoint that has been set is displayed in the [Event] window.
Figure 6.33 [Event] Window (S/W Breakpoint Setting)
Note: The items that can be displayed in this window differ depending on the product. For the
items that can be displayed, refer to the online help.
To stop the tutorial program at the S/W breakpoint, the following procedure must be executed:
• Set the program counter and stack pointer values (PC = H’00000800 and R15 = H’FF9F000)
that were set in section 6.8, Setting Registers, in the [Register] window. Click the [Go] button.
• If program execution is failed, reset the device and execute again the procedures above.
Rev. 10.00 Oct. 15, 2009 Page 317 of 366
REJ10J1003-1000
Section 6 Tutorial
The program runs, and stops at the set S/W breakpoint.
Figure 6.34 [Editor] Window at Execution Stop (S/W Break)
Rev. 10.00 Oct. 15, 2009 Page 318 of 366
REJ10J1003-1000
Section 6 Tutorial
The [Status] window displays the following contents.
Figure 6.35 Displayed Contents of the [Status] Window (S/W Break)
Note: The items that can be displayed in this window differ depending on the product. For the
items that can be displayed, refer to the online help.
6.18
Break Function by an Eventpoint
With this emulator, an Onchip Eventpoint, AUD Eventpoint, Other Eventpoint, and BUS
Eventpoint can be set. An example of how to set a break using an Onchip Eventpoint is shown
below. For other eventpoint setting methods, refer to section 5.8, Using the Eventpoints.
6.18.1
Setting the Break by an Onchip Eventpoint
A method is given below in which the address bus condition is set under event channel 1 of the
Onchip Eventpoint.
• Select [Eventpoints] from the [Code] submenu of the [View] menu. The [Event] window is
displayed.
• The S/W breakpoint that has been previously set is deleted. Click the [Event] window with the
right-hand mouse button and select [Delete All] from the popup menu to cancel all S/W
breakpoints that have been set.
• To set an Onchip Eventpoint, click on [Onchip Eventpoint]. Here, event channel 1 is set.
Note: The number of event channels of the Onchip Eventpoint differs according to the product.
For the number that can be specified for each product, refer to the online help.
Rev. 10.00 Oct. 15, 2009 Page 319 of 366
REJ10J1003-1000
Section 6 Tutorial
• Select a line of Ch1 in the [Event] window. When highlighted, double-click this line.
Figure 6.36 [Event] Window ([Onchip Event] Sheet)
• The [Event condition 1] dialog box is displayed.
• Clear the [Don't care] check box in the [Address] page.
• Select the [Only program fetched address after] radio button and enter an address of the
column including p_sam->sort(a); of the main function.
Rev. 10.00 Oct. 15, 2009 Page 320 of 366
REJ10J1003-1000
Section 6 Tutorial
Figure 6.37 [Address] Page ([Event condition 1] Dialog Box)
Note: The items that can be set in this dialog box differ depending on the product. For details on
the settings for each product, refer to the online help.
Rev. 10.00 Oct. 15, 2009 Page 321 of 366
REJ10J1003-1000
Section 6 Tutorial
• Click the [OK] button.
• The first point display in the State line changes from Disable to Enable.
• The first point display in the Condition line changes from None to Address =
H’xxxxxxxx pc Break.
• Set the program counter and stack pointer values (PC = H’00000800 and R15 = H’FFF9F000)
that were set in section 6.8, Setting Registers, in the [Register] window. Click the [Go] button.
• If program execution is failed, reset the device and execute again the procedures above.
The program runs and then stops at the condition specified under event channel 1.
Figure 6.38 [Editor] Window at Execution Stop (Onchip Eventpoint Channel 1)
Rev. 10.00 Oct. 15, 2009 Page 322 of 366
REJ10J1003-1000
Section 6 Tutorial
The [Status] window displays the following contents.
Figure 6.39 Displayed Contents of the [Status] Window (Onchip Event Ch1)
Note: The items that can be displayed in this window differ depending on the product. For the
items that can be displayed, refer to the online help.
Rev. 10.00 Oct. 15, 2009 Page 323 of 366
REJ10J1003-1000
Section 6 Tutorial
6.18.2
Setting the Sequential Onchip Eventpoint
The sequential break is enabled by the combination of Onchip Eventpoints.
Set the satisfaction conditions of Onchip Eventpoint as follows:
Ch1(IA_OA):
When an address of the column including p_sam->sort(a); of the
main function is accessed in a read cycle, a break condition is
satisfied.
Ch2(IA_OA_DT_CT):
When an address of the column including a[i]=j; of the main
function is accessed in a read cycle, a break condition is satisfied.
Follow the setting method described in the previous section.
To set these eventpoints as sequential:
• Select [Combination action] from the popup menu by clicking the [Event] window with the
right-hand mouse button. The [Combination action] dialog box will open.
Figure 6.40 [Combination action] Dialog Box
Note: The items that can be displayed in this dialog box differ depending on the product. For the
items that can be displayed, refer to the online help.
Rev. 10.00 Oct. 15, 2009 Page 324 of 366
REJ10J1003-1000
Section 6 Tutorial
• Select [Break:Ch2-1] in [Ch1,2,3], and click the [OK] button.
• Activate the condition of Event Condition 1 from the popup menu that is opened by clicking
the [Event Condition] sheet with the right-hand mouse button.
When the setting is completed, the [Event] window will be as shown in figure 6.41.
Figure 6.41 [Onchip Event] Sheet
Note: The items that can be displayed in this dialog box differ depending on the product. For the
items that can be displayed, refer to the online help.
• Set the program counter and stack pointer values (PC = H’00000800 and R15 = H’FFF9F000)
that were set in section 6.8, Setting Registers, in the [Register] window. Click the [Go] button.
• If program execution is failed, reset the device and execute again the procedures above.
Rev. 10.00 Oct. 15, 2009 Page 325 of 366
REJ10J1003-1000
Section 6 Tutorial
The program runs and then stops at the condition specified under event channel 1.
Figure 6.42 [Editor] Window at Execution Stop (Sequential Break)
Rev. 10.00 Oct. 15, 2009 Page 326 of 366
REJ10J1003-1000
Section 6 Tutorial
The [Status] window displays the following contents.
Figure 6.43 Displayed Contents of the [Status] Window (Sequential Break)
Note: The items that can be displayed in this window differ depending on the product. For the
items that can be displayed, refer to the online help.
• The sequential break conditions that have been previously set are deleted. Click the [Event]
window with the right-hand mouse button and select [Delete All] from the popup menu to
cancel all eventpoint conditions that have been set.
• Select [Combination action] from the popup menu by clicking the [Event] window with the
right-hand mouse button. The [Combination action] dialog box will open (figure 6.40).
• Select the [Don’t care] radio button and click the [OK] button.
Rev. 10.00 Oct. 15, 2009 Page 327 of 366
REJ10J1003-1000
Section 6 Tutorial
6.19
Trace Functions
The emulator has the five trace functions listed below.
• Internal Trace Function
Since this function uses the trace buffer built into the MCU, a realtime trace can be acquired.
The following information can be acquired:
• Types of trace information: Branch information, memory access information from the CPU,
and PC or Rn value during the Trace Rn instruction execution
• Trace acquisition address values
• Data values
• Mnemonics
• Operands
• Source lines
Notes: 1.
The number of branch instructions that can be acquired by a trace differs according to
the product. For the number that can be specified for each product, refer to the online
help.
2.
The internal trace function is not supported for all products. For details on the
specifications of each product, refer to the online help.
3.
The internal trace function is not extended for all products. For details on the
specifications of each product, refer to the online help.
• AUD Trace Function
This is the large-capacity trace function that is enabled when the AUD pin is connected to the
emulator. When a set of the branch source and branch destination instructions is one branch,
the maximum amount of information acquired by a trace is 262,144.
The following information can be acquired:
• Types of trace information: Branch information, memory access information from the CPU,
and PC or Rn value during the Trace Rn instruction execution
• Trace acquisition address values
• Data values
• External probe pin states
• Time stamp values
• Mnemonics
Rev. 10.00 Oct. 15, 2009 Page 328 of 366
REJ10J1003-1000
Section 6 Tutorial
• Operands
• Source lines
Notes: 1. The AUD trace function is not supported for all products. For details on the
specifications of each product, refer to the online help.
2. The types of trace information that can be acquired by an AUD trace function differ
depending on the product. For details on the specifications of each product or the
number of acquired branches, refer to the online help.
3. When multiple loops are performed to reduce the number of AUD trace displays, only
the IP counts up according to the product.
• Memory Output Trace Function
This function is used to write the trace result to the specified memory range. The data is read
from the memory range written in the [Trace] window and the result is then displayed. This is
large-capacity trace function that is valid when the AUD pin of the device is not connected to
the emulator.
Note: Some products do not support the memory output trace function. For details on the
specifications of each product, refer to the online help.
• External Bus Trace Function
This is a large-capacity trace function that is valid when the external bus pin of the MCU is
connected to the emulator.
The external bus trace function can acquire the information of a maximum of 262,144 cycles
per bus cycle.
The following information can be acquired:
• External bus address values
• External bus data values
• Interrupt signal states
• Time stamp values
• Mnemonics
• Operands
• Source lines
Note: The types of trace information that can be acquired differ depending on the product. For
details on the specifications, refer to the online help.
Rev. 10.00 Oct. 15, 2009 Page 329 of 366
REJ10J1003-1000
Section 6 Tutorial
6.19.1
Displaying the [Internal/AUD] Window
Select [Trace] from the [Code] submenu of the [View] menu. The [Trace Window Type] dialog
box is displayed.
Figure 6.44 [Trace Window Type] Dialog Box
Select [Internal/AUD] and click the [OK] button. The [Internal/AUD] window will appear.
(1) Internal trace function
The methods to acquire the internal trace are described below.
(a) Setting the trace acquisition mode
Click the [Internal/AUD] window with the right-hand mouse button and select [Settings…] from
the popup menu to display the [I-Trace/AUD-Trace acquisition] dialog box.
Rev. 10.00 Oct. 15, 2009 Page 330 of 366
REJ10J1003-1000
Section 6 Tutorial
Figure 6.45 [I-Trace/AUD-Trace acquisition] Dialog Box
Select [I-Trace] for [Trace Type] and click the [OK] button.
Rev. 10.00 Oct. 15, 2009 Page 331 of 366
REJ10J1003-1000
Section 6 Tutorial
(b) Setting the trace acquisition condition
Select acquisition of information in the branch source or branch destination in the [I-Trace/AUDTrace acquisition] dialog box. After selecting the condition to be acquired in [Acquisition], click
the [OK] button in the [I-Trace/AUD-Trace acquisition] dialog box.
Figure 6.46 [I-Trace/AUD-Trace acquisition] Dialog Box
Note: The items that can be set in this dialog box differ depending on the product. For details on
the settings for each product, refer to the online help.
Rev. 10.00 Oct. 15, 2009 Page 332 of 366
REJ10J1003-1000
Section 6 Tutorial
(c) Displaying the trace result
Run the program as shown in the example of section 6.17.1, S/W Break Function. The internal
trace results are displayed in the [Internal/AUD] window after the program execution is
completed.
Figure 6.47 [Internal/AUD] Window
• If necessary, adjust the column widths by dragging borders in the header bar (immediately
below the title bar).
Note: The type and the amount of information that can be acquired by a trace differ depending
on the product. For details on the specifications of each product, refer to the online help.
Rev. 10.00 Oct. 15, 2009 Page 333 of 366
REJ10J1003-1000
Section 6 Tutorial
(2) AUD trace function
This function is available when the AUD pin of the MCU is connected to the emulator.
The following is an example of acquiring memory access information from addresses H’1000 to
H’10FF.
The following is the procedure for setting the AUD trace function.
(a) Setting the AUD trace condition
Set the condition so that the AUD trace condition can be set to the execution information on the
MCU that is output from the AUD pin.
• Set [AUD function] of [Trace type] in the [I-Trace/AUD-Trace acquisition] dialog box.
• Select the [Window trace] and [Channel A] check boxes.
• Select the [Window trace] page. In the [Channel A] group box, set Read/Write for
[Read/Write], H’1000 for [Start address], H’10FF for [End address], and M-BUS for [Bus
state].
• Click the [OK] button in the [I-Trace/AUD-Trace acquisition] dialog box.
Rev. 10.00 Oct. 15, 2009 Page 334 of 366
REJ10J1003-1000
Section 6 Tutorial
Figure 6.48 Setting the [I-Trace/AUD-Trace acquisition] Dialog Box ([Window trace] Page)
Rev. 10.00 Oct. 15, 2009 Page 335 of 366
REJ10J1003-1000
Section 6 Tutorial
(b) Setting the trace acquisition mode
Select the [Trace mode] page of the [I-Trace/AUD-Trace acquisition] dialog box. Click this dialog
box with the right-hand mouse button and select [Settings…] from the popup menu to display the
[I-Trace/AUD-Trace acquisition] dialog box.
The AUD trace acquisition condition is set.
Figure 6.49 Setting the [I-Trace/AUD-Trace acquisition] Dialog Box ([Trace mode] Page)
Rev. 10.00 Oct. 15, 2009 Page 336 of 366
REJ10J1003-1000
Section 6 Tutorial
Note: The items that can be set in this window differ depending on the product. For details on
the settings for each product, refer to the online help.
(c) Displaying the trace result
Run the program as shown in the example of section 6.17.1, S/W Break Function. The trace
results are displayed in the [Internal/AUD] window after the program execution is completed.
Figure 6.50 [Internal/AUD] Window (Example)
6.19.2
Displaying the [BUS trace] Window
Select [Trace] from the [Code] submenu of the [View] menu. The [Trace Window Type] dialog
box is displayed.
Figure 6.51 [Trace Window Type] Dialog Box
Select [BUS trace] and click the [OK] button. The [BUS trace] window will appear.
Rev. 10.00 Oct. 15, 2009 Page 337 of 366
REJ10J1003-1000
Section 6 Tutorial
(1) External bus trace function
This function is enabled when the external bus pins of the MCU are connected to the emulator.
The methods to acquire the external bus trace are described below.
(a) Setting the bus trace
Set the multiplexed state of the bus pins or the connected memory, referring to section 2.5.2,
External Bus Trace/Break Function.
(b) Setting the trace acquisition mode
Click the [BUS trace] window with the right-hand mouse button and select [Acquisition…] from
the popup menu to display the [BUS acquisition] dialog box. Set the acquisition mode for the
external bus trace as shown in figure 6.52.
Rev. 10.00 Oct. 15, 2009 Page 338 of 366
REJ10J1003-1000
Section 6 Tutorial
Figure 6.52 [BUS acquisition] Dialog Box
Rev. 10.00 Oct. 15, 2009 Page 339 of 366
REJ10J1003-1000
Section 6 Tutorial
(c) Setting the trace acquisition condition
The following is an example of setting the address condition.
For setting other trace conditions, refer to section 5.8, Using the Eventpoints.
Select and double-click [Ch3 (Normal)] on the [BUS Event] sheet of the [Event] window. The
[Ch3 (Normal)] dialog box will appear.
Figure 6.53 [Ch3 (Normal)] Dialog Box ([Address] Page)
• Select [Range].
• Input H’2000 and H’20FF into [Start] and [End], respectively.
• Select [Trace get] in the [Action] page and click the [OK] button.
• The trace information when external memory H’2000 to H’20FF has been accessed is
acquired.
Rev. 10.00 Oct. 15, 2009 Page 340 of 366
REJ10J1003-1000
Section 6 Tutorial
(d) Displaying the trace result
Run the program as shown in the example of section 6.17.1, S/W Break Function. The internal
trace results are displayed in the [BUS trace] window after the program execution is completed.
Figure 6.54 [BUS trace] Window
• If necessary, adjust the column width by dragging the header bar immediately below the title
bar.
Note: The type and the amount of information that can be acquired by a trace differ depending
on the product. For details on the specifications of each product, refer to the online help.
Rev. 10.00 Oct. 15, 2009 Page 341 of 366
REJ10J1003-1000
Section 6 Tutorial
6.20
Stack Trace Function
The emulator uses the information on the stack to display the names of functions in the sequence
of calls that led to the function to which the program counter is currently pointing.
Note: This function can be used only when the load module that has the Dwarf2-type debugging
information is loaded. Such load modules are supported in SHC/C++ compiler (including
OEM and bundle products) V7.0 or later.
• Double-click the [S/W Breakpoints] column in the sort function and set an S/W breakpoint.
Figure 6.55 [Editor] Window (S/W Breakpoint Setting)
Rev. 10.00 Oct. 15, 2009 Page 342 of 366
REJ10J1003-1000
Section 6 Tutorial
• Set the same program counter and stack pointer values (PC = H’00000800 and R15 =
H’FFF9F000) as were set in section 6.8, Setting Registers (again, use the [Register] window).
Click the [Go] button.
• If program execution is failed, reset the device and execute again the procedures above.
• After the break in program execution, select [Stack Trace] from the [Code] submenu of the
[View] menu to open the [Stack Trace] window.
Figure 6.56 [Stack Trace] Window
Figure 6.56 shows that the position of the program counter is currently at the selected line of the
sort() function, and that the sort() function is called from the main() function.
To remove the S/W breakpoint, double-click the [S/W breakpoints] column in the sort function
again.
Note: For details on this function, refer to the online help.
Rev. 10.00 Oct. 15, 2009 Page 343 of 366
REJ10J1003-1000
Section 6 Tutorial
6.21
Download Function to the Flash Memory Area
The emulator enables downloading to the flash memory area. This function requires a program for
writing the flash memory (hereinafter referred to as a write module), a program for erasing the
flash memory (hereinafter referred to as an erase module), and the RAM area for downloading and
executing these modules.
Note: The write and erase modules must be prepared by the user.
• Interface with write and erase modules and emulator firmware
The write and erase modules must be branched from the emulator firmware. To branch from
the emulator firmware to the write and erase modules, or to return from the write and erase
module to the emulator firmware, the following conditions must be observed:
⎯ Describe all the write and erase modules with the assembly language.
⎯ Save and return all the general register values and control register values before and after
calling the write or erase module.
⎯ Return the write or erase module to the calling source after processing.
⎯ The write and erase module must be a Motorola-type file.
The module interface must be as follows to pass correctly the information that is required
for flash memory accessing.
Table 6.2 Module Interface
Module Name
Argument
Return Value
Write module
R4(L): Write address
R0(L): End code
Normal end = 0,
Abnormal end = other than 0,
Verify error = BT
R7(L): Verify option
0 = no verify,
1 = verify
R5(L): Access size
0x4220 = byte,
0x5720 = word,
0x4C20 = longword
R6(L): Write data
Erase module
R4(L): Access size
0x4220 = byte,
0x5720 = word,
0x4C20 = longword
Note: The (L) means the longword size.
Rev. 10.00 Oct. 15, 2009 Page 344 of 366
REJ10J1003-1000
None
Section 6 Tutorial
Note: Write module: The write data for the access size is set to the R6 register. When the access
size is word or byte, 0 is set to the upper bits of the R6 register.
• Flash memory download method
For downloading to the flash memory, set the items on the [Loading flash memory] page in the
[Configuration] dialog box, which is opened from [System…], then [Emulator] from the
[Options] menu.
Figure 6.57 [Loading flash memory] Page
Rev. 10.00 Oct. 15, 2009 Page 345 of 366
REJ10J1003-1000
Section 6 Tutorial
Table 6.3 shows the options for the [Loading flash memory] page.
Table 6.3 [Loading flash memory] Page Options
Option
Description
[Loading flash memory]
radio button
Sets Enable for flash memory downloading.
[Erasing flash memory]
radio button
Sets Enable for erasing before the flash memory is written.
[File name] edit box
Sets the file name of the S-type load module including the write and
erase modules. The file that has been set is loaded to the RAM area
before loading to the flash memory.
A maximum of 128 characters can be input for the file name.
[Bus width of flash
memory] list box
Sets the bus width of the flash memory.
[Flash memory erasing
time] edit box*
Sets the TIMEOUT value for erasing the flash memory. Set a larger
value if erasing requires much time; the default time is three minutes.
The radix for the input value is decimal. It becomes hexadecimal by
adding H’.
[Entry point] group box
When Enable is selected, and [File load] is selected from the [File]
menu for downloading, the write module is always called.
Enable: Download to the flash memory
Disable: Not download to the flash memory
When Enable is selected, the erase module is called before calling the
write module.
Enable: Erase the flash memory
Disable: Not erase the flash memory
Sets the calling destination address of the write and erase modules.
[All erasing module address] edit box: Enters the calling destination
address of the erase module.
[Writing module address] edit box: Enters the calling destination
address of the write module.
[Access size] combo box: Selects the access size of the RAM area
that is used for loading the write/erase module.
Note: Although the values that can be set are D'1 to D'65535, the TIMEOUT period may be
extended according to the set value. Therefore, it is recommended to input the minimum
value by considering the erasing time of the flash memory in use.
• Notes on using the flash memory download function
The following are notes on downloading to the flash memory.
⎯ When the flash memory download is enabled, downloading to areas other than the flash
memory area is disabled.
Rev. 10.00 Oct. 15, 2009 Page 346 of 366
REJ10J1003-1000
Section 6 Tutorial
⎯ Downloading is only enabled to the flash memory area. Perform memory write or S/W
break only to the RAM area.
⎯ When the flash memory erase is enabled, the [Stop] button cannot stop erasing.
• An example of downloading to the flash memory
The following is an example of downloading to the flash memory manufactured by Intel
Corporation (type number: G28F640J5-150) that has been connected as shown in figure 6.58.
A sample is provided in the \Fmtool folder in the installation destination folder. Create a
program that suits the user specifications by referring to this sample.
Table 6.4 Board Specifications
Item
Contents
SDRAM address
H'0C000000 to H'0FFFFFFF
Flash memory address
H'00000000 to H'01FFFFFF
Bus width of flash memory
32 bits
Operating environment
Endian
Big endian
SHxxxx
Flash memory
(32 Mbytes)
A2-A24
FIA bus buffer
A0-A22
CS0
FPGA
CE0
CE1,2
CS2
GND
OE
RD
FIA bus buffer
WE0
WE
0-7
D0-D7
D0-D31
FD bus buffer
D8-D15
8-15
D0-D7
D8-D15
D0-D7
16-23
D8-D15
D0-D7
24-31
D8-D15
Figure 6.58 Flash Memory Wiring
Rev. 10.00 Oct. 15, 2009 Page 347 of 366
REJ10J1003-1000
Section 6 Tutorial
Table 6.5 Sample Program Specifications
Item
Contents
RAM area to be used
H'0C001000 to H'0C0015BF
Write module start address
H'0C001100
Erase module start address
H'0C001000
• Since the SDRAM is used, the bus controller must be set.
• Set the options on the [Loading flash memory] page in the [Configuration] dialog box as
follows:
Figure 6.59 [Loading flash memory] Page
Rev. 10.00 Oct. 15, 2009 Page 348 of 366
REJ10J1003-1000
Section 6 Tutorial
Notes: 1. When the data has already been written in the flash memory, be sure to select [Enable]
for [Erasing flash memory]. If [Disable] is selected, a verify error occurs.
2. When [Erasing flash memory] is selected, it takes about one minute to erase the flash
memory (in this example).
• Select the object for downloading to the flash memory area.
6.22
What Next?
This tutorial has described the major features of the emulator and the use of the High-performance
Embedded Workshop.
Sophisticated debugging can be carried out by using the emulation functions that the emulator
offers. This provides for effective investigation of hardware and software problems by accurately
isolating and identifying the conditions under which such problems arise.
Rev. 10.00 Oct. 15, 2009 Page 349 of 366
REJ10J1003-1000
Section 6 Tutorial
Rev. 10.00 Oct. 15, 2009 Page 350 of 366
REJ10J1003-1000
Section 7 Troubleshooting
Section 7 Troubleshooting
1. I have a text file open in the editor but syntactic color-coding is not being displayed.
Ensure that you have named the file (i.e. saved it) and that the “Syntax coloring” check box is
set on the “Editor” tab of the “Options” dialog box, which is launched via [Setup ->
Options...]. The High-performance Embedded Workshop looks up the filename extension to
determine the group to which the file belongs and decides whether or not coloring should be
applied to the file. To view the currently defined filename extensions and file groups, select
[Project -> File Extensions...] to launch the “File Extensions” dialog box. To view the
coloring information, select [Setup -> Format] to display the “Color” tab of the “Format”
dialog box (for further details, see the “Syntax Coloring” section in Chapter 4, “Using the
Editor,” of the volume on the High-performance Embedded Workshop).
2. I want to change the settings of a tool but the [Tools->Administration…] menu option is not
selectable.
[Tools->Administration...] is not selectable while a workspace is open. To open the “Tool
Administration” dialog box, close the current workspace.
3. I opened a workspace from my PC, and one of my colleagues opened the same workspace
simultaneously from another PC. I changed the settings of the workspace and saved it. My
colleague saved the workspace after me. I opened the workspace again and found that the
settings of the workspace differed from those I had made.
The last settings to be saved are effective. While a workspace is open in the High-performance
Embedded Workshop, updating of the workspace is within the memory. The settings are not
saved in a file unless the user intentionally saves the workspace.
In addition to above, refer to FAQs on the emulator and High-performance Embedded Workshop
on the Renesas web site (www.renesas.com).
Rev. 10.00 Oct. 15, 2009 Page 351 of 366
REJ10J1003-1000
Section 7 Troubleshooting
Rev. 10.00 Oct. 15, 2009 Page 352 of 366
REJ10J1003-1000
Appendix A Menus
Appendix A Menus
Table A.1 shows GUI menus.
Table A.1 GUI Menus
Toolbar
Button
Menu
Option
Shortcut
View
Disassembly
Ctrl + D
Opens the [Disassembly]
window.
Command Line
Ctrl + L
Opens the [Command Line]
window.
TCL toolkit
Ctrl +
Shift + L
Opens the [Console] window.
Workspace
Alt + K
Opens the [Workspace] window.
Output
Alt + U
Opens the [Output] window.
Difference
CPU
Remarks
Opens the [Difference] window.
Registers
Ctrl + R
Opens the [Register] window.
Memory…
Ctrl + M
Opens the [Memory] window.
IO
Ctrl + I
Opens the [IO] window.
Status
Ctrl + U
Opens the [Status] window.
Cache
Shift +
Ctrl + C
Opens the [Cache] window.
TLB
Shift +
Ctrl + X
Opens the [TLB] window.
Shift +
Ctrl + E
Opens the [Monitor Setting]
dialog box.
Monitor
Monitor
Setting…
Window
Select…
Extended Monitor
Opens the [Window Select]
dialog box.
Opens the [Extended Monitor]
window.
Rev. 10.00 Oct. 15, 2009 Page 353 of 366
REJ10J1003-1000
Appendix A Menus
Table A.1 GUI Menus (cont)
Menu
Option
View
(cont)
Symbol
(cont)
Code
Graphic
Performance
Setup
Radix
Shortcut
Remarks
Labels
Shift +
Ctrl + A
Opens the [Labels] window.
Watch
Ctrl + W
Opens the [Watch] window.
Locals
Shift +
Ctrl + W
Opens the [Locals] window.
Eventpoints
Ctrl + E
Opens the [Event] window.
Trace
Ctrl + T
Opens the [Trace] window.
Code Coverage
Shift +
Ctrl + H
Opens the [Code Coverage]
window and shows the result
acquired by this function.
Stack Trace
Ctrl + K
Opens the [Stack Trace] window.
Image…
Shift +
Ctrl + G
Opens the [Image] window.
Waveform…
Shift +
Ctrl + V
Opens the [Waveform] window.
Performance
Analysis
Shift +
Ctrl + P
Opens the [Performance Analysis]
window.
Profile
Shift +
Ctrl + F
Opens the [Profile] window.
Realtime Profile
Shift +
Ctrl + Q
Opens the [Realtime Profile]
window.
Hexadecimal
Uses a hexadecimal for displaying
a radix in which the numerical
values will be displayed and
entered by default.
Decimal
Uses a decimal for displaying a
radix in which the numerical values
will be displayed and entered by
default.
Rev. 10.00 Oct. 15, 2009 Page 354 of 366
REJ10J1003-1000
Toolbar
Button
Appendix A Menus
Table A.1 GUI Menus (cont)
Menu
Option
Setup
(cont)
Radix
(cont)
Emulator
Debug
Shortcut
Toolbar
Button
Remarks
Octal
Uses an octal for displaying a radix
in which the numerical values will
be displayed and entered by
default.
Binary
Uses a binary for displaying a
radix in which the numerical values
will be displayed and entered by
default.
System…
Opens the [Configuration
Properties] dialog box allowing the
user to modify the debugging
platform settings.
Memory
Resource…
Opens the [Memory Mapping]
dialog box to set memory
mapping.
Debug Sessions…
Opens the [Debug Sessions]
dialog box to list, add, or remove
the debug session.
Debug Settings…
Opens the [Debug Settings] dialog
box to set the debugging
conditions or download modules.
Reset CPU
Resets the target hardware and
sets the PC to the reset vector
address.
Go
F5
Starts executing the user program
at the current PC.
Reset Go
Shift + F5
Resets the target microcomputer
and executes the user program
from the reset vector address.
Go To Cursor
Starts executing the user program
at the current PC until the PC
reaches the address indicated by
the current text cursor position.
Set PC To Cursor
Sets the PC to the address at the
row of the text cursor.
Rev. 10.00 Oct. 15, 2009 Page 355 of 366
REJ10J1003-1000
Appendix A Menus
Table A.1 GUI Menus (cont)
Menu
Option
Debug
(cont)
Run…
Shortcut
Toolbar
Button
Remarks
Launches the [Run Program]
dialog box allowing the user to
enter the PC or S/W breakpoint
during executing the user
program.
Step In
F11
Executes a block of user program
before breaking.
Step Over
F10
Executes a block of user program
before breaking. If a subroutine
call is reached, then the
subroutine will not be entered.
Step Out
Shift +
F11
Executes the user program to
reach the end of the current
function.
Step…
Step
Mode
Launches the [Step Program]
dialog box allowing the user to
modify the settings for stepping.
Auto
Steps only one source line when
the [Editor] window is active.
When the [Disassembly] window
is active, stepping is executed in a
unit of assembly instructions.
Assembly
Executes stepping in a unit of
assembly instructions.
Source
Steps only one source line.
Halt Program
Esc
Stops the execution of the user
program.
Connect
Connects the debugging platform.
Initialize
Disconnects the debugging
platform and connects it again.
Disconnect
Disconnects the debugging
platform.
Download Modules
Downloads the object program.
Unload Modules
Unloads the object program.
Rev. 10.00 Oct. 15, 2009 Page 356 of 366
REJ10J1003-1000
Appendix B Command-Line Functions
Appendix B Command-Line Functions
The emulator supports the commands that can be used in the command-line window.
For details, refer to the online help.
Rev. 10.00 Oct. 15, 2009 Page 357 of 366
REJ10J1003-1000
Appendix B Command-Line Functions
Rev. 10.00 Oct. 15, 2009 Page 358 of 366
REJ10J1003-1000
Appendix C Notes on High-performance Embedded Workshop
Appendix C Notes on High-performance Embedded
Workshop
1.
Note on Moving Source File Position after Creating Load Module
When the source file is moved after creating the load module, the [Open] dialog box may be
displayed to specify the source file during the debugging of the created load module. Select
the corresponding source file and click the [Open] button.
2. Source-Level Execution
⎯ Source file
Do not display source files that do not correspond to the load module in the program
window. For a file having the same name as the source file that corresponds to the load
module, only its addresses are displayed in the program window. The file cannot be
operated in the program window.
⎯ Step
Even standard C libraries are executed. To return to a higher-level function, enter Step
Out. In a for statement or a while statement, executing a single step does not move
execution to the next line. To move to the next line, execute two steps.
3. Operation During Accessing Files
Do not perform other operations during downloading the load module, operating [Verify
Memory] or [Save Memory] in the [Memory] window, or saving in the [Trace] or [Code
Coverage] window because this will not allow correct file accessing to be performed.
4. Watch
⎯ Local variables at optimization
Depending on the generated object code, local variables in a C source file that is compiled
with the optimization option enabled will not be displayed correctly. Check the generated
object code by displaying the [Disassembly] window.
If the allocation area of the specified local variable does not exist, displays as follows.
Example:
The variable name is asc.
asc = ? - target error 2010 (xxxx)
⎯ Variable name specification
When a name other than a variable name, such as a symbol name or function name, is
specified, no data is displayed.
Rev. 10.00 Oct. 15, 2009 Page 359 of 366
REJ10J1003-1000
Appendix C Notes on High-performance Embedded Workshop
Example:
The function name is main.
main =
5. Line Assembly
⎯ Input radix
Regardless of the Radix setting, the default for line assembly input is decimal. Specify H’
or 0x as the radix for a hexadecimal input.
6. Command Line Interface
⎯ Batch file
To display the message “Not currently available” while executing a batch file, enter the
sleep command. Adjust the sleep time length which differs according to the operating
environment.
Example:
To display “Not currently available” during memory_fill
execution:
sleep d’3000
memory_fill 0 ffff 0
7. File specification by commands
The current directory may be altered by file specifications in commands. It is recommended to
use absolute paths are recommended to be used to specify the files in a command file so that
the current directory alteration is not affected.
Example:
FILE_LOAD C:\HEW\Tools\Renesas\DebugComp\Platform\E200F
\Tutorial\Tutorial\Debug_SHxxxx_E200F_SYSTEM\tutorial.abs
8. Memory Save During User Program Execution
Do not execute memory save or verifying during user program execution.
9. Load of Motorola S-type Files
This High-performance Embedded Workshop does not support Motorola S-type files with only
the CR code (H'0D) at the end of each record. Load Motorola S-type files with the CR and LF
codes (H'0D0A) at the end of each record.
10. Note on [Register] Window Operation During Program Execution
The register value cannot be changed in the [Register] window during program execution.
Even if the changed value is displayed, the register contents are not changed actually.
Rev. 10.00 Oct. 15, 2009 Page 360 of 366
REJ10J1003-1000
Appendix C Notes on High-performance Embedded Workshop
11. Break Function
⎯ BREAKPOINT cancellation
When the contents of the BREAKPOINT address is modified during user program
execution, the following message is displayed when the user program stops.
BREAKPOINT IS DELETED A=xxxxxxxx
If the above message is displayed, cancel all BREAKPOINT settings with the [Delete All]
or [Disable] button in the [Event] window.
12. Number of BREAKPOINT and [Stop At] Settings in the [Run...] Menu
The maximum number of BREAKPOINTs and [Stop At] settings allowed in the [Run...] menu
is 1000. Therefore, when 1000 BREAKPOINTs are set, specification by [Stop At] in the
[Run...] menu becomes invalid. Use the BREAKPOINTs and [Stop At] in the [Run...] menu
with 1000 or less total settings.
13. Note on RUN-TIME Display
The execution time of the user program displayed in the [Status] window is not a correct value
since the timer in the host computer has been used.
14. Note on Displaying Timeout error
If Timeout error is displayed, the emulator cannot communicate with the target
microcomputer. Turn off the user system and connect the USB connector of the emulator
again by using the High-performance Embedded Workshop.
15. Note on Using the [Run Program] Dialog Box
When [Run...] is selected from the [Debug] menu to specify the stop address, there is the
following note:
⎯ When the breakpoint that has been set as Disable is specified as the stop address, note that
the breakpoint becomes Enable when the user program stops.
16. BREAKPOINT Setting for SLEEP Instruction
When a break is set for the SLEEP instruction, use the Break Condition not the
BREAKPOINT.
17. Host Computer in the Sleep or Hibernating Mode
The host computer must not enter the sleep or hibernating mode while the emulator is in use:
otherwise the emulator will not be operable. In such a case, re-connect the emulator after the
host computer has left the sleep or hibernating mode.
Rev. 10.00 Oct. 15, 2009 Page 361 of 366
REJ10J1003-1000
Appendix C Notes on High-performance Embedded Workshop
18. Manual Navigator
®
Use the following procedure before running a program on Windows Vista .
(1) Be logged on as an administrator.
(2) Open the properties of the man_navi.exe file in the [Manuals] folder, which is under the
folder where the High-performance Embedded Workshop has been installed.
(3) Select [Run this program as an administrator] on the [Compatible] tabbed page.
®
Note: The 64-bit editions of Windows Vista have not been supported.
Rev. 10.00 Oct. 15, 2009 Page 362 of 366
REJ10J1003-1000
Appendix D Repair Request Sheet
Appendix D Repair Request Sheet
Thank you for purchasing the E200F emulator (R0E0200F1EMU00).
In the event of a malfunction, fill in the repair request sheet on the following pages and send it to
your distributor.
Rev. 10.00 Oct. 15, 2009 Page 363 of 366
REJ10J1003-1000
Appendix D Repair Request Sheet
Repair Request Sheet
To Distributor
Your company name:
Person in charge:
Tel.:
Rev. 10.00 Oct. 15, 2009 Page 364 of 366
REJ10J1003-1000
Appendix D Repair Request Sheet
Item
Symptom
1. Date and time when the malfunction
occurred
Month/Day/Year {at system initiation, in system operation}
2. Frequency of generation of the
malfunction
( ) times in ( ) {day(s), week(s), or month(s)}
3. System configuration when the
malfunction occurred
System configuration of the emulator:
•
E200F emulator (R0E0200F1EMU00):
*Circle either of items in the braces { }.
*Enter the appropriate numbers in the parentheses ( ) and
circle one of the three items in the braces { }.
Serial No.:
Revision:
•
The above items are written on the label for product
management on the base of the emulator unit: the
four-digit number is the serial no. and the string of
letters following that is the revision.
External bus trace unit (R0E200F1ETU00):
Serial No.:
•
•
•
•
Revision:
The above items are written on the board.
Emulation memory unit (R0E0200F1MSR00,
R0E0200F1MSR01):
Serial No.:
Revision:
The above items are written on the board.
EV-chip unit (R0E57xxxxVKK00):
Serial No.:
Revision:
The above items are written on the board.
Expansion profiling unit (R0E0200F0EPU00)
Serial No.:
Revision:
The above items are written on the board.
Provided CD-R (R0E0200F1EMU00S):
Version: V.
•
Shown as ‘V.x.xx release xx’ on the CD-R (x: numeral).
Host computer in use:
Manufacturer:
Type number:
OS: (Windows® 2000, Windows® XP, or Windows
Vista®)
Rev. 10.00 Oct. 15, 2009 Page 365 of 366
REJ10J1003-1000
Appendix D Repair Request Sheet
Item
Symptom
4. Settings when the malfunction
occurred
(1) Operating mode:
mode
(2) Target system voltage:
V
(3) The clock in use: (Circle any of followings, the Xtal
oscillator, external clock input, or emulator clock.)
(4) Operating frequency:
MHz
5. Failure phenomenon
6. Error in debugging
7. Error in the diagnostic program
8. The High-performance Embedded
Workshop does not link-up with the
emulator.
Content of the error message
For errors other than the above, fill in the box below.
Rev. 10.00 Oct. 15, 2009 Page 366 of 366
REJ10J1003-1000
SH-2A, SH-2 E200F Emulator User's Manual
Publication Date: Rev.1.00, December 20, 2004
Rev.10.00, October 15, 2009
Published by:
Sales Strategic Planning Div.
Renesas Technology Corp.
Edited by:
Customer Support Department
Global Strategic Communication Div.
Renesas Solutions Corp.
© 2009. Renesas Technology Corp., All rights reserved. Printed in Japan.
Sales Strategic Planning Div.
Nippon Bldg., 2-6-2, Ohte-machi, Chiyoda-ku, Tokyo 100-0004, Japan
RENESAS SALES OFFICES
http://www.renesas.com
Refer to "http://www.renesas.com/en/network" for the latest and detailed information.
Renesas Technology America, Inc.
450 Holger Way, San Jose, CA 95134-1368, U.S.A
Tel: <1> (408) 382-7500, Fax: <1> (408) 382-7501
Renesas Technology Europe Limited
Dukes Meadow, Millboard Road, Bourne End, Buckinghamshire, SL8 5FH, U.K.
Tel: <44> (1628) 585-100, Fax: <44> (1628) 585-900
Renesas Technology (Shanghai) Co., Ltd.
Unit 204, 205, AZIACenter, No.1233 Lujiazui Ring Rd, Pudong District, Shanghai, China 200120
Tel: <86> (21) 5877-1818, Fax: <86> (21) 6887-7858/7898
Renesas Technology Hong Kong Ltd.
7th Floor, North Tower, World Finance Centre, Harbour City, Canton Road, Tsimshatsui, Kowloon, Hong Kong
Tel: <852> 2265-6688, Fax: <852> 2377-3473
Renesas Technology Taiwan Co., Ltd.
10th Floor, No.99, Fushing North Road, Taipei, Taiwan
Tel: <886> (2) 2715-2888, Fax: <886> (2) 3518-3399
Renesas Technology Singapore Pte. Ltd.
1 Harbour Front Avenue, #06-10, Keppel Bay Tower, Singapore 098632
Tel: <65> 6213-0200, Fax: <65> 6278-8001
Renesas Technology Korea Co., Ltd.
Kukje Center Bldg. 18th Fl., 191, 2-ka, Hangang-ro, Yongsan-ku, Seoul 140-702, Korea
Tel: <82> (2) 796-3115, Fax: <82> (2) 796-2145
Renesas Technology Malaysia Sdn. Bhd
Unit 906, Block B, Menara Amcorp, Amcorp Trade Centre, No.18, Jln Persiaran Barat, 46050 Petaling Jaya, Selangor Darul Ehsan, Malaysia
Tel: <603> 7955-9390, Fax: <603> 7955-9510
Colophon 6.2
SH-2A, SH-2 E200F Emulator
User’s Manual
1753, Shimonumabe, Nakahara-ku, Kawasaki-shi, Kanagawa 211-8668 Japan
REJ10J1003-1000