1
PRODUCT DOCUMENTATION
PivotalVRP
Version 6.0
User Guide
Rev: A01 – June 10, 2014
© 2014 Pivotal Software, Inc.
PivotalVRP
PivotalVRP 6.0 User Manual
Copyright
Copyright © 2014 Pivotal Software, Inc. All Rights reserved.
Pivotal Software, Inc. believes the information in this publication is accurate as of
its publication date. The information is subject to change without notice. THE
INFORMATION IN THIS PUBLICATION IS PROVIDED "AS IS." Pivotal
Software, Inc. ("Pivotal") MAKES NO REPRESENTATIONS OR WARRANTIES
OF ANY KIND WITH RESPECT TO THE INFORMATION IN THIS
PUBLICATION, AND SPECIFICALLY DISCLAIMS IMPLIED WARRANTIES OF
MERCHANTABILITY OR FITNESS FOR A PARTICULAR PURPOSE.
Use, copying, and distribution of any Pivotal software described in this
publication requires an applicable software license.
All trademarks used herein are the property of Pivotal or their respective owners.
Use of Open Source
This product may be distributed with open source code, licensed to you in
accordance with the applicable open source license. If you would like a copy of
any such source code, Pivotal will provide a copy of the source code that is
required to be made available in accordance with the applicable open source
license. Pivotal may charge reasonable shipping and handling charges for such
distribution.
About Pivotal Software, Inc.
Greenplum transitioned to a new corporate identity (Pivotal, Inc.) in 2013. As a
result of this transition, there will be some legacy instances of our former
corporate identity (Greenplum) appearing in our products and documentation. If
you have any questions or concerns, please do not hesitate to contact us
through our web site: http://gopivotal.com/about-pivotal/support.
2
PivotalVRP
PivotalVRP 6.0 User Manual
Contents
Chapter 1. PivotalVRP Overview
_____________________________________________ 5
About PivotalVRP ____________________________________________________________________________ 6
System Architecture ___________________________________________________________________________ 8
Opening the Application _______________________________________________________________________ 9
Chapter 2. Managing System Settings
________________________________________ 13
User Management ___________________________________________________________________________ 14
General Settings ____________________________________________________________________________ 17
Repository Settings __________________________________________________________________________ 18
My User Settings ____________________________________________________________________________ 19
Chapter 3. Viewing Data from the Database
___________________________________ 20
Overview __________________________________________________________________________________ 21
Understanding the Dashboard __________________________________________________________________ 22
Using Right-click Functions for Managing Resources ________________________________________________ 23
Managing SQL Resources _________________________________________________________________ 23
Creating Rules from Data __________________________________________________________________ 24
Rule Action _____________________________________________________________________________ 28
Creating Rules from SQL Text ______________________________________________________________ 30
Copying SQL Text ________________________________________________________________________ 32
Creating a tuning task _____________________________________________________________________ 32
Tagging SQL Text ________________________________________________________________________ 33
Display session info _______________________________________________________________________ 33
Display explain plan _______________________________________________________________________ 34
Kill Session _____________________________________________________________________________ 34
Changing User ___________________________________________________________________________ 35
Chapter 4. Administering Rules
_____________________________________________ 36
Rules Overview _____________________________________________________________________________ 37
Managing Modules __________________________________________________________________________ 38
Adding a New Module _____________________________________________________________________ 38
Removing a Module _______________________________________________________________________ 39
Editing a Module _________________________________________________________________________ 39
Managing Rules _____________________________________________________________________________ 40
Adding a New Rule _______________________________________________________________________ 40
Modifying Rule Activation Overrides __________________________________________________________ 42
Modifying a Rule _________________________________________________________________________ 43
3
PivotalVRP
PivotalVRP 6.0 User Manual
Removing a Rule _________________________________________________________________________ 43
Rules best practices ______________________________________________________________________ 43
Chapter 5. Working with Graphs
____________________________________________ 45
Accessing the Graphs ________________________________________________________________________ 46
The PivotalVRP Graph Window _________________________________________________________________ 47
Top Queries _____________________________________________________________________________ 47
Load vs. Runtime _________________________________________________________________________ 49
Statistics _______________________________________________________________________________ 50
Query Distribution ________________________________________________________________________ 50
Query Analysis __________________________________________________________________________ 53
Runtime statistics ________________________________________________________________________ 54
Right click and double click functions _________________________________________________________ 55
Chapter 6. Working with Add-Ons
___________________________________________ 57
Add-Ons button bar __________________________________________________________________________ 58
Tuning Tasks ____________________________________________________________________________ 58
Chargeback _____________________________________________________________________________ 59
Rules Wizard ____________________________________________________________________________ 61
Variance _______________________________________________________________________________ 62
Inquire _________________________________________________________________________________ 64
Playback _______________________________________________________________________________ 68
Performance BI __________________________________________________________________________ 69
Chapter 7. Managing the PivotalVRP Agent
___________________________________ 71
Installing the Agent __________________________________________________________________________ 72
Stopping the Agent __________________________________________________________________________ 74
Chapter 8. Important Files within PivotalVRP ___________________________________ 75
4
PivotalVRP
PivotalVRP 6.0 User Manual
Chapter 1 PivotalVRP Overview
This section provides you with an overview of PivotalVRP, its architecture, and the information you need to get
started:
Topics:
About PivotalVRP
System Architecture
Opening the Application
5
PivotalVRP
PivotalVRP 6.0 User Manual
About PivotalVRP
PivotalVRP (Virtual Resource Partitioning) enables your organization to execute Virtual Resource Partitioning
of hardware resources (CPU, I/O) of your IT transactions based on business priorities and needs in real-time.
By building the VRP, your organization is able to manage the load of each transaction individually, providing a
better QoS and response time for all your transactions.
PivotalVRP software boosts performance and availability of database-dependent applications in real-time.
PivotalVRP is applicable to a wide spectrum of DB-based enterprise environments, in particular database
infrastructure supporting ERP, CRM, DW, in-house applications, and other mission-critical applications.
PivotalVRP communicates with the database and the operating system and then displays the results on a
dashboard. Armed with this information, you are then able to define specific rules to reduce the resources
allocated to exceptionally heavy transactions that could cripple your system while leaving resources available
for other transactions.
PivotalVRP collects various statistics, correlates them and then logs them into an internal repository. You can
then monitor the system-defined rules and correct them as necessary. When a rule is defined, the virtual
partitioning of the server resources is carried out immediately. It is completely transparent to the database and
therefore there are no special configuration modifications required at the database level.
PivotalVRP provides the following functionality:
Immediate real-time improvement in your IT systems.
Real-time capability to reallocate resources in order to reduce unexpected heavy loads in systems in
production.
Real-time and historical monitoring of your databases.
Control of resources and management of rollback that avoids both additional unwanted loads as well as
any need to kill transactions
Improved Performance, Availability, Stability and QoS throughout the daytime hours.
Ability to specify computing resources (CPU, I/O) for specific transactions.
Ability to run BI, batches, backups and other heavy transactions together in the middle of the day by simply
limiting their resources instead of delaying them.
Ability to manage existing resources more efficiently.
Pre-defined rules and modules for ERP, CRM, DBA tools, BI and Data Warehouse that can be fine-tuned
to specific needs and added to when required.
Total transparency to users and applications.
Definition of custom rules quickly and easily.
6
PivotalVRP
PivotalVRP 6.0 User Manual
Reduction in use of power and datacenter capacity.
Allocation of resources so that the most important transactions have the lowest response times and the
most resources.
Receipt of alerts anywhere.
Acceleration of transactions for high-priority modules or users that you want to run faster in accordance to
your business needs.
Upgradeable though various modules for your future business needs.
7
PivotalVRP
PivotalVRP 6.0 User Manual
System Architecture
PivotalVRP is composed of the following two main elements:
PivotalVRP Console
PivotalVRP Console is an MS Windows-based WEB_GUI console that can be installed on any PC that runs
Windows XP SP2, 2003, 2008, 2012,Vista, Windows 7 and Windows 8 . The console allows you to monitor
your various databases, investigate performance issues and apply manual or automatic rules as needed.
PivotalVRP Agent
PivotalVRP Agent is installed on the database server itself. The agent is controlled by the console and
performs the actual resource allocation according to the rules.
PivotalVRP Agent's footprint in an average database is 0.5% of a single CPU, where, for example, on a
machine with four CPUs, PivotalVRP consumes ~0.12% of the machine's CPU capacity. The system's console
is installed on a dedicated Windows PC/Server on the network, collects various statistics, correlates them, and
then logs them into an internal repository.
The system can be easily monitored and controlled by pre-defined rules, and corrected as required. When a
rule is defined, the virtual partitioning of the server's resources is performed immediately by the PivotalVRP
Agent. Fully transparent to the database, it does not require special configuration at the DB level. Data is
clearly displayed on the system dashboard on the PivotalVRP Console. The dashboard allows users (DBAs
and managers) to identify problems in the SLA, and pinpoint any heavy transaction that may be the cause of
the problem. Users can create rules and prioritize the resource usage directly from the dashboard.
PivotalVRP supports Greenplum version 4.x and higher both CE & SNE databases on the following operating
systems: Red Hat Linux, SUSE, Linux, Sun Solaris, HPUX, IBM AIX and Oracle Enterprise Linux.
8
PivotalVRP
PivotalVRP 6.0 User Manual
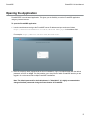
Opening the Application
PivotalVRP EE is a web based application. This gives you the flexibility to use the PivotalVRP application
using any internet browser.
To open the PivotalVRP application:
1. Launch a web browser and type the PivotalVRP server IP address and port number as follows:
https://<MoreServerIPAddress>:Port9191/<MoreVRP HTML page> in the address field.
For example: https://XXX.YYY.ZZZ.XYY:9191/MoreVRP.html.
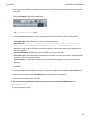
2. Enter the company name (registered at the time of installation), login in as administrator with the default
password, and click on Login. This field enables you to keep track of which PivotalVRP domain you are
logged in in environments with multiple PivotalVRP installations.
Note: The default password for the Administrator is "Admin2010". It is highly recommended to
change all default passwords during the first activation of PivotalVRP.
9
PivotalVRP
PivotalVRP 6.0 User Manual
3. After Login to PivotalVRP you need to connect to the GP. Therefore you need to configure the connection
to the GP:
Select the Settings TAB from the Main Menu.
The General Settings Screen opens.
4. Click on the Add button and the Server Information window opens. Enter the following information:
Connection Name: Enter whatever you wish to call the master view.
Host Name / IP: x.x.x.x - x.x.x.x is the IP of the master node (it can be the
PUBLIC IP) / When adding single segments, the IP of the segment host.
Port: When using the auto connect the master port (default is 5432)/ When adding single segments, the
port of the segment.
Username/Password: As defined (for the PivotalVRP connection to the DB)
Connection Type: Select Automatic enumeration for connection to the full environment / Single Segment if
you wish to connect to a single segment
Test Connection : Verifies that the setting are correct and that PivotalVRP can communicate with the
segments
Press OK.
5. Provided PivotalVRP was installed correctly, you will see the segments populating the Known Server list.
6. Once you are connected, select Dashboard from the Main Menu in the left pane.
You can now start working with PivotalVRP.
If you encounter any problems during the above procedure, contact PivotalVRP support, at :
[email protected]
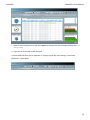
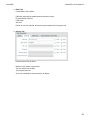
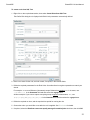
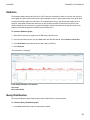
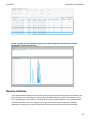
The General Settings screen
10
PivotalVRP
PivotalVRP 6.0 User Manual
The General Settings table below details the login information and system settings displayed in this screen:
Setting
Description
Connection Name
Name of the view
Host Name / IP
The IP of the Master node or segment server, depending on the connection
type
Port
default for master (for auto connect) is 5432, for single connection use the port
User Name
As defined according to the installation manual
Password
As defined according to the installation manual
Connection Type
Selector for full environment connection vs single segment.
Test Connection
Verifies the connection settings and communication with the segment(s)
Automatically connect upon
disconnection
By default this is checked, attempts re-connection to segments if connection is
lost
Limit number of reconnect attempts
By default this is unchecked, gives you manual control of re-connection
attempts
Data and statistics polling settings
Data polling interval
Data polling interval from the database memory
Statistics polling interval
Statistics polling interval from the OS
Connection timeout
Timeout settings in seconds
Maximum IO
IO per second threshold setting
Repository setting
User definable from 2 weeks to 12 month*
(* it is recommended to go up to 6 month)
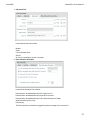
Dashboard - Administrator Mode
11
PivotalVRP
PivotalVRP 6.0 User Manual
1. Return to the Privileges screen, and click Logout, as defined in the User Privileges settings (see User
Management).
2. Login into an account with viewer privileges
In Viewer Mode the Rules are not applicable. In settings only the "My User Settings" is accessible.
Dashboard - Viewer Mode
12
PivotalVRP
PivotalVRP 6.0 User Manual
Chapter 2 Managing System Settings
Topics:
User Management
General Settings
Repository Settings
My User Settings
13
PivotalVRP
PivotalVRP 6.0 User Manual
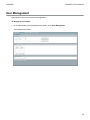
User Management
Administrators control users access to the application.
To Manage User Privileges:
1. As an Administrator, from the Settings menu option, select User Management.
User Management Screen
14
PivotalVRP
PivotalVRP 6.0 User Manual
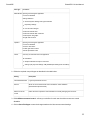
User type
Functions
Administrator Opening and closing the application
Connect to database
Settings definition:
General System Settings and login information
Repository Settings
User Access Privileges
Create and activate rules
Create and activate SQL enhancers
Create reports and graphs
All right-click functions
Operator
Opening and closing the application
Connect to database
Access to all screens
Limited right-click functions
Activate pre-defined rules
Viewer
View only access within the main application:
Dashboard
Graphs & Modules except for Locks view
Settings (only My User Settings & My EmailGraphs Settings are accessible)
2. Define the required user privileges as described in the table below:
Setting
Description
User Name/Password
Login and passwords the user.
Servers:
Allows to choose what access level is enabled on which database.
(administrator/operator/viewer)
Minimum manual
control
Define the level of Operator control allowed for manually managing the resources
3. Define Minimum manual control – allows you to define for each user the minimum resource control
allowable.
4. Click on Save Privileges to save the changes made to the User access control settings.
15
PivotalVRP
PivotalVRP 6.0 User Manual
Note: If you forget your Administrator password, you may contact the PivotalVRP support center by
e-mail ( [email protected] ). Following a short verification procedure, you will receive a
password reset file for the Administrator user.
16
PivotalVRP
PivotalVRP 6.0 User Manual
General Settings
To manage General System settings:
1. From the Settings menu option, select General.
The General Settings screen is displayed
2. Enter the required settings (see General Settings Table).
3. Once the environment has been defined, the known servers list will display the current connections and
their status (
- connected and OK).
17
PivotalVRP
PivotalVRP 6.0 User Manual
Repository Settings
To manage the Repository settings:
1. From the Settings menu option, select Repository Settings.
2. Type in the Keep Data value (default: 3 month).
3. Click Save Settings.
The Repository Settings Screen
18
PivotalVRP
PivotalVRP 6.0 User Manual
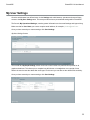
My User Settings
Once the administrator has defined users via the Settings tab; administrators, operators and users all have
access to the My User Settings area. This area provides access to personalized settings within PivotalVRP.
The first tab, My Operational Settings, contains general information such as email settings and logout timing.
Make sure that for User Name you enter a complete email address, for example: [email protected].
Once you have entered your custom settings, click Save Settings.
My User Settings Screen
The second tab, My Graph Settings, allows each user to save his/her own preferred time periods for all
graphs and add-ons. This allows you to complete long drill-downs or investigations over a period of time
without the need to reset the dates after each logout. In this area you can also set the default SQL sensitivity.
Once you have entered your custom settings, click Save Settings.
19
PivotalVRP
PivotalVRP 6.0 User Manual
Chapter 3 Viewing Data from the Database
Topics:
Overview
Understanding the Dashboard
Using Right-click Functions for Managing Resources
Managing SQL Resources
Creating Rules from Data
Rule Action
Creating Rules from SQL Text
Copying SQL Text
Creating a tuning task
Tagging SQL Text
Display session info
Display explain plan
Kill Session
Changing User
20
PivotalVRP
PivotalVRP 6.0 User Manual
Overview
PivotalVRP collects all the information about transactions submitted to and from the database, which typically
represent communications between user applications and the database, database functions, batch files, etc.
The collection of the information about the transactions, which is executed at the operating system level, is a
non-invasive process which does not affect the database in any way. The information that is collected is
displayed on the PivotalVRP Dashboard. Via the dashboard you can see any resource problems within your
applications and identify any heavy transactions that may be affecting its efficiency. In addition, you can create
rules and prioritize the resource usage directly from the dashboard.
21
PivotalVRP
PivotalVRP 6.0 User Manual
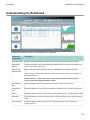
Understanding the Dashboard
The table below describes each element displayed in the Dashboard:
Dashboard
Description
Components
Acceleration Chart
Displays the relationship between transactions that are running and those that are managed.
Health (QoS)
Indicator
Calculates the Quality of Service provided by the database server to reflect the user experience in
terms of transaction response time.
Sessions Log:
Database Data
Displays a list of transactions currently running on the database server with live information.
In high level view, clicking the little triangle on the left of the session will open up the session tree
with all the slices info.
Double-clicking on a session drills down to show more information about the specific
session, right clicking displays additional options
CPU Utilization
Chart
Graphically displays the current percentage of CPU of the currently selected server
I/O Operations
Chart
Graphically displays the current usage of read/write I/O operations of the currently selected server
Memory
Graphically displays the memory usage of the currently selected server in a pie graph (free vs used)
Networking
Graphically displays the amount of network usage, both received and sent of the currently selected
server.
Server Selection
Enables the selection of the managed server for dashboard viewing from a pull down list of
connected servers.
22
PivotalVRP
PivotalVRP 6.0 User Manual
Using Right-click Functions for Managing Resources
You can manage resources, create rules and prioritize the resource usage directly from the dashboard by
using the right-click functions that become available when selecting a transaction in the Database Data area.
The table below lists the right-click functions that are available to each user type:
Right-click Function
User Type
Manage SQL Resources
Administrator and Operator
Create Rules from Data
Administrator only
Create Rules from SQL Text Administrator only
Copy SQL Text
Everyone
Create tuning task
Everyone
Create/Edit SQL tag
Administrator and Operator
Remove SQL tag
Administrator and Operator
Display session info
Everyone
Display explain plan
Everyone
Show estimated runtime
Everyone
Playback the last minutes
Everyone
Analyze query
Everyone
Show query segmentation
Everyone
Kill Session
Administrator and Operator
Managing SQL Resources
To Manage SQL Resources:
1. Right-click on the relevant transaction (either the entire session or individual slices), then select Start
Managing Resources.
The Manual Control dialog box is displayed.
23
PivotalVRP
PivotalVRP 6.0 User Manual
2. Using the slider set the throttle at the required setting, then click OK. The Manual control range can be
defined differently for each user by the administrator.
3. The control affects both CPU and IO at the same level, and relate to the maximum potential resource
usage of the session.
The Acceleration Chart will change to display the new level of resource management.
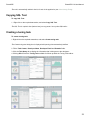
Creating Rules from Data
Using the information displayed in the dashboard, to determine the level of resource management required,
you can easily create a rule that will have an immediate effect on the managed resources. This option
automatically locates within the system most of the relevant data required to create a rule, requiring you to
proactively define only a minimum number of parameters.
For further information about creating rules, see Managing Rules.
To create a rule from data:
24
PivotalVRP
PivotalVRP 6.0 User Manual
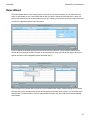
1. Right-click on the required transaction, then select Create Rules from Data.
The Defines Rule dialog appears. This dialog contains 3 sections:
Rule Information
Rule Thresholds – which contains four tabs: Basic, General, Advanced, Rule Activation Overrides
Rule Action
The Define Rule dialog
2. In the Rule information section, enter a new name for the rule, and rule remark if desired, in the relevant
fields.
3. The Rule Thresholds section consists of four tabs:
25
PivotalVRP
PivotalVRP 6.0 User Manual
a. Basic Tab
Use the Basic Tab to define:
DB name (right-clicking enables select all servers function).
Physical Reads / Write IO.
CPU usage.
SQL text.
Define the run time required, and the time period required for running the rule.
b. General Tab
Use the General Tab to define:
Machine name (which runs the SQL).
The user which runs the SQL.
The Program that runs.
All can be controlled by normal (literal) or by Regex.
26
PivotalVRP
PivotalVRP 6.0 User Manual
c. Advanced Tab
Use the Advanced Tab to define:
Module
Action
Client InfoHash Value
SQL ID
All can be controlled by normal or by regex
d. Rule Activation Overrides
Use the Rule Activation Tab to define:
Rule activation threshold defined by CPU load level in %
Rule activation threshold defined by Physical IO load level
Rule activation threshold defined by both CPU and Physical IO loads
Allow activation by other rules
Rule Priority
The Rule activation overrides are triggered by resource usage at the server level.
27
PivotalVRP
PivotalVRP 6.0 User Manual
Rule Action
In Rule Action you can choose what action a specific rule will trigger. A rule can trigger a certain level of
control of the available resources, the execution of scripts, notification or the activation of another rule. You
can define the same situation and have multiple actions happen in parallel. For instance if a particular user
runs a certain transaction and the load on your system is beyond a pre-defined threshold you can set
PivotalVRP to notify you via e-mail and reduce the resources available by a certain percentage.
Rule Action Dropdown Menu
There are four types of Rule Action:
Control
Execute Script
Send Email
Activate Rule
Each is described below:
28
PivotalVRP
PivotalVRP 6.0 User Manual
1. Control
With control you can use the slider to set the throttle level for the rule.
To select the option Distribute resources equally among all controlled jobs, click the checkbox and
click on OK. This will distribute resources equally to similar processes. This can be used to avoid
parallels.
2. Execute Script
When selecting this you can activate scripts with this rule
29
PivotalVRP
PivotalVRP 6.0 User Manual
3. Send Email
When selected the rule will send notifications to the recipients.
Before use the mail settings have to be defined.
The Test Settings button will check you connection.
The Test Recipient will send a test e-mail to the recipient.
4. Activate Rule
The rule will activate a different rule.
The rule is automatically added to the list of rules in the application (see Administering Rules).
Creating Rules from SQL Text
This option for creating a rule, after reviewing the information displayed in the Dashboard, automatically
provides the SQL Text contained in the transaction, requiring you to define the remaining parameters.
For further information about creating rules, see Managing Rules
30
PivotalVRP
PivotalVRP 6.0 User Manual
To create a rule from SQL Text
1. Right-click on the required transaction, then select Create Rules from SQL Text.
The Define Rule dialog box is displayed with Rule Limits parameters automatically defined.
2. Enter a new name for the rule, and rule remark, if required, in the relevant fields.
3. Define the required parameters for the Rule Limits. Use either literal or regular expressions to match your
criteria.
For example – to cover all Schema (Usernames) except Schema that contains XXX, in its name, use:
^((?!XXX).)*$ in the Username field and then select the regexp button.
Another example: If you want to capture everything except a specific schema name, ABC, use:
\b(?!(?:[Aa][Bb][Cc])\b)[\w']+\b in the Username field and then select the regexp button.
4. Define the required run time, and the required time period for running the rule.
5. Choose the action you would like to use after the rule is applied. See Rule Action for details.
6. If required, select the Distribute resources equally among all controlled jobs check box, then click OK.
31
PivotalVRP
PivotalVRP 6.0 User Manual
The rule is automatically added to the list of rules in the application (see Administering Rules).
Copying SQL Text
To copy SQL Text:
1. Right-click on the required transaction, and select Copy SQL Text.
The SQL Text is copied to the clipboard and you may paste it to any other SQL editor.
Creating a tuning task
To create a tuning task:
1. Right-click on the required transaction, and select Create tuning task.
The Create tuning task dialog box is displayed with opening date automatically defined.
2. Fill the Task Creator, Developer Name, Developer Email and Remarks fields.
3. Click the Task Query tab to display the information that is being sent to the developer.
4. Clicking OK will have the Tuning Task available for follow up within the Tuning Task add-on.
32
PivotalVRP
PivotalVRP 6.0 User Manual
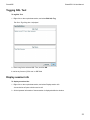
Tagging SQL Text
To tag SQL Text
1. Right-click on the required transaction, and select Edit SQL Tag.
The Set a Tag dialog box is displayed.
2. Enter a tag for the selected SQL Text, and click OK.
It can be any free text {/ SQL text / or DB Table
Display session info
To display a session info:
1. Right-click on the required transaction, and select Display session info
A new window will open with the session info.
2. All the important information of the transaction is displayed within the window.
33
PivotalVRP
PivotalVRP 6.0 User Manual
Display explain plan
To display the explain plan:
1. Right-click on the required transaction, and select Display explain plan
A new window will open with the execution plan for the selected transaction.
Kill Session
To kill a session:
34
PivotalVRP
PivotalVRP 6.0 User Manual
1. Right-click on the required transaction, and select Kill Session.
A confirmation messages is displayed.
2. Click yes to continue.
The selected transaction is stopped.
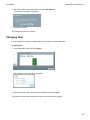
Changing User
You can change the user type currently defined in the system from the Dashboard.
To change user:
1. In the Dashboard, (Main GUI) click logout.
The Privileges Login dialog box is displayed.
2. Select the required user, enter the relevant password, and click Login.
The application functionality changes according to the user type now logged in.
35
PivotalVRP
PivotalVRP 6.0 User Manual
Chapter 4 Administering Rules
Topics:
Rules Overview
Managing Modules
Adding a New Module
Removing a Module
Editing a Module
Managing Rules
Adding a New Rule
Modifying Rule Activation Overrides
Modifying a Rule
Removing a Rule
Rules best practices
36
PivotalVRP
PivotalVRP 6.0 User Manual
Rules Overview
Rules are a set of thresholds and triggers that are user-configured directing the application on what action to
take (control resources, send email alert, activate script or activate other rule) based on the transaction
behaviour.
Rules can be defined according to various factors such as:
A specific SQL or part of it
The Database username which executed the transaction
The Machine sending the actual transaction (in the connected host)
The Hostname that initiated the transaction
The program that launched the transaction
According to the Module/Action of the transaction
The duration of the transaction
The amount of CPU or I/O the transaction consumes
The level of utilization of the database server
37
PivotalVRP
PivotalVRP 6.0 User Manual
Managing Modules
Modules are a set of rules that are grouped together in a logical folder which facilitates the activation of
multiple rules configured within the application.
Adding a New Module
To add a new module:
1. Select Rules TAB from the option in the main menu.
The Rules screen is displayed.
2. In the Modules pane, click Add Module or right-click in the Module pane and select Add Module.
A new branch is added to the Module tree.
3. Enter the required name for the new module.
38
PivotalVRP
PivotalVRP 6.0 User Manual
Removing a Module
In the Modules pane, select the required module, and click Remove Module or right-click in the Module pane
and select Remove Module.
1. A new window pops up requesting your action
2. Select move rules to a different module or select the remove button.
3. Once the rules moved to a different module or have been deleted the Module will disappear from the
Module tree
4. When you remove a module you will only be able to remove rules that you are allowed to administer
The module is removed from the Module tree.
Editing a Module
1. In the Modules pane, select the required module, and click Edit Module or right-click in the Module pane
and select Edit Module.
2. Enter a new name for the module.
39
PivotalVRP
PivotalVRP 6.0 User Manual
Managing Rules
Rules can be easily built and customized to facilitate efficient management of resources.
Adding a New Rule
To add a new rule:
In the Rules screen, click Add Rule.
The Define Rules dialog box is displayed.
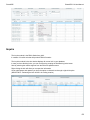
The table below describes the elements that are displayed in the Dashboard:
Use regular expression matching if necessary or literal (default)
New Rule Parameter Description
Rule Name
Enter a name of the new rule
Rule Creator
Enter the name of the creator
Last Update
Time stamp of rule creation/update
40
PivotalVRP
PivotalVRP 6.0 User Manual
New Rule Parameter Description
Rule Remark
Enter any relevant remarks for the new rule
DB Name –
Right-Clicking allows to select all servers or clear all
Selections.
In the Basic TAB
Physical Reads/Writes – Enter the number of physical Reads/ Writes of a transaction to trigger the rule
In the Basic TAB
CPU Usage –
Enter level of CPU usage for the new rule
In the Basic TAB
Buffer Hit Ratio –
Enter Hit Ratio
In the Basic TAB
SQL Text –
Enter the SQL text for the new rule (or part of it)
In the Basic TAB
Run Time –
From/To Time
Set the run time for the new rule
Set the time period for the new rule
In the Basic TAB
Machine –
Enter the machine that is running the application
in the General TAB
User Name –
Enter the user name
in the General TAB
Program –
Enter the program running the application
in the General TAB
Module –
The module name (if the application tags its sessions)
in the Advanced TAB
Action –
The action name (if the application tags its sessions)
in the Advanced TAB
Client Info –
-
in the Advanced TAB
Hash Value –
in the Advanced TAB
SQL ID –
in the Advanced TAB
Rule Actions
Defines the Action created by the rule:
Control – manages resources
Select check box to distribute resources equally among jobs controlled by the same rule.
Execute script – allows the execution of scripts
Send Email – send an e-mail
Activate rule – activates a pre-selected rule
41
PivotalVRP
PivotalVRP 6.0 User Manual
1. Enter all the required information and click OK.
The rule is added to the list of rules displayed in the Rules screen.
Notes:
All the textual fields are treated with a "Contains" filter. This means that if you type in a partial string
only, all the strings that contain the inserted string will trigger the rule. For example, if you enter
"count *" in the SQL Text field, all queries that contain this text will be managed.
If some of the fields remain empty, PivotalVRP ignores the filter. For example, if you leave the
UserName field empty, the rule will apply to every user in the database.
Modifying Rule Activation Overrides
If you want rules to be automatically activated only when the entire database server is under load, you can use
the Rule Activation Overrides. These rules allow you to configure the amount of resources the server should
reach prior to automatically activating the rule.
To modify the global thresholds of a rule:
1. In the Rules screen select the required rule and double click on it.
(or while creating a rule)
The Rule page shows up, select Rule Activation Overrides until it's displayed.
2. Define the thresholds as described in the table below:
Threshold
Description
Only activated when total CPU
load is above
Select the check box and enter the CPU load percentage to activate the rule when the
CPU load reaches the defined percentage
Only activated when total
Physical IO is above
Select the check box and enter the total I/O percentage to activate the rule when the
total I/O reaches the defined percentage
Use both CPU and IO
thresholds
Select the check box to use both the CPU and I/O thresholds for this rule
42
PivotalVRP
PivotalVRP 6.0 User Manual
Threshold
Description
Allow activation by other rules
Select the check box to allow other rules to activate this rule
Rule Priority
In case a certain event can is identified by 2 rules the rule with the highest priority will
take precedent.
Modifying a Rule
To modify a rule:
1. In the Rules screen, select the required rule, and click Edit Rule .
The Edit Rules dialog box is displayed.
2. Makes the necessary modifications to the rule, and click OK.
Removing a Rule
To remove a rule:
1. In the Rules screen, select the required rule, and click Remove Rule.
NOTE: there is no Remove Module dialog box to display.
Rules best practices
There are 3 types of rules:
Rules of stability : • These are in effect rules that are created in order to keep the DB environment at
optimal operation levels. They are defined and triggered by thresholds defined at the server level, at any
point when any single server gets to a particular load level, the heaviest resource consumers are restricted
in levels according to their loads. They are grouped and can be defined by CPU usage, IO usage and
runtime while using resources. Usually these will be defined in incremental steps
Targeted Rules :
• These can be triggered by a single parameter or a series of them. These are usually used when you are
targeting a specific user, process, application etc...
General Rules :
• These are created for certain situations but are applied to less specific processes. A good example is that
when you have multiple background processes running and you want to have additional resource
bandwidth available, you create these rules with thresholds lower than the rules of stability. These are
usually used during certain periods and activated on processes that run beyond a particular set time.
43
PivotalVRP
PivotalVRP 6.0 User Manual
Important! The PivotalVRP resource management and rule engine operate in real time, once the triggers
aren't valid the VRP ceases.
Please note: When using the rules to trigger alerts keep in mind that every single occurrence will send an
email, so when sending runtime based alerts select only the master as the db for the trigger.
44
PivotalVRP
PivotalVRP 6.0 User Manual
Chapter 5 Working with Graphs
Topics:
Accessing the Graphs
The PivotalVRP Graph Window
Top Queries
Load vs. Runtime
Statistics
Query Distribution
Query Analysis
Runtime statistics
Right click and double click functions
45
PivotalVRP
PivotalVRP 6.0 User Manual
Accessing the Graphs
To access the graphs:
1. From the Main Menu, select Graphs.
Note: The data that is presented in each of the graphs is data that is held in the Repository. This data
is updated based on the frequency defined in the Data cycling parameter in the Repository Settings
screen (see Repository Settings ).
46
PivotalVRP
PivotalVRP 6.0 User Manual
The PivotalVRP Graph Window
The graph section is divided into several tabs. Each tab gives you access to a different graph. The purpose of
these graph is to visualize your database performance from different aspects. They allow you to track your
performance (based on your repository) and see how PivotalVRP is boosting the ROI, improving your SLA and
making better use of your resources.
Top Queries
This graph uses a filtering mechanism, based either on Runtime, to display the queries that take the longest to
run in the system, or based on I/O, to display the queries that consume the largest amount of resources.
To create the Top Queries graph:
1. In the Choose Filters section, select the filter type from the Filter based on drop-down list.
Runtime, CPU per Sec., Reads Per sec., Writes Per Sec., Hitratio and Optimizercost.
2. In the Number of queries to filter field, enter the required number of filters.
3. In the from and to fields, select the Date period that you want to view.
4. In the DB Name field, select the DB that is being controlled. (right-click enables select all servers/clear
options)
5. Set the SQL Sensitivity as follows:
Lowest: presents high-level information about the queries so that similar SQL statements are treated as
one query (40 characters)
Highest: drills down into the queries to present more detailed information so that similar SQL
statements are presented individually (1000 characters)
Hashvalue: will present the top queries according to their actual hash value.
47
PivotalVRP
PivotalVRP 6.0 User Manual
6. Click Calculate.
The information is displayed.
7. Right Clicking a session will open a drop down menu which allows the user to copy the SQL text, create a
tuning task, create a rule or export the info to csv.
8. By double click on the SQL Text you will get more information about the specific SQL by way of Query
Segmentation graph.
48
PivotalVRP
PivotalVRP 6.0 User Manual
Some of the options include copying the SQL text, playing back events (analysis) creating tuning tasks, rules
and exporting to csv.
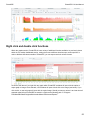
Load vs. Runtime
This graph is used to present information to show how the load on the system affects user experience when
running a query. The graph compares the load on the system to the runtime of the query, enabling you to see
the correlation between CPU or IO load and the execution time of queries. This enables you to build Rules
accordingly, paying particular attention to the Rule Global Thresholds (see Modifying a Rule).
To view the Load vs Runtime graph:
1. In the Choose Filters section, select the filter type from the Filter based on drop-down list. (CPU Per Sec.,
Reads Per Sec., Writes Per Sec.)
2. In the Host Name field, select the server that is being controlled.
3. Set the Start Date and Start Time, and End Date and End Time.
4. In the Number of Queries field, select the number of queries to be compared.
5. Click Calculate.
The information is displayed.
The graph displays the top queries as defined in the Number of Queries field. In the tab of each query is the
name of the query and the number of occurrences during the defined time period.
The chart will present the breaking point at which user experience is slowing down and performance is
deteriorating.
49
PivotalVRP
PivotalVRP 6.0 User Manual
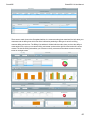
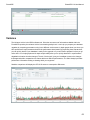
Statistics
The Statistics graph presents the level of IO & CPU resource consumption. When you mouse over any point
on the graph you get numerical values of the point selected. In order to get a better picture of any given point
you have the ability to right click and zoom in on a shorter period of time, this will provide a higher level of
resource usage detail. Please note that since you are reviewing an MPP environment the top level view
doesn't always provide a full picture, you have the ability to get this information at the segment level too by
selecting an individual segment in the DB name pull-down menu.
To create the Statistics graph:
1. Select the Environment or segment in the DB name pull down menu.
2. In the Choose Filters section, set the "from" Date and "to" Date period, and the Start and End Time.
3. In the Host Name field, select the server that is being controlled.
4. Click Calculate.
The information is displayed.
In the Graph GUI there are 2 sections:
CPU Load.
IO/s (read & write).
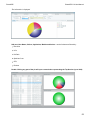
Query Distribution
The Query Distribution graph shows how the load is distributed over several entities.
To create the Query Distribution graph:
1. In the from and to fields, select the required time period.
50
PivotalVRP
PivotalVRP 6.0 User Manual
2. In the Host Name field, select the server that is being controlled.
3. From the Calculate According To drop-down list, select the required option as follows:
Total Reads Percent
Read Per Sec. Percent
Total Writes Percent
Writes Per Sec. Percent
Runtime Percent
CPU Per Sec. Percent
SQL Text
User Name
OS User
Application
Module
Action
Optimizer Cost
Hit Ratio
Client Info
Command Type
Note: The selections are based on the Rule Creation dialog box.
4. Select the number of slices to be presented in the pie-chart.
5. Set the SQL Sensitivity as follows:
Low: presents high-level information about the queries so that similar SQL statements are treated as
one query
High: drills down into the queries to present more detailed information so that similar SQL statements
are presented individually
Hashvalue: will select the queries according to their actual hash value.
6. Select the required Sort By option.
7. Click Calculate.
51
PivotalVRP
PivotalVRP 6.0 User Manual
The information is displayed.
SQL text, User Name, OsUser, Application, Module and Action – can be furthermore filtered by :
Execution
I/O's
Hit Ratio
Optimizer Cost
CPU
Runtime
Double Clicking any part of the pie will open a new window representing the Top Queries (up to 1000)
52
PivotalVRP
PivotalVRP 6.0 User Manual
Query Analysis
This graph allows you to create a custom-made graph based on any of the filters provided here. The graph is
divided into 3 tabs which allow a very specific drill down by allowing specific filtering parameters.
To create the Query Analysis graph:
Set any of the provided filters, and click Calculate.
The information is displayed.
53
PivotalVRP
PivotalVRP 6.0 User Manual
Double –clicking any of the queries will open up the following graph which shows the runtime
segmentation of the particular query
Runtime statistics
The Runtime Statistics window provides graphical resource consumption and performance information at the
touch of a button. You can define your query runtime thresholds and filter the specific information you seek.
The Transactions per second (TPS) vs. health graph shows the overall load effects on your systems health.
Correlating the information on the 3 graphs can quickly point out how resource usage and TPS affect
performance. Hovering on any point of the graphs will provide numerical values for the point selected.
54
PivotalVRP
PivotalVRP 6.0 User Manual
Right click and double click functions
Within the graphs section, PivotalVRP v6 has a variety of additional functions available. As previously shown
within the live session dashboard section, setting the cursor at different locations open various options. In
order to facilitate drill-downs outside of PivotalVRP, you can export results in various formats.
As can be seen above if you right-click any graph within PivotalVRP a window will open with the option to
export graph to image. Once selected, a new window will open with the link to the image (see below). If you
click the link, a new web page will open with the copied image. Should you want to retrieve it at a later time all
exported material from PivotalVRP are saved in a folder at the following path: "C:\Program
Files\MoreDB\GlassFish\glassfish\domains\MoreVRP\docroot\Exports".
55
PivotalVRP
PivotalVRP 6.0 User Manual
As can be seen above if you right-click any table within PivotalVRP a window will open with the option to
export to CSV. Once selected, a new window will open with the link to the CSV. If you click the link a new web
page will open with the data. The file is available in the same folder as the images within PivotalVRP in
Glassfish. It can be easily opened in excel or any other comparative program which imports CSV. The data
within the file is delimited by semicolons (";").
56
PivotalVRP
PivotalVRP 6.0 User Manual
Chapter 6 Working with Add-Ons
Topics:
Add-Ons button bar
Tuning Tasks
Chargeback
Rules Wizard
Variance
Inquire
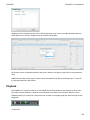
Playback
Performance BI
57
PivotalVRP
PivotalVRP 6.0 User Manual
Add-Ons button bar
The Add-ons are additional modules that add features to the PivotalVRP system, they are developed by the
PivotalVRP development and engineering team.
There are a few add-ons available for the PivotalVRP system. These Add-ons are important additions that
based on your usage of the PivotalVRP system and/or your environment contribute to your workflow. They
include: Tuning Tasks, Chargeback, Rules wizard, Variance, Inquire, Playback and Performance BI. This
section will provide brief description for each add-on.
Tuning Tasks
The tuning task add-on is a feature that allows you to create a workflow for transactions that need fine tuning
or that create problems within your database. It is the perfect tool for follow ups and pulls all the pertaining
information needed with the click of a button.
The tuning task is available both from the Dashboard window and several graphs (right-click on transaction)
and through the Tuning Tasks button which opens the Tuning tasks window.
58
PivotalVRP
PivotalVRP 6.0 User Manual
The tuning task window lets you track all tasks and their status. As an administrator you can change their
severity level and edit or remove them when necessary. At a glance you can see which developer is working
on the task and what the date of the last update is.
Chargeback
The Chargeback add-on was created as an essential tool for PivotalVRP users and providers that use or
provide database services or for organization wanting to be able to track their tenants resource usage. It
allows you to set pricing to resources and services provided on a per user basis. With a simple to use interface
all you need to do is define your tenants through a variety of parameters available. You start in the customer
setting window, once you have created the user, you can define its mapping through various available
parameters . The add-on also includes a built in invoice generation, summary billing per customer and more.
59
PivotalVRP
PivotalVRP 6.0 User Manual
There are two main views to the Chargeback add-on, the customer setting view contains all the info about your
customers and the billing view which has all the information pertaining to billing such as Ad hoc billing,
customer billing and invoices. The Billing View window is divided with three tabs, here you have the ability to
create ad-hoc bills, review your customer billing, and create invoices with a right click and review all invoices
created. The Ad Hoc Billing tab enables you to create on the fly customers and evaluate resource costs by
tenant on a single screen
60
PivotalVRP
PivotalVRP 6.0 User Manual
Rules Wizard
The Rules Wizard add-on is the helping hand you need when you want to optimize your workflow and set a
series of rules based on your current loads and the way you want to handle and prioritize them. It gives you
step by step instructions and recommendations as you go. It allows you as well to set priority levels to the rules
you want to implement based on their importance.
Once you define the business process and the relevant priority and times, you are asked to define how to
activate the rule (through Top SQL, Program or other parameters). Once you defined the trigger, right-click it
and set the effect of the manageable painful transaction (MPT)
The third step in the process opens up the list of rules created by the module. Double clicking any rule at this
point will open up the standard rules window with all settings as created by the module. You can modify them
and edit them from this location or from the standard Rules module, they are located in the Business Needs
rules module.
61
PivotalVRP
PivotalVRP 6.0 User Manual
Variance
The Variance Add-on is the DBA's ultimate tool. Given the vast amount of information available within the
PivotalVRP repository the variance Add-on is an amazing analytic tool. It can help you prepare your database
upgrades by comparing processes running in two different environments. In depth graphs show you where you
have performance improvements and where the performance deteriorated. By pinpointing these transactions,
you can quickly decide if your database is ready for the upgrade or if you still need to prepare it before you go
online with it. It's simple graphs and in-depth analytic ability allow you to quickly determine in a performance
degradation situation what has changed. The tab, "what's new" gives you immediate access to the changes
that happened within comparative time frames that have different performances. The Skew Analysis provides
performance information relating to skewing within your segments.
Statistics comparison will display the CPU & IO resource consumption differences.
62
PivotalVRP
PivotalVRP 6.0 User Manual
The Skew Analysis was developed specifically for Greenplum environment., now with just a few clicks you
have the ability to discover skewing. Through this screen you can also discover the distribution itself.
As with most PivotalVRP windows, double-clicking any result will open a new window with all the details and
specifics relating to the selected session.
The CPU Performance, Runtime Performance & I/O performance tabs compare CPU, runtime and I/O
consumption between two selected environments.
What's New displays sessions that were running in one environment and not the other. Having the ability to dig
into comparative performance data and information will often provide the insight into performance degradation
causes. When running multiple variance models on a single baseline can also help forecast future loads and
environment behavior.
63
PivotalVRP
PivotalVRP 6.0 User Manual
Inquire
The Inquire module is the DBA's Swiss Army knife.
It consists of 3 useful tools that help make a DBA's life easier.
The Inquire's module locks view window displays all current lock in your database.
In case you have blocking locks, you can view them by pressing the Get Blocking locks button.
Start by selecting the master segment from the DB name pulldown menu.
Right clicking the lock will allow you to export the information.
As an administrator and operator you have the option to release them through a right-click option.
(IMPORTANT! - Releasing the lock will KILL the locking session)
64
PivotalVRP
PivotalVRP 6.0 User Manual
The second tab is the DCR report window which enables you to create customized DCR reports.
The DCR (Detailed Custom Report) provides a wide variety of information regarding the state of the GP
environment.
Information such as free space per segment, size of databases, resource queues and more is available
through this report.
In order to generate the report select the master segment from the pull down menu and select the information
you wish to display,
pressing generate report will start the process.
When the report is ready the status log icon will flash red.
Once generated you can always revisit existing DCR reports by retrieving them from the existing reports list.
Having this type of report available can help you understand how your GPDB environment grows over time
and keeping this info for future comparison can help you with forecasts and trending including those relating to
structure and capacity.
The DCR reports are kept on the PivotalVRP server
65
PivotalVRP
PivotalVRP 6.0 User Manual
The last tab in the inquire module is the Resource Queue Management tab, which enables users to quickly
view, create and modify queues and roles within the GPDB/HAWQ environment.
66
PivotalVRP
PivotalVRP 6.0 User Manual
By default if you have not created queues you will have the pg_default queue to which all the defined roles are
assigned to.
The Resource Queue Management screen is divide into 2 sections; on the right-hand side you can find the
Resource queue list which displays the queue names, limits and state of the queues, the left hand side
displays the role & queue names.
At the bottom of the screen on the left hand side of the screen you have the ability to delete, view related roles,
modify or add a queue. Right-clicking (see above) a queue provides you part of theses options too.
By selecting to modify the Resource Queue a new pop up screen will open which provides an easy way to
redefine the resource queues. Parameters such as max cost, min cost, active statements memory limit and
priority can be easily altered.
clicking the Related Roles button while selecting a queue will open up the related role window (see below).
67
PivotalVRP
PivotalVRP 6.0 User Manual
Assigning a role to a resource queue can be done by selecting a role name on the right hand side table and
either right click it or click the "Assign" button at the bottom of the table.
All functions can be accessed though the buttons at the bottom of the page or right clicks on the queues and
roles.
Additional information for the Inquire module can be accessed from the GUI by clicking the blue "i" button at
the top right-hand side of the window.
Playback
The Playback is a virtual time machine. At PivotalVRP we know that situations don't happen out of the blue.
The chain of events leading to a situation will usually point to the reason to the situation. With the unique
Playback module you control time. Just set the time you want to investigate press play and live things as they
happened!
Control time!
68
PivotalVRP
PivotalVRP 6.0 User Manual
In case you want to get more info or start the investigation here, you have the ability to use right-click actions.
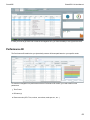
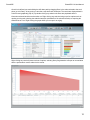
Performance BI
The Performance BI module lets you dynamically create a drill down path based on your specific needs.
To start the investigation into performance with the Performance BI module, you need to define a few
parameters:
Time Frame
DB name (s)
Resource order (CPU Time, runtime, executions, reads per sec., etc…)
69
PivotalVRP
PivotalVRP 6.0 User Manual
Once this is defined you start building the drill down path by dragging filters in the order selected to the work
plane (up to 6 filters). At any point you can take a step back and recalculate. The results are displayed both in
a list form and graphically (top 10). By double clicking any selection the filters are populated with the
information selected and the tree branches out. Right clicking any selection brings up a few options such as
opening a tuning task, showing the statistical analysis (with details of the selected session) or exporting the
selected list as a csv. Right clicking the graph allows you to export it as a jpeg.
Right clicking any result will present a host of options, selecting Query Segmentation will open an new window
with the performance metrics related to the results.
70
PivotalVRP
PivotalVRP 6.0 User Manual
Chapter 7 Managing the PivotalVRP Agent
Topics:
Installing the Agent
Starting the Agent
Stopping the Agent
71
PivotalVRP
PivotalVRP 6.0 User Manual
Installing the Agent
Unix/Linux Installation
1. This part of the installation process is usually done by a system administrator.
2. The agent has to be installed on every single node.
Copy the agent installer file supplied by PivotalVRP Support to a temporary directory on your PC.
Note: You should now see the Agent installation file called morevrpd
3. Using an FTP editor, copy the PivotalVRPd file to your remote database server (Unix/Linux) as user root
and place it under /bin/PivotalVRPd. If this directory does not exist, then you should create it.
Here is an example of how to do that :
ftp> open 192.168.10.111Connected to 192.168.10.111.220hpux FTP server (Revision 1.1
Version wuftpd-2.6.1(PHNE_34306) Mon Mar 1311:14:17GMT 2006) ready.User (192.168.
10.111:(none)): root331Password required forroot.Password:XXX230User root logged in.
ftp> cd /tmp250CWD command successful.ftp> lcd c:\tempLocal directory now C:\temp.ftp>
bin200Type set to I.ftp> put morevrpd200PORT command successful.150Opening BINARY mode
data connection formorevrpd.226Transfer complete.ftp: 122562bytes sent in 3.57Seconds
34.37Kbytes/sec.ftp> close
Once you copy the file to /tmp (as described in the example), you can move it to the destination
Directory by :
mkdir /bin/morevrpd > creating the directory
mv /tmp/morevrpd /bin/morevrpd/ > moving the agent file into it.
Note: Make sure you copy the files while you are in "bin" mode for binary files compatibility.
4. Make sure the file permissions are OK.
# ls -l /bin/morevrpd-rwxr-xr-x 1root root 112331Jan 1014:02morevrpd
5. If not, then change them with the following commands :
chown root:root morevrpdchmod 755morevrpd
Starting the Agent
1. To start the daemon manually:
# cd /bin/morevrpd# ./morevrpd start
72
PivotalVRP
PivotalVRP 6.0 User Manual
2. The following output is OK :
Starting morevrpd
When the daemon is started – you should see three processes of PivotalVRPd activated:
ps -ef | grep PivotalVRPdroot 228091116:03? 00:00:00./morevrpd startroot 228121016:03?
00:00:00./morevrpd startroot 228161016:03? 00:00:00./morevrpd start
If you want the daemon to start automatically in your OS – put into the automatic startup script of your
server. (Ask your sysadmin to do that.)
73
PivotalVRP
PivotalVRP 6.0 User Manual
Stopping the Agent
1. If you wish to shut the daemon down, type:
./morevrpd stop
74
PivotalVRP
PivotalVRP 6.0 User Manual
Chapter 8 Important Files within PivotalVRP
The table below lists important files that are located in the MoreDB directory on the PivotalVRP server.
File name
Description
RuntimeLog.log
More Log file
RuntimeDebugLog.log More Debug log file (if exists)
Rules.db
Rules file
Settings.db
Setting and configuration file
MoreDB.key
More License file
Privileges.rmf
Security configuration file (encrypted)
Servers.db
Servers configuration file (passwords encrypted)
InstallUtil.InstallLog
Installer log
DBDataTable.xml
Setting file
AuditLog.log
Log file of all IP & User names of all Rules and Modules state changes including kill operations.
75