1
http://www.phil.cmu.edu:8080/jcourse/cont...modules/cause_u_assoc/0000-printable.html
Causation to Association I: Unconditional Association
1000: Introduction
1100: Overview
Science endeavors to construct theories that explain and predict the observable world.
Toward this end, scientists formulate hypotheses, make predictions from these hypotheses,
test their predictions on observable evidence, modify their hypotheses according to the
result, etc. Theories and hypotheses come in many forms, as does observable evidence. In
our setting, the focus is on qualitative hypotheses of a limited sort: causal graphs. The
evidence we consider is also of a limited and qualitative sort: association and independence
among variables. Association doesn't have to be a qualitative concept; a substantial part of
statistics deals with kinds and degrees of association. For our purposes here, however, we
are only concerned with whether two variables are associated or not associated
(independent), thus we stay at a qualitative level. Our focus in this module is to connect
qualitative causal theories with qualitative associational evidence.
< A link to exercises in the interactive version of this module. >
This module focuses on how causal graphs explain and predict patterns of unconditional
association and independence among a set of variables. In the sections that follow, we will
break down the task into many sub-tasks. For example, we will cover direct cause, indirect
cause, common causes, and common effects. When you finish the module, you should be
able to take any causal graph, and write down the set of independence relations predicted to
hold in statistical samples involving the variables in the graph. For any two variables X and Y,
you should be able to ascertain whether a causal graph involving X and Y predicts that X and
Y are associated or independent. In the next module, we extend the ideas to conditional
independence.
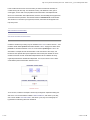
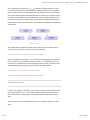
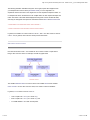
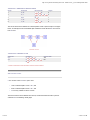
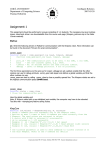
Consider, for example, a simple diagram that connects a causal theory about SMOKING,
YELLOW FINGERS, and LUNG CANCER to the associations that are predicted to exist if this
theory is correct. After this module, you should be able to write down the associations and
independencies among SMOKING, YELLOW FINGERS, and LUNG CANCER without
consulting the right-hand side of the figure, and after the next module you should be able to
write down the conditional associations and independencies.
1 of 20
5/18/01 2:33 PM
http://www.phil.cmu.edu:8080/jcourse/cont...modules/cause_u_assoc/0000-printable.html
FIGURE 1100-1
1200: The Causality Lab
The Causality Lab is programmed to make the right inference from a particular causal graph
to the independence relations that follow from that graph. You can construct a causal graph
in the Causality Lab, and then ask it to compute which pairs of variables are predicted to be
associated, which pairs independent, and which pairs are conditionally associated or
conditionally independent given values for another set of variables.
To learn how to get the Causality Lab to make predictions, read section 4400 of the
Causality Lab User Manual. Do that now.
< A link to exercises in the interactive version of this module. >
At any time in the module, you can return to this page, launch the Causality Lab, and explore
by constructing any causal graph you like among {HAPPINESS, EDUCATION, INCOME}, or
any subset of these variables, and ask for predictions.
JAVA: Link to the Causality Lab for experimenting
1300: Prediction vs Discovery
2 of 20
5/18/01 2:33 PM
http://www.phil.cmu.edu:8080/jcourse/cont...modules/cause_u_assoc/0000-printable.html
In this module and the next we move from theory to evidence. After these modules, we
consider moving the other way: from evidence to theory. The difference is this: given a
causal graph, we can make a unique prediction about association and independencies.
Given a set of association and independencies, however, there are many causal graphs that
would make the same prediction. Associational evidence underdetermines causal theories.
The situation is not as bad as you might think, however, and therein lies the appeal of the
topic. Stay tuned.
2000: Causation and Association
2100: Direct Causation and Association
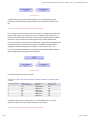
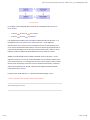
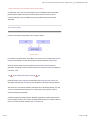
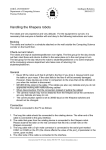
Consider a causal theory involving only two variables X and Y. If X is a direct cause of Y, then
the direct causal relation produces association between X and Y. Saying that a direct cause
produces an association between X and Y is not the same as predicting that X and Y are
associated in a sample, because the association could come about in other ways, and
because in some special cases (to be explained in section 2300) one variable can cause
another but because of other causal relationships between the two variables the theory
might still predict that the variables are independent. For now, let's focus on how a direct
causal relation produces association between X and Y.
FIGURE 2100-1
To be concrete, consider an example in which everyone begins an experiment feeling sick
with a fever. Let X be the treatment variable: TAKES ANTIBIOTIC, with values = [Yes, No],
and Y be the variable 1-DAY RECOVERY, with values = [Yes, No]. The causal graph we
hypothesize to hold among these two variables is:
3 of 20
5/18/01 2:33 PM
http://www.phil.cmu.edu:8080/jcourse/cont...modules/cause_u_assoc/0000-printable.html
FIGURE 2100-2
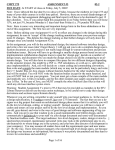
By claiming that a direct cause produces association, we are claiming that this graph
produces an association between taking antibiotics and recovering from an illness in one
day.
< A link to exercises in the interactive version of this module. >
How, in detail, does a direct cause produce an association? Lets examine the Antibiotic and
Recovery case in detail. Even though everyone in our experiment begins with a fever, not
everyone who takes antibiotics will recover in one day. Some people who take the antibiotic
will recover in a day and some won't. Some people who don't take the antiobiotic will
recover, and some won't. So the system is indeterministic. Suppose this causal system is like
the cell phone system you examined in the module on determinism and indeterminism.
Suppose the system involving just the two variables: TAKES ANTIBIOTIC and 1-DAY
RECOVERY is psuedo-indeterministic, but underlying it is a deterministic system involving a
hidden variable. Suppose this graph tells the whole story:
FIGURE 2100-3
Here is the response structure for this system:
TABLE 2100-1: RESPONSE STRUCTURE FOR ANTIBIOTIC, DISEASE, 1-DAY RECOVERY
SYSTEM
Causal Assignment
. Causal Factor:
TAKES ANTIBIOTIC
. Causal Factor:
DISEASE
. Effect: 1-DAY
RECOVERY
1
2
3
4
5
6
.
.
.
.
.
.
.
.
.
.
.
.
.
.
.
.
.
.
Yes
No
Yes
No
Yes
No
7-Day Bacteria
7-Day Virus
1-Day virus
7-Day Bacteria
7-Day Virus
1-Day Virus
Yes
No
Yes
No
No
Yes
An antibiotic has no effect on viral infections, so in causal assignments 2, 3, 5, and 6,
whether the antibiotic was taken makes no difference to the outcome.
< A link to exercises in the interactive version of this module. >
4 of 20
5/18/01 2:33 PM
http://www.phil.cmu.edu:8080/jcourse/cont...modules/cause_u_assoc/0000-printable.html
Below is a simulation of this causal system. To run a single trial in an experiment click the OK
button in the "single trial" row and complete the steps that follow. To run multiple trial click on
the OK button in the "multiple trials" row and complete the steps that follow. The results of
each trial will be displayed as histograms.
< A simulation in the interactive version of this module. >
Run at least 200 trials before you answer these questions.
< A link to exercises in the interactive version of this module. >
Suppose that we were dealing with a mutated bacteria that was resistant to our antibiotic,
and taking the antiobiotic had no effect:
FIGURE 2100-4
Below is a simulation of the mutated bacteria system. To run a single trial in an experiment
click the OK button in the "single trial" row and complete the steps that follow. To run multiple
trial click on the OK button in the "multiple trials" row and complete the steps that follow. The
results of each trial will be displayed as histograms. Run this simulation for at least 200 trials.
< A simulation in the interactive version of this module. >
< A link to exercises in the interactive version of this module. >
So a direct cause X
Y produces association between X and Y, and a direct cause Y
X
also produces association between Y and X. The picture below summarizes the situation for
direct causation.
5 of 20
5/18/01 2:33 PM
http://www.phil.cmu.edu:8080/jcourse/cont...modules/cause_u_assoc/0000-printable.html
FIGURE 2100-5
Non-independence, like independence, is symmetric, so X
Y implies Y
X.
2200: Indirect Causes and Association
2210: Simple Causal Paths
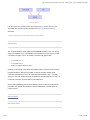
Consider 3-year-olds and chicken pox:
TABLE 2210-1: VARIABLES FOR CHICKEN POX AND 3-YEAR-OLDS
Variables
EXPOSED
INFECTED
SYMPTOMS
. Values
. [Yes, No]
. [Yes, No]
. [Yes, No]
where EXPOSED = Yes means that the 3-year-old has been in close proximity to another
person with chicken pox in the past week, INFECTED = Yes means that the child has the
virus in his or her bloodstream, and SYMPTOMS = Yes means that he or she has the typical
chicken pox rash.
The causal graph among these variables is clear:
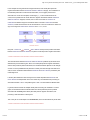
FIGURE 2210-1
EXPOSED is a direct cause of INFECTED, which is a direct cause of SYMPTOMS.
6 of 20
5/18/01 2:33 PM
http://www.phil.cmu.edu:8080/jcourse/cont...modules/cause_u_assoc/0000-printable.html
< A link to exercises in the interactive version of this module. >
From the previous section, we have the following:
FIGURE 2210-2
The question is: does the indirect causal relation also produce association?
FIGURE 2210-3
In this simple case, the answer is clearly yes. In most any sample of 3-year-olds, the
frequency of symptomatic 3-year-olds is clearly lower than the frequency of symptomatic
3-year-olds given exposure. In general the answer is yes as well, but there are rare cases in
which indirect causation does not produce association. We will discuss these cases later,
but for now, assume that: indirect causation produces association.
7 of 20
5/18/01 2:33 PM
http://www.phil.cmu.edu:8080/jcourse/cont...modules/cause_u_assoc/0000-printable.html
How, in detail, does a causal chain X
Y
Z produce an association between X and Z?
Let's examine the chicken pox case in same way we did the antibiotics case. Let's assume
that the chicken pox system is indeterministic. Not every child who comes in close proximity
with another infected child becomes infected with the virus, and not every child who has the
virus in his or her bloodstream becomes symptomatic. Like we did with the antibiotics and
the cell phone examples, lets suppose that the system is psuedo-indeterministic because of
hidden variables. For purposes of illustration, suppose this is the complete, fully deterministic
causal system:
FIGURE 2210-4
Only children who are exposed and unlucky become infected, and only children who are
infected and are not immune to chicken pox become symptomatic.
< A link to exercises in the interactive version of this module. >
Below is a simulation of this system. To run a single trial in an experiment click the OK button
in the "single trial" row and complete the steps that follow. To run multiple trial click on the
OK button in the "multiple trials" row and complete the steps that follow. The results of each
trial will be displayed as histograms. Run this simulation for at least 200 trials.
< A simulation in the interactive version of this module. >
< A link to exercises in the interactive version of this module. >
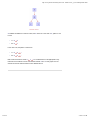
2220: Multiple Causal Paths
In general, one variable X is an indirect cause of another Y if there is a chain of direct causes
of any length leading from X to Y. We will refer to indirect causal chains as either causal
paths, causal chains, or directed paths, and we define these notions precisely in section
5000.
There can be more than one causal path leading from one variable to another in a causal
graph.
8 of 20
5/18/01 2:33 PM
http://www.phil.cmu.edu:8080/jcourse/cont...modules/cause_u_assoc/0000-printable.html
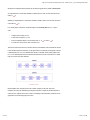
FIGURE 2220-1
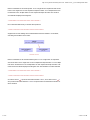
For example, in the causal graph above, there are two causal paths from EXERCISE to
BODY WEIGHT:
+
EXERCISE
METABOLISM
+
EXERCISE
APPETITE
BODY WEIGHT
BODY WEIGHT
If we suppose that increasing EXERCISE tends to increase METABOLISM (thus the "+" on
the edge from EXERCISE a loss of BODY WEIGHT (thus the "-" on the edge from
METABOLISM to BODY WEIGHT), then for a fixed level of APPETITE, the frequency of low
BODY WEIGHT will be less than the frequency of low BODY WEIGHT given high amounts of
EXERCISE. Because high levels of EXERCISE go with low levels of BODY WEIGHT, we say
that path 1 produces negative association between EXERCISE and BODY WEIGHT.
Similarly, if we assume that EXERCISE tends to decrease APPETITE (thus the "-" on the
edge from EXERCISE to APPETITE), and that decreased APPETITE tends to cause a loss of
BODY WEIGHT (thus the "+" on the edge from APPETITE to BODY WEIGHT), then for a fixed
METABOLISM, the frequency of low BODY WEIGHT is less than the frequency of low BODY
WEIGHT given high EXERCISE. So path 2 also produces negative association between
EXERCISE and BODY WEIGHT.
In general, each causal path from X to Y produces association between X and Y.
< A link to exercises in the interactive version of this module. >
2230: Offsetting Causal Paths
9 of 20
5/18/01 2:33 PM
http://www.phil.cmu.edu:8080/jcourse/cont...modules/cause_u_assoc/0000-printable.html
In the example involving exercise and weight loss above, both causal paths produced
negative association between EXERCISE and BODY WEIGHT. Roughly, the contributions of
the individual paths add to create the total association, so if the graph pictured were
assumed to be correct and complete, and the signs (+, -) of the causal influences are
correct, then it predicts that we would observe a negative association between EXERCISE
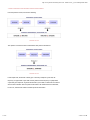
and BODY WEIGHT. Suppose, however, that our view of the effect on APPETITE of
EXERCISE was different. Suppose we believed that an increase in EXERCISE increased
APPETITE, instead of decreased it as we assumed above. Then we would have to switch the
sign on the edge from EXERCISE to APPETITE from "-" to "+", as so:
FIGURE 2230-1
Now path 1: EXERCISE
APPETITE
BODY WEIGHT would produce positive association
between EXERCISE and BODY WEIGHT, but path 2 would still produce negative association.
< A link to exercises in the interactive version of this module. >
The total association between EXERCISE and BODY WEIGHT predicted by this model is not
determined by the information given. Since one causal path produces negative association,
and the other produces positive association, the overall association depends on the strength
of each. It is even possible that both paths are of exactly the same strength and offset each
other, thus the overall association between EXERCISE and BODY WEIGHT predicted by this
model might be 0.
If the two paths offset each other exactly, then the model will predict that EXERCISE and
BODY WEIGHT are independent! This is one reason why we said before that producing an
association between X and Y and predicting that X and Y are associated are different ideas.
In general, whenever there are multiple causal paths connecting two variables in a causal
graph, we will assume that the total association from all the paths that produce positive
association do not exactly offset all the paths that produce negative association, thus
producing a total association of exactly zero.
This is one part of an assumption we call faithfulness, which we will make more precise later.
< A link to exercises in the interactive version of this module. >
10 of 20
5/18/01 2:33 PM
http://www.phil.cmu.edu:8080/jcourse/cont...modules/cause_u_assoc/0000-printable.html
2300: Common Causes
2310: The Idea
Consider the variables:
TABLE 2310-1: VARIABLES FOR BALDNESS
Variables
BALD SON
BALD BROTHER
BALDNESS GENE (from mother)
. Values
. [Yes, No]
. [Yes, No]
. [Yes, No]
The causal graph relating these variables is:
FIGURE 2310-1
From the last section, we know that the variables BALDNESS GENE and BALD SON are
associated because BALDNESS GENE is a cause of BALD SON, and that the variables
BALDNESS GENE and BALD BROTHER are associated for the same reason. Being a bald
son and having a bald brother are also associated, in virtue of being effects of a common
cause: having a mother with a baldness gene.
How does this work in detail? Consider a psuedo-indeterministic system of the sort we used
to show how direct and indirect causes produce association. A male child gets half of his 46
chromosomes from his father, and half from his mother. The two sets of chromosomes from
the parents merge to form 23 pairs -- where each pair has one chromosome from the father
and one from the mother. For a male child, one of these pairs is the "XY" pair. The X
chromosome in this pair comes from the mother, and the Y from the father. If the X
chromosome in the son's pair has the gene for baldness, then the son will be bald. The
mother begins with two X chromosomes (say X1 for bald and X2 for not-bald), and then by
random luck gives X1 or X2 to the son (The egg that is fertilized may have X1 or X2. Which
egg is fertilized is a matter of luck.).
11 of 20
5/18/01 2:33 PM
http://www.phil.cmu.edu:8080/jcourse/cont...modules/cause_u_assoc/0000-printable.html
FIGURE 2310-2
So if we consider it just random luck whether a mother carrying the baldness gene gives the
gene to her son, then the causal graph for baldness above fills out into a deterministic graph
as so:
FIGURE 2310-3
The response structures for BALD and BALD BROTHER are as follows:
TABLE 2310-2: RESPONSE STRUCTURE FOR BALDNESS GENE, LUCKY AND BALD SON
Causal Assignment
. Variable 1:
BALDNESS GENE
. Variable 2: LUCKY
. Effect: BALD SON
1
2
3
4
.
.
.
.
.
.
.
.
.
.
.
.
Yes
Yes
No
No
Yes
No
Yes
No
No
Yes
No
No
TABLE 2310-3: RESPONSE STRUCTURE FOR MOTHER, LUCK AND BALD BROTHER
12 of 20
Causal Assignment
. Variable 1:
BALDNESS GENE
. Variable 2: LUCKY
. Effect: BALD
BROTHER
1
2
3
4
.
.
.
.
.
.
.
.
.
.
.
.
Yes
Yes
No
No
Yes
No
Yes
No
No
Yes
No
No
5/18/01 2:33 PM
http://www.phil.cmu.edu:8080/jcourse/cont...modules/cause_u_assoc/0000-printable.html
The following simulation embodies this system. Once again, explore what happens when
you manipulate the common cause (BALDNESS GENE). To run a single trial in an
experiment click the OK button in the "single trial" row and complete the steps that follow. To
run multiple trial click on the OK button in the "multiple trials" row and complete the steps that
follow. The results of each trial will be displayed as histograms. Produce at least 200 trials,
and study the histograms that capture the association between BALD and BALD BROTHER.
< A simulation in the interactive version of this module. >
< A link to exercises in the interactive version of this module. >
In general, if a variable C is a direct cause of X and of Y, then C is a direct common cause of
X and Y. And, in general, direct common causes produce association.
2320: Indirect Common Causes
Like direct and indirect cause -- one variable can be a common causes of a pair without
being a direct common cause. For example, consider the graph below.
FIGURE 2320-1
The variable GRANDFATHER is a common cause of the variable BALD and the variable
BALD COUSIN. It is not a direct common cause, but a common cause nevertheless.
In general, C is a common cause of X and Y if:
13 of 20
+
there is a path from C to X (C is a cause of X),
+
there is a path from C to Y (C is a cause of Y), and
+
no variable besides C is on both of these paths.
5/18/01 2:33 PM
http://www.phil.cmu.edu:8080/jcourse/cont...modules/cause_u_assoc/0000-printable.html
Definition: ???
In general, common causes produce association between their effects.
2330: Multiple Common Causes
As there can be multiple causal paths between two variables, there can be multiple common
causes. For example, consider the common causes of your own level of athletic
achievement and your sibling's level of athletic achievement. below.
FIGURE 2330-1
There are at least two common causes of these variables, the genetic contribution that you
and your sibling share from your parents -- and the environment that you and your sibling
both grew up in. Both common causes produce association between the level of athletic
achievement among siblings.
Definition: ???
In general, each common cause produces association between its effects.
< A link to exercises in the interactive version of this module. >
2400: Causal Connection
2410: The Idea
We can summarize the preceding sections as follows:
14 of 20
+
Each causal path between X and Y produces association between X and Y, and
+
Each common cause of X and Y produces association between X and Y.
5/18/01 2:33 PM
http://www.phil.cmu.edu:8080/jcourse/cont...modules/cause_u_assoc/0000-printable.html
We unify these ideas with the idea of a causal connection. Two variables X and Y are
causally connected if:
+
X is a cause of Y, or
+
Y is a cause of X, or
+
there is a third variable Z that is a (direct or indirect) cause of X and of Y.
< A link to exercises in the interactive version of this module. >
2420: Multiple Causal Connections
As you would suspect, there can be many causal connections between a pair of variables.
As you might also guess, each causal connection between a pair of variables produces
association. In the graph below, for example, a child's exposure to lead and his or her IQ
score are causally conncted in two ways.
FIGURE 2420-1
Since LEAD EXPOSURE is a direct cause of IQ SCORE, it constitutes one causal connection,
and since PARENTAL CARE for the HOME ENVIRONMENT is a common cause of LEAD
EXPOSURE and IQ SCORE, it constitutes another. Except for a technical qualification that will
be explained later in section 5200, each pathway from one variable to another, and each pair
of pathways from a common cause to the two variables, counts as a different causal
connection.
15 of 20
5/18/01 2:33 PM
http://www.phil.cmu.edu:8080/jcourse/cont...modules/cause_u_assoc/0000-printable.html
< A link to exercises in the interactive version of this module. >
To summarize, each causal connection between a pair of variables produces association
between those variables. We assume that when there is at least one form of causal
connection between a pair of variables, then they are predicted to have some overall
association.
2500: Common Effects
Common causes produce association, but do common effects?
FIGURE 2500-1
For example, in the graph above, the variables AGE and SEX have a common effect: HEART
DISEASE. Does having a common effect produce association between AGE and SEX?
We know that the causal connection between AGE and HEART DISEASE produces
association, as does the causal connection between SEX and HEART DISEASE (males get it
more often). Thus:
AGE
HEART DISEASE, and HEART DISEASE
SEX
Because AGE and HEART DISEASE are associated, and HEART DISEASE and SEX are
associated, does that mean AGE and SEX are associated? Is association always transitive?
The answer is no to all of these questions. Association is not necessarily transitive, AGE and
SEX are not associated because they have a common effect, and in general, common
effects do not produce association.
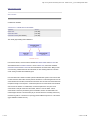
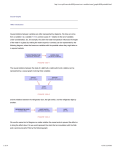
Consider the following example using the Setbuilder. Suppose we create a fantasy world in
which being blond causes you to smoke, and being female causes you to smoke as well, but
there is no causal connection between HAIR COLOR and SEX.
16 of 20
5/18/01 2:33 PM
http://www.phil.cmu.edu:8080/jcourse/cont...modules/cause_u_assoc/0000-printable.html
FIGURE 2500-2
If we are correct, then according to this causal graph HAIR COLOR and SMOKING are
associated, SEX and SMOKING are associated, but HAIR COLOR and SEX are not
associated.
< A link to exercises in the interactive version of this module. >
3000: Summary
The connection between causal graphs and unconditional association turns out to be very
simple. Two variables X and Y are predicted to be associated just in case they are causally
connected in the graph. X and Y are causally connected in the graph if either
+
X is a cause of Y, or
+
Y is a cause of X, or
+
there is a common cause of X and Y.
Variables can be causally connected in several different ways, and each causal connection
produces association. Although it is possible, we assume that when multiple causal
connections exist between X and Y, the overall association between X and Y is not zero.
That is, if X and Y are causally connected, we predict they are associated, and if X and Y are
not causally connected, we predict that they are independent.
Section 4000 (Formalities) gives the formal definitions of the concepts we've discussed in
this module. It is optional, and provides the technical explanations of directed paths and
common causes.
4000: Formalities
4100: Causal Chains
17 of 20
5/18/01 2:33 PM
http://www.phil.cmu.edu:8080/jcourse/cont...modules/cause_u_assoc/0000-printable.html
We define a causal path more precisely via an idea from graph theory called a directed path.
An edge between A and another variable B is out of A just in case A is the cause and B the
effect (A
B).
Similarly, an edge between A and another variable B is into B just in case A is the cause and
B the effect (A
B).
In a causal graph, a sequence of directed edges U is a directed path from X to Y just in
case:
+
U begins with an edge out of X,
+
U ends with an edge into Y, and
+
every two adjacent edges on U are head to tail, i.e., ZI
+
no vertex is a cause of more than one effect on U.
ZJ and ZJ
ZK
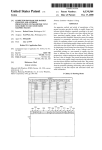
The first two clauses are obvious. The third clause in the definition ensures that all the arrows
in the sequence point the same way. In the figure below, for example, the top graph contains
a directed path from X to Y that satisfies this clause, but the path in the bottom graph from X
to Y is not a directed path because it violates this clause: the arrows connected to Z2 collide,
they don't point in the same direction.
FIGURE 4100-1
Directed paths have a length equal to the number of edges on the path, they have
endpoints, and they are described by writing the sequence of edges on the directed path in
order from one endpoint to the other. Here is a sampling of directed paths contained in both
graphs above, with the length given for each:
18 of 20
5/18/01 2:33 PM
http://www.phil.cmu.edu:8080/jcourse/cont...modules/cause_u_assoc/0000-printable.html
TABLE 4100-1: SAMPLING OF DIRECTED PATHS
Graph
1
1
. Endpoints
. X, Z2
. X, Y
1
2
2
. Z3, Y
. Y, Z3
. Y, Z2
. Directed Path
. X Z1 Z2
. X Z1 Z2
Y
. Z3 Y
. Y Z3
. Y Z3 Z2
. Length
Z3
.2
.4
.1
.1
.2
The second clause in the definition of a directed path is meant to prevent loops. In the figure
below, for example, the second candidate path violates this clause because Z2 is a cause of
both Z3 and Y.
FIGURE 4100-2
TABLE 4100-2: CANDIDATE PATHS
Endpoints
X, Y
X, Y
. Candidate
. X Z1 Z2
. X Z1 Z2
Z2
Y
. Directed Path
Y
Z3
Z1
. Yes
. No
< A link to exercises in the interactive version of this module. >
4200: Common Causes
C is a common cause of X and Y just in case:
+
there is a directed path P1 from C to X, and
+
there is a directed path P2 from C to Y, and
+
C is the only variable on both P1 and P2.
The first two clauses of this definition are obvious, and the third clause is meant to prevent
cases like Z1 in the following causal graph:
19 of 20
5/18/01 2:33 PM
http://www.phil.cmu.edu:8080/jcourse/cont...modules/cause_u_assoc/0000-printable.html
FIGURE 4200-1
Z3 satisfies the definition of common cause, but Z1 does not. In the case of Z3, paths P1 and
P2 are:
+
P1: Z3
X
+
P2: Z3
Y
In the case of Z1, the paths P1 and P2 are:
+
P1: Z1
Z3
X
+
P2: Z1
Z3
Y
Both causal connections contain X
Z3
Y. It would therefore not be appropriate to say
that there are two distinct sources of association between X and Y in this graph. Thus we
exclude the second case with clause 3 in the definition above.
20 of 20
5/18/01 2:33 PM