1
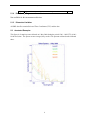
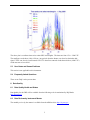
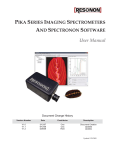
DOE/SC-ARM/TR-062
Shortwave Spectroradiometer (SWS)
Handbook
May 2007
Peter Pilewskie
John Pommier
Work supported by the U.S. Department of Energy,
Office of Science, Office of Biological and Environmental Research
May 2007, DOE/SC-ARM/TR-062
Contents
1
2
3
4
5
6
7
General Overview ............................................................................................................................... 1
Contacts............................................................................................................................................... 2
Deployment Locations and History..................................................................................................... 2
Near-Real-Time Data Plots ................................................................................................................. 2
Data Description and Examples .......................................................................................................... 3
Data Quality ........................................................................................................................................ 5
Instrument Details ............................................................................................................................... 6
Figures
1
2
SWS and Monitor in the Darkroom .................................................................................................... 1
Schematic for the Connection of the SWS.......................................................................................... 7
iii
May 2007, DOE/SC-ARM/TR-062
1. General Overview
The Shortwave Spectroradiometer (SWS), measures the absolute visible and near infrared spectral
radiance (units of watts per meter square per nanometer per steradian) of the zenith directly above the
instrument. The SWS is a moderate resolution sensor comprised of two Zeiss spectrometers (MMS 1
NIR enhanced and NIR-PGS 2.2) for visible and near-infrared detection in the wavelength range 350 –
2170 nm. The sampling frequency is 1 Hz. The spectral resolution is 8 nm for the MMS 1 NIR and
12 nm for the NIR-PGS 2.2. The light collector is a narrow field of view (1.4°) collimator at the front end
of a high-grade custom-made fiber optic bundle. The SWS does daily daytime measurements. The SWS
is located in a darkroom, constructed by Southern Great Plains (SGP) site personnel within the optical
trailer, to permit calibrations to be conducted without the necessity of moving the instrument to a different
location. Calibrations are performed at regularly scheduled times using the ARM 12” integrating sphere.
The SWS measurements can be used to:
a. Retrieve cloud optical depth, particle size and cloud water path.
b. Test the cloud optical depth retrieval for overcast and broken cloud fields.
c. Validation/comparison with SGP surface remote sensors and future cloud intensive operational period
campaigns.
d. Multivariate analysis to derive information content in hyper spectral data sets and to improve cloud
retrieval algorithm development.
e. Compare with radiative transfer models for testing and validating retrieval procedures.
Figure 1. SWS and monitor in the darkroom. Insert shows the light collector located at the top of the
chimney.
Sites/Facilities
Southern Great Plains (http://www.arm.gov/sites/sgp.stm)
Central Facility (http://www.arm.gov/sites/sgp/central.stm)
1
May 2007, DOE/SC-ARM/TR-062
2. Contacts
2.1
Mentor
Scott Kittelman
University of Colorado
Department of Atmospheric and Oceanic Sciences
Folsom Stadium, Gate 7, Room 255
UCB 311
Boulder, CO 80309-0311
(303) 492-4248
E-mail: [email protected]
Patrick McBride
Department of Atmospheric and Oceanic Sciences
Duane Physics, Rm D-335
UCB 311
University of Colorado
Boulder, CO 80309-0311
(303) 492-8653
E-mail: [email protected]
2.2
Instrument Developer
Warren Gore
NASA Ames Research Center
MS 245-4
Moffett Field, CA 94035
(650) 604-5533
3. Deployment Locations and History
Serial
Number
Property
Number
?
?
Location
Date
Installed
Date
Removed
Status
SGP/CF
April 2006
N/A
Operational
Data collected is available from the Atmospheric Radiation Measurement (ARM) Program’s archive
(http://www.archive.arm.gov).
4. Near-Real-Time Data Plots
Will be available at the ARM web site: Data plots and other data products
(http://www.arm.gov/data/data_plots.stm)
2
May 2007, DOE/SC-ARM/TR-062
5. Data Description and Examples
5.1
Data File Contents
The SWS data files are stored in both raw and calibrated files at the ARM archive. File names follow the
ARM naming convention for the raw data files as follows:
sgpswscf.00.yyyymmdd.hhmmss.dat. Where yyyy ≡ year (i.e. 2006), mm ≡ month, dd ≡ day, hh ≡ hour,
mm ≡ minutes and ss ≡ seconds. The raw data files will be calibrated (units of Wm¯²nm¯¹sr¯¹) and
converted into netcdf format by ARM at the time of ingest.
5.1.1
Primary Variables and Expected Uncertainty
Absolute spectral radiance of the zenith above the instrument in units of Wm¯²nm¯¹sr¯¹.
5.1.1.1
Definition of Uncertainty
Prior to deployment at the SGP, the SWS was calibrated for absolute spectral power at the Airborne
Science and Technology Laboratory at NASA Ames Research Center using the 30” integrating sphere,
which has been calibrated according to NIST standards, and a LabSphere 12” integrating sphere. The 12”
sphere is used at the SGP site to calibrate the SWS.
The absolute accuracy of the spectral radiance for the SWS relies upon the accuracy of the transfer
standard from the 30” sphere to the 12” sphere. The 30” sphere has an error over the spectral range,
300 – 2200 nm, of between 1 – 2%.
5.1.2
Secondary/Underlying Variables
This section is not applicable to this instrument.
5.1.3
Diagnostic Variables
These are variables that monitor the health of the SWS. The first three are concerned with the
temperature of the two spectrometers and the box in which they are encased, while the latter variables
monitor voltages and indicate if a critical component is failing.
Channel
0
1
2
3
4
5
6
Quantity Measured
Si spectrometer. Normal temperature is 27°C
InGaAs spectrometer temperature. Normal temperature is -10°C.
Inside box temperature. This temperature reflects the ambient
temperature which should be around 22°C.
PC/104 + 5VDC (nominal value = +5V)
PC/104 + 12VDC (input voltage*3, nominal voltage = +4V)
PC/104 – 12VDC (input voltage*3, nominal voltage = -4V)
PS2 +5VDC (nominal voltage = +5V)
3
Unit
C
C
C
V
V
V
V
May 2007, DOE/SC-ARM/TR-062
7
5.1.4
PS2 +12VDC (input voltage*3, nominal voltage = +4V)
V
Data Quality Flags
Not available for this instrument at this time.
5.1.5
Dimension Variables
All SWS data files contain Universal Time Coordinates (UTC) and the date.
5.2
Annotated Examples
This figure is of sample spectra collected on 1 May 2006 during the period 1500 – 1900 UTC (10:00 –
14:00 local) time. The spectra are not averaged; they are the 1 Hz spectrum collected at the indicated
times.
4
May 2007, DOE/SC-ARM/TR-062
The above plot is a radiance time series at nine SWS wavelengths. The times are from 1330 – 2200 UTC.
The small gaps on the hour (1400, 1500 etc.) are periods when the shutter was closed to obtain the dark
signal. There was clear sky until around 1530 UTC when first scattered clouds then a thicker (1900 UTC)
cloud mass moved over head.
5.3
User Notes and Known Problems
This section is not applicable to this instrument.
5.4
Frequently Asked Questions
There are no FAQ’s at the present time.
6. Data Quality
6.1
Data Quality Health and Status
Data Quality for the SWS will be available from the following web site maintained by DQ Hands:
http://dq.arm.gov/
6.2
Data Reviews by Instrument Mentor
The monthly review by the mentor is available from the ARM web site http://dq.arm.gov/
5
May 2007, DOE/SC-ARM/TR-062
6.3
Data Assessments by Site Scientist/Data Quality Office
Not applicable to this instrument.
6.4
Value-Added Procedures and Quality Measurement Experiments
To be determined.
7. Instrument Details
7.1
Detailed Description
7.1.1
List of Components
•
Narrow field-of-view (1.4°) collimator at the front end of a high grade, ultra-low OH fiber optic
cable.
•
Spectrometer:
Zeiss MMS 1 NIR enhanced (300-1100 nm), flat-field, 366 1/mm grating, Hamamatsu Si 256element linear diode array. Operating temperature regulated to 27°C by heater.
Zeiss NIR-PGS 2.2 (900-2200 nm), 300 1/mm flat grating, Hamamatsu InGaAs 256-element linear
diode array. Operating temperature regulated to -10°C by thermoelectric cooler.
•
Automated shutter for dark current measurement.
•
A 933 MHz Pentium III based computer (PC104 format) for automated data acquisition and control.
•
A USB interface between the computer and the spectrometers.
•
Operating system is Linux Fedora.
•
Internal data storage on 1 GB compact flash card; remote data collection via Ethernet interface.
7.1.2
System Configuration and Measurement Methods
The SWS is located in a dark room, specially constructed by SGP site personnel, in the south east corner
of the Optical Trailer at the SGP Central Facility. Placing the SWS in the dark room obviates the need to
move the SWS to perform calibrations. The light collector is attached to a high quality fiber optic which
is passed through the port at the top of the optical trailer to the SWS.
6
May 2007, DOE/SC-ARM/TR-062
Figure 2. Schematic for the Connection of the SWS
7.1.3
Specifications
Wavelengths Measured: 256 channels in the Si (300 – 1100 nm), 256 channels for the InGaAs (900 –
2200 nm).
Instrument Field of View: The field of view of the instrument is 1.4°.
Sampling Interval: Measurements are made at the rate of one per second during the day. The SWS does
not collect data between the hours of 0200 – 1100 UTC.
Integration Time: The integration times vary during the course of the year but range from 75 – 100 ms
for the Si detector and range approximately 150 – 250 ms for the InGaAs detector.
7.2
Theory of Operation
Photons incident on the collimator at the fore-optics of the light collector travel through the multi-optical
fiber to the SWS where the fiber is then bifurcated with the light passing through entrance slits to either
the Si grating or the InGaAs grating. There the wavelength components are separated then imaged onto
their respective diode array. The array is then read by an electronic interface which passes the data to the
computer via a USB connection. Dark signals are obtained each hour, at the same integration time that
was used to measure the intensity, by closing the shutter located at the base of the light collector.
7
May 2007, DOE/SC-ARM/TR-062
7.3
7.3.1
Calibration
Theory
The SWS is calibrated annually at the NASA Ames Airborne Science and Application Laboratory using
a 30” integrating sphere. The 30” sphere has been calibrated according to NIST standards. The
calibration from the 30” sphere is transferred annually to the ARM Souther Great Plains on-site 12”
integrating sphere. The ARM 12” sphere is used weekly at the SGP site to monitor for any changes or
degradation in the SWS response. If necessary, the calibration obtained with the ARM 12” integrating
sphere is applied to adjust the primamry SWS response function obtained annually at NASA Ames..
7.3.2
Procedures
SGP site personnel built a darkroom to both house the SWS instrument and the ARM 12” integrating
sphere used for weekly on-site calibrations . This allows the SWS to be calibrated without having to move
the instrument to another part of the site. To perform a calibration, the light collector is lowered through
the port in the ceiling and placed in a holder opposite the 12” integrating sphere. The holder is aligned
with the central axis of the exit port on the 12” sphere to insure the light collector is situated in the
identical location each time it is calibrated. A dark signal is taken before each calibration. Following the
calibration the light collector is then returned through the port to the top of the Optical Trailer.
7.3.3
History
No history is available at this time.
7.4
7.4.1
Operation and Maintenance
User Manual
A user manual has been prepared and provided to the SGP site personnel. An electronic version is
available upon request from the mentor in either PDF or Postscript format.
7.4.2
Routine and Corrective Maintenance Documentation
Instrument preventative maintenance reports are can be accessed at the SGP:
http://www.ops.sgp.arm.gov/
7.4.3
Software Documentation
Software documentation is found in the User Manual (see 7.4.1 above).
7.4.4
Additional Documentation
None available for this instrument.
8
May 2007, DOE/SC-ARM/TR-062
7.5
Glossary
See the ARM Glossary (http://www.arm.gov/about/glossary.stm)
7.6 Acronyms
See the ARM Acronyms and Abbreviations. (http://www.arm.gov/about/acronyms.stm)
9