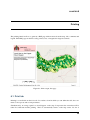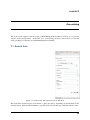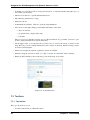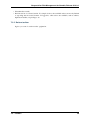
1
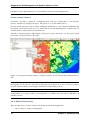
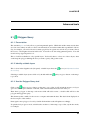
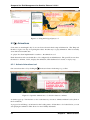
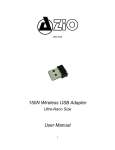
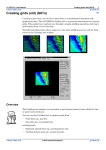
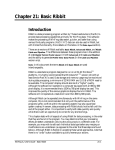
Geoportal for Risk Management for
Gambia
Release 2.10.3-1
Jean Pommier
December 01, 2014
Contents
1
Preface
3
2
A new concept
5
3
Geoportal’s layout
3.1 Header panel . . . . . . . . . . . . . . . . . . . . . . . . . . . . . . . . . . . . . . . .
3.2 Central panel: Interactive map . . . . . . . . . . . . . . . . . . . . . . . . . . . . . . .
3.3 Left panel: the control center . . . . . . . . . . . . . . . . . . . . . . . . . . . . . . .
7
7
8
9
4
Building a map
4.1 Select overlays . . . . . . .
4.2 Organize overlays . . . . .
4.3 Change the background map
4.4 Manage an overlay . . . . .
4.5 Add other layers . . . . . .
5
Using the map
.
.
.
.
.
.
.
.
.
.
.
.
.
.
.
.
.
.
.
.
.
.
.
.
.
.
.
.
.
.
.
.
.
.
.
.
.
.
.
.
.
.
.
.
.
.
.
.
.
.
.
.
.
.
.
.
.
.
.
.
.
.
.
.
.
.
.
.
.
.
.
.
.
.
.
.
.
.
.
.
.
.
.
.
.
.
.
.
.
.
.
.
.
.
.
.
.
.
.
.
.
.
.
.
.
.
.
.
.
.
.
.
.
.
.
.
.
.
.
.
.
.
.
.
.
.
.
.
.
.
.
.
.
.
.
.
.
.
.
.
.
.
.
.
.
.
.
.
.
.
.
.
.
.
.
.
.
.
.
.
11
11
11
11
13
17
19
5.1
Zoom in, zoom out, pan the map . . . . . . . . . . . . . . . . . . . 19
5.2
Query layers . . . . . . . . . . . . . . . . . . . . . . . . . . . . . . . . . . . . . 20
5.3
Measuring . . . . . . . . . . . . . . . . . . . . . . . . . . . . . . . . . . . . . . . 20
5.4
History . . . . . . . . . . . . . . . . . . . . . . . . . . . . . . . . . . . . . . 21
5.5
Save/restore the map . . . . . . . . . . . . . . . . . . . . . . . . . . . . . . . 21
6
Printing
23
6.1 Print tab . . . . . . . . . . . . . . . . . . . . . . . . . . . . . . . . . . . . . . . . . . 23
7
Geo-catalog
25
7.1 Search form . . . . . . . . . . . . . . . . . . . . . . . . . . . . . . . . . . . . . . . . 25
7.2 Results . . . . . . . . . . . . . . . . . . . . . . . . . . . . . . . . . . . . . . . . . . . 27
7.3 Toolbars . . . . . . . . . . . . . . . . . . . . . . . . . . . . . . . . . . . . . . . . . . 28
8
Advanced tools
8.1
8.2
31
Polygon Query . . . . . . . . . . . . . . . . . . . . . . . . . . . . . . . . . . . . 31
Animations . . . . . . . . . . . . . . . . . . . . . . . . . . . . . . . . . . . . . . . 32
i
8.3
Index
ii
Temporal profiles . . . . . . . . . . . . . . . . . . . . . . . . . . . . . . . . . . . 34
37
Geoportal for Risk Management for Gambia, Release 2.10.3-1
User Manual
This is the public user documentation for the Geoportal for Risk Management in Gambia.
Last update: December 01, 2014
Author : Jean Pommier, pi-Geosolutions
[email protected]
http://www.pi-geosolutions.fr
Contents
1
Geoportal for Risk Management for Gambia, Release 2.10.3-1
2
Contents
CHAPTER 1
Preface
The interactive web site for Risk Management, described in this documentation, is born from cuttingedge, open-source, cartographic tools. It was built using several open-source components known for
their seriousness : GeoNetwork (on-line cataloging software), GeoServer (web map server), OpenLayers (web mapping library) bound with ExtJS/GeoExt (Javascript high-level framework), and PostgreSQL/PostGIS as database.
The result is more a software than a web site. Let’s say an on-line software. This kind of software is
usually called a Geoportal. In the following chapters, we will call it the Geoportal for Risk Management
in Gambia, or simply Geoportal.
It has been developed on World Bank’s initiative.
3
Geoportal for Risk Management for Gambia, Release 2.10.3-1
4
Chapter 1. Preface
CHAPTER 2
A new concept
Geoportals are a recent concept, and still not completely grown up. They answer to a need for secure
and organized storage for geospatial data, and usually offer some tools to manipulate the stored data:
search, view, etc.
Historically, geoportals are two-part tools:
• A mapping component, in which the user can display geospatial data in an online dynamic interface. This is common-case that people don’t go further. The second part is more for advanced
users :
• A cataloging component, usually separated from the first one. Its role is to give storage and search
facilities for documents, including geospatial ones. It occurs to be the most important part.
This is in fact a kind of library cataloging software. The informations sheets it uses are called
metadata.
The Geoportal for Risk Management in Gambia features a new concept, combining those tools in a
unique portal. It brings several advantages, such as :
• Better and easier interaction between catalog and dynamic map :
– Geospatial data stored in the catalog can be added to the map by a simple click.
– The search results are directly displayed over the map.
– The map geospatial overlays are constantly connected with their metadata, and you can
consult them at any moment.
• Common tools are developed once only.
• Mutualized computer coding, resulting in lighter solution and easier updates.
• A unique interface, simpler access.
This makes the Geoportal a true Information System, rich and complete.
5
Geoportal for Risk Management for Gambia, Release 2.10.3-1
6
Chapter 2. A new concept
CHAPTER 3
Geoportal’s layout
In order to leave the largest area possible to the map area, the other elements have been grouped whenever possible. The layout is then cut in only three parts, one of them almost negligible:
• The header
• A central panel with the map
• A left panel giving access to lots of functionnalities
Figure 3.1: Global layout
3.1 Header panel
The header panel is the simplest part. It contains:
• The site’s name
7
Geoportal for Risk Management for Gambia, Release 2.10.3-1
Figure 3.2: Header panel
• The login form, for registered users and administrators
• The language switcher: the site is available in English and French
• The help link: gives access to some helpful links, including this documentation.
3.2 Central panel: Interactive map
Figure 3.3: Central panel: the map
The central panel contains the map and most of its tools: toolbar on the top, scale and coordinates widget
on the bottom-right corner.
The map itself is interactive, meaning you can move the center of the map, zoom in or out, add some
overlays, etc.
In default mode, you are in ‘pan’ mode: if you keep pressed the left button of your mouse and move the
mouse, you will move the map. The pan mode is activated with the hand button in the map’s toolbar.
You can zoom in or out, either by using the mouse’s wheel, or by selecting one of the zoom buttons, just
left of the hand button in the toolbar. Using the zoom in button (the one with the ‘+’), you can draw a
rectangle defining the area on which you want to zoom.
Returning to the initial point of view is done using the Full extent button (the first button on the left).
Returning to the previous zoom (and back to the next) can be done using the history buttons, the blue
arrow buttons.
You can even perform more advanced actions, which will be detailed on Advanced tools.
Note: A tooltip is available for each button on the map’s toolbar: it will show if you leave the mouse
over the button for a while.
8
Chapter 3. Geoportal’s layout
Geoportal for Risk Management for Gambia, Release 2.10.3-1
3.3 Left panel: the control center
Figure 3.4: Left panel
The left panel is composed of several tabs:
• Select tab is a hierarchical list of cartographic overlays (layers). Checking a layer will add it to the
map. After checking the layers to display, it will be necessary to order them properly, add some
transparency, etc. This happens in the next tab:
• Organize tab is merely empty at the beginning. It gets filled as one checks some layers, in the
Select tab. The checked layers are added in the ‘Overlays’ folder. It is the place to reorganize
them, manage them, consult them.
• Locate tab regroups some positionning tools: zoom by administrative areas, searching for a place
in an external placenames database.
• Print tab is the printing configuration panel.
• Geo-catalogue tab is the form to search for data, in the metadata database. This is the ‘library’
database search area.
3.3. Left panel: the control center
9
Geoportal for Risk Management for Gambia, Release 2.10.3-1
10
Chapter 3. Geoportal’s layout
CHAPTER 4
Building a map
Most of the geoportal is about mapping: select overlays, organize overlays, compose them in order to
print some maps. Here is a typical workflow using the map:
4.1 Select overlays
This happens in the left panel, first tab. Every checked layer is added to the map.
It is hierarchically organized, in a tree-like structure: unfold a folder to see what’s inside. It can contain
several kinds of nodes:
• other folders. Folders are represented with a
when closed and a
when open.
• WMS layers. They are the most common map layers. They are represented with a
checkbox.
icon and a
• Chart layers. They are less common. They will show as pie or bar charts, at some locations on the
map. They are represented with a
icon and a checkbox.
Some nodes have a description: it will pop-up when leaving the mouse over for a second.
4.2 Organize overlays
This is the function of the second tab, the Organize tab.
The layers checked in the Select tab are initially stacked as they come, in the tree-like structure.
Sometimes, it will be good, but most often this will not be the right order, it will be necessary to reorganize them. This is the main purpose of this panel. Reorganizing the layers is simple: just click on the
layer to move, keep the mouse pressed and move the layer to its new place. The place where it will be
inserted is shown by a dotted line. When in the right place, release the mouse’s button.
4.3 Change the background map
The default background map is a Bing Aerial map. It is possible to change it for OpenStreetMap background. The background choice is in the Base Layers folder, in the Organize tab
11
Geoportal for Risk Management for Gambia, Release 2.10.3-1
Figure 4.1: Layers stacked as they come: administrative boundaries are hidden underneath the Population (opaque) layer.
Figure 4.2: Reorganizing the layers
12
Chapter 4. Building a map
Geoportal for Risk Management for Gambia, Release 2.10.3-1
Figure 4.3: OpenStreetMap background on Banjul
Note: OpenStreetMap images are easier to compress, and will result in less bandwith requirements than
Bing Aerial. so if you have no need for Bing Aerial background, you may prefer using OpenStreetMap
Note: Bing maps are not supported for printing (licence issue). The right background for printing is
then OpenStreetMap
4.4 Manage an overlay
4.4.1 View the legend
For most of the overlays, there is a small downward arrow, just left of the checkbox. Clicking this arrow
will unfold the legend underneath the overlays’ row. Clicking it again will fold the legend.
Figure 4.4: Unfolding the legend
For some layers (scanned maps), the legend is very large and will not be readable in the panel (not large
4.4. Manage an overlay
13
Geoportal for Risk Management for Gambia, Release 2.10.3-1
enough). It is then possible to open it in a pop-up window: right-click on the overlay, and select ‘Open
legend in popup‘.
Figure 4.5: Soil association layer comes from a scanned map. Its legend is too large for an easy display.
The best way then is to open it in a separate pop-up window.
4.4.2 Information about the overlay
Some icons on the right of the layer’s name tell the user which information tools are available for this
layer:
•
says the layer is queryable, meaning you can use the Query tool on this layer.
•
says the layer is enabled for the Polygon Query tool.
•
says some metadata are available for this layer.
They are just informative icons, telling the user which actions he will be able to perform. Then, each of
these actions will be trigged in their own way (see further).
Figure 4.6: Here, all the layers are queryable, Population density and Elevation are enabled for Polygon
Query and have a metadata sheet available. Road Network too, has a metadata sheet.
14
Chapter 4. Building a map
Geoportal for Risk Management for Gambia, Release 2.10.3-1
View Metadata
indicator. When selected (left-click on it), the
A layer having metadata will be represented with the
button on the panel’s top toolbar will be activated. On the layer’s context menu (right-click on the
layer), the Metadata entry will be activated too.
Clicking on one of those will open the metadata sheet, if you have access rights to this metadata. Otherwise, a message will tell you don’t have the access rights (meaning the access is restricted to some
registered users: you have to log in).
Figure 4.7: Opening the metadata sheet (on the right)
See also the Geo-catalog section about metadata.
4.4.3 Use transparency / curtain (‘swipe‘) controls
Transparency
It is possible to make a layer partially transparent. This allows to overlay several layers, for example
overlay hillshade data over a topographic map, to add some elevation effect on the map.
Figure 4.8: Overlapping slopes information over a topographic map enhances the map with some 3D
effect...
A right-click on a layer opens a contextual menu, with some actions available for this layer. One of these
actions is called ‘opacity‘, and opens a slider. By moving this slider, on can change the layer’s opacity
from 1 (completely opaque) to 0 (invisible).
Note:
Setting the opacity to 0 (invisible) will automatically uncheck the layer. It is important to
4.4. Manage an overlay
15
Geoportal for Risk Management for Gambia, Release 2.10.3-1
remember it, since unchecked layers are automatically ‘cleaned’ from the Organize tab.
Curtain (‘swipe‘) controls
Sometimes, one want to compare two overlapping layers. One way of doing this is to use the transparency. Another way, keeping both layers’ full opacity, is to use the curtain controls.
It works as if the active layer were a curtain: folding the curtain leaves room to what lies behind. Moving
the curtain over the layer lets the user see, on this cleared area, the underlying layer. Curtain control is
available both for vertical and horizontal directions.
Open the contextual menu by right-clicking on the layer, position the mouse over the proper curtain
(horizontal or vertical) and move the slider.
Figure 4.9: Using the horizontal curtain to compare locally the Soil association map with the Land Use
data
Note: Don’t forget the curtains settings are persisted for this layer, even if the layer is removed from
the Organize tab. It will reset only after reloading the page in the browser. It is of course possible to
reset the curtains manually by moving the sliders back to their initial positions.
Note: The maximum number of layers one can compare using the curtains is 4, letting one layer for
each quadrant. It is even possible to use transparency to combine some more layers. But this is an
extreme scenario !
4.4.4 Remove the overlay
There are three ways to remove a layer from the map and from the Organize tab:
• Choose ‘Remove‘ in the contextual menu.
16
Chapter 4. Building a map
Geoportal for Risk Management for Gambia, Release 2.10.3-1
• Select the layer and choose the
button from the toolbar on the top of the panel.
• uncheck the layer, change tab and come back again.
Note: This last solution uses the ‘auto-clean’ functionality of the Organize tab: every unchecked layer
is removed, when one changes tab. This allows to keep the Organize panel quite well ordered.
4.5 Add other layers
4.5.1 Add an external WMS layer
It is possible to add overlays from external cartographic services, through the first button in the tab’s
toolbar (Add WMS). WMS means Web Map Service. This tool allows you to look in a list of available services, or to add a new one (you must know its WMS URL). It then lists the available overlays
associated to this service, and you can choose a add some of them to the map.
4.5.2 Add a layer from the catalog
Its is also possible to add overlays from a search in the Geo-catalog. When overlays are attached to a
metadata, it is possible, by clicking the icon, to add them to the map. This operation will be explained
in the Geo-catalog section.
4.5. Add other layers
17
Geoportal for Risk Management for Gambia, Release 2.10.3-1
18
Chapter 4. Building a map
CHAPTER 5
Using the map
Manipulating the map is mostly done using the mouse and the map’s top toolbar.
5.1
Zoom in, zoom out, pan the map
5.1.1 Zoom
Zooming in or out can be performed by simply scrolling the mouse’s wheel.
It can also be done using the three first buttons on the map’s top toolbar:
•
will reset the map’s position and zoom.
•
switches the mouse in zoom in mode. While in this mode, it is no longer possible to move
the map. Click with the mouse to draw a rectangle. The application will zoom the map the closest
possible to this rectangle. A single click (no rectangle) will zoom one level closer.
•
switches the mouse in zoom out mode: a mouse click will zoom the map one level farther,
centered on the click.
One last way to zoom in is to press the shift key, click with the mouse and draw a rectangle. This can be
one while in pan mode, and is simpler than switching to zoom in mode.
5.1.2 Pan
Along with zooming in/out, it is necessary to be able to move the map. Actually, this is the default tool,
activated at startup.
Select
to switch to pan mode. In this mode, to move the map, click on the map, keep the mouse
pressed and move the mouse. Release when done.
19
Geoportal for Risk Management for Gambia, Release 2.10.3-1
5.2
Query layers
Select
to switch to query mode. While in query mode, click somewhere on the map to retrieve the
layers’ values on this point. Only queryable layers (see Information about the overlay) will be queried.
The query can take some time, as it requests the information from the map server.
The result is displayed in a pop-up window:
• on the left part are listed all the layers that have returned values. Sometimes, a same layer appears
several times: this means it returned several records (often happens when querying on a polygon
intersection, or on a stacked group of points). Sometimes a layer doesn’t appear at all, if it has no
data at this place.
• on the right are displayed the informations (data) for the layer selected on the left panel. Select
another layer, the informations will update accordingly.
The queried location is shown on the map using a
marker.
Figure 5.1: Both layers are shown as queryable in the Organize tab. Querying on a place where both
layers have data (a polygon, for the Natural parks layer) returns one value for the Natural Parks layer
and two for the Land Use layer (must have fallen on a boundary between two polygons).
To quit the query mode, you can switch back to pan mode.
5.3
The
Measuring
button is actually a two-fold button. Clicking on the button itself will activate the Distance
Measurement tool. But clicking on the
between Distance Measurement (
icon just on the right of it will open a submenu to choose
) or Area Measurement (
) tool.
Both tools work in a similar way.
20
Chapter 5. Using the map
Geoportal for Risk Management for Gambia, Release 2.10.3-1
To measure a distance, select
and draw the line on the map: each left-click with the mouse will draw
a corner. Starting with two corners, it makes a line and the measure gets displayed. A double-click will
end the measurement.
Measuring a surface is done the same: starting with the third corner, it makes a polygon and the measured
area gets displayed.
Figure 5.2: Measuring the covered area of a river floodplain area, on the Soil association overlay.
5.4
History
Using the arrows buttons
and
, you can go back/forward in the previous zoom views, a bit like
the history arrows of a web browser.
5.5
Save/restore the map
You can save the map configuration, for further reload. It allows you to suspend a working session and
restore it later, in order to get back to where you were last time. Or to send the file to a colleague, that
could restore the same environment you were working in.
This is done using WMC, Web Map Context protocol. This is a standardized way to store a map’s
composition.
Saving is done using the
button. It will offer you to save a file with a cml extension. This is the
file that will contain all the necessary information to further restore the map’s composition. Save it
somewhere on the computer, or send it to the persons with whom you want to share the map.
Restoring the composition is done using the
button, selecting the file on the computer, and pressing
Load button. Choosing Merge button would add the layers in to the current map. Load will replace the
current map with the saved one.
5.4.
History
21
Geoportal for Risk Management for Gambia, Release 2.10.3-1
22
Chapter 5. Using the map
CHAPTER 6
Printing
The printing function allows to generate a PDF page with an extract from the map, title, comments and
legend. This PDF page can then be easily printed, sent, or integrated in larger documents.
Figure 6.1: Print output, first page
6.1 Print tab
Printing is controlled from the Print tab. It contains a form in which you can define the title, the comments to incorporate and several parameters.
Simultaneously, an orange square box should appear on the map. It represents the extent that will be
taken in consideration while printing. The box automatically centers on the map center. Its size is
23
Geoportal for Risk Management for Gambia, Release 2.10.3-1
determined by the Scale field. By default and when the map refreshes, the portal tries to optimize the
box’s size to the current view.
Figure 6.2: Print form on the left, orange extent box overlaid on the map.
A Generate PDF button, on the bottom, triggers the document’s production. It may take a moment,
since the document’s generation is made on the server and requires to process the active layers.
Then, the browser should output a PDF file, to open in a PDF viewer or save to the disk.
Note: As stated in the Print tab, Google and Bing backgrounds can’t be used for the printing. This is
due to licence restrictions from those companies, allowing the use for view, but not for export/print.
It is therefore advised to use another background (OpenStreetMap works fine) or any overlay that will
cover the background.
24
Chapter 6. Printing
CHAPTER 7
Geo-catalog
This is the search engine for the Geoportal for Risk Management in Gambia. It allows you to perform
searches in the cataloged data. As the time goes, an increasing amount of data will be stored in the
catalog, making it a reference about Risk Management in Gambia.
7.1 Search form
Figure 7.1: Search form, with advanced options unfolded
The form in the Search tab gives wide means to query the catalog, depending on relevant fields in the
metadata sheets. Each search field defines a specific search criteria, that gets combined with the others.
25
Geoportal for Risk Management for Gambia, Release 2.10.3-1
The first form field, with no label, is a free search field, and corresponds to the usual search field of a
search engine, like Google’s, for example. The words entered in that field are looked for in the whole
content of the metadata sheets. Each sheet containing one of the word is selected as belonging to the
search results.
This is just a beginning: you can add more search criteria:
• Resource type: most data are classified in Datasets. Data series correspond to series, like, for
example, the whole set of topographic 1/250 000th scale maps. The Service (Web Map Services)
and Feature catalog are more rare and reserved to experts.
• Geographic criteria: one of the ideas of geocatalogs is, precisely, to take into account the geographic positioning of objects. Therefore, we can deal with those information, while searching
for data.
– Select extent: by clicking on this button, you can draw on the map an extent box for the
search. By default, all data intersecting this box, even partially, will be selected. This
behavior can be changed with the Relation type list.
If not satisfied with the drawn box, you can redraw it as much as you want. You can remove
the box by clicking the remove button.
To disable the Select extent button, you can click on the hand button in the map toolbar: it is
attached to the same buttons toggle-group.
– WKT geometry: this field, grayed, is not meant to be used, it is more of a control field for
advanced users.
– Relation type: it allows you to define the kind of relation assumed for the box. The most
interesting are:
* Overlaps: default choice. All the data whose extent overlaps, even partially, the box are
selected.
* Encloses: all the data whose extent contain the box are selected.
* Fully Outside of : the data outside of the box are selected.
* Within: selects the data whose extent is strictly within the box.
Figure 7.2: Advanced search using both geographic extent definition and some advanced options
• Advanced search options: this field set allows you to set more criteria, more precise. Be careful
that by defining too much criteria, you may end with no result...
26
Chapter 7. Geo-catalog
Geoportal for Risk Management for Gambia, Release 2.10.3-1
– Keywords: we can enter some keywords. Those keywords are only looked for in the words
set as keywords in the sheets, not in the whole content (use free search field for this). If
clicking on the arrow on the right of the field, a list of available keywords is proposed.
Auto-completion is also available.
– Organization: you can restrict the search based on which organization owns the metadata.
– Category: GeoNetwork gives the possibility to attach given categories to the metadata. This
is a complementary approach to the keywords use. You can restrict the search to certain of
these categories.
– When?: by default, this fields set is folded, thus invisible. You can unfold it by clicking on
the arrow on the left. It is used to restrict the search on temporal criteria:
* Metadata change date: you can, for example, select all the data that have not been
updated since at least 5 years. Or, on the contrary, data published less than 1 month ago.
* Temporal extent: same thing, but on the data date itself, as defined in the metadata sheet.
* The fields can be reset by clicking the “any time” check-box.
– Spatial representation: allows to filter on the data type: raster data, text, vector, video, etc.
– Scale: when checked, a cursor allows you to set the scale extent to apply.
– Catalog: the geocatalog can perform what is called “harvesting”. It can harvest other catalogs, for example the FAO geocatalog, that can contain relevant data for our purpose. Those
harvested catalogs are also queried in the search. Using this field, you can choose to restrict
the search to one or more catalogs.
• Options: allows you to define display and sorting parameters for the search results’ display.
Finally (but you don’t have to fill all the field !), you trigger the search by clicking on the Search button.
7.2 Results
After searching in the catalog database, the Search Form folds itself and gives place to the Results panel.
This panel lists the search results, 10 by 10.
Figure 7.3: Search results list. Hovering a result with the mouse opens a tip showing the full abstract.
In the map, the rectangles represent the extent of each result, one color per result. The highlighted one
is the current hovered result.
7.2.1 Results list
Each result element shows :
7.2. Results
27
Geoportal for Risk Management for Gambia, Release 2.10.3-1
• A checkbox to select the result (you can perform actions on selected metadata using the top toolbar’s Other actions menu)
• The title. You click it to open the full metadata sheet.
• The summary, truncated if too large.
• The keywords list.
• A thumbnail (if available). Click it to open the large thumbnail.
• An icon list on the right, telling you the additional feature of this data:
– data to download;
– geospatial data to display in the map;
– web links.
Those icons are not clickable, but just give you the information. To go further, you have to pass
by the complete metadata sheet (click on the title).
• On the right border, a colored line tells you what color is used for the extent, as drawn on the
map. This way you can visually identify the result’s extent on the map. When hovering a result,
its extent is made brighter.
• On the bottom right, the referent organism is shown, if available.
• When hovering the result for a while, a “tooltip” is shown. It contains the whole summary.
• Finally, double-clicking on the result entry positions the map on its extent.
Figure 7.4: A metadata sheet
7.3 Toolbars
7.3.1 Top toolbar
The top toolbar allows you to:
• Sort the results based on a different criteria.
28
Chapter 7. Geo-catalog
Geoportal for Risk Management for Gambia, Release 2.10.3-1
• Select/unselect results.
• Perform actions on selected results. For simple visitors, the available actions are mostly limited
to exporting data in several formats. If logged in, other actions are available, such as edition,
duplicate metadata, set privileges, etc.
7.3.2 Bottom toolbar
It gives you control over the results’ pagination.
7.3. Toolbars
29
Geoportal for Risk Management for Gambia, Release 2.10.3-1
30
Chapter 7. Geo-catalog
CHAPTER 8
Advanced tools
8.1
Polygon Query
8.1.1 Presentation
The standard query tool only allows to perform punctual queries. While this satisfies many needs, there
are some cases when you want to collect some information on a surface rather than on punctual locations.
Say, for example, you need to know how many people live in a given area at risk. Or, you want to know
the lowest, or the highest elevation in this area. You will not do this using punctual queries. You will
use this new polygonal queries tool.
This tool will be available for only specific layers. You basicly have to select one of those layers, draw
on the map the polygon defining the area you want to query, and get the results.
8.1.2 Identify suitable layers
This is done in the Organize tab (left panel): suitable layers have the
the overlay).
Selecting a suitable layer (mouse-click on it) should enable the
top toolbar.
icon (see Information about
Polygon Query button on the map’s
8.1.3 Use the Polygon Query tool
Click on the
Polygon Query button on the map’s top toolbar, it will switch the mouse to Polygon
Query mode and open a window on the left, with some informational text but no data yet.
Then draw a polygon on the map: each mouse-click will add a corner ; a double click will close the
polygon and trigger the query.
This then may take a while, for the server to compute and return the data. The data is then displayed on
the bottom part of the window.
Draw again a new polygon, close-it by double-click and the result will update accordingly.
To quit the Polygon Query mode, switch back to another too in the map’s top toolbar, say the Pan mode,
for example.
31
Geoportal for Risk Management for Gambia, Release 2.10.3-1
Figure 8.1: Using the Polygon Query tool.
8.2
Animations
Some data are meaningful only if one can browse them in their temporal dimension. The Temporal
Profiles tool gives one way of exploring these data. Another way is to play animations. Like it is usually
done with cloud weather data.
A “player” has been implemented for such use : the animations tool.
Each dataset that can be used with this tool is configured by an Administrator. The portal User can select
the dataset to animate, load it, and play the animation, either backward or forward, or step-by-step.
8.2.1 Activate Animations tool
One can activate the tool by clicking the
Animation button in the map’s top toolbar.
Figure 8.2: Open the Animations tool, select the dataset to animate.
A window pops up. You first have to choose the dataset you want to animate and then load it (click on
the Load button).
A progress bar will keep you informed on the loading status: all data have to be loaded before you can
start playing the animation. This allows for more fluidity afterwards.
32
Chapter 8. Advanced tools
Geoportal for Risk Management for Gambia, Release 2.10.3-1
If you load the dataset for the first time, it may take some sime. Afterwards, it should be quite straightforward, since the data are cached in the browser.
When the dataset has finished loading, the second half of the window gets accessible: the player part,
composed of:
• A slider, telling you where you are on the dataset. It starts on the last image (for meteo data, the
current meteo).
• A field telling you the date associated with this image.
• A row of buttons for animation control.
You can play the animation, either by moving the slider, or using the animation control buttons.
Figure 8.3: Data is loaded, the animation layer is added in the Organize layers list.
8.2.2 Animation control buttons
This is a 7 buttons row:
•
•
•
•
•
•
•
8.2.
moves to the first (oldest) image. If an animation is running, it will move to the first
image, but will not stop the animation (for this, use the pause button).
moves to the previous image.
backward animation button: loops over the images, playing backward. The animation
will keep playing until you press the pause button (or the forward animation button, which will
revert the play).
pause button: this will stop any animations in play.
forward animation button: loops over the images, playing forward. The animation will
keep playing until you press the pause button (or the backward animation button, which will revert
the play).
moves to the next image.
moves to the last (the more recent) image. If an animation is running, it will move to
the last image, but will not stop the animation (for this, use the pause button).
Animations
33
Geoportal for Risk Management for Gambia, Release 2.10.3-1
8.2.3 Animation map layer
When you start playing the images, a new layer is added in the Organize tab, with the dataset’s name.
You can use it as any other map layer : play on opacity, curtain settings, visibility,reorganize with other
layers, etc.
If you close the animation window, the layer is kept visible. This allows you to use it without having to
keep this window around. If you want to remove the layer, simply unckeck it, or remove it (right-click,
choose remove).
Note: Be aware that if you close the window while an animation is playing, it will keep playing. To
stop it from playing, open the animation tool again, and press the pause button.
8.3
Temporal profiles
This tool is activated by clicking the
Temporal Profile button, on the map’s top toolbar.
Figure 8.4: NDVI index, annual data graphic
The form of the mouse cursor changes to a
question mark. Click a place on the map where you want
to get some profiling information. It will open a window.
The window has several tabs, one per dataset:
• NDVI (Normalized Difference Vegetation Index)
• Soil Moisture indicator
• VCI (Vegetation Condition Index)
For each of these layers, two kind of profiles are available:
• Annual data: select a year, press Apply and the data are recovered, one value by decade (each 10
days) and displayed as a graphic.
• History of a decade: select a decade (month then day of the month), press Apply and the history
of the values taken by the index over the years is displayed as a graphic.
Other documents:
• User Manual (PDF)
34
Chapter 8. Advanced tools
Geoportal for Risk Management for Gambia, Release 2.10.3-1
• Editor & Administrator Manual
• Editor & Administrator (PDF)
8.3.
Temporal profiles
35
Geoportal for Risk Management for Gambia, Release 2.10.3-1
36
Chapter 8. Advanced tools
Index
A
Animation
Control, 31
Query, 19
WMS, 11
login form, 8
B
M
Background
Layer, 11
Measure
Control, 20
Metadata, 24
Move
Control, 19
C
Chart
Layer, 11
Control
Animation, 31
Curtain, 16
History, 21
Measure, 20
Move, 19
Pan, 19
Polygon Query, 31
Query, 19
Restore (map), 21
Save (map), 21
Transparency, 15
Zoom, 19
Curtain
Control, 16
G
Geo-catalog, 24
graphics, 34
H
help, 8
History
Control, 21
L
Layer, 9
Background, 11
Chart, 11
N
NDVI, 34
O
Overlay, 9
P
Pan
Control, 19
PDF, 21
Polygon Query
Control, 31
Print, 21
Q
Query
Control, 19
Layer, 19
R
Restore (map)
Control, 21
S
Save (map)
Control, 21
Search, 24
Soil Moisture, 34
37
Geoportal for Risk Management for Gambia, Release 2.10.3-1
T
Temporal Profile, 34
Transparency
Control, 15
V
VCI, 34
W
WMS
Layer, 11
Z
Zoom
Control, 19
38
Index