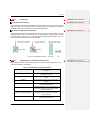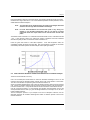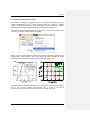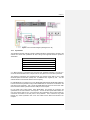
1
` PC1/K2 Spectrofluorometer USER MANUAL Sixth Edition March 2011 Printed in USA Copyrights 1998-2011 ISS Inc. All rights reserved, including those to reproduce this book or parts thereof in any form without written permission from ISS Inc. ISS, the ISS logo are registered trademarks and “PC1”, “KOALA”, “K2”, “ALBA” are trademarks of ISS Inc. Mailing Address: Shipping Address: Telephone: FAX: E-mail address: P.O. Box 6930 Champaign, Illinois 61826-6930; U.S.A. 1602 Newton Drive Champaign, Illinois 61822; U.S.A. (217) 359-8681 (217) 359-7879 [email protected] (marketing) [email protected] (technical support & service) NOTICE ISS Inc. reserves the right to make any changes or improvements to its products without prior notice. ISS assumes no responsibility for any errors that may appear in this document. All of the documentation has been carefully written to cover most of the questions that may arise during normal use. For additional assistance, a Product Specialist is available during normal business hours. Contact the Technical and Support Department at the following E-mail address: [email protected]. PC1 User Manual PC1 User Manual TABLE OF CONTENTS 1.1 1.2 1.3 1.4 2.1 2.2 3.1 3.2 3.3 3.4 3.5 4.1 4.2 4.3 4.4 4.5 4.6 4.7 Your ISS PC1 Instrument 1.1.1 Hardware 1.1.2 Unpacking the Instrument and Components 1.1.3 Assembling PC1 Components 1.1.4 Installation of the Polarizer Holders 1.1.5 Installation of the Photomultiplier (PMT) Tubes 1.1.6 Installation of the Xenon Arc Lamp Excitation Light Source The Excitation and Emission Monochromators Computer Requirements and Hardware 1.3.1 The Computer Requirements 1.3.2 External I/O Ports for Accessory Control Instrument Control and Data Acquisition 1.4.1 Photon-Counting Detector Voltages 1.4.2 Photon-Counting Tray and Pre-Amplifier Discriminators Introduction Daily Operation Introduction Experimental Details 3.2.1 Cuvettes 3.2.2 Handling of Chemicals 3.2.3 Buffer Solutions and Background Fluorescence 3.2.4 Transparent Liquid Samples 3.2.5 Solid Samples 3.2.6 Sample Stability and Time-Dependent Phenomena 3.2.7 Selection of the Spectral Observation Window 3.2.8 Absorption Type Optical Filters 3.2.9 Interference Filters: Bandpass Filters 3.2.10 Monochromators 3.2.11 Slit width Selection for Excitation and Emission Monochromator Signal Level 3.3.1 Dark Signal Optimization 3.3.2 Choose a Proper Signal Level Preparing a Quantum Counter Solution Alignment of Reference Channel Signal Level Intensity Wavelength Scans 4.1.1 Emission and Excitation Spectra 4.1.2 Synchronous Luminescence Spectra 4.1.3 Excitation and Emission Matrices Polarization Wavelength Scans 4.2.1 Introduction: Polarization Measurements 4.2.2 Polarization (Anisotropy) Spectra Single point Intensity, Polarization, Ratio Measurement 4.3.1 Single Point Intensity: Single, Fixed Wavelength 4.3.2 Polarization Single, Fixed Wavelength 4.3.3 Single Point Ratio Metric Measurement Intensity Time 4.4.1 Slow Kinetics Routines for Changing Sample Conditions Polarization Time 4.5.1 Slow Kinetics Routines: Changing Sample Characteristics or Conditions Intensity Concentration 4.6.1 Slow Kinetics / Titration Measurements 4.6.2 Fast Kinetics / Stopped-Flow Measurements Intensity Concentration, pH, Pressure and Temperature 4.7.1 Ratiometric Measurements PC1 User Manual 6 6 6 7 7 8 9 10 12 12 12 12 12 13 16 17 24 24 24 26 26 27 28 28 29 30 31 31 34 36 36 37 38 40 42 42 44 44 45 45 47 47 47 47 49 49 49 49 49 50 50 50 50 50 5.1 5.2 5.3 5.4 6.1 6.2 6.4 7.1 7.2 7.3 8.1 8.2 8.3 8.3.1 8.3.2 8.4 9 10.1 10.2 10.3 10.4 10.5 11.1 Measurement of the Emission Spectrum of Fluorescein 5.1.1 Fluorescein as a Standard 5.1.2 Check the Signal Levels 5.1.3 Global Settings Measurement of the Excitation Spectra of Fluorescein 5.2.1 Check Signal Level 5.2.2 Data Acquisition How to Find the Excitation and Emission Maximum for an Unknown Sample Polarization (Anisotropy) Spectra 5.4.1 L- Format Excitation Polarization Data from a Rhodamine B Block Raman Spectrum of Water 6.1.1 Location of the Raman Band of Water 6.1.2 Water Quality Problems Measurement of Signal to Noise (S/N) ratio 6.2.1 Set up 64 6.2.2 Measurement of the Signal-Noise Ratio 6.2.3 Calculation of Signal-to-Noise (S/N) ratio 6.3.1 Set Up 6.3.2 Measurement 6.3.3 Analysis 66 Polarization Performance Test 6.4.1 Set Up 66 6.4.2 L-Format Polarization Data from a Glycogen Solution Monochromator Wavelength Calibration Monochromator Wavelength Calibration Methods 7.2.1 Method 1: Only One Monochromator is Off 7.2.2 Method 2: Wavelength Calibration with Solid Ovalene Sample in PMMA 7.2.3 Method 3: Wavelength Calibration Using the Light from Fluorescent Tube Lamps 72 7.2.4 Method 4: Wavelength Calibration with a Laser Line 7.2.5 What to Do When the Wavelength Position Can Not Be Determined 7.2.6 Adjustment of the Monochromator Dial Spectral Correction Files 7.3.1 Automatic Real-time Multiplication 7.3.2 Spectral Correction after Acquisition 7.3.3 Correction Files Provided by Vinci 7.3.4 Generating your Own Emission Spectra Correction Curves/Files 7.3.5 Correction for Lamp Intensity Fluctuations 7.3.6 Corrections for Reference PMT Wavelength Dependent Response 7.3.7 Correction of Excitation Spectra Mechanical Components 8.1.1 Accessories Electronic Components Optical Components Installation of a New Xenon Lamp Placement Procedure: Software Instrument Specifications General Conditions Expired Warranty Non-ISS Parts Field Service Transportation Damage K2 Hardware Installation and Setup Unpack the Instrument PC1 User Manual 54 54 54 54 56 56 56 57 58 58 62 63 64 64 64 65 65 65 66 67 70 70 70 71 73 73 73 74 74 75 75 75 76 77 77 80 81 82 83 84 84 86 88 92 92 92 92 92 95 96 11.2 Install the Hardware 11.3 Installation of PMT tubes and polarizers 11.3.1 Installation of the Xenon Arc Lamp Excitation Light Source 11.3.2 A Continuous-Wavelength Laser as the Light Source 11.2.1 Synthesizers 11.2.2 RF Amplifier 11.2.3 Optical bench 11.3 Alignment of the Light Modulator 11.3.1 Alignment of the Light Modulator for Xenon Arc Lamp 11.3.2 Alignment of the Light Modulator for a CW Laser 11.4 ISS Modulated Laser or LED 11.5 Steady State Alignment 12.1 Comparison of Steady State and Time-Resolved Mode 12.2 Steady State measurement 12.3 Time-Resolved measurement 12.4 Shut Down the Instrument 13 Introduction to Time-Resolved Measurement 13.1 General Procedure for all experiments 13.1.1 Turning on K2 and Starting the Vinci Software 13.1.2 Select Proper Excitation Wavelength, Filters or Emission Wavelength 13.1.3 Select a lifetime standard 13.1.4 Prepare the Samples 13.1.5 Frequency Range 13.2 Data Collection 13.2.1 Lifetime measurement 13.2.2 Anisotropy Measurement 13.2.3 Time-Resolved Spectrum Measurement 13.2.4 Phase-Resolved Spectra Measurement 13.3 Data analysis using Vinci software PC1 User Manual 96 96 97 99 102 103 104 105 105 111 114 115 118 118 121 123 126 126 126 126 127 128 128 129 129 130 131 133 134 PC1 User Manual Chapter 2 Chapter 1: Installation and Set Up PC1 User Manual Chapter 2 1.1 Your ISS PC1 Instrument 1.1.1 Hardware PC1 - the Photon-Counting Spectrofluorimeter includes the following parts: Optical bench: with excitation monochromator, excitation channel, reference channel, sample compartment, one or two emission channels (depending on system configuration), one of which includes the emission monochromator, two or three PMT housings (depending on system configuration) with photomultiplier tubes. Upgrades also include optional accessories. See below. Light source: the standard light source is a 300W xenon arc lamp. ISS-PCMC card, photon counting and motion control, for PC1 data acquisition and instrument control: The card is to be inserted into the computer, and requires 2 slots: one PCI slot for the card and one adjacent spare slot for an expansion port connected to this card. Desktop computer with the following minimum configuration: 512MB free RAM, 1GHz x86 CPU, Windows XP, 1 PCI slot, and 1 adjacent spare slot. ISS supplies a variety of accessories for PC1: UV Glan-Thompson polarizers, sizes 10x10 or 14x14, for high accuracy polarization measurements Fiber optics for remote measurements Automated temperature bath Automated high pressure pump Automated titrator Automated stopped-flow accessory for kinetics studies TIRF (Total Internal Reflection Fluorescence) cell 1-cuvette, 2-cuvette, 3-cuvette computer controlled sample compartment 1-cuvette or 4-cuvette computer controlled Peltier sample compartment 1.1.2 Unpacking the Instrument and Components Upon receiving the instrument inspect the outside of the crate and boxes for any sign of shipping damage. When damage has occurred, contact the carrier and ISS Inc. immediately for further instructions. If no obvious damage is visible, proceed as follows: Open the crate by removing the screws that fasten the lid to the walls of the crate. You will need a standard Phillips screw driver. When the lid has been removed, visually inspect the instrument for any noticeable damage. If damage is discovered to components inside the crate contact your carrier and ISS immediately; otherwise, continue to unpack the instrument. Please save all packing materials for future shipping needs. PC1 User Manual Chapter 2 1.1.3 Assembling PC1 Components After unpacking the instrument, place it on a sturdy table and remove the protective wrap. Remove all protective materials from mirrors, lenses, polarizer holders, and sample compartment. Remove the shipping rubber rings that secure the shutter blades during shipment and attach the four supplied 4-40 x ½ screws. The optical bench supports the excitation monochromator, excitation and reference channel, sample compartment, two emission channels and the photomultiplier tube (PMT) housings. The photomultiplier tubes and polarizers are shipped in separate boxes. Unpack them and install them according to the instructions described below. Figure 1.1-1 Main Power Panel of the ISS PC1 Instrument The supplied 25 pin data cable connects to REMOTE on the Main Power Panel and to the PCMC card installed in the computer. Also on the right side of the instrument is the Signal Output Panel. This panel has a connector marked Photon Counting. Its output links all three photon-counting channels to the ISS-PCMC card using the supplied 15 pin data cable. Figure 1.1-2 Signal Output Panel of the ISS PC1 Instrument 1.1.4 Installation of the Polarizer Holders Figure 1.1-3 Polarizer Slide Figure 1.1-4 Glan-Thompson Polarizer in its Holder PC1 User Manual Chapter 2 Identify the packages containing the polarizer in their holders. Each polarizer holder is packed in a separate box and installed in the same manner. Ensure the polarizer slide moves freely in the channel. WARNING: THE POLARIZER SLIDES ARE ALREADY MOUNTED IN THE CHANNEL AND CALIBRATED FOR PROPER ANGULAR POSITION. Locate the setscrew on the Polarizer slide and remove it. Open a box and remove a holder. Carefully remove the protective red cap, wrapping or parafilm. Push the slide of the polarizer assembly to free access to the round holder. Remove the set screw on the polarizer slide. The cylinder that contained this setscrew should now be slid out of the channel. Using gloves to prevent fingerprints insert the polarizer and overlap the indent mark on the polarizer with the set screw opening. Fasten the set screw. Please use gloves and do not fingerprint the polarizer surfaces. Clean surfaces when required with a very small amount of ethanol and lens tissue. Note 1: When the set screw on the holder points upward the principal axis of the GlanThompson polarizer indicates the vertical (V): 0 degrees. Note 2: An increase of a factor of two in detected signal is possible by exchanging the 10x10 mm for 14x14 mm polarizers. They all fit in the instrument polarizer slides. 1.1.5 Installation of the Photomultiplier (PMT) Tubes WARNING: MUST INSTALL DETECTORS IN A ROOM WITH DIM LIGHTING. DO NOT TOUCH THE QUARTZ ENVELOPE OF THE DETECTOR TO PREVENT BACKGROUND LUMINESCENCE FROM SURFACE CONTAMINANTS. CLEAN IF REQUIRED WITH HIGH QUALITY ETHANOL. NEVER OPEN THE PHOTOMULTIPLIER HOUSING WHEN THE POWER SUPPLY IS CONNECTED TO THE UNIT. ELECTRICAL SHOCK AND/OR DAMAGE TO THE DETECTOR MAY OCCUR Unlike the PMT housings which are shipped attached to the optical bench, the detectors are contained in a separate package for safety. Detach the coupling collar and the 8-32x1/2 cap screw and washer attaching the PMT house to the optical bench. Remove both screws that secure the PMT housing cap. Make sure the rubber ring sits in the groove of the housing to provide proper shielding of room light. Work under dim or dark red light conditions. Work on a table top to unpack the PMT tubes. The boxes the detectors are shipped in are marked for a particular channel. It is important you match the detector with the proper channel. They are also marked with a dark count that was used when testing the instrument at the factory. Please refer to section 1.5.3 discriminator level adjustment. Hold the PMT from the green base, do not touch the window. Firmly insert the photomultiplier tube. A notch on the PMT base ensures proper alignment. Mount the housings again in their original positions on the optical bench. Figure 1.1-5 Control Panel of the Photomultiplier Housing PC1 User Manual Chapter 2 The cables supplying the low voltage to the detectors have all been installed on the optical bench close to the PMT housings. First make sure that the main power switch on the instrument is OFF, and then connect the DIN plug to each housing. This connector supplies low voltage to the built-in high-voltage power supply inside the housing. Connect the BNC labeled OUT to the OUT plug on each of the housings. When working in photon-counting mode the potentiometers controlling the PMT voltage should always be at their maximum value of 10.0. This setting corresponds to approximately - 1200V on the photocathode. Before moving the dial make sure the dial locking brakes, located under the dials, are shifted to the unlocked position (CW rotation). 1.1.6 Installation of the Xenon Arc Lamp Excitation Light Source The Xenon arc lamp is the standard light source for the ISS PC1 instrument. Figure 1.1-6 Lamp Housing Assembly A separate package contains the lamp housing mounted on the lamp base and a tube connecting the lamp to the excitation monochromator. The tube has a 1/4" brass hose fitting for nitrogen flushing. Fan-driven forced room air cools the lamp assembly. Ozone created in the process is removed via a 3 inch diameter round aluminum air duct hose. It is supplied and attached by the user to the flange mounted on top of the lamp housing. If you only work in the visible an ozonefree lamp can be supplied. Unpack the above light source-related items. Remove the protective cover on the lamp housing. The lamp bulb and the condenser lens in front of it are already mounted. Check the lens and the quartz window for dust and cleanliness. Check that the screwed-in lamp electrodes are firmly attached to the cooling radiator blocks. A loose connection will cause excessive heating of the electrode contacts. Use a pair of small pliers and gently fasten any loose electrodes. Thread the protective ozone tube on to the excitation monochromator flange. Identify the screws supporting the lamp on the rear part of the optical bench. Fix the lamp base to the optical bench using the supplied four screws. Tighten the two screws securing the ozone tube to the lamp housing lens coupler. Unpack the lamp power supply and place it next to the optical bench. Check the lamp power supply, its dial and frame for any shipping damage. PC1 User Manual Chapter 2 Figure 1.1-7 Xenon Arc Lamp Power Supply WARNING: DURING THIS OPERATION THE LAMP POWER SUPPLY MUST BE OFF OR DAMAGE TO THE POWER SUPPLY AND POSSIBLE HIGH VOLTAGE SHOCK MAY OCCUR. Connect the cable to the proper polarized electrodes of the lamp housing (black = ground, white = high voltage) and ground it to the protective grid covering the fan using an 8-32 cap screw. Connect the 6-pin fan connector to the lamp housing. Connect the high power cable to the proper polarized connector as well as the 6 pin fan connector to the back of the lamp power supply. 1.2 The Excitation and Emission Monochromators PC1 is equipped with one excitation and one or two F/3.5 emission monochromators. They consist of 32x32 mm, aberration-corrected, concave holographic gratings with 1200 grooves/mm for very low stray light levels and absence of ghost lines. The grating in the excitation monochromator is blazed at 250 nm for maximum sensitivity/transmission in the ultraviolet region. This optimizes the excitation intensity for Tyrosine at 280 nm or Tryptophan at 295 / 300 nm in protein solutions, and DNA at 260 nm. The grating mounted in the emission monochromator is maximized for fluorescence light detection either in the region 350 - 800 nm or peaked at 450 nm. For better stray light rejection a double monochromator, or better baffled 25 cm focal length monochromator can used in the excitation or emission channels. Deep red emitters are best served by an optional emission monochromator operating in 2-nd order. a) Slits The standard F/3.5 10 cm focal length monochromators are equipped with a set of interchangeable slits. The slit handles are marked with the width of the slits: 2, 1, and 0.5 mm. Since the reciprocal linear dispersion of the monochromator is 8 nm/mm, these slits have a bandwidth of 16, 8, and 4 nm FWHM (Full Width at Half maximum) respectively. Larger (4mm) and narrower slits (0.25, 0.1, 0.05, 0.025 mm) are available upon request. PC1 User Manual Chapter 2 b) Definition of Full Width at Half Maximum (FWHM) Spectral Bandwidth Spectral bandwidth is half for a double monochromator with the same F/3.5 10 cm focal length: A 0.5 mm slit combination equals 2 nm FWHM, the reciprocal linear dispersion is 4 nm/mm. Figure 1.2-1 Bandwidth for Single Monochromator equipped with 1 mm slits Table 1.2-2 Available Monochromator Slits Monochromator Slit Width (mm) 4 2 1 0.5 0.25 0.1 0.025 H10 DH10 Bandwidth Bandwidth (FWHM) (nm) (FWHM) (nm) 32 16 8 4 2 0.8 0.2 16 8 4 2 1 0.4 0.1 c) Wavelength Indicator Dial A front dial on each monochromator indicates the wavelength in nanometer. The monochromator stepper motor is plugged into the PC1 optical bench. The excitation and emission monochromators are connected to DIN connector 2 and 3 respectively. Be sure the dial locking brakes, located under the dials, are shifted to the unlocked position (Left) before operating the monochromators. PC1 User Manual Chapter 2 Brake Free Unlocked Dial Figure 1.2-3 Unlocked Wavelength Indicator Dial WARNING: NEVER MANUALLY MOVE THE MONOCHROMATOR DIAL WHEN THE INSTRUMENT MAIN SUPPLY IS ON AND THE MOTOR CONNECTOR IS PLUGGED IN. LOSS OF DIAL W A V E L E N G T H C A L I B R A T I O N M A Y R E S U L T . 1.3 Computer Requirements and Hardware The software provided by ISS to control the instrument and data analysis, uses an ISS PCMC, Photon Counting and Motor control, card. This card needs to be installed into the computer. 1.3.1 1. 2. 3. 4. 1.3.2 The Computer Requirements A minimum of 512 MB RAM memory (for instrument control, and data acquisition) 1 PCI bus and 1 spare adjacent slot for an expansion bracket attached to the PCMC card 1GHZ Intel processor More than 1GByte free disk space. External I/O Ports for Accessory Control Plotter, Temperature Bath, Pressure Generator, Titrator and Stopped-Flow all need to be controlled from the COM1 serial port or USB ports. The left emission monochromator runs from the external port 8. 1.4 Instrument Control and Data Acquisition Instrument automation functions are controlled through the ISS PCMC card via a 25 pin D-Sub connector labeled REMOTE. Data Acquisition is controlled through the ISS PCMC card via a 15 pin D-sub connector labeled PHOTON COUNTING. 1.4.1 Photon-Counting Detector Voltages The signal from all three photomultiplier tubes is sent to three independent pre-amplifier discriminators. They are located under the right side of the optical bench labeled from left to right: REM, LEM, and EXC corresponding with the right emission, left emission and reference detector for the standard configuration. Set the PMT voltage control potentiometer to the maximum value, 10.0. Keep the lamp OFF. Make sure that all shutters are closed and no light can reach the detectors. Check that the Out labeled BNC cables are connected to the OUT labeled connectors on the PMT house. PC1 User Manual Chapter 2 1.4.2 Photon-Counting Tray and Pre-Amplifier Discriminators Dark signal settings are in (Counts/Sec). Trim potentiometers for setting the dark signal discriminator level for each detector channel (REM, LEM, EXC), are accessible from outside on the right side of the instrument and should be adjusted only with the insulated screwdriver supplied for this purpose. 1.4.3 Discriminator Level Adjustment Stabilization Time for Lamp and Photomultiplier Tubes. The lamp is usually stable after fifteen minutes. The photomultiplier tubes may take about three hours. This time can be longer if the room temperature is changing in the meantime. For routine work, it is a good idea to keep the photomultiplier tubes on; in this way you only need to turn the lamp on, wait for fifteen minutes and start working. Figure 1.4 -1 Optimum Discriminator Level Discriminator Setup The dark counts should be checked after the photomultiplier tubes have had time to warm-up. The dark count setting used during factory testing is written on the box that the PMT is shipped with. After a warm-up period of 3 hours the value of the dark count should be close to this value. If not it will be necessary to optimize this value. Please refer to section 3.3.1 dark signal optimization. The discriminator threshold is utilized to cut the dark counts coming from the photomultiplier tube. The threshold level of the discriminators utilized in our instrumentation is regulated through a trimpot accessible from the right side of the instrument. They are labeled “Level Adjust”. Figure 1.4-2 The trimpot has fifteen turns. Turning the trimpot clockwise (CW), the threshold level increases. When the instrument is on and the shutters are closed, by turning the trimpot clockwise you will get a plot similar to the one reported in Figure 1.4-1. With the trimpot completely counterclockwise (CCW), your threshold is practically zero and you will read millions of counts (Johnson noise, etc.). As you turn the trimpot clockwise, the number of counts will decrease and will PC1 User Manual Chapter 2 stabilize after five/six turns. It is not recommended setting the threshold close to a point where the counts start to increase; allow a couple of turns so you will work in the linear plateau region. (Refer also to 3.3.1 for Signal Level) Reference Channel Signal Level Settings When the 2mm slits are utilized in the excitation monochromator, adjust the counts in the reference channel until you are in the range of about 50,000 to 500,000 counts/second.. (Refer also to 2.4 for Preparing a Quantum Counter Solution) PC1 User Manual Chapter 2 Chapter 2: Quick Start and Daily Operation PC1 User Manual Chapter 2 2.1 Introduction Figure 2.1-1 PC1 – Photon Counting Steady-State Spectrofluorimeter Figure 2.1-2 PC1 – Optical Diagram and Layout A photo and the schematic diagram of PC1 are shown in Figs. 1.1-1 and 1.1-2. Chapter 1 of this manual is intended to guide the user through the basic operations of the ISSPC1 steady-state spectrofluorimeter, while the subsequent chapters 2 to 4 are aimed to guide a new as well as more experienced user step-by-step through the most important features of this instrument. PC1 User Manual Chapter 2 2.2 Daily Operation Follow these steps to set up the PC1 instrument: Step 1: Lamp Ignition With the software loaded and all components mounted the instrument can be turned on. WARNING: TURN OFF COMPUTER AND INSTRUMENT BEFORE STARTING THE LAMP POWER SUPPLY TO AVOID DAMAGE TO ELECTRONICS. Please turn your computer and instrument off. Set the current control knob of the lamp power supply completely counter-clock-wise (CCW). Switch the lamp power supply on. The initial current is 10A (Ampère) for the 300W xenon arc lamp. The lamp requires 10 minutes to stabilize then for normal operation set the current to 15 - 18A for the best intensity stability. A lamp power supply can be operated up to 23A to maximize intensity. Remove all unnecessary optical neutral density filters, mesh screens, polarizers, and excitation and emission filters from the optical path. A reflective interference filter in the left emission channel while taking emission spectra may distort the spectral data. Use 2 mm excitation slits for optimal intensity. Check that the lever of the iris diaphragm behind the turret points to the left (open position). Figure 2.2-1 Iris Diaphragm Handle Position Close instrument covers and shutters. Direct exposure of the detectors to room light should be prevented as much as possible. Step 2: Turn computer and PC1 instrument on. The instrument ON/OFF switch is located on the right rear side of the instrument. You should hear the sound of the shutters and motors when the instrument is switched on. The PMT housing LED should be on with the PMT housing switch set to manual (MAN). Check that the voltage potentiometer setting is 10.0 (for photon-counting mode of operation). For any stability test, let the PMT warm up for at least 3 hours. For slow kinetics measurement, turn your PC1 and PMT on the day before to stabilize PMT. Please note that air-conditioning, or solar radiation influences the room temperature and thus the temperature of the detectors. Cooled PMT housing are not influenced by these factors. PC1 User Manual Chapter 2 Step 3: Starting Vinci Software PC1 comes with Vinci – Multidimensional Fluorescence Spectroscopy software. The Vinci software is typically located at C:\Program Files\Iss\Vinci. A shortcut icon to Vinci should appear on the desktop after installation; if not, go to start->All Programs->Vinci->Vinci.exe or otherwise click on the Vinci icon on the desktop and the Vinci analysis window (Figure 1.2-2) will be displayed. Select <Experiment> and <Experiment and Instrument Control>, which will launch the Experiment and Instrument Control software in a new window (Figure 1.2-3). Figure 2.2-2 PC1 – Vinci Analysis Window PC1 User Manual Chapter 2 Figure 2.2-3 PC1 – Vinci Experiment and Instrument Control Window All automated components are shown on the Instrument control screen. Automated components are successfully initialized when they pass the software tests. You can hear the shutters, polarizers and turret go from their standby to their measurement position when you start the Vinci Experiment and Instrument Control software. The initialization creates a characteristic sound of shutter and motor-movement. Respective components may have been repositioned manually and were by chance already in the measurement position. After normal daily operation during software shutdown, the software will reset all automated parts to their standby position. When a device does not work properly, an error message may appear on screen and an error message will be written to files err.txt and log.text under folder C:\Documents and Settings\All Users\Application Data\ISS\Vinci. Note: Before the program starts, the 2-position turret sits in the R (reference) position. After motor initialization the 2-position turret sits in the S (sample) position. Note: Without a PCMC card in the computer, Vinci can only be operated in a demonstration mode. Step 4: Check the dark signals (counts/sec). Dark signals for the standard PC1 are shown at the bottom of the Vinci Experiment and Instrument Control window. Dark signals are refreshed at a 10Hz rate. Typical dark signals are between 300-1500 with closed shutters. Upon setting up the instrument for T-format measurements both channels should display a signal output. Step 5: Checking monochromator dial wavelengths The monochromator dial reading should be at 200 nm if the instrument is shut down properly. If the PC1 instrument has experienced a previous irregular shutdown, the monochromators may not be set to 200 nm. Check your monochromator dial reading and calibrate it after you start Vinci. Right click on right emission monochromator, select “Calibrate” (Figure 1.2-4) and enter the PC1 User Manual Chapter 2 monochromator dial reading when prompted. Use the same procedure for the other monochromator(s). See the Vinci reference manual section 4.2 for more information. Figure 2.2-4 PC1 – Monochromator Calibration Step 6: Selection of data storage directory and other data acquisition parameters Figure 2.2-6 “Global Settings” Parameters Select <Settings> and <Global Settings> (Figure 2.2-5). Figure 2.2-5 A new window that includes the parameters related to the measurement will be displayed (Figure 2.2-6). Choose a directory to save your data in Output Directory. A different folder can be selected by clicking on <Browse>. Filenames can either be derived from the title or be prompted for input by a user. If “Automatically switch to Analysis” is checked, Vinci Experiment and Instrument Control will automatically switch to Vinci-Analysis after the acquisition of a data set. PC1 User Manual Chapter 2 Step 7: Data acquisition Please see chapter 4 of this manual and section 3 of the Vinci reference manual for more detailed information how to acquire data on PC1. Step 8: Displaying the spectral data An Experiment File will open automatically in Vinci Analysis if “Automatically switch to Analysis” is checked under “Global Settings” (see Step 7 above). Otherwise, select “File”->”open” to load the data file in Vinci Analysis. Data files can also be opened with Excel spreadsheet. See section 12.4 of the Vinci reference manual. Step 9: Instrument shut down. Before shutting down the instrument, exit Vinci-Experiment and Instrument Control and turn off PC1. Set the lamp current back to 10A. Let the lamp cool down for 10 minutes before turning off the lamp power supply. Note: It is important to exit Vinci before shutting down your PC1. Vinci will reset all motors to its initial position when it is closed. You will hear motor sounds upon exciting Vinci. Switching off your PC1 before exciting Vinci may cause a program crash and leave all motors in false position. Note: Should a system crash e.g. during a power failure, the motors are not reset to their default position. During the next startup the shutters and polarizer will be put in startup position. The monochromators will be at the position when the instrument had crashed, calibrate the monochromator settings in Vinci according to the monochromator dial reading (See step 5). Please feel free to contact ISS customer support via telephone (217)-359-8681, Fax (217)-359-7879 or e-mail [email protected] for help. PC1 User Manual PC1 User Manual Chapter 3 Chapter 3: Acquiring Fluorescence Data PC1 User Manual 23 Chapter 3 3.1 Introduction Fluorescence detection is very sensitive but unfortunately very sensitive to impurities. Most interference either comes from solvents or buffers that are used or from improper cuvette handling. It is a good practice to make control experiments and check the emission properties of each and every component used in an experiment. If one component shows substantial fluorescence, background fluorescence subtraction methods provided in the software could be applied to correct these. A similar correction may be required to eliminate the influence of scattered light, elastic (Rayleigh, first or second order) or inelastic (Raman scatter from water) from the recorded spectra. Elimination of scattered light and the selection of proper excitation and emission filters is even more critical in polarization/anisotropy experiments. Every user of this instrument should familiarize herself/himself with the basics of optical spectroscopy in the ultra violet (UV), visible (VIS) and Near Infra Red (NIR) region. This section describes some experimental details of acquiring good fluorescence data with PC1. 3.2 3.2.1 Experimental Details Cuvettes a) Selection of Cuvettes: Plastic, Glass or Quartz For routine fluorescence measurements, plastic or glass cuvettes should suffice and they are less expensive than quartz cuvettes. There are two types of plastic cuvettes. Polystyrene cuvettes are good for the measurement between 340 and 800 nm. UV-grade methacrylate cuvettes are good for the measurement between 285 and 800 nm. However, plastic cuvettes may not be good for polarization measurements. It is always advised to compare the results obtained in a plastic cuvette with those from a glass cuvette. Plastic cuvettes cannot be used to measure fluorescent samples dissolved in toluene, chloroform and some other organic solvents. For best experimental results, good quality quartz cuvettes with the lowest possible fluorescence background should be selected. Deep UV transmitting cuvettes (Suprasil/Herasil) are available to help minimize luminescence background from the cuvettes. A quick test can be performed to check what type of cuvette material is at hand: glass or quartz. A white business card is placed into 280 nm excitation light path. The spot, which is hit by the light beam appears bright violet to the eye. Now place the cuvette of unknown material in the optical path, between the business card and the excitation monochromator. If the fluorescence intensity of the business card does not noticeably change, the cuvette is most likely made out of UV transmitting quartz or fused silica material. For low-temperature, liquid nitrogen measurements special thick-walled cuvettes have to be used. Standard room temperature cuvettes cannot withstand such low temperatures. b)b) Cuvette Size and Shape Selection Formatted: Bullets and Numbering When large sample quantities are readily available, 10 x 10 mm optical path cuvettes can be used. Outside dimensions for this type of cuvette are ½ x ½ inch. For smaller sample volumes 10 x 3, 10 x 2, 10 x 1, 5 x 5 or 3 x 3 mm optical path cuvettes can be selected. Thick walled cuvettes may scatter excitation light more due to the extra invisible microscopic inclusions like air bubbles. Special holders are available or can be made to order. These special holders have observation windows that prevent illumination of the cuvette walls, which may otherwise generate a large scatter background signal. PC1 User Manual 24 Chapter 3 One should also be aware of the placement of a 10 x 2 mm cuvette in the optical path. When a 10x2 mm cuvette is inserted, the 10 mm optical path pointing to the excitation source and with the variable iris fully open, the excitation light may hit the cuvette walls. This could generate a large amount of scattered light and could in particular be problematic for polarization measurements. Polarization readings may be off when the focused excitation light scatters from the cuvette walls. The arrow in the figure 3.2-1 indicates the direction of the incoming excitation beam. Figure 3.2-1 Cross Sections for Commercially Available Cuvettes Highly scattering samples can be placed in 10 x 1 mm cuvettes or in front surface triangular cuvettes, although the 45-degree angle of the front face will scatter all excitation light into the detector. The beam of the excitation light is centered 14 mm above the bottom of the cuvette. The meniscus of the cuvette solution should be clearly above the excitation beam. Inserted magnetic stirrers, preferentially Teflon coated, should also not obstruct the illumination beam. The minimum filling volume is about 1.5 ml for standard cuvettes. Figure 3.2-2 Various Types of Commercially Available Cuvettes For anaerobic work it is recommended to use stop-cock cuvettes. They can be tightly closed after filling the cuvette with inert gas such as nitrogen. These cuvettes keep their controlled atmosphere for many hours to days. A sample compartment extension is available. PC1 User Manual 25 Chapter 3 Square Teflon caps or Teflon stoppers are also commercially available. They prevent dust or bacteria from entering the solution. Figure 3.2-2 provides examples of commercially available cuvette types. c)c) Cuvette Preparation and Storage Formatted: Bullets and Numbering Clean a cuvette when necessary. Use soft cotton Q-tips, hot water and soap or a cuvette cleaner. Rinse thoroughly. Quartz and glass cuvettes when not in use are best stored overnight in 1020% nitric acid. Before use, rinse the cuvettes with distilled water, buffer or other appropriate fluids. More information can be found in the tests section about expected water quality necessary to perform proper background-free experiments. d)d) Cuvette Handling Formatted: Bullets and Numbering Never handle the cuvettes in such a way that fingerprints contaminate the outside cuvette walls. The optical axis for your instrument is 14 mm above the bottom of the cuvette. Do not touch this area. Fingerprint fluorescence could create a high luminescence background. Work above a table surface, to prevent damage in case the cuvette drops. Place an open rubber mat in the sink and on the floor in front of the instrument. WARNING: NEVER FILL A TEFLON- STOPPERED CUVETTE TO THE TOP WITH NO AIRSPACE LEFT. YOU MAY DESTROY THE CUVETTE ON TRYING TO STOPPER IT. Liquids have a very low compressibility and pressing the Teflon stopper in the cuvette could destroy a cuvette. The same applies to triangular quantum counter cuvettes. 3.2.23.2.2 Handling of Chemicals Formatted: Bullets and Numbering Apart from the precautions on the label, materials stored in a cold room or freezer should be warmed up before opening the bottle. Otherwise air moisture will collect in the opened bottle. 3.2.33.2.3 Buffer Solutions and Background Fluorescence Formatted: Bullets and Numbering Buffer solutions stored in a refrigerator should be warmed-up, before they are used in room temperature experiments. Polarization measurements are very sensitive to solvent viscosity. Check unknown buffer solutions for fluorescence background. Some buffers show a very high background (Fig 2.2.3). Automatic background subtraction procedures are provided in the software and can be used to eliminate the contribution of the buffer solution to the measured emission intensity. Avoid dust particles in the solution. Do NOT store water or buffer in plastic bottles unless it is clear from experiments that no emission background is generated by plasticizers leaching into the solvent over time. Parafilm dissolves in several solvents. PC1 User Manual 26 Chapter 3 Figure 3.2-3 Example of a contaminated buffer solution: MOPS pH 7.3. One can see obvious fluorescence from buffer solution. The Raman line of water is clearly visible above the low background. 3.2.43.2.4 Transparent Liquid Samples Formatted: Bullets and Numbering a)a) Filling a Cuvette, Magnetic Stirring and Small Sample Volumes Formatted: Bullets and Numbering Sometimes the solvent meniscus is so low that the excitation beam, centered at 14 mm from the bottom of the cuvette is exactly at the same level. Use a dentist mirror to check the height of the beam in regards to the solvent and if necessary change the position of the cuvette in regards to the beam or use a smaller cuvette size. Another obstruction can be formed by oversized magnetic stirrers or even small stirring bars when the cuvette is propped up. Figure 3.2-4 Cuvettes and Inner Filter Effects b)b) Optical Density Formatted: Bullets and Numbering Prepare a sample with an absorbance reading equal to an O.D. (Optical Density) of 0.05 to maximally 0.1/cm (Lambert-Beer law) at the anticipated excitation wavelength. Use a Spectrophotometer if necessary. One may be able to see the fluorescence by eye. Place the cuvette into the light beam. Check that the observed fluorescence is homogeneously emitted by the illuminated excitation volume (Figure 3.2-4). This avoids spectral distortion due to inner filter effects. PC1 User Manual 27 Chapter 3 3.2.53.2.5 Solid Samples Formatted: Bullets and Numbering a)a) Transparent Solid Samples Formatted: Bullets and Numbering They should be positioned in the available solid sample holders in such a way that the reflected light points away from the emission detector. Special holders are available that eliminate the possibility of detecting a background from the black anodized surface. b)b) Opaque and Highly Scattering Samples Formatted: Bullets and Numbering These opaque samples can be positioned such that the normal to the surface makes a 30 or 60 degree angle with respect to the incoming light. 45 degree insertion angles should be avoided, since the detector may receive very large amounts of reflected/scattered excitation light. For these samples front-surface accessories are available. Figure 3.2-5 Solid Sample Orientations 3.2.63.2.6 Sample Stability and Time-Dependent Phenomena Formatted: Bullets and Numbering Once samples have been prepared they may exhibit a variety of time dependent effects. One should be well aware of these effects. Table 3.2-1 Undesirable Time-Dependent Effects Process Time-Dependent Changes in Sample Intensity / Polarization Aggregation The observed signal decreases since a part of the molecules are quenched Attachment to cuvette walls Dilution by many orders of magnitude still gives a nice signal Bleaching Dissolved molecules suffer photon damage and are destroyed Cuvette dirty Fluorescence impurity such as Rhodamine release into newly prepared sample Fusion effects Folding / Unfolding/Denaturation Solvent evaporation PC1 User Manual Vesicles aggregate from 50 to 100 to 200 um over time. Vesicle curvature changes, influencing the observed fluorescence Intensity changes occur since a buried or exposed Tryptophan residue in a protein has a different quantum efficiency Sample concentration increases while volatile solvent such as ethanol evaporates 28 Chapter 3 Solvent temperature Undissolved compounds 3.2.73.2.7 Samples retrieved from a cold room warm up and show a changing fluorescence emission Example: p-terphenyl in ethanol has not completely dissolved. Small p-terphenyl particles continue dissolving continuously increasing the fluorescence. The particles while floating through the beam also increase the intensity noise (scattering). Selection of the Spectral Observation Window Formatted: Bullets and Numbering In choosing a method of wavelength selection for a particular experiment, you should have an idea about the general optical properties of the sample under study. Solutions usually exhibit a 50 – 100 nm wide emission spectrum, contrary to powdery samples, which often display 0.1-5 nm narrow spikes. When the sample is bright enough any spectral selection devices can be used. Otherwise a trade-off may exist between required minimum intensity for a proper Signal-to-Noise ratio and the desired spectral resolution. Table 3.2-2 Wavelength Selecting Devices for Optical Spectroscopy Wavelength Selecting Device Observed Intensity Transmitted Spectral Region Long pass Poor Absorption type Filter High Wide Band Better Short pass Poor Interference Filter Medium Medium Better Monochromator Low Small Still Better Double Monochromator Even lower Even Smaller Even Better Spectral Selection Glass or quartz substrate (for UV transmission) short and long pass filters are economical devices to pass or block excitation or emission light. Their transmission is usually very high (90% or better) beyond a certain wavelength. Wavelength discrimination is not as good as with interference filters or monochromators. Filters come in convenient shapes: e.g. two (2) inch square or 1 inch round. Optical filters can create undesired emission: filters may show autoluminescence or transmit outside the transmission bands as specified by the manufacturer. Always check this. Measure over the complete spectral region from UV to NIR the transmission of every filter used. At times even a monochromator is not sufficient and additional optical filters have to be used. This happens, for example, when second order excitation or emission peaks have to be removed. PC1 User Manual 29 Chapter 3 3.2.83.2.8 Absorption Type Optical Filters Formatted: Bullets and Numbering Typically this type of colored glass optical filter is classified with the wavelength for their 50% transmission intensity. Transmission of these filters increases from 0% to 95% in a sigmoid curve over a wavelength range of 40-60 nm. Other filters may exhibit several bands in which they transmit. Without additional filters unwanted light (second order excitation light for example) may reach the sample or detector. This can be disturbing when polarization data are taken and you are not aware of this effect. Other filters may exhibit several bands in which they transmit. Without additional filters unwanted light (second order excitation light for example) may reach the sample or detector. This can be disturbing when polarization data are taken and you are not aware of this effect. Figure 3.2-6 Transmission Curves for a Schott WG-345 (Left) and for a Corning 375 Optical Filter (Right) a)a) Polarization Effects in Absorption Type Optical Filters Formatted: Bullets and Numbering Transmission properties for tilted optical filters illuminated by vertical and horizontally polarized light are different due to Fresnel and Brewster effects. Therefore keep them straight up and vertically positioned in the supplied filter holders. b)b) Long Pass Filter: Elimination of Second Order Excitation Light Formatted: Bullets and Numbering If excitation wavelength is 300 nm, the region around 600 nm (2 x 300 nm exc. wavelength) nd shows the conspicuous presence of this 2 order band. A long pass filter is commonly used to prevent second order excitation light from reaching the emission channel detectors. c)c) Short Pass, Absorption Type Filter Formatted: Bullets and Numbering These filters may show auto-luminescence. Check this by holding the filter in the excitation beam. Select a filter with the lowest perceptible amount. Recorded spectra of weakly emitting, highly scattering samples may contain a substantial amount of autoluminescence signal. To remedy this, obtain filters with the lowest background, maximize the distance between sample and filter, increase the fluorophore concentration of the sample or use an interference filter. It is also advised to place an IR blocking filter between a filter which is in close proximity to a hot, infrared emitting light source like xenon. PC1 User Manual 30 Chapter 3 Figure 3.2-7 Choosing Excitation and Emission Filters Light source: Lamp, Excitation Monochromator with 2.0 mm slits (16 nm FWHM bandwidth). Excitation Slit Profile at 300 nm: 2 mm Exc. slits FWHM 16 nm EXC.: 300 nm Interference Filter/Long-Pass Absorption Type Excitation Filter Blocking the 2nd Order Excitation Light EM.: WG335 emission filter has a 50% Transmission at 335 nm. Long-Pass Absorption Type Optical Filter blocks Rayleigh Scattered Excitation Light (but not perfectly). 3.2.93.2.9 Interference Filters: Bandpass Filters Formatted: Bullets and Numbering Interference filters generally possess a better transmission than monochromators over the rather small bandpass they have been designed for. However, peak transmission for UV transmitting interference filters often drops to below 20 percent unless specially designed. Typically, commercially available bandpass values are 5, 10, 20 and 30- 50 nm. When tilted, the transmitted center wavelength changes and transmission properties for polarized light change. In nd the excitation channel they are used to eliminate 2 order light and possibly plasma lines emitted by laser light sources. When you set the excitation monochromator to zero order an interference filter in the excitation beam may transmit more light. On the emission side a higher transmission can be obtained as compared with a monochromator. Close to a hot lamp the shiny side of the interference filter should face the light source. 3.2.103.2.10 Monochromators Formatted: Bullets and Numbering Monochromators (mono - chroma, one-color: Greek) provide the best wavelength selection but lower transmitted intensity when compared with the above described filters. Monochromators have the best wavelength selectivity dependent upon the chosen grating. They exhibit a wavelength-dependent throughput, which is also polarization dependent. In addition higher order diffracted light is generated and may pass to the sample. PC1 User Manual 31 Chapter 3 Figure 3.2-8 Monochromator with Concave, Aberration Corrected Holographic Gratings A monochromator accepts incoming light and disperses it into the various colors of the spectrum. Rotation of the grating selects the color passing through the exit slit. The optics, grating and mirrors, image the entrance slit into the exit slit. Coupling optics, lenses, should not overfill the grating. This would increase the amount of scattered light inside the monochromator. Under filling the grating lowers the designed spectral resolution. The slit height is 8 mm. Various widths for the slits are available. a)a) Grating Blaze Wavelength Formatted: Bullets and Numbering By design the manufacturer can shift the peak spectral intensity throughput by adjusting the blaze angle for the grating. Gratings in the excitation channel are typically blazed at 250 nm to optimize UV excitation intensity. The emission grating is blazed at 450 nm and has its sensitivity optimized for a spectral region stretching from 200 - 800 nm. Gratings produced with holographic methods with 1200 grooves/mm provide very low straylight and ghost-free spectra. b) Aberration Corrected, Holographic, Concave Gratings Spectral impurities and ghost lines are minimized by the consistent use of holographic gratings. Intensity throughput is optimized by the concave shape of the gratings: they act as dispersive as well as focusing elements. This reduces the use of extra focusing lenses inside the monochromator. c) Wavelength Indicating Dial The wavelength (nm) passed through the slits can be read from the dials. d)d) Polarization Bias and g (rating) Factors Formatted: Bullets and Numbering Transmission properties for monochromators illuminated by vertical or horizontally polarized light are different. This is mainly caused by the grating and to some extent by other optical elements like mirrors inside the monochromator. This effect can be addressed in Vinci by entering a gfactor yourself or by measuring the "g-factor” using the excitation polarizers. One can also activate automatic correction of wavelength and slit width dependent transmitted intensity and polarization. PC1 User Manual 32 Chapter 3 T-format measurements: Make the optical paths for T-format polarization measurements as equal as possible, to keep the g-factor small. When you have an instrument with 3 detectors, you may place a neutral density filter with a proper emission filter in front of the emission monochromator set to zero-order “0” nm and equipped with 4 mm emission slits. Number of Monochromators in Use: The flexibility built into the instrument allows you to remove a monochromator temporarily to measure left and right intensities through an emission filter. You can also install a second emission monochromator on the left side of the instrument when the detection through monochromators is desirable. e) Elimination of Second or Higher Order Light: Order Filters Monochromators create higher order diffracted light. Proper excitation and emission filter selection will reduce or better eliminate their influence on the collected data. This phenomenon is readily observed for weakly emitting, highly quenched samples and also with highly scattering samples like vesicles, liposomes or powders, plastic or biological fibers. Higher order excitation light passes through the excitation monochromator. Use an interference or absorption-type long-pass blocking filter. Use a long-pass blocking filter to prevent higher order scattered excitation light from passing through the emission monochromator when necessary. An instructive example is shown in the figure below. A Quinine Sulphate Dihydrate (QSD) emission spectrum was collected through a 600 gr/mm grating. (The wavelength setting of the dial of such a monochromator grating has to be multiplied by two to be comparable with the dial readings of a standard 1200 gr/mm grating). Several orders show up in the scan: 3 spectra and 3 Rayleigh scattered excitation slit profiles. Next to this figure you see a more often encountered situation: an excitation scan at 295 nm, will give a second order peak at 2 x 295 nm: 590 nm. Care has been taken with additional neutral density filters in the excitation path not to saturate the emission detector. Figure 3.2-9 Higher Order Spectra: Quinine Sulphate Dihydrate Spectrum (Left) and Rayleigh Scattered Excitation Light Using a Very Diluted Glycogen Solution (Right) Eliminate these higher orders by inserting order blocking filters in excitation and/ or emission channels. PC1 User Manual 33 Chapter 3 Figure 3.2-10 Optical Filter Selection for Highly Scattering Samples 3.2.11 Slit width Selection for Excitation and Emission Monochromator In selecting a suitable slit width one has to realize that with 2 equally wide slits installed, the convoluted image profile is approximately a triangle and to a better approximation a Gaussian shaped profile. a) Slit Use and Spectral Line Profile Always use a pair of slits with the same width to prevent a shoulder-shaped distortion of narrow spectral lines. The slit profile can be calculated from a convolution of entrance and exit slit intensity profiles and approximates a Gaussian shape, further approximated with a triangle. The wider the slit is the higher the intensity, and the better the S/N. b) Slit Profile and FWHM Bandpass In selecting a suitable slit width one has to realize that with 2 equally wide slits installed the convoluted image profile is approximately a triangle (Slit Profile). The Full Width at Half Maximum (FWHM) describes the effective line profile width for an imaginary rectangular profile with the same area as the triangle. Slits can be exchanged to alter excitation intensity and spectral resolution: The smaller the slit the less light passes but the better the spectral resolution. For a set of chosen excitation and emission wavelengths, the slits used may create a partially overlapping excitation and emission. PC1 User Manual 34 Chapter 3 Figure 3.2-11 Illumination Intensity at the sample for Various Selected Slit Widths Select equal slits for the monochromator i.e. 1 and 1 mm or 2 and 2 mm for the entrance and exit slits of the excitation monochromator. The wider the slit the lower the spectral resolution but the more light enters the sample and the emission monochromator. c) Standard Slits The monochromators are standard equipped with fixed 2 mm, 1 mm, and 0.5 mm slits. Our standard monochromator has a dispersion 8 nm per mm. d) Additional Slits Narrower slits are available upon request. Narrower slits (mm) carry a smaller spectral bandpass (nm). The choice of slits to be used in a measurement depends on a number of experimental parameters. Start by running the lamp at 15 - 18 Amps and placing the 1 or 2 mm slits on the monochromators. Table 3.2-3 Available Monochromator Slits PC1 User Manual Monochromator H10 DH10 Slit Width (mm) Bandwidth (FWHM) (nm) Bandwidth (FWHM) (nm) 4 32 16 2 16 8 1 8 4 0.5 4 2 0.25 2 1 0.1 0.8 0.4 35 Chapter 3 3.3 Signal Level 3.3.1 Dark Signal Optimization Dark signal levels have to be such that a small signal is collected. Dark signals for a standard PC1 are shown at the bottom of Vinci Experiment and Instrument Control Screen. Dark signals are collected at a 10HZ rate and are usually in the order of 300-1500 with shutters closed. The signal from all three photomultiplier tubes is sent to three independent pre-amplifier discriminators. They are located under the right side of the optical bench labeled from left to right: REM, LEM, and EXC corresponding with the right emission, left emission, reference detector for the standard configuration. To adjust dark signal, set the PMT voltage control potentiometer to the maximum value, 10.0. Keep the lamp OFF. Make sure that all shutters are closed and no light can reach the detectors. Dark Level Settings (Counts/Sec) The dark pulses are created by electrons jumping from the valence into the conduction band inside the cathode and the dynode material. The amplification for the many dynode-originated pulses is smaller, they do not go through the complete amplification stage. These pulses will stay below the discriminator level and will not be counted. Trim potentiometers for setting the dark signal discriminator level for each detector channel (REM, LEM, EXC), are accessible from the outside of the instrument on the right side and should be adjusted only with the insulated screwdriver supplied for this purpose. A trimmer on each of the pre-amplifier discriminators regulates the level of the dark counts. The threshold of the discriminators increases by turning the screw clockwise (CW) and the dark counts decrease. A photon impinging onto the photocathode produces a pulse at the output of the PMT. Typically, the amplitude of pulses arising from noise is less than the amplitude of pulses generated by photons. This difference allows the instrument electronics to discriminate between the two types of pulses. The PMT output is passed through a pre-amplifier discriminator unit, which allows separation of pulses due to amplitude, which is determined by the threshold level setting. When the threshold of the discriminator is close to zero, all of the pulses (including the ones arising from noise) pass through the discriminator and are counted by the processing electronics. When the threshold of the discriminator is increased, only pulses that have amplitudes above the set voltage are passed through the discriminator and recorded. A typical curve of dark current counts versus the discriminator threshold level is displayed in Figure below. For convenience, the threshold level is reported as number of half turns of the potentiometer, which sets the voltage level on the discriminator. At the zero position of the potentiometer, the threshold level is 263mV and at position 25, the threshold level is equal to about 5 V. At positions of the potentiometer between 5 and 23, the number of dark counts is approximately constant. PC1 User Manual 36 Chapter 3 Figure 3.3-1 The plot displays the number of counts recorded against the value of the discriminator’s threshold. When the threshold is close to zero, a higher number of counts are recorded. As the threshold is increased, the number of counts decreases and it is almost stable at around 1000 counts per second (c/s). These counts represent the level of the dark current of the PMT. There are differences in the level of dark current at room temperature between different types of PMTs; the dark current varies widely also between PMTs of the same model. PMTs featuring a dark count level of about 100 c/s are commercially available. Manufacturers also specify the typical dark current level for a specific PMT. 3.3.2 Choose a Proper Signal Level Proper signal levels are very important for obtaining proper results in the Photon-Counting mode of operation. Signals should not be too low to give a poor Signal-to-Noise (S/N) ratio in Ratio Detector mode (R-mode) when scanning spectra. This specially relates to the reference detector. Saturation of any amplifier/discriminator channels should also be avoided. Even though PMT counts can go up to 5,000,000 counts/sec, the maximum signal level should be less than 1,000,000 counts/sec to get best linearity. The PMT reading will turn to red around 800,000 and warn you that you about to pass the linear range. Avoid at all cost severe overloading of the photomultiplier detectors and counting electronics. You may well observe a zero (0) signal, while in fact it could be extremely large. 1. Stabilization Time for Lamp and Photomultiplier Tubes: The lamp is usually stable after 10 minutes. The photomultiplier tubes take about three hours. This time can be longer if the temperature is changed in the meantime. For routine work, it is a good idea to keep the photomultiplier tubes on; in this way you only need to turn the lamp on, wait for ten minutes and start working. 2. Reference Channel Setting and Signal-To-Noise. Optimizing the Signal Level: Select a proper signal level for the experiment. Example: A signal of 10 counts above a dark signal of 50 cnts/sec will be very difficult to see. Photon noise is proportional to the square root of the detected photons. A signal 100 cnts/sec above the dark signal of 50 cnts/sec will show noise components related to the light signal, 10 cnts/sec, and the shot noise related dark signal. W ith signal levels of 1000 or even better 10,000 cnts/sec above the dark signal noise levels become just a few percent or less of the total signal. PC1 User Manual 37 Chapter 3 Spectral measurements can be taken in Ratio mode: i.e. emission detector signal re-normalized with the reference detector signal. A small reference detector signal creates a noisy emission spectrum even when the sample is very bright. Create a reference channel signal that is large enough to make the noise signal small. When the 2mm slits are utilized in the excitation monochromator, adjust the counts in the reference channel so that you will have about 50,000 counts/second. You can place some screens or neutral density filter on the filter holder to allow less light to pass through. It is important that you can work with the 2mm slits, if you need them, so that you capitalize on the full power of the 300W lamp. 3. Maximum Signal Levels and Prevention of Discriminator Saturation: Check the reference detector intensity for proper Signal-to-Noise (S/N) ratio. The signal should not overload the detector or photon-counting electronics (counts/sec. < 800,000) nor should the signal be too small (counts/sec < 10,000). Recommended signal levels for different channels are listed in table below. Table 3.3-1 Recommend Photon-counting Signal Levels Signal from Signal Levels (cnts/s) Upper Level 3.4 REM EXC LEM Right Emission Reference Left emission > Dark Signal 100 <1,000,000 > 10,000 <500,000 > Dark Signal 100 <1,000,000 Preparing a Quantum Counter Solution A quantum counter is used for steady-state experiments to correct for the lamp intensity fluctuations and for the wavelength dependent response of the reference photomultiplier detector. Quantum Counter A highly concentrated (saturated) solution of Rhodamine B (also called Rhodamine 610) in ethanol or in ethylene glycol (5-8 g/l) is a convenient quantum counter. This solution provides a signal of constant wavelength, proportional to the number of the incident photons. A red filter, RG-630, that isolates the Rhodamine emission above 610 nm is suggested. The RG-630 filter makes sure that the reference detector only sees red light. This red intensity is proportional to the incoming light: a quantum counter. Neutral density filters may be required to reduce the light intensity. For experiments in the region from 600 to 900 nm and above dyes like HITC may be used (see technical note on ISS website). Several quantum counter designs are in use and depicted below. It will be required to check periodically the fill level of the Teflon-stopper cuvette. The wide body design accepts a 2mm thick, 1inch round RG-630 optical filter. PC1 User Manual 38 Chapter 3 Figure 3.4-1 Wide Body Quantum Counter Cuvette Holder for 1 Inch Round Red Filter and Neutral Density Filters It is very important to use a triangular cuvette in the correct position (see Figure 3.4-1). When these conditions are not met the quantum counter and the instrument will not work properly. Examples of incorrect configurations The arrow indicates the direction of the path of the fluorescence photons. The left two configurations will not pass much light. The high concentration of the quantum counter solution prevents this. The right most orientation reflects all the excitation light directly to the reference detector, mostly bypassing the conversion to red light. Note: Check regularly if the rhodamine solution has dried up. To slow this process one can prepare a Rhodamine B stock solution in ethanol and add this solution to ethylene glycol to the proper concentration. Ethylene Glycol has a higher boiling point and therefore a slower rate of evaporation. Note: Lifetime measurements. The lifetime of Rhodamine B is about 3.9 nsec. in ethanol. This is too long for many shorter-lived components. Furthermore inner filter effects in this highly concentrated make the lifetime unreliable: Use the supplied Lshaped pinhole and copper screens to attenuate the intensity. Figure 3.4-2 Quantum Counter and Optical Configuration with 1-inch round RG-630 Filter This quantum counter requires a round 1 inch red RG-630 filter. PC1 User Manual 39 Chapter 3 3.5 Alignment of Reference Channel Signal Level Ensure lamp is on and current is greater than 15 Amps. Close the reference channel shutter, remove quantum counter from the reference channel. Move the excitation monochromator to 520 nm. Open the excitation shutter; place a business card in the light path. Adjust the position of the beam splitter until the light is in the center of reference channel. Put the quantum counter back. Open the reference channel shutter. The EXC channel reading should be greater than 10,000. If you do not see a signal stronger than dark signal, check if the quantum counter is properly mounted and placed in right direction. If signal is greater than 500,000, add screens to reduce intensity. The preferred reference signal range is 10,000-500,000. PC1 User Manual 40 Chapter 4 Chapter 4: Experiment Description PC1 User Manual 41 Chapter 4 4.1 Intensity Wavelength Scans 4.1.1 Emission and Excitation Spectra Spectra are acquired on the Monochromator emission channel. Please refer to section 5 of this manual for examples of emission and excitation spectra acquisition. Section 8.1.1 and 8.1.2 of Vinci manual reference manual give a detailed explanation of the experimental parameters. In a measurement of an emission spectrum the excitation wavelength is fixed and the emission monochromator scans the intensity at different wavelengths. For an excitation spectrum one scans the excitation monochromator and keeps the emission monochromator at a fixed wavelength. Examples of Spectral Data: Emission and excitation spectra of Rhodamine B in water. Figure 0-1 Excitation (blue): Emission Wavelength is fixed and Emission Spectrum (red): Excitation Wavelength is fixed. a) Selection of Optimum Excitation and Emission Wavelength From the measured absorption spectrum one can obtain the best excitation wavelength by choosing the wavelength close to the maximum of absorption. Occasionally samples cannot be diluted. If the optical density (OD) at the peak absorption wavelength is larger than about 0.10/cm, you may use a smaller dual optical path cuvette. You may also choose an alternative excitation wavelength near the peak absorption with a lower OD but reduced inner-filter effects. Take an excitation spectrum if the optimum excitation wavelength is unknown. When acquiring an emission spectrum the excitation monochromator is kept at a fixed wavelength while the emission monochromator scans. Start at least 10 nm above the excitation wavelength to avoid Rayleigh scattered excitation light (elastic scatter). Stop at a point where the fluorescence emission is weak (to longer wavelengths, to the red). If you see structure in the spectrum and you think that it can be further resolved, use 0.5 mm slits for the emission and excitation monochromators. When the signal is too weak and noisy, increase the intensity of the excitation light by increasing the current running through the lamp, 18A gives the best intensity stability. If the intensity is still not strong enough one can increase the slit widths. PC1 User Manual 42 Chapter 4 b) Trade-Offs You will encounter situations, where spectral information content has to be balanced with Signalto-Noise ratio / scan speed / stability of the sample: Spectral Information Optimum Intensity Resolution Signal-to-Noise Ratio Example: Ovalene emission spectra for 0.5, 1 and 2 mm slits. Wider slits lead to less spectral information, but the more light is detected the faster the measurement proceeds and the better the S/N ratio. Figure 4-2 Relative (left) and Normalized (right) Ovalene Spectra for 0.5, 1 and 2 mm Emission Slits c) Adjusting the Excitation Intensity Sample illumination intensity can be adjusted in several ways. The table below lists various possibilities. Depending on the experiment one or more methods can be applied. Table 4.1-1 Intensity Adjustment in Optical Spectroscopy Intensity Adjustment Method Reproducibility Means Lamp current Good Current indicating dial Excitation Monochromator Slits Good Marked slits Absorption Type Filter Good Known transmission Interference Filter Good Known transmission Neutral Density Filter Good Calibrated transmission Copper Screen(s) Not Good Excitation polarizer Good Iris Diaphragm Not Good Mesh position Always about 50% reduction (v) Lever position Focusing lens position adjustment Not Good Adjustment knob position PC1 User Manual 43 Chapter 4 d) Background Subtraction Background emission subtraction is feasible when a second cuvette with just the buffer or other blank solution is inserted in the R (reference) cuvette position in the sample compartment and the blank sample option in advanced options is checked. 4.1.2 Synchronous Luminescence Spectra Excitation and emission monochromators move at the same speed but one tracks the other by a given wavelength difference of 0.5, 1, 2, 3, 5, 10, 20 and 30 nm. For example with 12A lamp current and 0.5mm excitation and emission slits, see figure 4.1-3. The emission monochromator is set a few nanometers ahead of the excitation monochromator. A signal will appear in the region where the excitation and emission spectra of the fluorophores overlap. This technique is used extensively for analytical purposes: when you have a mixture of three or four or more components as is usually the case for oil-industry samples. The compounds can be recognized from the properties of the overlapping region of their excitation and emission spectra. The original spectrum taken with 280 nm excitation shows much less structure. Figure 4.1-3 Upper Curves: Synchronous Spectra of Clean 10W-40 Motor Oil. Zoomed in Intensity Scale (right). Lower Curve: Emission Spectrum of 10W-10 Motor Oil. Excitation Wavelength 280 nm and 0.5 mm Slits. 4.1.3 Excitation and Emission Matrices Although one can perform these measurements one after the other in their proper sequence it is far easier to run excitation and emission matrices, process and store all spectra. See VincI reference manual 8.1.3. PC1 User Manual 44 Chapter 4 4.2 4.2.1 Polarization Wavelength Scans Introduction: Polarization Measurements Slide the Glan-Thompson polarizer holders of both the excitation and emission channel into the optical path. Polarizer can be controlled by clicking on the icon on experiment control panel (See Vinci Reference Manual chapter 4.2.2). A certain amount of horizontally polarized intensity is necessary to measure the polarization bias of the emission channel (g-factor). a) Selection of Polarizer Before starting a measurement please check that each polarizer will rotate (excitation, left or right emission). Many instruments have a right emission monochromator. The left side is then usually equipped with a filter. This emission filter side usually provides much more intensity than the emission monochromator side. Monochromators do not pass as much light as most bandpass, cut-on, cut-off or interference filter. b) Elimination of Elastically Scattered (Rayleigh) Excitation Light Select proper emission filters. Scattered, vertically polarized, excitation light corrupts the VV intensity measurement. To test absorption- or interference-type emission filters use a cuvette filled with a glycogen scatter solution and check that the dark (emission shutter closed) detector intensity equals the shutter-open intensity. When no appropriate filter is available one may be able to change the chosen excitation or emission wavelength to a value, which does not cause problems. Be aware that also second order light passing through the excitation monochromator may have to be eliminated. This second order excitation can be found at 2 x excitation wavelength and shows the characteristic triangular shape of the slit profile. c) Elimination of In-elastically Scattered (Raman) Light One may select Raman notch filters or interference filters in emission to eliminate the Raman contribution to the spectral intensity. The strong Raman peak of water (a very common buffer medium) is always close to the excitation wavelength and is highest in the UV with 260, 280, and 295 nm excitation for DNA and protein experiments. PC1 User Manual 45 Chapter 4 309 328 397 Figure 4.2-1 Influence of Choice of Slit Widths and Excitation Wavelength on Raman Line Profile One can see that the choice of narrower excitation slits sharpens the Raman line profile considerably. When superimposed on a protein spectrum, a narrower Raman line is more distinct. For the widest excitation slits you can see that the Raman line superimposes with the red edge of the Rayleigh scattered excitation line profile. In the figure on the right you see that the distance of the Raman line to the excitation peak increases and the relative intensity decreases when the excitation wavelength is progressively chosen at 280, 295 and 350 nm. Note: For weak samples the replacement of 10x10 mm emission Glan-Thompson polarizers by 14x14 mm ones will result in a gain of a factor 2 in transmitted intensity. Note: The Raman band of water is found at approx. 3400 cm from the excitation wavelength expressed in wavenumbers. -1 d) Integration Time Select at least 10 integrations in signal averaging. This will guarantee a satisfactory S/N. e) Signal Intensity and Saturation Effects for Photon-Counting Electronics Signal levels for a selected lamp intensity and slit combination may be saturating one or more of the four measured polarization intensities, but typically Ivv. Use narrower slits, a reduced lamp intensity, a 10% or 1% neutral density filter in excitation or close partially the iris diaphragm behind the sample compartment to verify that the polarization and anisotropy data keep the same value. f) Sample Temperature The rotation of molecules and the rate of chemical association / dissociation reactions etc. is very sensitive to the sample temperature. Please use a bath with firmly attached, short and wellinsulated hoses. PC1 User Manual 46 Chapter 4 4.2.2 Polarization (Anisotropy) Spectra A polarization spectrum requires the acquisition of four different excitation spectra at each wavelength. Each spectrum is obtained with the excitation and emission polarizers oriented differently and it is separately stored. Four spectra are obtained with the excitation-emission polarizer orientations: HH, HV, VV, VH; H = Horizontal, V = Vertical. a) Polarizer Principal Axis The polarizer principal axis is vertical when the set screw of the polarizer holder points upward. b) Grating (g) Factor for an Emission Channel g-factor: Correction for Emission Channel Polarization Bias HH and HV determine the g-factor: g = Ihv / Ihh , for the emission channel. This factor depends on the emission wavelength, the slit width and the detector characteristics in the spectral regions where the instrument parameters are not wavelength independent. c) Automatic Calculation of Excitation Polarization Spectra The excitation polarization spectrum can be automatically calculated by Vinci after the data acquisition. Please see the Vinci software manual for more information. 4.3 Single point Intensity, Polarization, Ratio Measurement Single point measurements measure the intensity, polarization, and ratio at a specific condition continuously or manually. Background emission subtraction is feasible when a second cuvette with just the buffer or blank solution is inserted in the R(reference) cuvette position in the sample compartment. The integration time is selected as a multiple of the time-base (0.1s). The measurement of the next data-point starts after the measurement time (time-base x integrations) for the last data-point has elapsed. Single point measurements can also be user initiated if “Manual Advance” is checked. Between these measurements the excitation shutter may be closed to minimize sample bleaching by selecting the parameter minimal exposure to light in advanced parameters. 4.3.1 Single Point Intensity: Single, Fixed Wavelength This option repeats the measurement of a sample under the same condition. 4.3.2 Polarization Single, Fixed Wavelength a) Polarization (Anisotropy) Data Taken at a Fixed Wavelength The measurement of polarization at fixed wavelengths is straightforward once the proper filters, slits and temperature have been selected. Read the introduction in 4.2 about polarization spectra. The same considerations apply in obtaining the correct optical conditions. PC1 User Manual 47 Chapter 4 b) L-Format and T-Format Optical Geometry Polarization measurements can be acquired using two different configurations: the L-format and the T-format. T-Format measurements will reduce the total data collection time by a factor of 2. Left and Right emission channel optical conditions should be as similar as possible for T-Format data collection. Conditions where the left emission side (filter) is 100x brighter as the right emission monochromator side should be avoided. The g-factor will be large, making the results sensitive and inaccurate. You may opt to use “0” order and neutral density filters to equalize signal levels. The software has to be set to the specific configuration chosen for the measurements. 1. L-format Configuration One light detector is present on the reference channel and the other detector collects the fluorescence from one of the two emission channels (usually the one without the monochromator). We suggest using the filter channel because transmission through a filter is usually higher than transmission through a monochromator. In the L-format configuration, you need two polarizers, one for the excitation and one for the emission channel. G-factors are measured with the automated polarizers (or values for the gfactor are declared). Data are collected by rotating the polarizer in the emission channel to the (V) Vertical position and subsequently to the (H) Horizontal position. Data from the emission channel could be rationed with intensity from the reference channel. Note: Once again, please select proper emission filters. Scattered, vertically polarized excitation light may otherwise corrupt the VV measurement. 2. T-format Configuration When an instrument has only 2 detectors the photomultiplier tube that is usually placed in the reference channel is moved to the other emission channel. To prepare for a T-format measurement with three polarizer assemblies slide them in position, one for the excitation channel and one for each emission channel. The polarizers on the right and left emission channels are automatically set by the software to the (V) Vertical and (H) Horizontal positions respectively. In this configuration, the acquisition time of the measurement is cut in half. c) Polarization Measurement with Blank Subtraction When studying highly scattering samples, the polarization measurement will more likely be affected by scattered light. Select proper filters. Background introduced by the buffer solution hosting the fluorophore may be more strongly present. The PC1 Spectrofluorometer allows you to determine the polarization corrected for the influence of the buffer or blank solution. You need to prepare two cuvettes, one containing the buffer (blank) and the other containing the buffer with the fluorophore. Your PC1 Spectrofluorometer is equipped with a standard two-cuvette sample compartment. Place the cuvette with the fluorophore in the sample slot, S, and the one with the blank in the reference slot, R. Check Blank Sample in Advanced Options. During the measurement on the sample for each different orientation of the excitation and emission polarizers, HH, HV, VV, VH, blank corrected spectra are acquired and stored in the computer. Finally, the polarization value is calculated from the data obtained. PC1 User Manual 48 Chapter 4 4.3.3 Single Point Ratio Metric Measurement In this type of experiment the fluorescence intensity is measured at two fixed positions of the emission monochromator (with the excitation monochromator fixed) – emission ratiometric measurements - or at two, fixed position of the excitation monochromator (with the emission monochromator fixed) –excitation ratiometric measurements. 4.4 4.4.1 Intensity Time Slow Kinetics Routines for Changing Sample Conditions Bleaching of Fluorescein, for example, can readily be followed by this routine. A repeat measurement will be carried out for the time period set by selecting Experiment->Slow Kinetics>Intensity and setting up the start, stop and step time. Between the repeated measurements the excitation shutter may be closed to minimize sample bleaching. Example: DPH in model membrane systems. Background emission subtraction is feasible when a second cuvette with just the buffer or blank solution is inserted in the R (reference) cuvette position in the sample compartment Note: 4.5 4.5.1 If the step time is shorter than the Signal Average time the program will immediately continue with the next measurement. Polarization Time Slow Kinetics Routines: Changing Sample Characteristics or Conditions Binding of a dye to a protein or the unfolding and refolding of a protein, even the changes in observed polarization or anisotropy values caused by a release of the bound dye are monitored by this routine. For measuring slowly varying rotational effects the same considerations apply as for measurements monitoring the temporal behavior of the sample intensity. Naturally, do not forget to slide the polarizers in position. Check under the Acquisition panel whether the correct Lor T-format geometry has been chosen and whether the correct polarizer side has been selected. The software allows you to measure automatically the g-factor correcting the polarization bias or enter a g-factor by yourself. The time period is decide by start, stop and step time. Between the repeated measurements the excitation shutter may be closed to minimize sample bleaching. Note: If the step time is shorter than the Signal Average time the program will immediately continue with the next measurement. PC1 User Manual 49 Chapter 4 4.6 4.6.1 Intensity Concentration Slow Kinetics / Titration Measurements PC1 Spectrofluorimeter allows also measurement of the fluorescence intensity with time. The time scale can be varied from two milliseconds up to several hundred hours. A standard hardware configuration is used to set up this type of measurements: a light detector in the reference channel and a detector on either one of the emission channels (see Vinci Manual chapter 8.3 for more details). Note: A septum lid is available for repeated injection of aliquots. An automated titrator and software for use with the ISS PC1 Spectrofluorometer is available from ISS. See the next chapter for details. Note: For day long, repeatedly interrupted measurements one is advised to use the light source at 18A for best stability. When the observed effects are on the order of a few percent and in the same range as the light source stability, one can reference with the excitation intensity by checking “Ratio with Excitation” under “Advanced Options”. Titration Automation A computer-controlled titrator is available from ISS for use with the ISS line of fluorescence instrumentation (PC1 Photon-Counting Spectrofluorometer and K2 Multi-frequency Phase and Modulation Fluorometer). In a typical series of titration measurements, the operator measures fluorescence parameters (excitation and emission spectra, polarization, and/or kinetics) after adding a specified quantity of a titrant (solution) to the sample contained in the cuvette. Delivery of the titrant is automatically performed by the titrator at time intervals specified by the operator. For instance, a series of polarization measurements can be performed on a sample whose concentration changes (titrant is added) every sixty seconds. Details on setting up the device are provided in support manual for the titrator. 4.6.2 Fast Kinetics / Stopped-Flow Measurements For Kinetic studies with a resolution of a few milliseconds, an electronic trigger has to start the mixing of your substances and the data acquisition as well. Additional hardware (stopped-flow device) is required for this mode of operation. See the support manual describing installation of accessories for more details. 4.7 Intensity Concentration, pH, Pressure and Temperature This type of measurements can be automated with several available instrument upgrades: automatic microprocessor controlled refrigerated temperature controller, pressure generator and titrator. 4.7.1 Ratiometric Measurements Data are collected at two different emission wavelengths for a chosen excitation wavelength or two different excitation wavelengths for a chosen emission wavelength. This routine can be used for monitoring temperature and pH dependent effects or on fluorescent probes sensitive for example to calcium concentration. In order to get the correct numerical values one has to determine the relative system sensitivity at both chosen wavelengths. One can look these values up in the correction files or measure them for a given wavelength and slit width for example by comparing the measured and absolute data for Quinine Sulphate Dihydrate (QSD). PC1 User Manual 50 Chapter 4 PC1 User Manual 51 PC1 User Manual 52 Chapter 5 Chapter 5: Measurement Examples PC1 User Manual 53 Chapter 5 5.1 Measurement of the Emission Spectrum of Fluorescein In the measurement of an emission spectrum, the excitation wavelength is kept at a fixed value and the fluorescence intensity acquired over a defined wavelength range. 5.1.1 Fluorescein as a Standard Prepare a diluted fluorescein solution in HPLC water using sodium fluorescein. To avoid innerfilter effects the optical density of the solution should be less than 0.1/cm at the excitation wavelength. Do not touch the side of cuvette to avoid contamination. 5.1.2 Check the Signal Levels Place the cuvette in the sample compartment. Fluorescein emits around 514 nm and the excitation max is around 490 nm. Despite the strongest emission of Fluorescein will be obtained exciting the sample at 490 nm it is advised to excite it at a shorter wavelength (e.g. 460nm) in order to obtain the whole emission spectrum. The emission scan range should be from 480-600 nm. Set the lamp to 18 Amps, place slits of 1 mm in the excitation monochromator and 0.5 mm in the emission monochromator. Move excitation monochromator to 460 nm and emission monochromator to 520 nm. Open the diaphragm all the way. Open the excitation and right emission shutters. Make sure that the signal is below 1,000,000 counts/sec; if not, partially close the diaphragm in the excitation channel or place neutral density filters in the optical path to lower the signal. Higher intensities will give better signal to noise ratios. 5.1.3 Global Settings In Global Settings one can select the following options: a) selection of the output directory, b) saving a file automatically and c) selection of the correction file. It is suggested to choose “Save Experiment File Automatically” (name derived from title) and “Automatically Switch to Analysis”. Spectral correction is either done during the acquisition or subsequently on an acquired data set. 5.1.4 Data Acquisition For the acquisition of emission spectra, select Experiment -> Spectra -> Emission in Vinci Experiment and Instrument Control software. The following page will be displayed: PC1 User Manual 54 Chapter 5 Enter the parameters as shown above. For a detailed explanation of each parameter, see the Vinci Reference Manual Chapter 8. Note: To avoid scattered light from excitation, choose an emission wavelength that is at least 10-20 nm longer than excitation wavelength. Note: For most monochromators the second order peak is very strong. For example, if you excitation wavelength is 300 nm, you will see strong signal at 600 nm. Proper filters can be used to block second order peaks. The default number of iterations is 10. Each iteration takes 100 ms, 10 iterations will take 1 s in this case. If you want a faster scan rate, reduce the iterations which sometimes will decrease the quality of data. The minimum number of iterations is 3. Press the green start arrow to start data acquisition. Once the data acquisition starts, the Visualization window will display the data in real time. After the data acquisition is finished, the file will be automatically saved and opened in data analysis window (Figure below). Figure 5.1-1 Fluorescein Emission Spectrum. PC1 User Manual 55 Chapter 5 5.2 Measurement of the Excitation Spectra of Fluorescein In an excitation spectrum measurement, the emission wavelength is fixed and the fluorescence intensity is scanned over a range of excitation wavelengths. The excitation spectrum contains information of the relative excitation efficiency at different incident wavelengths. Because a xenon lamp produces different intensities at different wavelength, a quantum counter is used to correct for this variation of excitation intensities. The quantum counter provides a signal of constant wavelength proportional to the number of the incident photons. 5.2.1 Check Signal Level Prepare a diluted fluorescein/water solution (OD ~ 0.1). Fluorescein shows emission around 514 nm and excitation around 490 nm. To record the whole excitation spectrum, the emission wavelength is set to 530 nm. The excitation scan should be from 420 to 520 nm. Set the lamp to 18 Amps, place slits of 1 mm in the excitation monochromator and 0.5 mm in the emission monochromator. Move the excitation monochromator to 460 nm and emission monochromator to 520 nm. Open the diaphragm all the way. Open the excitation and right emission shutters. Make sure that the signal is below 1,000,000 counts/sec; if not, close the diaphragm in the excitation channel or place neutral density filters in the optical path to lower the signal. Higher intensities will give better signal-to-noise ratios. 5.2.2 Data Acquisition For the acquisition of the excitation spectra, select Experiment -> Spectra -> Excitation in VINCI Experiment and Instrument Control. The following page will be displayed: PC1 User Manual 56 Chapter 5 Enter the parameters as shown in the figure above. The emission wavelength is 530 nm and the excitation scan range is 420-520 nm. For a more detailed explanation of each parameter, see the VINCI Reference Manual Chapter 8. Note: To avoid effect of the scattering light, the emission wavelength should be at least 10-20 nm longer than the excitation wavelength. Note: For most monochromators the second order peak is very strong. For example, if your excitation wavelength is 300 nm, you will see a second order peak at 600 nm. Proper filters can be used to block second order peaks. The default number of iteration is 10. Because each iteration takes 100 ms, 10 iterations will take 1 sec. If one requires a faster scan, reduce the number of iterations which will sometimes decrease the quality of data. The minimum number of iterations is 3. Press the green start button to start data acquisition. Once data acquisition starts, the Visualization window will display real time data. After the acquisition is finished, the file will be automatically saved and opened in the data analysis window (see figure below). 5.3 How to Find the Excitation and Emission Maximum for an Unknown Sample There are several methods one can try: Use a UV hand lamp and excite solution or choose an excitation wavelength in the UV on the instrument and open the excitation shutter and look at the color of the emission in the cuvette. The color of the emission will provide a good hint where the maximum is. Guess an excitation wavelength first, then collect an emission spectrum and find out the emission max. Collect an excitation spectrum with the emission set at the emission max found previously to find the excitation max. It may take several tries to find out emission and excitation maxima. Use the synchronous method. Let the excitation and emission monochromators move at the same speed and track the other by a given wavelength difference, for example, 20, 50, 80 nm to find all possible emissions. Take an absorption spectrum of your sample to find out its absorption maximum, use the absorption maximum as excitation wavelength and collect an emission spectra to find out the emission maximum. PC1 User Manual 57 Chapter 5 5.4 Polarization (Anisotropy) Spectra For polarization or anisotropy measurements slide the polarizer holders of the excitation and emission channels into the optical path. Measurement of an (excitation) polarization spectrum requires the acquisition of four separate excitation spectra for each polarizer setting (IHH, IHV, IVV, IVH; H = Horizontal, V = Vertical). The position of a polarizer can be controlled by right clicking on the icon on the experiment control panel (See Vinci reference manual 4.2.2). Check the intensity for different polarizer settings. A certain amount of horizontally polarized intensity is required to measure the g-factor. Note: Select proper emission filters. Scattered vertically polarized excitation light may otherwise corrupt the IVV measurement. 5.4.1 L- Format Excitation Polarization Data from a Rhodamine B Block A brightly fluorescent solid sample, Rhodamine B embedded in a polymethylmethacrylate (PMMA) matrix is used to measure the four (4) spectral intensities, I hh, Ihv, Ivv, Ihv. Excitation Polarization Spectra Lamp Current Operation mode Detector Exc/Em Slits 18 A photoncounting right emission 1/0.5 mm Exc. scan 350-600 nm Em. fixed at Iterations 630 nm 20 Place the Rhodamine B block in the sample compartment, place a 550 nm long path filter in the emission light path. Slide the polarizer holders of the excitation and emission channels into the optical path. Set the lamp to 18 Amps, place slits of 1 mm in the excitation monochromator and 0.5 mm in the emission monochromator. Move the excitation monochromator to 562 nm and emission monochromator to 630 nm. Make sure that the reference and emission signals have good intensity at all polarization configurations. Select Experiment -> Spectra -> Excitation in VINCI Experiment and Instrument Control software (figure below) and enter the parameters listed in table above. Collect 4 different excitation spectra at VV, VH, HH and HV polarizer positions. PC1 User Manual 58 Chapter 5 Figure 5.4-1 Excitation Polarization Spectra Analysis In Vinci Analysis, select Spectral->Polarization Spectrum; a new window will be displayed, select the proper filename from the left side file browser and click select to add file (See Figure 5.4-1). Click OK after all four spectra are added. The software will calculate the polarization, P, and anisotropy, r, from these data. As shown in Figure 4.4-2, the anisotropy and polarization values for the rhodamine B block are close to 0.4 and 0.5 respectively, making this Rhodamine B PMMA block well-suited as a standard. P r Figure 5.4-2 Excitation Polarization and Anisotropy Spectra for Rhodamine B in a PMMA Matrix The Emission Wavelength was set at 630 nm. PC1 User Manual 59 Chapter 5 HH VV VH HV Figure 5.4-3 Excitation Spectra at VV, VH, HH and HV Polarizer Positions for Rhodamine B in a PMMA Matrix; The Emission Wavelength was set at 630 nm. PC1 User Manual 60 Chapter 6 Chapter 6: Instrument Performance Test PC1 User Manual 61 Chapter 6 It is recommended to regularly check the performance of your instrument. For the following tests the photomultiplier tubes should be equilibrated for at least three hours (with the shutters closed); the lamp should be stabilized for at least one hour. The signal on the reference photomultiplier tube should be between 10,000 counts and 500,000 counts per second. 6.1 Raman Spectrum of Water This is a test to check the steady-state performance of the instrument. In general it is not advisable to use a fluorophore as an absolute intensity standard as the intensity is influenced by the purity, quantum efficiency of a fluorophore, the buffer medium, temperature, pH of the buffer, presence of quenchers like oxygen or impurities, lamp intensity, slits, beam splitters, polarizers, and optical filters. The Raman signal of water on the other hand is universally applicable in that it is an inelastic scattering phenomenon solely dependent on the incoming light intensity. 1. The instrument setup for collecting water Raman spectrum is listed in table below. Raman Spectrum of Water Lamp Current Operation mode Detector Exc/Em Slits Exc. Em. Start Em. Stop Em. Step Integ 18 A Photoncounting at RT right em 2/1 mm 350 nm 370 nm 450 nm 0.25 nm 1s 2. Fill a cuvette with HPLC water and place it in sample holder, then calibrate the monochromator reading in Vinci according to the reading of the dial. Keep iris open to get full intensity without saturating the PMT. This experiment can be automatically loaded from Vinci Experiment and Instrument Control software (figure below). Select “Diagnostics” from the main menu bar and then “Raman Water Emission”. The Raman spectrum of the O-H vibration of water has a maximum at 397 nm (the Raman peak of water is shifted 3,400 cm-1 from the Raleigh peak) upon excitation at 350 nm. PC1 User Manual 62 Chapter 6 6.1.1 Location of the Raman Band of Water For calculation of the position of the Raman line for a given excitation wavelength, convert the excitation wavelength from nm to cm-1. Example: excitation at 500 nm <=> 20,000 cm-1. Subtract 3,400 cm-1 and convert the result back to nm. Raman peaks are most intense for UV excitation. Alternatively the Raman peak of water can be derived from the plot under Spectral in Vinci: A table of the positions of the water Raman peak (figure below) is stored in Vinci Analysis, select “Spectral”, then “Position of Raman Resonance in Water”. Working in the UV typically requires the subtraction of the Raman scatter peak of Water from the measured DNA or protein spectrum. Note that the Raman peak intensity increases with shorter wavelength and the shift between the excitation and the Raman line becomes smaller. Figure 0-1 Raman Peak of Water at 397 nm for Excitation at 350 nm: Analog Mode of Operation (Right), Photon-Counting Mode of Operation (Left). The intensity of the spectrum is a function of the lamp intensity and the monochromator slit bandwidths. Figure 6.1-1 reports the Raman spectrum of water using photon-counting electronics and a 2 mm slit on the excitation monochromator and a 1 mm slit on the emission monochromator. The lamp current was set to 18 Amps on a 300 Watt Xenon lamp. PC1 User Manual 63 Chapter 6 6.1.2 Water Quality Problems Plasticizers, soap residues, fluorophores attached to the cuvette wall will influence the position of the observed Raman peak. Make sure the base line is approximately flat as a function of wavelength. Figure 0-2 Raman Spectrum of Water Contaminated with Fluorophores 6.2 Measurement of Signal to Noise (S/N) ratio Measuring the Signal to Noise Ratio (S/N) using the Raman peak allows us to observe the intensity throughput, detection ability of the emission channel and any malfunctioning that may deteriorate the performances of the instrument. This test has to be done on every channel that has an emission monochromator. 6.2.1 Set up 1. Ensure the lamp current is set to 18 Ampere. (Note: The lamp will need three minutes to stabilize after being powered to 18 Amperes) 2. Place 2.0 mm slits in the Excitation Monochromator. 3. Place 1.0 mm slits in the Emission Monochromator. 4. Ensure that the quartz cuvette is clean. 5. Transfer the HPLC water to the quartz cuvette. 6. Place the quartz cuvette into the sample position in the sample compartment. 7. Using the Vinci Acquisition Software go to the instrument control screen and ensure that the Sample 1 cuvette is in the light path. 6.2.2 Measurement of the Signal-Noise Ratio 1. 2. 3. 4. Click on “Diagnostics” In the Vinci acquisition software menu bar Load the experiment labeled Signal-Noise Ratio. Enter the serial number of the instrument to the end of the title. Click on the green start button. PC1 User Manual 64 Chapter 6 6.2.3 Calculation of Signal-to-Noise (S/N) ratio Vinci Analysis software will calculate the S/N ratio automatically from these values: 1. Under the Spectral menu, click on the Raman Signal/Noise Ratio item. 2. The software will report the Raman Signal Noise Ratio. Note: The S/N ratio should be greater than or equal to 1000. Typical S/N ratios achieved with PC1 are 1500 and higher using a new Xenon lamp. The S/N ratios will decrease as the lamp ages. Measurements can be done without any concern as long as the S/N level is above 500:1. 6.3 Intensity Stability Instrument stability tests allow us to see fluctuations in the signal caused from electronic noise, faulty components or poor connections. This test will allow us to isolate errors on individual detection channels or an overall error that affects the entire instrument. NOTE: This test should be run immediately after the signal to noise measurements is completed. If you need to run this test, run a signal test first and use the same set up for this procedure. 6.3.1 Set Up 1. Ensure the lamp current is set to 18 Ampere. Note: (The lamp will need three minutes to stabilize after its output is set to 18 Amperes) 2. Place 2.0 mm slits in the Excitation Monochromator. 3. Place 1.0 mm slits in the Emission Monochromator. 4. Ensure that the quartz cuvette is clean. 5. Transfer the HPLC water to the quartz cuvette. 6. Place the quartz cuvette into the sample position in the sample compartment. 7. Open the Experiment and Instrument control screen and ensure that the Sample cuvette is in the light path. Place OD= 3.0 neutral density filter into Left emission channel filter hanger. Place mesh filters close to the cuvette facing the left emission channel (not more than 2 filters). Place mesh filter screens or neutral density filer in Reference channel filter hanger. Manually slowly open Reference Channel Shutter while observing counts in the Vinci software. The counts should be between 100,000 and 200,000 counts per second; if not, add or remove screens to adjust this level. WARNING: Make sure that the Reference Channel Shutter is closed when changing filters. 6.3.2 Measurement In the Vinci Acquisition Software menu bar click on “Diagnostics” Load the experiment labeled Stability Test Enter the serial number of the instrument to the end of the title. Press the Green start arrow. The following window will open and the data will be acquired as displayed in the Figure below. PC1 User Manual 65 Chapter 6 Figure 6.3-1 Intensity Stability Measurement 6.3.3 Analysis Open the Intensity Stability Plot in Vinci Analysis. For each excitation, emission channel: Click on the σ symbol. Click on a data plot and record the average intensity and standard deviation, SD. Divide the SD by the average. Perform this procedure for all other data sets. 1. 2. 3. 4. Note: The SD/Average should be less than 1%. 6.4 Polarization Performance Test This test is designed to check the correct operation of the polarizers 6.4.1 Set Up Steady-State Polarization Measurement on a glycogen solution Lamp Current Operation mode Detector Exc/Em Slits 18 A photoncounting either right or left emission 2/1 mm 1. 2. 3. 4. Target: >0.99 Exc. fixed at comment Iterations 350 nm diaphragm on excitation channel is partially closed 10 Set the Lamp Current to 18 Amps. Place 2.0 mm slits in the Excitation Monochromator. Place 1.0 slits in the Emission Monochromator. Ensure that the quartz cuvette is clean. Prepare a 2 ml glycogen solution (glycogen in HPLC water). Just a 1/32 inch fill of the tip of a Pasteur pipette in 2 ml water will do. Be sure that the water quality you use is good with no fluorophores or plasticizers present. Place the cuvette in the S position of the 2-cuvette holder. PC1 User Manual 66 Chapter 6 5. 6. 7. 8. Ensure that all polarizer holders contain a Glan-Thompson polarizer. Slide the excitation and emission polarizers in position. Open the iris diaphragm in the excitation channel. Insert a O.D = 3.0 Neutral density filter in the left emission filter holder Note: This is used to reduce the intensity of the light reaching the left emission detector. The left emission channel is typically not equipped with an emission monochromator. Signals, even for this weakly scattering glycogen solution, may cause the left emission detection electronics to saturate. Use 10% or 1% neutral density filters to attenuate the excitation light. Keep the filters in an upright position. Adjust the iris diaphragm when no neutral density filters or copper attenuation screens are at hand. Adjust the glycogen concentration (lower it) to eliminate multiple scattering effects. Note: Keep the signal (number of counts/ second) below 300,000 for Ivv (VerticalVertical). 6.4.2 L-Format Polarization Data from a Glycogen Solution Procedure: 1. 2. 3. 4. In the Vinci Experiment and Instrument control menu click on Diagnostics. In the drop down menu locate and click on the heading labeled Polarization Tests. Load the experiment labeled LEM Polarization Test. Enter the title and press the Green start button. Analysis: In Vinci Analysis: 1. 2. 3. 4. Open the polarization data. Click on the “Show Markers” icon and select a region of the plot. Click on the σ symbol and the Y average value is the average polarization value. Repeat the experiment for the LEM and in T format, if applicable. You should obtain an average polarization value close to 1.000 (a value of 0.990 is acceptable, a higher value is better). If values are not within range the concentration of the scatter solution may have to be increased or decreased. PC1 User Manual 67 Chapter 6 Note: Be aware that saturation of the photon-counting signal, especially on the left emission channel will have an effect on the results. Use the following optical configuration to carry out these polarization measurements. Figure 6.4-1 Experimental Setup for Polarization Measurements through a Monochromator For polarization tests with a fluorophore higher order emissions may have to be blocked by additional excitation and emission filters. PC1 User Manual 68 Chapter 7: Calibration Procedures PC1 User Manual 69 Chapter 7 7.1 Monochromator Wavelength Calibration NOTE: This is not a software calibration comparing the monochromator dial reading to the software monochromator value. A monochromator dial may read a wrong wavelength. Example: 500 nm (green) light appears blue on white paper. Be sure there are no filters in the optical path. Check the mechanical maintenance and also the trouble-shooting section and see if any obvious mechanical malfunction (loose cylindrical motor shaft coupling) caused the dial to be off. Occasionally it happens that users attempt to rotate the wavelength dial manually while the monochromator stepper motor is engaged because the instrument is on. A warning light should appear. The end result is that the monochromator is out of calibration. Only when the stepper motors and automation are turned off should you rotate the dial by hand. This section will help you to check the calibration of the dial reading and to adjust it if necessary. To recalibrate the monochromator wavelength indicating dial, one has to do the following: 1. 2. 3. 4. 5. 7.2 Select a wavelength verification method below. Determine from the screen display how much off the dial readings are. Manually reset the monochromator dial. Use the monochromator calibration option to enter the new monochromator wavelength Take another spectrum and verify the proper settings. Monochromator Wavelength Calibration Methods For the wavelength calibration you need a well-defined, bright and sharp spectral feature. This can be the 632.8 nm line from a small He-Ne laser or any other line. Attenuate the light sufficiently to work under eye safe conditions. The sharp emission line of a small Hg calibration lamp can also be used, as well as a narrow interference filter or a sample with a stable, sharp line with a width of a few tenths of a nm (Ovalene in a solid PMMA matrix for example). Furthermore you may need some scattering material, e.g. glycogen, in a cuvette. 7.2.1 Method 1: Only One Monochromator is Off When only one monochromator dial is off, you can calibrate the other one by using 0.5 mm slits. Place a low concentration glycogen scatter solution in sample compartment. Set the lamp current at 18A. Scan the monochromator, which is off, around the setting of the correctly indicating monochromator. Example: Set the correctly indicating monochromator at 500 nm (green light) via right click on icon of correct monochromator, select “Move” and enter the target wavelength value 500 nm in Vinci instrument control panel. Scan the other monochromator to be calibrated from 480 to 520 nm. The position of the spectral peak will tell you the difference. Use 0.5 mm slits for both the excitation and emission monochromators to get an appropriate resolution. Be aware that you may observe a lower or higher order. In the figure below the emission monochromator was scanned between 480 and 520 nm. When the scan range is expanded also a peak is observed at 250 nm. Under similar conditions when you would use a 295 nm excitation line, a higher order peak shows up a 590 nm (2 x 295 nm). The accuracy of this method is within a few nm, since also grating aberrations have to be taken into account. PC1 User Manual 70 Chapter 7 Figure 7.1-1 Monochromator Wavelength Verification by Observing a Glycogen Scatter Peak 7.2.2 Method 2: Wavelength Calibration with Solid Ovalene Sample in PMMA Ovalene exhibits a sharp absorption maximum at 342 nm and an emission maximum at 482 nm. Insert the Ovalene sample in the S position of the turret. Excite at a wavelength around the excitation maximum of 342 nm where you have sufficient signal. Close the shutter to check dark signal levels. Scan the emission monochromator. Set the emission monochromator to the peak wavelength and readjust the wavelength reading. Ovalene Emission Spectrum Target: Em. Max @ 482 nm Lamp Current Operation mode Detector Exc/Em Slits Exc. fixed at Em. Start Em. Stop Em. Step Iterations 18 A photoncounting right emission 2/0.5 mm 342 nm 400 nm 550 nm 0.25 nm 10 Ovalene Emission Spectrum Target: Em. Max @ 342 nm Lamp Current Operation mode Detector Exc/Em Slits Em. fixed at Exc. Start Exc. Stop Exc. Step Iterations 18 A photoncounting or analog right emission 1/0.5 mm 482 nm 300 nm 400 nm 0.25 nm 10 With the emission monochromator calibrated, scan the excitation monochromator and calibrate it also. Note: A dial setting of 0.00 nm is called the zero order position. Aberrations may give a slightly different position for the narrowest slits. The zero-order light emanating from the monochromator looks very bright and white on a business card. Please protect the reference detectors by closing its shutter in advance. A business card placed in front of the sample cuvette position lets you check the excitation monochromator. The xenon lamp emits white light. If the light that hits the card is white the excitation monochromator is indeed set to zero order. Reset the monochromator to first order by scanning upward. Go in small wavelength increments of a few nm. PC1 User Manual 71 Chapter 7 Figure 7.2-2 Ovalene Excitation and Emission Spectrum Note: Occasionally you see that the grating driveshaft hits a limit. The dial reads e.g. 995 nm. The wavelength value is set to 0-800 nm in Vinci. Exit the program and turn the instrument off. Reset manually the wavelength dial, but only when the instrument power is OFF! to e.g. 500 nm. Restart the program. Select monochromator calibrate to re-enter the new wavelength position. Select a calibration method and proceed with the wavelength verification. 7.2.3 Method 3: Wavelength Calibration Using the Light from Fluorescent Tube Lamps Place a piece of paper in the S cuvette position with the sample compartment cover partially open. Adjust the emission slit size to 0.5 mm or smaller and record the spectrum. Spectrum is shown in Figure 7.2-3 below. Figure 7.2-3 Hg-Line Spectrum from Overhead Fluorescent Tube lamp PC1 User Manual 72 Chapter 7 7.2.4 Method 4: Wavelength Calibration with a Laser Line a) Emission Monochromator Position and center e.g., a He-Ne laser beam along the optical axis. Protect your eyes from laser light. Remove any optical filters, cuvettes. Use several neutral density filters to lower the intensity going to the right emission PMT detector. Shine the laser light from the left emission channel into the right emission channel. Scan the emission monochromator from -20 to +20 nm around 632.8 nm. When you find the laser peak, narrow the scan range, repeat the measurement. Determine the peak wavelength. The difference between the actual reading and 632.8 nm is the amount of adjustment to be made. Reset the dial and enter the number in monochromator calibration window. The emission monochromator is now calibrated. Check the new calibration once more by scanning through the He-Ne laser line. b) Excitation Monochromator Set the emission monochromator to the peak wavelength (632.8 nm). Close the left emission shutter to prevent any room light from entering the instrument. Place a cuvette with glycogen or similar scattering solution in the turret, S, position. Scan the excitation monochromator. Check whether any difference occurs between excitation monochromator dial setting and observed peak intensity. The monochromator is calibrated if the peak intensity coincides with 632.8 nm +/- 0.5 nm. 7.2.5 What to Do When the Wavelength Position Can Not Be Determined Turn the photomultiplier on the monochromator side off. Remove it. Turn the instrument off. Protect all detectors from excessive light levels: close shutters. Place a piece of paper in the sample compartment. Look through the monochromator slits towards the piece of paper. Use narrow slits, the narrower the better to lessen parallax effects. A faint color should be visible. Green light should match a 500 nm reading on the dial. A zero reading plus/minus a few nm should show you white light (the zero order). When you have convinced yourself that the wavelength dial is not several hundred nm off, proceed with any of the previous adjustment procedures. 7.2.6 Adjustment of the Monochromator Dial In case any of the previous wavelength verification methods show that the recorded peak does not correspond with the known source peak wavelength the monochromator dial on PC1 has to be reset as follows: Move the wavelength to any of the following wavelengths: 350, 450, 465, 550, or 650 nm. Pull the black plastic knob from the dial. Now you see that two (2) set screws at 90 degree angle are accessible from the top and the side. Loosen them but don’t lose them. Now the angular grating position is de-coupled from the wrongly reading dial. Push the brake to the right, block any dial rotation, while you pull the dial forward but not off the grating driving shaft. WARNING: Older dials may lose the very tiny Teflon brake shoes when you pull the dial off the shaft. Place a piece of paper under the dial. This prevents small set screws and Teflon brake shoes on older model dials to accumulate in the holes of a laser table. 1. Unlock the dial. Readjust the dial reading. When the calibration peak was too low, move the dial wavelength up. 2. Lock the dial rotation again. PC1 User Manual 73 Chapter 7 3. Slip it back on the shaft. Hold a folded piece of paper between the monochromator body and the back of the dial. This paper spacer prevents the dial gear to receive any friction from the monochromator wall. 4. Now fasten both screws again. Unlock the dial. 5. Calibrate reading in Vinci according to monochromator dial. 6. Take another wavelength calibration spectrum. Note: 7.3 A very firmly tightened setscrew can create a burr on the shaft. A small screwdriver helps to get the dial off the shaft. Fine sandpaper can be used to smooth the shaft surface. Spectral Correction Files Spectral data are influenced by the wavelength and polarization dependent transmission and sensitivity of the monochromators. Inserted slit widths as well as the presence and orientation of emission polarizers in the optical path, as well as tilted optical surfaces also influence the spectral data. Without the applied corrections only technical spectra, that are partially corrected for e.g. light intensity fluctuations are collected. In order to compare spectra measured on different instruments they have to be corrected for instrument response during (real-time) or after the measurements. When completely corrected they are called absolute spectra. Absolute spectra should be identical within error to nationally derived standards. These standards carry an accuracy of 2-5%. There are 2 ways to correct these spectra: a) Automatic real-time division with the proper wavelength dependent correction factors or b) correction of the acquired spectra by subsequent process of the collected technical spectra. 7.3.1 Automatic Real-time Multiplication Select Setting->Global Setting, check “Apply emission path correction File”, the following file list is displayed: Upon selecting the proper correction file for your experimental set up the correction will be automatically applied to the emission spectrum during data acquisition. PC1 User Manual 74 Chapter 7 7.3.2 Spectral Correction after Acquisition A technical spectrum acquired without correction, can successively be corrected using this routine and the correction files stored in Vinci. After opening the spectrum in Vinci Analysis, select Spectral->Correct Spectrum and a list of correction files stored in Vinci will be displayed; select the file corresponding to your experimental conditions utilized in the experiment to obtain the corrected spectrum. 7.3.3 Correction Files Provided by Vinci Correction files are acquired at ISS periodically and stored in the Vinci software. A spectral irradiance standard lamp (The Eppley Laboratory, Inc. or Oriel) is used to determine the response of the detection system. The files are specific to the type of monochromator and photomultiplier tube utilized in an instrument configuration; the correction is also a function of the slit bandwidth used in the monochromator and to the plane of polarization of the light collected. Each file is acquired for at lest three bandwidths: 4 nm, 8 nm, and 16 nm and different polarizator positions. These correction files are saved under folder C:\Documents and Settings\All Users\Application Data\ISS\Vinci\Corrections. Examples of correction curves are shown in figure below. Figure 7.3-1 Typical Correction Curves: Unpolarized (left). Vertically Polarized 1 mm emission slits (right). Even without using the correction files the estimated systematic errors for the emission maxima positions are below 5 %. The correction files that are stored in Vinci apply only to ISS instruments equipped with monochromators models H-10 and H-1061. If any other monochromator is used, please contact ISS for obtaining the relevant corrections files. 7.3.4 Generating your Own Emission Spectra Correction Curves/Files In order to generate the correction curves the measured response curve on PC1 is divided by the absolute emission curve supplied with a spectral calibration lamp or solid or liquid calibration material. The resulting file that includes the correction factor for each wavelength is called the correction file. Once activated, each measured curve can be divided with these correction file yielding a corrected spectrum. PC1 User Manual 75 Chapter 7 Several methods exist to calibrate the wavelength dependent response of a fluorometer: Spectral calibration lamp. This is an expensive and cumbersome method. Absolute curves supplied with the lamp do not include aging effects or the care taken to avoid local temperature differences and reflections from the lamp envelope and surroundings. These systematic errors make this method far less ideal than it might seem at first sight. The big advantage in principle is that a calibration lamp covers the largest spectral region of interest from the UV to the infrared. Solutions of Tryptophan and Quinine Sulfate Dihydrate or phosphorescent solids with known spectral response and approved by NIST, Gaithersburg, VA. These secondary standards derive their value from the fact that they are far less expensive and much easier to implement. The disadvantage is the usually limited spectral region each of them can cover. More than one sample is often required to cove the whole wavelength range. Procedure: 1. Determine the spectral range and step size for data collection by inspecting the absolute spectral data. 2. Open a new data file for your data. Make sure you do not saturate the electronics. 3. Collect the data three (3) times with a very good signal-to-noise ratio and use a quantum counter. Write down the experimental conditions like lamp intensity, position of polarizers, slit widths used etc. Polarizer in Emission Path No emission polarizer, N Vertical, V Horizontal, H 7.3.5 2 2 2 Emission Slits (mm) 1 1 1 0.5 0.5 0.5 Correction for Lamp Intensity Fluctuations Spectra are automatically corrected for intensity fluctuations of the light source when “Ratio with Excitation” is selected in the measurement set up screen: the emission channel signal intensity is corrected using the reference detector constantly monitoring the light source intensity. See the section 8.1.1.1 of Vinci manual for more information about the Ratio mode. Light source intensity fluctuations are monitored via the reference detector. The output of the emission detector is ratioed and renormalized with the signal from the reference photomultiplier detector (PMT). The ratio-mode acquisition is selected from the setup menu and provides a value, which is independent of any changes in light source intensity. Both reference and sample signals should have sufficient intensity to give a good signal-to-noise value. When the reference signal is very small, the ratio will show the statistical fluctuations of the reference signal notwithstanding a very stable sample signal. In this way spectra will be PC1 User Manual 76 Chapter 7 corrected for distortions introduced by the lamp spectrum but not for the noisy response of the Reference PMT. Fluctuations in the photon signals are proportional to the square root of the observed number of counts/sec. Example: A signal of 100 +/-10 counts/sec has a 10% variation, a signal of 10,000 +/- 100 counts/sec a variation of 1%. The peak of a spectrum should therefore have a slightly higher noise level as compared to the background signal far away from the emission peak. 7.3.6 Corrections for Reference PMT Wavelength Dependent Response To obtain a fully corrected emission spectrum, the Reference PMT must have a response, which is directly proportional to the quantum intensity of the incident beam irradiating the sample. This is achieved using a quantum counter with a red filter and additional neutral density filters to attenuate the light going to the reference detector. 7.3.7 Correction of Excitation Spectra The correction of the excitation spectrum is automatically obtained by using a quantum counter in the Reference channel. After passing through the excitation monochromator, a part of the incident light beam is diverted by a beam splitter in the reference channel and detected by the PMT. The signal detected by the PMT in the emission channel is ratioed with the signal in the reference PMT thereby correcting the intensity with the lamp profile. PC1 User Manual 77 Chapter 8 PC1 User Manual 78 Chapter 8 Chapter 8: Maintenance of the Instrument PC1 User Manual 79 Chapter 8 8.1 Mechanical Components Instrument Covers Loosened cover screws should be reattached whenever they are noticed. Lamp Fan and Fan Protection on Lamp Power Supply Inspect these parts twice a year. Clicking sounds indicate a bad ball bearing. Initial clicking sounds which disappear after a few minutes may be caused by a piece of paper insulation that sticks out too much and touches the fan blades. The paper warms up and bends away from the fan blades in a few minutes typically. Check for dust accumulation. Monochromators Inspect once every 3-5 years for dry grease on the drive shaft and accumulated ground down material. Remove crud buildup with a cotton tip from the grooves. Apply new axle grease thinly. Manually move the rider back and forth a couple of times to distribute the grease evenly. Only with the instrument off, rotate a dial by hand. Otherwise the dial will lose its proper wavelength indication and you may have to perform calibration. You may feel that the monochromator dial is hard to rotate or may have a rotation spot after several years of use. The dial might then have to be replaced. With the instrument on, a dial may feel to have no friction whatsoever. The cylinder bushing connecting the motor shaft and the grating shaft has 2 set screws. One or both may be loose. Rotate the cylinder bushing until you can reach both set screws. Take a good flat tipped screwdriver (the small set screws may otherwise strip) and fasten them. Figure 8.1-1 Monochromator Stepper Motor and Grating Coupling Polarizers Inspect once a year for missing stop pins. The polarizers should move each time all the way against the stop. Manual rotation should feel smooth and easy. Tough rotation may require pushing the brass pieces apart a bit more, pushing the stepper motor gear a bit back, cleaning the inside of brass plates around the round polarizer holder. Shutters Shutters should open all the way. Inspect them once a year. In case they have the tendency to fall open, specially the excitation shutter, contact ISS support for assistance. Stirrers Magnets should spin at a speed setting of 7.0 on the stirrer potentiometer. This dial is located on the front panel of the sample compartment. Set the stirrer speed dial to 7 or 9. Turn each stirrer ON and OFF by clicking on stirrer icon in Vinci Instrument Control panel. When you do not hear both or either one of them, set them both to OFF. Recalibrate the stirrer motion to off by right click on stirrer icon and select Calibrate. Test the stirrer operation again. The turret will have to PC1 User Manual 80 Chapter 8 be refurbished with new diodes or stirrer motors if they still do not rotate. Also check that the stirrer connectors are attached to the stirrer or stirrer/RTD card. Turret Inspect this part of the instrument once a year. Rotation should be all the way against the stop(s). Drive belts should be inspected once a year. Remove the 4 front screws on the turret assembly and possibly 2 screws next to the can, located roughly under the emission lens holders inside the sample compartment. Slide the turret assembly partially out and shine a flashlight on the parts. Coolant hoses should be checked. Brittle ones should be replaced. Water-bath Check clogging of quick connectors as well as the condition of rubber or silicone hoses. Add a spoon of NaN3 (Sodium Azide) to prevent bacterial growth in the bath coolant. 8.1.1 Accessories External accessories come with their own manuals which will include procedure for maintaining the proper function of these accessories. 8.1.2 Motion Tests These tests are designed to check the functionality of the stepper motors and of the automation of the instrument. Upon selecting this feature, the window below is displayed and the user is requested to enter the duration time (in minutes) of the test. Please refer to the Vinci manual chapter 11.5 for further information. PC1 User Manual 81 Chapter 8 8.2 Electronic Components Although no special care is required for the electronic components of the instrument, you should refer to the various operator manuals. Computer Check regularly dust accumulation, fan operation, and check for viruses. Lamp Power Supply Clean the fan protection area from dust. BNC and Other Cables Check for broken insulation, worn connectors, lost labels. Have them replaced or repaired. PMT Housings The base of the PMT housings should be firmly attached to the optical base of the instrument. Tighten any loose screws. Check that the dials stop at 10.0 once a year. A very small setscrew is accessible from the bottom of a potentiometer knob and allows you to fasten the dial in the proper position. When a detector has been replaced please check that the rubber rings (one for the PMT base and one for the coupling flange) nicely slip into their grooves. Look alongside the base of the PMT housing cap and check whether the lighted surface in the background is unevenly visible along the rubber ring direction. Cooled PMT Housings Every time you open these units do this at room temperature only. Rotate and gently slide the PMT pod out. If you just pull it, you may destroy the rubber sealing rings allowing moisture seep in and accumulate inside the housing. Photomultiplier Detectors When a very high light intensity is present for extended periods of time rapid electron depletion occurs in the photocathode and dynode material. Your photomultiplier becomes less and less sensitive. The lifespan of the detector is reduced. Example: a scan of a bright fluorophore, which under standard conditions, 12 A lamp current and 0.5mm excitation and emission slits, would deliver a signal of several million counts/sec. Figure 8.2-1 Photomultiplier Detector Worn by Long-period Exposure to Extremely High Light Intensities PC1 User Manual 82 Chapter 8 Example of a one (1) year old photomultiplier detector, which has been repeatedly exposed to scattered laser excitation light. 8.3 Optical Components The instrument should be kept in an environment as dust-free as possible. Lamp Housing Check once a year the quartz lens mounted in front of the lamp housing for dust accumulation. When necessary gently clean the lenses use reagent grade ethanol and lens tissue (Lens paper works just fine). Color center formation makes the lens opaque and necessitates a lens replacement. Lamp and Sapphire Window If your laboratory environment is notoriously dusty we recommend that you check the dust accumulation twice a year. Remove dust from the lamp window with lens paper wrapped around a soft cotton tip. Use best quality ethanol. Check the reflector surface once a year or every 1000 hours of use. Old lamps reflect the light less. Very old lamps may fail due to extra heating of the ceramic body. Please timely order a replacement lamp from ISS. Lamps usually are in stock. Have wattage of the lamp and model number as well as a P.O. # at hand. UV lamps have for example the model LX-300UV. Check if you use an ozone-free lamp which does not have the extension UV. Lens Surfaces Lens surfaces should be kept clean and free of fluorescent contaminants. Mirror Surfaces Inside the monochromators reside two mirrors. Over time UV light creates ozone and together with the IR radiation from the lamp it attacks the mirror surface. Even without UV light you will observe that over a period of 4-5 years the enhanced UV mirror coating will oxidize. You can polish the surface but it re-oxidizes quickly. Replace a mirror when illumination patterns become clearly visible. Figure 8.3-1 Example of Oxidized Front Surface Mirror (K2-instrument) (left), Ovalene Spectrum with Scatter Background (right). Monochromators Check the surface of the entrance mirror of the excitation monochromator once a year. Check the surface of the excitation monochromator grating also every year when in heavy use. WARNING: NEVER TOUCH A GRATING SURFACE, NO MATTER HOW MUCH DUST HAS COLLECTED ON IT. PC1 User Manual 83 Chapter 8 Inspect once a year the surface of the entrance mirror of the excitation monochromator as well as the grating surface. Never touch these surfaces. The surface of the exit mirror may also show effects of wear after several years. The grating surface shown was destroyed by laser light over a time period of several years. These conditions lower the light source intensity by an order of magnitude. Run a Raman spectrum of water as in instrument performance test to confirm your suspicions. Contact ISS for maintenance. Figure 8.3-2 Deteriorated Entrance and Exit Mirror Front Surfaces (left), Excitation Grating (Right) 8.3.1 Installation of a New Xenon Lamp Before installing the new lamp: Please apply a thin layer of silicone heat sink compound to the back, anode plate and to the front ring. Check that both electrodes are firmly screwed into their cooling blocks. Note: Be sure to wear protective eyewear when opening the lamp housing and handling the lamp for installation or otherwise Anode Plate Figure 8.3-1 Application of Heat Sink Compound 8.3.2 Step 1: Step 2: Placement Procedure: Make sure that the ISS Power Supply is turned off and that it has been off for at least one hour. Some internal parts to the lamp housing get very hot during normal operation. Locate the Lamp housing at the rear of the instrument. Step 3: Remove the black and white power supply wires from the side of the lamp housing by grasping the plug of each wire and pulling straight out from the housing. Do not pull on the wires. Step 4: Disconnect the Ozone removal hose from the top of the lamp housing. Step 5: Remove the two thumbscrews on the top cover of the lamp housing and remove the top cover and the inner cover. PC1 User Manual 84 Chapter 8 Step 6: Remove the lamp/heat sink assembly from the lamp housing by pulling it straight up. Step 7: Remove the rear heat sink by turning the lamp assembly so that the three 6-32 x 3/8 hex socket head screws are visible. Remove these screws using a 7/64 hex driver. Pull heat sink straight back from the lamp to remove. Step 8: Remove front heat sink by unlocking the clamp on the top of the heat sink. Pull the lamp straight out from the heat sink. Step 9: Note: Be very careful not to touch the front of the lamp and always use a tissue when handling any part of the lamp. Remove the protective cap from the bottom end of the new lamp; however, leave the plastic protective cap on the top end of the lamp (where the light will come out) until ready to connect the front heat sink. Step 10: Apply a thin layer of silicone heat sink compound to the inside of the rear heat sink where the lamp will attach and to the anode ring of the lamp. Step 11: Turn rear heat sink so that the rear of the heat sink is towards you (the power supply receptacle should be on the right side and the serial number of the heat sink should be on the bottom (not visible)). Rotate the lamp so that the serial number on the metal ring of the lamp is facing up and then align the screw holes in the bottom of the lamp with those of the rear heat sink and replace the screws. Step 12: Remove the protective cap from the front of the lamp. (Note: Be very careful not to touch the front of the lamp.) Carefully apply a thin layer of silicone heat sink compound to the metal ring at the front of the lamp being extremely careful not to touch the front of the lamp or get any of the compound on the lamp. Step 13: With the front heat sink facing the same direction as the rear heat sink (the power supply receptacles should both be on the same side) carefully insert the lamp as far as it will go. There should be no gaps between the front of the lamp and the cooling ring in the heat sink. Step 14: Place the lamp / heat sink assembly squarely on a flat surface to assure proper alignment of the heat sinks. Lock the top clamp. Make sure after locking the clamp into place that the lamp / heat sink assembly is tightly secured and no movement is possible between the three parts of the assembly. Step 15: To replace the lamp / heat sink assembly into the lamp housing, align assembly so that the front of the lamp is facing towards the instrument and the power supply receptacles are facing the side of the housing that has the openings for the power cord plugs. The clamp on the top of the assembly should also be visible. Place assembly squarely in housing and carefully push straight down as far as it will go. Make sure that the power supply connectors are visible through the side openings. Step 16: Replace the inner cover with the caution sticker facing up, making sure the screw holes for the thumbscrews are aligned with the screw holes in the housing. PC1 User Manual 85 Chapter 8 Step 17: Replace the top cover with the Ozone Removal Hose adapter facing upwards and tighten the thumbscrews. Step 18: Replace the Ozone Removal Hose on the top cover. Step 19: Reconnect the power supply cords. Each plug will only connect to its designated receptacle. Assure that the plugs are connected tightly or an electrical short may occur. Once the ISS Power Supply is turned back on the instrument will be ready for use. 8.4 Software Keep Vinci CD in a protective folder and make a copy of the user-defined configuration file. Check regularly for viruses. Read the Vinci reference manual before re-installing the software. PC1 User Manual 86 Chapter 9 Chapter 9: Instrument Specifications PC1 User Manual 87 Chapter 9 9 Instrument Specifications Measurements Types (steady-state fluorescence): Corrected excitation and emission spectra Excitation-emission matrices Synchronous spectra Polarization (anisotropy) measurements Ratio measurement Slow Kinetics in time spans ranging from seconds to days Millisecond kinetics in photon counting mode* Variable temperature scans* Titration experiments* TIRF (Total Internal Reflection Fluorescence) spectroscopy* *Accessories required Available Accessories: One, two, three and four position sample compartment with magnetic stirrers Absorption measurements Accessory o o One and four position, peltier controlled sample compartment, temperature range: -30 C to 105 C o (0.02 C) Low Temperature Dewar flask TM The HPCell high pressure cell system Total internal reflection fluorescence (TIRF) flow cell Variable-angle, front surface sample compartment Single and double syringe titrator Stopped-Flow packages Fiber optics Computer controlled filter wheel Cooled PMT housing Light Sources: 300 W high-pressure xenon arc lamp, 45 mW/nm brightness at 275 nm Lamp power supply: current control, with time meter Optional Sources: Laser diodes Light emitting diodes (LEDs) Continuous wave lasers (argon-ion, kripton-ion, helium-cadmium, etc.) Monochromators: Single concave aberration corrected holographic grating Optional: double grating Focal length: 100 mm or 200 mm Linear dispersion: 8 nm/mm or 4 nm/mm (single grating) Stray light: 10-5 outside the bandpass of the HeNe line Wavelength range: from 200 nm to 1200 nm (depending upon the type of grating selected) Wavelength accuracy: +/- 0.2 nm Wavelength reproducibility: +/- 0.25 nm Slew rate: 160 nm/s Lenses: UV-grade fused silica lenses Polarizers: UV grade Glan-Thompson, 10x10 mm, L/A=2.0 UV grade Glan-Thompson, 14x14 mm, L/A=2.0 PC1 User Manual 88 Chapter 9 UV grade Glan-Taylor, 10x10 mm, L/A=2.0 (for high power lasers) Optical design and collection geometry: Parallel beam design for precise polarization measurements T-format for simultaneous acquisition on 2 emission channels Detectors: Side-on photomultiplier tubes in room-temperature or cooled housing Optional: CCD camera Emission channels PMTs: Model R928P by Hamamatsu Reference detector PMT: Model R928 by Hamamatsu PMT wavelength range: 240-900 nm Detection Modes: Photon counting electronics, 10 KHz, on 3 independent channels Optional: Analog Output Pre-amplifier Discriminators: 80 MHz bandwidth, TTL output Dynamic Range: Linear up to 4 million counts/second Sensitivity: 800 fM of fluorescein (with cooled PMT housing) Signal-to-Noise ratio: >1500:1 (room temperature PMT) >5000:1 (cooled PMT) Automation: Up to 4 shutters Up to 3 monochromators 3 polarizers Sample holder rotation Stirrers Filterwheel Instrument Interface to RS232 devices: Titrators Stopped-flow apparatus Peltier sample compartment Flow-through temperature bath Computer and Operating System: Intel-type CPU, Windows XP operating system Power Requirements: Universal power input: 110-240 V, 50/60 Hz, 400 VAC Optical Bench: Dimensions: 885mm (L) x 600mm (W) x 330mm (H) Dimensions with the lamp: 885mm (L) x 835mm (W) x 330mm (H) Weight: 40 Kg PC1 User Manual 89 PC1 User Manual 90 Chapter 10 Chapter 10: Warranty PC1 User Manual 91 Chapter 10 10.1 General Conditions All ISS manufactured instruments are warranted against defective materials and workmanship for one year from the date of shipment. The instruments must be used for the function they have been designed for, as described in the instruction manual. A Return Material Authorization (RMA) number is required before returning any instrument to the ISS factory for repairs. Should this product malfunction during the warranty period, ISS will, at its option, repair or replace it at no charge, provided that the products have not been subjected to misuse, abuse, or unauthorized alterations, modifications, and/or repairs. All expressed and implied warranties for this product include, but are not limited to, the warranties of merchantability and fitness for a particular purpose, are limited in duration to the above one year period. Some states do not allow limitations on how long an implied warranty lasts, so the above limitations may not apply to you. Under no circumstances will ISS Inc. be liable in any way to the user for damages, including any lost profits, lost savings, or other incidental or consequential damages arising out of the use, or the inability to use, such products. 10.2 Expired Warranty ISS will repair instruments with expired warranty at the current part and labor prices. Please contact ISS customer support for more information. 10.3 Non-ISS Parts Although ISS Inc. may supply equipment manufactured by other companies, the only warranty that shall apply to such equipment is the warranty offered by the original manufacturer. 10.4 Field Service During the one year warranty period ISS Inc. will replace defective parts (parts and labor) free of charge. Travel and lodging expenses are paid by the customer. 10.5 Transportation Damage Packages should be carefully examined upon receipt for evidence of damage caused by shipping. If damage is noticed, notify ISS Inc. immediately. Preserve all packages, cartons and documents. PC1 User Manual 92 Chapter 10 PC1 User Manual 93 Chapter 11 Chapter 11: Installation and Setup of K2 PC1 User Manual 94 Chapter 11 11.1 K2 Hardware Installation and Setup The K2 Multifrequency Cross-correlation Phase and Modulation Fluorometer (denoted hereafter as MPF) has the following parts: Figure 0-1 K2 Optical bench with lamp attached Optical bench with excitation monochromator, light modulator, excitation channel, reference channel, sample compartment, two emission channels (one of which includes the emission monochromator) and three housings for photomultiplier tubes, see figure above. Light source. The standard light source includes lamp assembly and lamp power supply. A 300 W xenon arc lamp is inside the lamp housing. Other light sources can be used as well (e.g., spectral lamps and lasers). Two (L format) or three (T format) PMT tubes Polarizers if ordered Slits set K2 tool kit, including alignment pin, quantum counter, slits holder, tool set, spare screws Triangle cuvette if ordered Desktop computer with ISS-PCMC card and A2D200K card for data acquisition and instrument control One USB General Purpose Interface Board (GPIB) card Two frequency synthesizers Two amplifiers or one LA5/25 dual amplifier cables PC1 User Manual 95 Chapter 11 Note: UPGRADES Maybe you have not acquired the entire instrument, but just some of its components. You can easily upgrade your system at a later time. A number of upgrade accessories may be mounted on the instrument. For example: UV Glan Thompson prism polarizers for high accuracy polarization measurements, The low frequency accessory for measuring lifetimes in the microseconds/milliseconds range (if phosphorescence is of interest to you). a microchannel plate PMT detector for high accuracy measurements in the picoseconds range, a Peltier controlled sample compartment automated temperature bath a stopped-flow accessory for kinetics studies pressure cell assembly to study dissociation/association of proteins cryostat accessory for low temperature experiments on glasses a TIRF (Total Internal Reflection Fluorescence) cell fiber optic assemblies for remote detection of fluorescence. Unpack the Instrument The K2 multifrequency cross-correlation phase and modulation fluorometer is shipped in a crate. Upon receiving the instrument inspect the outside of the crate and boxes for any sign of shipping damage. When damage has occurred, contact the carrier and ISS Inc. immediately for further instructions. If no obvious damage is visible, open the crate by removing the screws that fasten the lid to the walls of the crate. You will need a standard Phillips screw driver. When the lid has been removed, visually inspect the instrument for any noticeable damage. If damage is discovered to components inside the crate contact your carrier and ISS immediately; otherwise, continue to unpack the instrument. Please save all packing materials for further shipping needs. 11.2 Install the Hardware After unpacking the instrument, place the optical bench on a sturdy table and remove the protective wrap. Remove all protective materials from mirrors, lenses, polarizer holders, and sample compartment. Remove the shipping rubber rings that secure the shutter blades during shipment and attach the four supplied 4-40 x ½ screws. 11.3 Installation of PMT tubes and polarizers The optical bench supports the excitation monochromator, excitation and reference channel, sample compartment, two emission channels and the photomultiplier tube (PMT) housings. The PMT Tubes themselves are shipped in separated box. Unpack them and install them (see section 1.1.6). Connect the cable back to PMT housing. Polarizers are shipped in separate boxes. Unpack them and install them (see section 1.1.5). PC1 User Manual 96 Chapter 11 11.3.1 Installation of the Xenon Arc Lamp Excitation Light Source The Xenon arc lamp is the standard light source for the ISS PC1 and K2 instrument. A separate package contains the lamp housing mounted on the lamp base and a tube connecting the lamp to the excitation monochromator (See figure below). The tube has a 1/4" brass hose fitting for nitrogen flushing. Fan-driven forced room air cools the lamp assembly. Ozone created in the process is removed via a 3 inch diameter round aluminum air duct hose. It is supplied and attached by the user to the flange mounted on top of the lamp housing. If you only work in the visible an ozone-free lamp can be supplied. 0-1 Lamp Housing Assembly Unpack the above light source-related items. Remove the protective cover on the lamp housing. The lamp bulb and the condenser lens in front of it are already mounted. Check the lens and the quartz window for dust and cleanliness. Thread the protective ozone tube on to the excitation monochromator flange. Identify the screws supporting the lamp housing assembly (refer to figure below to locate the lamp position) on the rear part of the optical bench. Fix the lamp base to the optical bench using the supplied four screws. Tighten the two screws securing the ozone tube to the lamp housing lens coupler. PC1 User Manual 97 Chapter 11 Figure 0-2 Lamp Housing Assembly Unpack the lamp power supply and place it next to the optical bench. Check the lamp power supply, its dial and frame for any shipping damage. Figure 0-3 Xenon Arc Lamp Power Supply front panel WARNING: DURING THIS OPERATION THE LAMP POWER SUPPLY MUST BE OFF. DAMAGE TO THE POWER SUPPLY AND POSSIBLE HIGH VOLTAGE SHOCK MAY OCCUR. Connect the large black and white cable to the proper polarized electrodes of the lamp housing (black = ground, white = high voltage). Check that the screwed-in lamp electrodes (see figure below) are firmly attached to the cooling radiator blocks. A loose connection will cause excessive heating of the electrode contacts. Use a pair of small pliers and gently fasten any loose electrodes. Connect 2-pin black fan cable and green ground cable (using an 8/32 cap screw) to the fan assembly. PC1 User Manual 98 Chapter 11 Figure 0-4 Lamp housing cable connection Connect the high power cable to the proper polarized connector as well as the 6 pin connector to the back of the lamp power supply. Connect the power cable of lamp power supply and check the voltage witch below the power cable is set correctly. Figure 0-5 Lamp power supply cable connection 11.3.2 A Continuous-Wavelength Laser as the Light Source The laser beam must enter the back-left side of the instrument, through entry port A1 (see figure below). The beam should center on mirror M1 and then center on sliding mirror M2 placed on the 2-way polarizer turret base. From M2, the beam will either pass through the Pockels cell for lifetime measurements or enter into the excitation channel after one additional reflection on M4 for steady-state experiments. PC1 User Manual 99 Chapter 11 Figure 0- 1 Laser arrangement for K2 Most continuous wave lasers provide vertically-polarized output. Some commercial lasers may have unpolarized output. The K2 requires the CW laser beam to have a horizontally-polarized component at the entrance of the light modulator. Rotate the plane of polarization by reflection on a 2 mirror beam-steering device or use a quarter wave plate placed outside the K2 optical bench close to laser entrance port A1. The advantage of using a beam-steering mirror assembly is an effortless adjustment of the height of the beam to match the instrument optical bench height. Note: Lasers emitting unpolarized light may show an over-time changing plane of polarization. This effect will cause fluctuations in the light intensity after passage through the Pockels cell 2way polarizer combination. For optimum performance of the K2 equipped with a laser it is recommended that the laser beam be parallel to the instrument optical bench. Alignment tools, pinholes on a stand, are provided for laser alignment. Alignment of the laser beam must be done before mounting the lamp. Place the laser alignment tools (Figure below, left) in positions A1 and A2, and the instrument alignment tool (Figure below, right) in position A3. PC1 User Manual 100 Chapter 11 Figure 0-2 Laser alignment tools for K2 No ozon tube present. Remove mirror M1. Pass the laser beam through alignment pinholes A1 and A2. Use the beam steering mirrors mounted outside the instrument. Mount mirror M1. Adjust mirror M1. Pass the beam through alignment tool A3. The laser beam is now parallel to the optical bench. Ozon tube installed. Just center the beam on M1. Mount the lamp following the procedure described in the previous section. Now you are ready to install the modulator. 11.4 Connect all components All optical elements have been aligned at the ISS facilities during the instrument's testing. No further alignment is required. Figure below displays the connection diagram of the instrument. It shows connection between optical bench (including the Main Power Panel, Signal Output Panel, Modulator Panel, Pockels cell), synthesizer, AF5/25 Amplifier and computer. PC1 User Manual 101 Chapter 11 Figure 0- 3 K2 connection diagram (need figure from Jill) 11.2.1 Synthesizers The standard synthesizer that ISS provides is Model IFR 2023A, manufactured by Aeroflex. ISS software can control other synthesizers as well; a listing of the supported devices is reported in Table below. Synthesizer Manufacturers IFR (Marconi Instruments) Programmed Tests Sources Gigatronics Hewlett Packard PTS A “T” BNC connector is connected to the “Freq Std In-Out” of Master synthesizer. Two end of “T” are connected to A2D200K card in computer and the “Freq Std In-Out” of the slave synthesizer. The frequency synthesizers are controlled through the computer using either a PCI or USB General-Purpose Interface Bus (GPIB) card, or IEEE488 card, supplied by ISS. The ISS software allows for the automatic selection of the frequency. For USB GPIB card, you will find a 0.5 m long GPIB cables and a Keithley KUSB-488A USB card. First connect the two synthesizers using the short GPIB cable; the connections are located on the rear panel of the synthesizer. Then, connect the KUSB-488A card to the end of the short cable that connected to master synthesizer and the USB port of the computer. For PCI GPIB card, special cables, called GPIB-cables, are supplied for connecting the synthesizers to the card inserted in the computer. You will find two special GPIB cables, one 0.5m long and the other 2m long. First connect the two synthesizers using the short cable; the connections are located on the rear panel of the synthesizer. Then, connect the long cable between any master synthesizer end of the short cable and the GPIB card inserted in the computer. PC1 User Manual 102 Chapter 11 The synthesizers are programmed at the factory as in the following table so that they are ready for use after the connections have been completed. GPIB Address 0 1 Master Slave Frequency Standard 3 (Internal) 4 (External) The output signal of the synthesizers does not have enough power to drive the light modulator and the light detectors (photomultiplier tubes). Therefore, the signal has to be amplified and RF amplifiers are provided for this task. 11.2.2 RF Amplifier The RF amplifier utilized for driving the light detectors is the Model LA5/25 that covers the frequency range from 50 KHz to 900 MHz. LA5/25 is a reliable linear amplifier capable of more than 4 watts of linear power output when driven by a frequency synthesizer in the range from 50 KHz to 900 MHz. LA5/25 amplifier is a dual amplifier. Input and output are located on the back panel of the amplifier. The front panel includes the power switch. The unit is equipped with a universal power supply (110-240 V); no adjustment is required. Connect the power cord to the main outlet. Connect the output of the slave synthesizer to the 5W input of the RF amplifier. The output of the RF amplifier is split into two signals via a “T” BNC connector; each driving one photomultiplier tube. Connect the two outputs of T connector to PMT RF inputs of the Modulator Panel on the left hand side of K2. Connect the output of the master synthesizer to the 25W input of the RF amplifier. The output of the RF amplifier connected Pockel Cell RF input. Note: A “T” BNC connector is connected to Pockel Cell which connected a 50 Ohm Heat Dissipater and the RF input. 50 Ohm heat dissipater is very import for preventing the overheating of Pockel cell. Other types of amplifiers are supplied by ISS for early model of K2 and ChronosFD. 604L is used to amplify the signal to PMT. 604L covers the frequency range from 0.8 MHz to 1 GHz. When using light emitting diodes as light detectors, Model 403LA covering the range from 50 KHz to 300 MHz is instead utilized. ENI 525LA is used to modulate signal to pockel cell. ENI 525LA covers the frequency range from 1 MHz to 500 MHz. No tuning or any other form of adjustment is required other than the selection of the correct power supply input voltage, which is set in the ISS software driving the frequency synthesizer. The ISS driver controlling the synthesizers set the correct signal amplitude for these RF amplifiers. Typical inputs for two IFR2023A with different amplifiers are shown in table below. IFR2023A Master IFR2023A Slave PC1 User Manual MasterLA5/25 (25W) SlaveLA5/25 (5W) RF Level (db) MasterENI 525LA SlaveENI 604L 0 -6 MasterENI 525LA SlaveENI 603L or 403LA -6 0 -12 -4 103 Chapter 11 Input voltages to amplifiers in excess of 2 V peak may permanently damage the instrument. After amplification, the signal enter the PMT is 25-30V peak to peak and the signal enter the Pockel cell is about 75V peak to peak. 11.2.3 Optical bench There are three panels on the side of the optical bench: Main Power Panel, Signal Output Panel and Modulator Panel. The pockel cell is on the left side of K2 back hood. The Main Power Panel and Signal Output Panel are on the right hand side of the instrument. The main power panel contains the power plug, power switch and remote port which connect to PCMC card in computer via a 25-pin cable for motion control. This Signal Panel contains the Analog and Photon Counting Outputs. There are two analog output (EM for emission channel and EX for Excitation channel) and a 15-pin connector for photon counting outputs. Two analog outputs are connected to the A2D200K card in computer via the BNC cable. Three photon counting output channels (REF for reference; REM and LEM for right-emission channel and left-emission channel respectively) are connected to the PCMC card 15-pin connector through a 15 pin cable. Figure 0-4 K2 Main Power Panel Figure 0-5 K2 Signal Output Panel On the left hand side of the instrument you will find the Modulator Panel (Figure below). The ON/OFF switch applies a static electric field to the Pockels cell. The potentiometer adjusts the magnitude of the electric field. Two BNC panel mount connectors (PMT 1 and PMT 2) are for radio frequency input to the PMTs. Figure 0-6 K2 Modulator Panel Open the back lid of K2 hood, the Pockel cell is located on the left side (Figure below). The output of the RF amplifier (magnify signal from the master synthesizer) connected Pockel Cell RF input through a “T” connector. Another side of “T” Connector is the 50 Ohm heat dissipater. A separate BNC cable from bias tray (inside of optical bench) connected to BIOS input of Pockel Cell. PC1 User Manual 104 Chapter 11 Figure 0-7 K2 Pockels cell connection 11.3 Alignment of the Light Modulator The light modulator components are: the two-way polarizer, the Pockels cell, and a reflecting mirror, M3. The two-way polarizer is mounted inside a sliding turret. Both the two-way polarizer and the mirror holder are mounted on a separate stand-alone base (Figure below) fixed to the modulator base by two screws. This base holds the Pockels cell light modulator and the 50 Ohm heat dissipater. The Pockels cell is enclosed in a radio frequency shield. Mirror, M3, is placed on an adjustable mount close to the back of the Pockels cell. Figure 11.3-1 K2 two-way polarizer assembly In the following sections we will discuss in detail the alignment procedures of the modulator using the Xenon arc lamp and a CW laser. 11.3.1 Alignment of the Light Modulator for Xenon Arc Lamp To get good modulation for the lifetime measurement, light beam should be aligned with respect to the train of Pockel cell arm, go through the center of diaphragm and center on the cross on alignment panel (Figure below). Step by step alignment procedure is described below. PC1 User Manual 105 Chapter 11 Figure 11.3-2 K2 lamp alignment Step 1: The lamp light centers on the entrance slit of the excitation monochromator. This is usually done at ISS. Step 2: Align monochromator light to cross on the inner side wall of K2. This is usually done at ISS. Remove temporarily 50 Ohm resistor and Pockels cell assembly. In order to do this, remove all the base fastening screws. Remove the base containing the two-way polarizer, Pockels cell housing and the sliding laser mirror, M3. Turn on the lamp, set excitation monochromator to 0 nm. Insert 0.5 mm and 0.5 mm slits to excitation monochromator, make sure that the center of arc lamp image hit the cross on the left inner side wall of K2 (See figure below). For old K2, there will be an alignment mark on pinhole at the similar place. Figure 11.3-3 Align K2 monochromator light to the cross Step 3: Center the reflection light. Place mirror M3 back and fasten it in position. Insert 2 mm and 2mm slits to excitation monochromator. Set monochromator to 520 nm. Tape/place a piece of white paper with a 3mm pinhole close to the exit of the excitation monochromator. Make sure the pinhole is centered on the optical axis. The light beam passing through the pinhole will center on Mirror M3. PC1 User Manual 106 Chapter 11 Figure 11.3-4 Align K2 monochromator light to the M3 mirror Adjust two screws on the back of M3 to center the reflection light on exit light from monochromator. Reflective is green circle in figure below. Remove paper on the exit of the excitation monochromator. Figure 11.3-5 Center the reflection light Step 3 Align the polarized light Push the excitation polarizer assembly out of light path until you can clearly see the small diaphragm opening. Remove the sample compartment and install the alignment panel. Mount the 2-way polarizer base. Keep M2 mirror out of the way. Slide the polarizer turret forward against the stop. Center the lamp light on the entrance opening of the 2-way polarizer housing (forward position). Use the stop screws of the baseplate to adjust the turret. Cut a piece of the plastic, stretch it and tape the piece to the back of two-way polarizer to allow polarized light go through. PC1 User Manual 107 Chapter 11 Figure 11.3-6 Align the polarized light Adjust the base of 2-way polarizer and let light go through center of closed diaphragm pinhole, and center at alignment panel cross. Remove the plastic. Note: plastic is stretched to allow polarized light go through, you may see different light spots when the plastic is in place and not in place. The light spot with plastic placed on 2-way polarizer is the light you should align to the center of Iris pinhole. Step 4: Obtain a properly modulated light spot Put the Pockels cell back, adjust the three screws in front of pockels cell to let the reflection light from the Pockels cell window center on two-way polarizer. With bios voltage off, place a white business card or a piece of paper in front of diaphragm. Loosen the 3 front screws on the Pockels cell housing. Free play should be 2 to 3 mm in all three 120 degree directions. Change the angular position of the Pockels cell housing until you get a nice dark cross on the business card and see a clear cross on the paper (figure below). Remove paper, cross should be centered on the center of diaphragm. Figure 11.3-7 Adjust the Pockels cell to get a clear cross in front of the Iris See figures below for good alignment and some examples of bad alignment. PC1 User Manual 108 Chapter 11 Figure 11.3-8 Examples of good and bad alignments Hold the Pockels cell housing in one hand and keep the best orientation fixed. Use your other hand to fasten the 3 set screws while observing the dark cross. It has to keep its best shape. Note: A misaligned Pockels cell will show an assembly of dark lines or crosses that have to be improved. This is the most important step. Connect the BIAS BNC-cable to the Pockels cell bias input. Connect the 50 Ohm resistor. Turn the instrument ON. The main switch is located on the right side of the instrument. Turn the BIAS switch ON. The image in front of the iris diaphragm will look like the one shown in Figure below. Figure 11.3-9 Good alignment image when the BIAS is on We say that the black cross "opens" when an electric field is applied to the Pockels cells. Adjust the potentiometer near the BIAS switch to let the dark cross opens more. Later with the instrument running you further have to optimize the bias voltage. Step 5: Centering the well-modulated dark cross The dark cross is centered on the small diaphragm opening (2 mm diameter). However, by mistake it is bright with bias voltage off and dim when on. The opposite of what you want to have. The angular position of Pockels cell needs to be adjusted just a little. A slight tightening or loosening of one or 2 of the 3 front adjustment screws on the Pockels cell should do. Otherwise return to step 3. The dark cross is not centered on the small diaphragm opening (2 mm diameter). PC1 User Manual 109 Chapter 11 Horizontal alignment Loosen the two screws holding the baseplate of the two way polarizer/adjustable laser mirror assembly to the Pockels cell and K2 baseplate. Slightly adjust the angular position until the xenon arc spot is centered on the diaphragm opening. Fasten screws and check final alignment. Turn bias voltage on/off. Check that brightest and blinking spot is centered on the sample holder opening. Vertical alignment Adjust the 2 very small setscrews located on top of the two-way polarizer turret. Turn bias voltage on/off. Check that the blinking spot is centered on the diaphragm opening. Note the modulated light should center on the cross mark on the alignment panel. The light beam must be centered on this mark in order to be properly aligned. Slightly move the base containing the two-way polarizer. Center the light beam on the iris and hit the mark on the alignment panel. When everything is aligned, fasten all screws. Step 6: Optimize the bias voltage for best modulation at 2 MHz with good DC (1000-2500) and AC values (modulation ~15% at 2 MHz). Adjust lamp current to 18A. Remove quantum counter from the reference channel. Use a small pinhole and neutral density filters to decrease the arc lamp intensity seen by the reference detector. Rotate the beamsplitter just a little bit to decrease DC relative to AC for best modulation of the reference beam. Increase the reference PMT voltage if necessary. Obtain a modulation as high as possible with a stable DC and AC signals. Lower the PMT voltage if saturation occurs. Now that the light modulator has been aligned for dynamic fluorescence measurements, we will align the instrument for steady-state measurements as well (Section 2.7). Step 7: Check the modulation with a scattering solution. After the alignment, put the normal sample compartment back. Make sure synthesizers, amplifiers, K2, bias and Vinci in time resolved lifetime mode. Place a ludox water solution (Ludox HS-30 colloidal silica, Aldrich 420824, add 3-5 µL in 2-3 ml water solution) in sample position. Set the light modulator to 10 MHz, open the shutter and adjust LEM dial until LEM intensity is between 1000-4000. Modulation should be above 10. If you use both laser and xenon arc lamp, check that both systems give optimized steady-state and modulation performance. PC1 User Manual 110 Chapter 11 11.3.2 Alignment of the Light Modulator for a CW Laser Identify all optical components in Fig. below and compare with the K2 bench. Figure 11.3-10 K2 lifetime mode alignment with laser Step 1: Beam alignment w.r.t the K2 baseplate. Align the laser beam so that it is parallel to the optical bench (section 2.3.3). Mount mirror M1 in its proper position. Center the beam on M1 when an ozone tube is present. Adjust M1. Let the beam pass through alignment tool A3. The beam is now co-planar with the K2 base. Step 2: Alignment the light to the cross on K2 inner wall Push mirror M2 all the way forward towards the sample chamber. Slide the 2-way polarizer housing temporarily out of the way. Remove also 50 Ohm resistor house, Pockels cell housing. In order to do this, remove all base screws. Remove mirror M3 only when no cover is present. Align M2 to let the laser beam hit the cross on the left inner side wall of K2 (or pinhole A3 at the similar place for old K2). Step 3: Alignment the light with reflection mirror M3 Mount and adjust mirror M3 if you removed it. Reflect the laser beam back from mirror M3 into pinhole A1. Step 4: Alignment the light with Pockels cell optical axis Place the Pockels cell house back on its base plate and fasten it to the K2 base plate. Center the axis of the Pockels cell with respect to the light beam. The simplest way to perform this operation is by centering the reflections from the faces of the crystals on pinhole A1. Block the reflection from M3 with a business card. The reflection pattern will be a group of bright light spots on a dark background. PC1 User Manual 111 Chapter 11 Note: If the three front adjustment screws on the Pockels cell house or (at other times) the M3 alignment knobs are far out, it may be difficult to find the reflection from M3. The best approach to get the reflection from M3 back into pinhole A1 is: Slip a business card between M3 and Pockels cell house. Blink reflection on/off while you adjust M3. Step 5: Obtain a properly modulated light spot. Slide the two-way polarizer forward. Adjust the stop screws on its base to center the laser beam onto the entrance opening of the two-way polarizer if necessary. Center the back reflection from the faces of the crystal on pinhole A1. At this point, insert a piece of paper behind the two-way polarizer to prevent reflections from the Pockels cell. Place a business card in front of the excitation shutter. Connect the BIAS BNC-cable to the Pockels cell bias input. Turn the instrument ON. The main switch is located on the right side of the instrument. Turn the BIAS switch ON. Figure below resembles the image in front of the excitation shutter. Typically many spots in various sizes and intensities are visible in a 1 cm 2 area. They are caused by reflections from the two windows and the 4 crystal surfaces. Turn the potentiometer near the BIAS switch clockwise and increase the bias voltage to a value between 6 to 8. The spot becomes brighter. Turn the bias switch on/off. One spot on business card should blink. Figure 11.3-11 Laser spots in front of excitation shutter In case not a single spot can be seen blinking: Loosen the 3 (120 degree) front screws on the Pockels cell housing. Change the angular position of the Pockels cell housing until you see a bright blinking spot near the center of the field of view. Do not worry about centering the spot w.r.t the optical axis. This will be the next step. Hold the Pockels cell housing in one hand and keep the best orientation fixed. Use your other hand to fasten the 3 set screws while observing the bright spot. Note: To find the brightest laser spot on the business card in front of the excitation shutter it helps to insert a cellophane (UV transparent) depolarizer sheet between Pockels cell house and 2-way polarizer. PC1 User Manual 112 Chapter 11 Step 6: Centering the well-modulated light spot. Remove the business card placed in front of the excitation shutter. Close shutters on the emission side. Otherwise you may blind the emission PMT detectors with room light when you open the sample compartment while the PMT voltage is on. Push the excitation polarizer assembly out of light path until you can clearly see the small diaphragm opening. Place some fluorescent paper in front of IRIS and center the incoming light. Remove the paper and light should go through the closed diaphragm opening. Turn the bias voltage on/off. Set the bias voltage potentiometer to a value between 6 to 8, if not already done so. A laser spot should blink: Dim (off), bright (on). Turning the BIAS on will increase the light intensity 20 to 50 times. If that does not happen, repeat the alignment more carefully. See step 3. Patience is essential. The spot is centered on the small diaphragm opening (2 mm diameter) However, by mistake it is bright with bias voltage off and dim when on. The opposite of what you want to have. The angular position of the Pockels cell needs to be adjusted just a little. A slight tightening or loosening of one or 2 of the 3 front adjustment screws on the Pockels cell should do. The blinking laser spot is not centered on the small diaphragm opening (2 mm diameter) Horizontal alignment Loosen a bit the two screws holding the baseplate of the two way polarizer/adjustable laser mirror assembly, M2, to the K2 baseplate. Slightly adjust the angular position. Center the laserspot on the diaphragm opening. Fasten screws and check final alignment. Turn bias voltage on/off. Check that brightest and blinking laser spot centers on cuvette. Vertical alignment Adjust the 2 very small set screws located on top of the two-way polarizer turret. Turn bias voltage on/off. Center bright, blinking laserspot on cuvette. Now extract the cuvette holder located inside the sample compartment. Remove the four screws that hold the sample compartment, remove the sample compartment and replace with the alignment panel. Note the cross mark on the inside back wall of the alignment panel (For old K2, the alignment cross is on the inner wall of sample compartment, remove the top screw on the turret with a wrentch). Center the light beam on this mark. Slightly move the base containing the two-way polarizer. Center the light beam on the iris and hit the mark on the back wall of the sample compartment. When everything is aligned, fasten all screws. Step 6: Optimize the modulation Turn the bias voltage completely off. The laserbeam is best modulated with the bias voltage off. Rotate the beamsplitter just a little bit in its holder to decrease DC relative to AC for best modulation of the reference beam. Adjust pmt voltage if necessary. Use small pinhole and neutral density filters to decrease the beam intensity. Best modulation at 2 MHz with good DC (10002500) and AC values (modulation 30-70%). Note: For anisotropy measurements that require g-factor determination you have to use a halfwave plate to rotate the plane of polarization from vertical to a value different from it. Note: Do not use Watts of UV or visible laserlight entering the Pockels cell assembly. Spurious absorption may occur, causing heating of the crystals and drift of the laserbeam. PC1 User Manual 113 Chapter 11 This is specially so when the laserbeam is not perfectly aligned and enters the Pockels cell at an angle. Modulation values may oscillate with a period of minutes resembling the heating/cooling cycle of the crystals. Note: Check for fuzzy, hazy spots inside the Pockels cell crystals when laserbeam drift is a persistent problem. The windows protect the crystals from moist air. 11.4 ISS Modulated Laser or LED ISS supplies a variety of Laser and light emitting diodes (LEDs). They are an exciting alternative to traditional lamps; they are bright, stable, and compact light sources. Laser diodes can be modulated to high frequency and allow measurement of picosecond lifetimes. Available solid-state light sources for ISS instruments are listed in table below. Available LED Light Source Center Wavelength (nm) FWHM (nm) Modulation Frequency (MHz) 280 12 DC - 400 300 12 DC - 400 370 12 DC - 250 460 12 DC - 150 480 20 DC - 150 520 22 DC - 100 Available Laser Diode Light Source Center Wavelength (nm) Modulation Frequency (MHz) 370 DC - 400 405 DC - 650 436 DC - 500 470 DC - 400 635 DC - 1000 670 DC - 800 780 DC - 800 830 DC - 350 When you use a modulated laser or LED, the modulator is not needed. Align the laser so that the beam goes through the closed iris and centers on the cross on the alignment panel. When using the modulated Laser or LED. Signal from the master synthesizer will be sent directly to the light source. Please contact ISS for the instructions about how to connect and set up the instrument. PC1 User Manual 114 Chapter 11 Note: You have to insert a halfwave plate to rotate the plane of polarization for g-factor determination during anisotropy measurements. Note: Protect your eyes and diminish laser intensity. For alignment purposes a low power, visible beam is sufficient. 11.5 Steady State Alignment First, slide the turret which contains the two way polarizer and steady state mirror M4 back against the stop. For lamp, light coming out of the excitation monochromator will hit mirror, M4, and propagate along the excitation channel into the sample compartment. For laser, center the light spot reflected from mirror M2 on mirror M4 and with respect to the optical axis of the excitation path. Translate the mirror if necessary. Readjust mirror, M4, placed on the 2-way polarizer turret. Use the three screws on the mirror holder to perform this operation. The light beam must go through the wide-open iris diaphragm and hit the mark on alignment panel. If you use both laser and xenon arc lamp check that both systems give optimized steady-state and modulation performance. PC1 User Manual 115 Chapter 11 PC1 User Manual 116 Chapter 12 Chapter 12: K2 Startup and Shutdown Procedure PC1 User Manual 117 Chapter 12 K2 can perform both steady state and lifetime measurement. This Chapter describes the quick start up and shutdown procedure for both modes. 12.1 Comparison of Steady State and Time-Resolved Mode Table below summarized the set up difference between two modes. Steady State Push back. 2-Way polarizer Excitation light hit the mirror IRIS Open Bias Tray Off or on Hardware Synthesizer Off or on Amplifier Off Reference Channel Vinci Acquisition 1 control Measurement Side Quantum counter Photon Counting or Analog Left or Right Time-Resolved Push forward, light enter the 2-way polarizer Close On On On Lifetime pinhole if reference channel is used Analog, TimeResolved 2 Left 1 The acquisition control is set by Vinci when the users load the steady state or lifetime experiment from the Vinci menu. It is possible to measure the lifetime on right emission side. The intensity will be much lower after the emission light pass through the monochromator. The RF input cable from amplifier must be moved from Bias Tray PMT1 connector to right PMT housing RF input. 12.2 Steady State measurement Below are the steps involved in the startup and shut down, for the K2 steady state measurement. 1. Lamp Ignition. With instrument and computer turned off. Check that there is nothing around lamp power supply that will block the heat dissipation. Set the current control knob of the lamp power supply completely counter-clock-wise (CCW). Switch the lamp power supply on. The initial current is 10A (Ampère) for the 300W xenon arc lamp. The lamp requires 10 minutes to stabilize then for normal operation set the current to 15 - 18A for the best intensity stability. A lamp power supply can be operated up to 23A to maximize intensity. 2. Check hardware on optical bench Use 2 mm excitation slits for maximum intensity. Push the 2-way polarizer back to let excitation light hit the mirror. Remove all unnecessary optical neutral density filters, mesh screens, polarizers, and excitation and emission filters from the optical path. A reflective interference filter in the left emission channel while taking emission spectra may distort the spectral data. Check that the lever of the iris diaphragm behind the turret points to the left (open position). PC1 User Manual 118 Chapter 12 Figure 12.2-1 Iris Diaphragm Handle Position Close instrument covers and shutters. Direct exposure of the detectors to room light should be prevented as much as possible. 3. Place Quantum Counter in reference channel. 4. The synthesizers and bias tray (and synchronization module for old K2) can be turned if you want to change to lifetime measurement later. Otherwise, they can be turned off. 5. Make sure that RF amplifier is turned off. RF amplifier is not controlled by Vinci. It can be turned on later if you want to use lifetime mode. 6. (Optional step)If you have a peltier controlled sample compartment, turn on circulated water bath, turn on power switch on the back of temperature control unit. Press the “Run/Stop button” to set the unit under computer control. 7. (Optional step)If you have a cooled PMT housing, first turn on water bath, then turn on the temperature control unit. 8. For some old K2, there are different connection cables for Photon Counting (Labeled “PC”) and Analog (Labeled “output”) mode. Make all PMT outputs are connected with “PC” cable. 9. Turn on K2. The instrument ON/OFF switch is located on the right rear side of the instrument. You should hear the sound of the shutters and motors when the instrument is switched on. The PMT housing LED should be on with the PMT housing switch set to manual, MAN and dial is set to 10.0. For any stability test, let the PMT warm up for at least 3 hours. measurement, turn your K2 and PMT on the day before to stabilize PMT. For slow kinetics Please note that air-conditioning, or solar radiation influences the room temperature and thus the temperature of the detectors. Cooled PMT housing are not influenced by these factors. 10. Turn on computer and start Vinci software. Click on Vinci shortcut on desktop to start the Vinci Analysis software. Select <Experiment> and <Experiment and Instrument Control> to launch the Experiment and Instrument Control software in a new window. The initialization creates a characteristic sound of shutter and motor-movement. If you don’t hear the noise, check the power and 25 pin cable of K2 instrument. 11. Check the dark signals (counts/sec). Dark signals are shown at the bottom of the Vinci Experiment and Instrument Control window. Dark signals are refreshed at a 10Hz rate. Typical dark signals are between 300- PC1 User Manual 119 Chapter 12 1500 with closed shutters. Upon setting up the instrument for T-format measurements both emission and excitation channels should display a signal output. 12. Calibrate monochromator. Check your monochromator dial reading and monochromator reading in Vinci. If they are not agree with each other, right click on right emission monochromator, select “Calibrate” (Figure below) and enter the monochromator dial reading when prompted. Use the same procedure for the other monochromator(s). See the Vinci reference manual section 4.2 for more information. Figure 12.2-4. PC1 – Monochromator Calibration 13. Select of data storage directory and other data acquisition parameters. Select <Settings> and <Global Settings> (Figure below). Figure 12.2-5. A new window that includes the parameters related to the measurement will be displayed (Figure below). Figure 12.2-6 “Global Settings” Parameters PC1 User Manual 120 Chapter 12 Choose a directory to save your data in Output Directory. A different folder can be selected by clicking on <Browse>. Filenames can either be derived from the title or be prompted for input by a user. If “Automatically switch to Analysis” is checked, Vinci Experiment and Instrument Control will automatically switch to Vinci-Analysis after the acquisition of a data set. 14. Data acquisition By default, Vinci started in L format, right side, photon counting Mode. experiment from the menu for you measurement. Select proper Please see chapter 5 of this manual and section 3 of the Vinci reference manual for more detailed information how to acquire steady state data with K2. 15. Data analysis An Experiment File will open automatically in Vinci Analysis if “Automatically switch to Analysis” is checked under “Global Settings” (see Step 9). Otherwise, select “File”->”open” to load the data file in Vinci Analysis. Data files can also be opened with Excel spreadsheet. See section 12.4 of the Vinci reference manual. 12.3 Time-Resolved measurement Below is the steps that involved in start up procedure for the K2 time-resolved measurement. 1. Lamp Ignition. With instrument and computer turned off. Check that there is nothing around lamp power supply that will block the heat dissipation. Set the current control knob of the lamp power supply completely counter-clock-wise (CCW). Switch the lamp power supply on. The initial current is 10A (Ampère) for the 300W xenon arc lamp. The lamp requires 10 minutes to stabilize then for normal operation set the current to 15 - 18A for the best intensity stability. A lamp power supply can be operated up to 23A to maximize intensity. 2. Check the hardware on optical bench Push the 2-way polarizer forward to let excitation light go through the 2-way polarizer. Use 2 mm excitation slits for maximum intensity. Remove all unnecessary optical neutral density filters, mesh screens, polarizers, and excitation and emission filters from the optical path. Check that the lever of the iris diaphragm behind the turret points to the right (close position). Figure 12.3-1 Iris Diaphragm Handle Position Close instrument covers and shutters. Direct exposure of the detectors to room light should be prevented as much as possible. PC1 User Manual 121 Chapter 12 3. Place lifetime pinhole in reference channel if you are going to use reference channel. 4. If you are going to measure time-resolved spectrum or phase-resolved spectrum, remove the BNC cable from RF amplifier that is connected to PMT2 on Bias Tray and connect it to RF input of right emission PMT. Otherwise, don’t change it. 5. Turn on the synthesizers and bias tray (and synchronization module for old K2). 6. Turn on the RF amplifier. RF amplifier is not controlled by Vinci. It can be turned on after everything else is turned on. 7. If you have a peltier controlled sample compartment, turn on circulated water bath, power switch is on the back of temperature control unit. Press the “Run/Stop button” to set the unit under computer control. 8. If you have a cooled PMT housing, first turn on water bath, then turn on the temperature control unit. 9. For some old K2, there are different connection cables for Photon Counting (Labeled “PC”) and Analog (Labeled “output”) mode. Make sure that LEM PMT output is connected with “Out” cable. If the reference PMT is going to be used, reference PMT output should be connected to “Out” cable. 10. Turn on K2. The instrument ON/OFF switch is located on the right rear side of the instrument. You should hear the sound of the shutters and motors when the instrument is switched on. The PMT housing LED should be on with the PMT housing switch set to manual, MAN and dial is set to 8.0 (adjust dial to change the DC intensity later, dial should be set to 4-9 for time-resolved experiment). 11. Turn on computer and start Vinci software. Click on Vinci shortcut on desktop to start the Vinci Analysis software. Select <Experiment> and <Experiment and Instrument Control> to launch the Experiment and Instrument Control software in a new window. The initialization creates a characteristic sound of shutter and motor-movement. If you don’t hear the noise, check the power and 25 pin cable of K2 instrument. 12. Load the Experiment->Time-Resolved->Lifetime to load the lifetime mode (See figure below). At the bottom of screen, there are now three number displayed for left emission: Phase (Ph.), Modulation (Mod.) and DC intensity (L.Em., should be close to zero when shutter is closed). 13. Calibrate monochromator if monochromator is used for lifetime measurement. PC1 User Manual 122 Chapter 12 14. Select of data storage directory and other data acquisition parameters. Select <Settings> and <Global Settings> (Figure below). Figure 12.3-5. A new window that includes the parameters related to the measurement will be displayed (Figure below). Figure 12.3-6. “Global Settings” Parameters Choose a directory to save your data in Output Directory. A different folder can be selected by clicking on <Browse>. Filenames can either be derived from the title or be prompted for input by a user. If “Automatically switch to Analysis” is checked, Vinci Experiment and Instrument Control will automatically switch to Vinci-Analysis after the acquisition of a data set. 15. Data acquisition For time-resolved measurement, Vinic is set to Analog, Time-Resolved, L-format and usually Left side. When time-resolved experiment is loaded, Vinci will set the acquisition mode automatically. Select proper experiment from the menu for your measurement. 16. Data analysis An Experiment File will open automatically in Vinci Analysis if “Automatically switch to Analysis” is checked under “Global Settings” (see Step 9). Otherwise, select “File”>”open” to load the data file in Vinci Analysis. Data files can also be opened with Excel spreadsheet. See section 12.4 of the Vinci reference manual. 12.4 Shut Down the Instrument 1. 2. 3. 4. Turn off Vinci Experiment and Instrument control software. (Optional) Turn off Vinci Analysis software and computer. Turn off RF amplifier, synthesizers, K2 instrument. Turn off temperature control and water bath for cooled PMT housing and peltier controlled sample compartment if you have these equipments. 5. Set the lamp current back to 10A. Let the lamp cool down for 10 minutes before turning off the lamp power supply. PC1 User Manual 123 Chapter 12 PC1 User Manual 124 Chapter 13 Chapter 13: Introduction to Time-Resolved Measurement PC1 User Manual 125 Chapter 13 13 Introduction to Time-Resolved Measurement There are four built-in time-resolved experiments in Vinci: Lifetime, Anisotropy, Time-Resolved spectrum and Phase-Resolved spectra (Emission and Excitation). The experiment description and setup difference are listed in the following table. Table 12.1-1 Title Experiment Lifetime Timeresolved Anisotropy Dynamic polarization Measurement lifetime Reference A known lifetime fluorophore L No, better measure lifetime first L A proper filter Multiple A proper filter Multiple Acquisition side Emission filter Frequency points TimeResolved Spectrum Lifetime at different emission wavelength A known lifetime fluorophore R PhaseResolved Spectra Separated spectrum from the known lifetime mixture A known lifetime fluorophore R Monochromator Monochromator Multiple Single or Multiple? This chapter will give a detailed description of each experiment. It is good practice to measure a standard fluorophore sample with a known single fluorescence intensity decay before commencing your intended experiment to validate your instrument and make sure that itI is working properly. 13.1 General Procedure for all experiments 13.1.1 Turning on K2 and Starting the Vinci Software Turn on instrument, computer and start the software as explained in the time-resolved measurement start up procedure described in chapter 4. 13.1.2 Select Proper Excitation Wavelength, Filters or Emission Wavelength For a white-light source and excitation monochromator select an excitation wavelength that is closest to the maximum absorbance wavelength of your sample. If you have other LED or laser light sources, select a light source that best matches the sample’s maximum absorbance.. When the excitation light intensity is too low, a proper band-pass filter may be used in the excitation channel with the excitation monochromator set to 0 nm. Select an appropriate long-pass (LP) or band-pass (BP) emission filter which will cut out all scattered excitation light. The filter should be placed in the left emission filter hanger. The user should be aware ofautofluorescence from absorptive type filters. For this reason interference PC1 User Manual 126 Chapter 13 based filters are referred. When the right emission monochromator is used, select the proper wavelength. For lifetime measurements excitation and emission polarizers have to be in the optical path and magic angle settings are required. 13.1.3 Select a lifetime standard For all the measurements that need a lifetime standard, select a suitable lifetime standard, which should be chosen according to your excitation source wavelength and sample absorption properties. Ensure overlap of the emission spectra between sample and reference. The table below lists some of the commonly used lifetime standards. Proper standards should be temperature insensitive although all exhibit quenching effects due to the presence of oxygen. Lifetime Standards Lifetime [ns] NADH 0.4 NATA 3.0 p-Terphenyl PPD PPO 1.05 1.20 1.4 POPOP 1.35 DimethylPOPOP 2-Aminopurine L-Tyrosine Anthranilic acid Indole Fluorescein, dianion Rhodamine B Rose Bengal Conditio ns for Lifetime Measure ment 0.1 M PB o 7.4, 20C 0.1 M PB o 7.0, 20C Ethanol Ethanol Ethanol Ethanol abs. Excitation [nm] Emission [nm] Ref. 330-370 400-600 1 275 310-400 1 280-320 240-340 280-350 310-412 310-440 330-480 2 2 2 280-390 370-540 2 1.45 Ethanol 300-400 390-560 2 11.34 3.27 Water Water 290 285 380 300 2 2 8.9 Water 290 400 2 4.49 Water NaOH/W ater Water Cyclohex o ane,25C 290 360 2 400 490-520 3 400 583 3 556 572 2 4.1±0.1 1.52 0.52 Table: List of common standards for fluorescence lifetime measurements. PC1 User Manual 127 Chapter 13 13.1.4 Prepare the Samples The next step is to prepare solutions of sample and reference for your measurement. To avoid inner filter effects, the optical density for the lifetime standard and sample must be below 0.1 / cm at the excitation wavelength. To prepare your solution follow this routine: 1. Measure the absorption spectrum of the sample, to make sure that the optical density of the sample at the anticipated excitation wavelength is less than 0.1 (in a 1cm cuvette). 2. Repeat the same routine for the lifetime standard if it is required. 3. Place the cuvettes with sample (“S”ample postion) and standard (“R”eference postion) solutions inside the sample compartment if required. Note, that you need to make sure you are using exquisitely clean cuvettes; that there are no spots or drops on its surface and no bubbles inside, in solutions, otherwise it can be a significant source of scattering. 13.1.5 Frequency Range Figure 13.1-1 Theoretical frequency range for lifetime measurement Data should be collected in a frequency range where the modulation ratio isn’t close 0 or 100%. The theoretical frequency range is shown in figure above. If user knows the estimated lifetime, user can simulate the frequency domain data and find the theoretical frequency range in Vinci Analysis. The actual frequency range will be limited by the instrument. Modulation should be greater than 2% for highest frequency for both sample and reference. PC1 User Manual 128 Chapter 13 13.2 Data Collection 13.2.1 Lifetime measurement In the Experiment and Instrument Control software window, go to the Experiment menu, and select ‘Time-Resolved” -> Lifetime (see figure below). Figure 13.2-1 A new experiment Tab will be displayed as in figure below. Fill in proper title, comment, excitation wavelength, reference lifetime and modulation frequency. Figure 13.2-2 Vinci lifetime experiment window Intensity and modulation values are updated every 100 ms and displayed at the lower left corner of Vinci. Click on Instrument Control tab, open the excitation and emission shutters, and check the DC intensity (500-5000 for all frequencies) and modulation (>2% for all frequencies) for both sample and reference. It is important to check these counts for the lowest and highest frequency used in the measurement. It is good to have similar intensities for the sample and the lifetime reference, one can match the intensities by diluting the sample showing the higher counts. Screens and neutral density filters can also be used to reduce the light intensity outgoing from more intensive solution. PC1 User Manual 129 Chapter 13 After matching the signal for the sample and the reference, open both the excitation and left emission shutters and adjust PMT gain settings in such a way to obtain maximum modulation frequency response. Note: Some solvents may produce scattering light, for example, ethanol at 280 nm excitation wavelength. Place a cuvette with only solvent in sample compartment and check the intensity, make sure the counts are small. Note: Light intensity may vary with frequencies; make sure you have proper intensity at all measured frequencies. Once you have a proper signal level for the sample and the reference, go to the Experiment tab and start the experiment by clicking green start button: Vinci will collect the data of sample and reference automatically if you have a two-cuvette sample compartment. If you have a one-cuvette sample compartment, Vinci will prompt you to change sample after the data collection for each sample is completed. 13.2.2 Anisotropy Measurement The lifetime of the sample should be measured before the anisotropy decay measurement. Even though it is possible retrieve the lifetime and rotational correlation time at the same time for a simple single lifetime and single rotational correlation time. Following general procedure in previous section to turn on instrument, prepare sample and select proper light source and filters. Push the polarizers into light path. In Experiment and Instrument Control software window, go to the Experiment menu, then to “Time-resolved” and select Anisotropy. Figure 13.2-3 In the displayed new experiment tab, fill in the proper title, comment, G-factor measurement option, excitation wavelength, reference lifetime and modulation frequency. PC1 User Manual 130 Chapter 13 Figure 13.2-4 Set up Anisotropy measurement In time-resolved anisotropy measurements the sample is measured at different polarizer positions, without the need for a reference. Go to Instrument Control, open excitation and emission shutters, check the counts for sample at different polarizer positions and make sure there are proper light intensities and modulation ratios for the lowest and highest frequency. Laser diodes provide typically polarized outputs. If the left emission intensity at the horizontal excitation polarizer position is very low, rotate the laser diode which should give higher intensity. Once you have a proper signal level for the sample, go to the experiment panel, and start the experiment by clicking green ‘start’ button. Vinci will collect the data of sample at different polarizer positions automatically. 13.2.3 Time-Resolved Spectrum Measurement Some compounds have different lifetime at different emission wavelength. Figure below shows the normalized 3-dimensional plot of the time-resolved spectrum of TNS in glycerol. The excitation source was a 300-nm LED, emission was scanned from 340 to 560 nm with a 2-nm step size and the frequency was scanned from 5-150 MHz. PC1 User Manual 131 Chapter 13 Figure 13.2-5 Normalized time-resolved spectrum of TNS in glycerol For time-resolved spectrum, data is collected through the monochromator which is usually at right side of the instrument. Remove the BNC cable from RF amplifier that is connected to PMT2 on Bias Tray and connect it to RF input of right emission PMT. Following the general procedure to prepare sample, select the proper light source and turn on instrument. Since light will be reduced a lot by the monochromator, a proper LED or Laser Diode will be a better light source for this measurement. In Experiment and Instrument Control software window, go to the Experiment menu, then to “Time-resolved” and select Spectrum. Figure 13.2-6 In displayed new experiment tab, fill in proper title, comment, modulation frequency. During the time-resolved measurement, Vinci will measure the sample at difference emission wavelength selected by user and measure the reference at one fixed emission wavelength. Fill in proper excitation wavelength and emission wavelength range for sample, reference lifetime and emission wavelength for reference. In time-resolved spectrum measurement the sample is measured at different monochromator wavelength. Go to Instrument Control, open excitation and right emission shutters, check the counts for sample at different wavelength (emission peak, lowest and highest wavelength) and make sure there are proper light intensities and modulation ratios for the frequency range to be acquired. PC1 User Manual 132 Chapter 13 Emission could be very weak at some wavelength, make sure that DC intensity is at least 100 counts for all the wavelengths. Adjust the experiment parameter if necessary. Once you have a proper signal level for the sample, go to the experiment panel and start the experiment by clicking green ‘start’ button. Vinci will collect the data of sample at different emission wavelength and reference at fixed wavelength automatically. 13.2.4 Phase-Resolved Spectra Measurement If sample is the mixture of compounds with know single lifetime, Vinci is able to measure the spectrum of the mixture and calculate the spectrum for each compound from their fluorescence fraction with the lifetime measurement. The measurement is similar to emission spectrum, except it is in time-resolved mode, lifetime is measured and the fraction of each component is used to obtain the separated spectrum for each component. Data is collected through the monochromator which is usually at right side of the instrument. Remove the BNC cable from RF amplifier that is connected to PMT2 on Bias Tray and connect it to RF input of right emission PMT. Following the general procedure to prepare sample, select the proper light source and turn on instrument. In Experiment and Instrument Control software window, go to the Experiment menu, then to “Time-resolved”->”Phase Resolved Spectra”->”Emission”. Figure 13.2-7 In displayed new experiment tab, fill in proper title, comment, modulation frequency. In the phaseresolved measurement, lifetime is measured at only one fixed frequency. Select a frequency that is in both compounds’ frequency range. During the phase-resolved measurement, Vinci will measure the sample at difference emission wavelength selected by user and measure the reference at one fixed emission wavelength. Fill in lifetime time, proper excitation wavelength and emission wavelength range for sample, lifetime and emission wavelength for reference. PC1 User Manual 133 Chapter 13 Figure 13.2-8 Go to Instrument Control, open excitation and right emission shutters, check the counts for sample at different wavelength (emission peak, lowest and highest wavelength) and make sure there are proper light intensities and modulation ratios at the selected frequency. Emission could be very weak at some wavelength, make sure that DC intensity is at least 100 counts for all the wavelengths. Adjust the experiment parameter if necessary. Once you have a proper signal level for the sample, go to the experiment panel and start the experiment by clicking green ‘start’ button. Vinci will collect the data of sample at different emission wavelength and reference at fixed wavelength automatically. The phase-resolved excitation spectrum is very similar to emission except that emission wavelength is fixed and excitation wavelength is variable and ratio with excitation should be checked. Follow the same procedure for the phase-resolved excitation spectrum. When “Time-resolved”->”Phase Resolved Spectra”->”Offline” option is selected, Vinci will collect the raw data. Spectrum calculation will be performed in Vinci Analysis. 13.3 Data analysis using Vinci software After you complete your measurements, save and open saved data file, using Vinci analysis program. For information about data analysis for time-resolved lifetime and anisotropy measurement, please refer to Vinci manual. PC1 User Manual 134 Chapter 14 Chapter 14: General Conditions PC1 User Manual 135 Chapter 14 14.1 General Conditions All ISS manufactured instruments are warranted against defective materials and workmanship for one year from the date of shipment. The instruments must be used for the function they have been designed for, as described in the instruction manual. A Return Material Authorization (RMA) number is required before returning any instrument to the ISS factory for repairs. Should this product malfunction during the warranty period, ISS will, at its option, repair or replace it at no charge, provided that the products have not been subjected to misuse, abuse, or unauthorized alterations, modifications, and/or repairs. All expressed and implied warranties for this product include, but are not limited to, the warranties of merchantability and fitness for a particular purpose, are limited in duration to the above one year period. Some states do not allow limitations on how long an implied warranty lasts, therefore the above limitations may not apply to you. Under no circumstances will ISS Inc. be liable in any way to the user for damages, including any lost profits, lost savings, or other incidental or consequential damages arising out of the use, or the inability to use, such products. 14.2 Expired Warranty ISS will repair instruments with expired warranty at the current part and labor prices. Please contact ISS customer support for more information. 14.3 Non-ISS Parts Although ISS Inc. may supply equipment manufactured by other companies, the only warranty that shall apply to such equipment is the warranty offered by the original manufacturer. 14.4 Field Service During the one year warranty period ISS Inc. will replace defective parts (parts and labor) free of charge. Travel and lodging expenses are paid by the customer. 14.5 Transportation Damage Packages should be carefully examined upon receipt for evidence of damage caused by shipping. If damage is noticed, notify ISS Inc. immediately. Preserve all packages, cartons and documents. PC1 User Manual 136