1
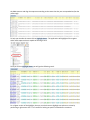
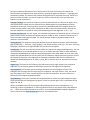
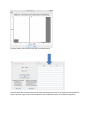
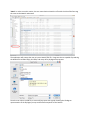
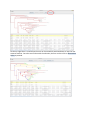
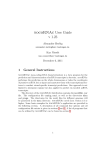
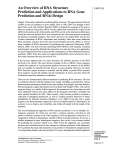
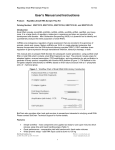
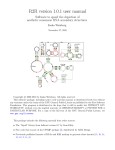
RNApasta User Manual, 2009 Dec 3rd
By Tim Shaw
Introduction
RNApasta is a Java application to calculate a variety of useful statistics related to RNA stem-loop and
pseudoknot structures. It will also perform a functions related to alignment editing, primarily the
generation of subsets of data where the original data set is heterogeneous with respect to some
structural feature.
The input data may be in a "pasta" formatted file, a variant of the fasta format; alternatively, the
program will also accept Stockholm formatted files as downloaded from the Rfam database. The "pasta"
format is defined in the Definition Section.
Design
RNApasta has a simple 4 pane user interface design (See figure below with the red 1-4 number labels).
Feel free to skip to the demo section as it is always much easier to learn about the application through
examples.
Pane 1: The top menu bar. This pane provides the user with functions to Save and Load Stockholm or
Pasta files, and it also has some commonly used function like Push Analysis Up which we will explain its
use in later section.
Pane 2: The file input textbox. This pane acts primarily as a medium for viewing, interpreting, parsing
and verifying the Stockholm or Pasta files inputted into the application. For most cases, the user can
actually ignore this portion. However, in our web-start version of RNApasta, for security reasons, we
disabled the File Load feature, so the file input pane is where the user inserts the Stockholm or
RNApasta text into the application.
Pane 3: File Output textboxes. This displays the results of the interpretation and is where the user can
view results from various functions executed within the application (Functions from Section 4).
Pane 4: The Function Selector. We designed this portion according to the classification of the function.
The user can perform an array of functions: sequence/structure editing, statistical analysis, alignment
analysis, and phylogenetic studies.
End User
This program is designed specifically for ncRNA researchers interested in studying the structural features
and variation within the same ncRNA family.
Availability
RNApasta is available at http://www.uga.edu/RNA-Informatics/software/RNApasta/. There is the
option of using either the java webstart or execute the program from source. RNApasta was compiled
using the Sun Java Development Kit version 1.6. Compiled versions (jar files) are available for Sun Java
1.5 or 1.6. The RNApasta.src.zip file contains the java code source, which you can compile yourself if
needed or desired. The files compile.bat (Windows) and compile.sh (Linux) contain a command for
compiling the code, while a jar file (Java archive) may be created from the compiled .class files using
jarcreate.bat (Windows) or jarcreate.sh (Linux).
Format Definition
Pasta Format:
The pasta format is built upon a fasta sequence alignment with the addition of two or one line(s) of
pairing indicators to indicate the RNA secondary structure:
; is a comment line
>pairs (the next line contains pairing indicator letters)
....AAAA....BBBB....aaaa....bbbb....AAAA..aaaa
>index (the next line contains index/subscript numbers)
....1111....1111....1111....1111....2222..2222.
>sequence label 1
GCUCAACCCAGUCAUUUGCCGGUUC---AAUGGCUAAACCCCGGUUG
>sequence label 2
UCGCAACCC--UCAUUUCGCGGUUCCAGAAUGGAUCAACCGCGGUUU
The pairing indicators are upper and lower case letters in the ">pairs" and numbers in the ">index" line.
Regions that pair with each other are indicated by corresponding upper and lower case letters, while the
numbers are used as subscripts to allow more than one pairing region using the same alphabetic letter.
The "." is used for space between pairing indicators, while "-" is used to indicate an alignment gap or
structural bulge in the sequences.
The base in each sequence in the column beneath the first A1 will pair with the corresponding base in
the column beneath the last a1. The base beneath the last B1 will pair with the base beneath the first b1.
In the example shown, pairing regions A1 a1 and B1 b1 form a pseudoknot.
Stockholm (Rfam) files get converted to Pasta by changing the <<..>> notation into the AA..aa notation,
as well as resolving the interleaved sequence format. The user may wish to compare the Stockholm pair
structure line with the computed Pasta format line to ensure the conversion makes sense.
Stockholm Format
This is a multiple sequence alignment format commonly used by RFam, a database containing
information on non-coding RNA. The RFam database can be accessed at http://rfam.janelia.org/
# STOCKHOLM 1.0
#=GF ID
UPSK
#=GF SE
Predicted; Infernal
#=GF SS
Published; PMID:9223489
#=GF RN
[1]
#=GF RM
9223489
#=GF RT
The role of the pseudoknot at the 3' end of turnip yellow mosaic
#=GF RT
virus RNA in minus-strand synthesis by the viral RNA-dependent RNA
#=GF RT
polymerase.
#=GF RA
Deiman BA, Kortlever RM, Pleij CW;
#=GF RL
J Virol 1997;71:5990-5996.
AF035635.1/619-641
UGAGUUCUCGAUCUCUAAAAUCG
M24804.1/82-104
UGAGUUCUCUAUCUCUAAAAUCG
J04373.1/6212-6234
UAAGUUCUCGAUCUUUAAAAUCG
M24803.1/1-23
UAAGUUCUCGAUCUCUAAAAUCG
#=GC SS_cons
.AAA....<<<<aaa....>>>>
//
RNApasta Demo
In the next few sections, we will introduce some of the functions of RNApasta.
Once you open the application, press Load File which is located on the top left corner of the application.
Open the file that contains either the Stockholm format or the Pasta format.
By this time the application will open the file in the input file and ask if the user wants to interpret the
file as either a pasta or Stockholm format. If the user press okay RNApasta will attempt to parse input
parse it to the output section.
The user could also just copy and paste the text from the Stockholm or Pasta file straight into the input
textbox. However, the user will need to press Interpret Input to continue with the processing. For
RFam users, this is particularly convenient to just copy the text from their database and input them into
RNApasta for analysis.
Once the user selects all the text on the top screen, the user can paste the Stockholm or Pasta text into
the Input Section and click on Interpret Input
At this point if you are not familiar with the pasta format we encourage the user to look at the
interpreted section. A particular utility of RNApasta is its capability to break apart various sections of
the RNA structure and align the sequence according to the stems that they are corresponded to (See the
yellow tags).
To help you visualize the stems click on Highlight Stems. The application will highlight all the regions
within each sequence that is capable of forming a stem.
Once you click on Highlight Stems you will get the following result.
For a lighter version of the highlight, the user can also choose to highlight one column at a time by
performing a right mouse click. This is useful for looking at specific nucleotide for covariance.
Move mouse beside a column with the cursor right of the stem and click on Pair Col. Highlight.
To provide a clean visualization of the structure of the RNA, we provided the capability of forming an arc
diagram representation of the structure which can be accessed this by clicking on Draw Arcs.
Analytical Functions
This section will go over the more technical routines that are used within the application.
The Analysis Tool Section contains a list of functions for obtaining structural information. The more
frequent used functions are the Stem Summary and Loop Summary. They will provide the user with a
summary of the size of the stem and distances between each stem.
Base Freq: This calculates the frequency of each base as a function of position in the alignment and
overall.
BasePair Freq Pos: This calculates the frequency of each possible basepair as a function of position in
the alignment. The pairing used is that indicated by the pairing indicator line in the pasta format. If the
pairing line indicates that position 2 pairs with position 670, then this function will calculate the
observed base-pair frequencies for these positions, omitting the alignment induced -:- or gap:gap pairs.
See below for details. This function will calculate the frequencies for both ends of the pair, hence for a
position 2:670 it will report a certain GC frequency, and for position 670:2 it will report the same
frequency as CG (asymmetric).
BasePair Freq Reg: This reports the frequency of each possible basepair as a function of regions. First,
overall frequencies of base-pairs are reported for the whole alignment, the pseudoknots, and nonpseudoknot stem-loops. A crossing helix is the stem of a pseudoknot which the program detects as
actually crossing another stem, and is indicated by an XXX in one of the comment lines. Second, the
base-pair frequencies are given for each of the labelled regions of the alignment - A, B, C .. etc.
BasePair Freq Stem Pos: For each region, this calculates the frequency of each base-pair as a function of
position within a stem, with positions reported as outer, middle, or inner. If there are 4 base-pairs in a
stem, the middle 2 would get averaged. The overall base-pair frequency by stem position over all
positions is also calculated.
Entropy By Pos: This computes relative and absolute entropy by alignment position, with and without
gaps. Entropy H(X) = - Sum over i [ P(Xi) log P(Xi) ], and relative entropy is H(P||Q) = Sum over i [ P(Xi) log
P(Xi)/Q(Xi) ] see Durbin et al. page 305-308. This uses the natural log base.
PseudoFreqs: This will recalculate the base and base-pair frequencies using pseudofrequencies. The user
can choose which set of pseudofrequencies to use, or to define their own, and then which method to
average the pseudofrequences with the measured frequencies. Zero-offset adds 1 to any 0 count; Fifty
weights the pseudofrequencies as if they were from 50 sequences; Square-Root uses the square root of
the number of sequences in the alignment as the weight, and Minimal Risk uses a modification of
Square-Root developed by Wu et al., 1999. J. Comp. Bio. 6: 219-235. Wu et al. discusses each of these
methods.
Region Freq: This measures the frequency with which each pairing region appears in the sequence
alignment, by not-counting sequences which have no bases in that region of the alignment.
Stem Summary: This function reports the length distributions of the subregions of stems. The
subregions are the length from the beginning of the sequence, the length of the 5' stem, the central
loop, the length of the 3' stem, and the length to the end of the sequence. Summary statistics are
followed by the complete length distributions.
Loop Summary: This function calculates the length distributions of each non-paired sequence region.
These are named by the flanking pairing regions, so that non-paired region "AB" is in between pairing
regions 'A' and 'B'.
We also provided functions for assisting the editing and alignment of the pasta sequences. E.g
extracting a portion of pseudoknot, or removing particular stem or loop region of the pasta sequence
etc... *Note* Some of these functions can result in a new modified RNApasta sequence alignment
which is why we have a Push Analysis Up Function. See example below
Non-Canonical: This function searches for non-canonical base-pairs, and marks them with a "!" beneath
them. Non-canonical is defined as anything other than A=U, G=C, or G=U. Bulges and gaps are also
indicated by "b" and "g" below the positions.
Extract PK: This function will extract one or more of the pseudoknot regions, creating an alignment of
just those regions. The Copy B to T function can then be used to copy the extracted pseudoknots to the
upper input textbox, after which Parse Pasta can be used, to generate an analysis of just this extracted
pseudoknot.
Extract Regions: This function will extract one or more of the pairing regions, creating an alignment of
just those regions. If there is a pseudoknot crossing region which begins within the area being extracted,
and which would pair with a region outside the area being extracted, then that pseudoknot pairing
region is erased from the Pasta lines, as it will having nothing with which to pair. The Push Analysis Up
function can then be used to copy the extracted regions to the upper input textbox, after which Parse
Pasta can be used, to generate an analysis of the extracted regions.
Alignment Subdivision Functions
Load an RFam file into RNApasta.
Click on Extract Regions.
Specify the start and end region and you will get the a new tab with the extracted region
If you want to perform the analysis on this new sequence press Push Analysis Up.
After you reinterpret the sequence you will be able to perform analysis on the new sequence, basically
the process can be recursively performed based on what the user is trying to achieve
Erase Region Labels: This will erase a pairing region (stem) from the pairing indicator line. It does not
alter any of the sequences themselves. After the erasure, an automatic copy bottom to top (push
analysis up) and re-interpret are available options. Pseudoknot Removal specifically removes all the
pseudoknots in the structure line to create an alignment that can be used by programs that do not
model pseudoknots.
Del Gap Cols: This function will remove columns from the alignment that contain a gap in all sequences
and also in the pairing indicator line. The Copy B to T function can then be used to start more analyses.
Partition By Stems: This allows the user to divide the data set in 2 based upon the size distribution of a
stem length. The dialog allows one to select the stem of interest, then the "Select By Histogram"
generates a histogram of the stem length distribution. A left mouse click selects the partition value. The
user has a choice of outputs. In one case the data is divided into 2 sets of sequences, one above and one
below the selected partition length for the selected stem. In the other case, whether a given sequence is
above or below the selected partition length for that stem is indicated by text added to the standard
label line. ^(D1>4.6)=1 This example indicates that for stem D1, the sequence that follows has a length
greater than 4.6. Remove Partition Tags will remove these.
Partition By Loops: This allows the user to divide the data set in 2 based upon the size distribution of a
loop length. The dialog allows one to select the loop of interest, then the "Select By Histogram"
generates a histogram of the loop length distribution. A left mouse click selects the partition value. The
user has a choice of outputs. In one case the data is divided into 2 sets of sequences, one above and one
below the selected partition length for the selected loop. In the other case, whether a given sequence is
above or below the selected partition length for that loop is indicated by text added to the standard
label line. ^(c1D1>3.6)=0 This example indicates that for loop c1D1, the sequence that follows has a
length less than 3.5.
Phylogenetic Functions
Phylogenetic study on the stem/loop length variation is one of the most novel features of RNApasta.
Press Partition by Stems.
Select the Stem that will be used to partition the sequences and click on Select Length for One Region.
*Note* The user at this step can also choose to Select Length for All Regions and it will prompt the user
with a series of Histograms
Select the criteria value for the partition and Press OK. At this step, the user could also choose to save
this image.
The Data Viewer will show the stem that will be partitioned.
On the bottom you will have the choice of either partitioning the entire list of sequence into two dataset
or put a partition tag on each of those sequences (we’ll explain the utility of the partition tag later).
Once user clicks on Into Two Sets the program will put the two dataset into two Pasta formatted text.
The user can now have the option of performing further analysis on the subsequences.
Now let’s take a step back to the previous screen and consider the scenario in which the user clicks on
Into Label Line.
The following partition tag will be added to the new pasta output. This is crucial for the phylogenetic
study pipeline.
To initiate the Phylogenetic routine, click on Phylogenetic Stem/Loop Parse.
*Note* In order to use this routine, the user must obtain a Newick tre file with the title of the fasta tag
the same as the Newick node name.
The application will prompt the user to input a Newick/TRE file. Programs that are capable of producing
the Newick file includes Phylip, R-Coffee, and many other phylogenetic programs
Once the user selects a valid file, a screen will pop open with a graph showing the Cladogram
representation of the Phylogeny on top and the Pasta sequence on the bototm.
On the top right there is a combo-box the user can choose which partitioned stem or loop the user
wants to examine. Once the user finishes with the selection, the user can then click on Intersection
Union to proceed.
Once the user click on Save Tree will prompt dialog for saving the tree as an Image. The following is the
full image output.