1
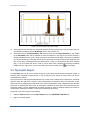
The eG Reporter
eG Enterprise v6
Restricted Rights Legend
The information contained in this document is confidential and subject to change without notice. No part of this
document may be reproduced or disclosed to others without the prior permission of eG Innovations, Inc. eG
Innovations, Inc. makes no warranty of any kind with regard to the software and documentation, including, but not
limited to, the implied warranties of merchantability and fitness for a particular purpose.
Trademarks
Microsoft Windows, Windows NT, Windows 2000, Windows 2003 and Windows 2008 are either registered trademarks
or trademarks of Microsoft Corporation in United States and/or other countries.
The names of actual companies and products mentioned herein may be the trademarks of their respective owners.
Copyright
© 2015 eG Innovations, Inc. All rights reserved.
The copyright in this document belongs to eG Innovations, Inc. Complying with all applicable copyright laws is the
responsibility of the user.
Table of Contents
THE EG REPORTER .................................................................................................................................................................... 1
GETTING FAMILIAR WITH THE EG REPORTER USER INTERFACE ......................................................................... 11
2.1
How to schedule printing/mailing of a generated report? ............................................................................................... 13
2.2
How to save the report as a favorite? .............................................................................................................................. 21
REPORT CONFIGURATION .................................................................................................................................................... 26
3.1
Default Reports ............................................................................................................................................................... 26
3.2
Specific Reports .............................................................................................................................................................. 33
3.3
User Reports ................................................................................................................................................................... 38
3.4
Consolidated Reports ...................................................................................................................................................... 42
3.5
Configuring Percentile Values for Custom Capacity Planning Report ........................................................................... 46
3.6
Configuring the Capacity Planning Reports .................................................................................................................... 48
3.7
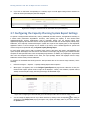
Configuring the Capacity Planning System Report Settings ........................................................................................... 50
3.8
Procedure for discovering the domains of the Security Groups ...................................................................................... 51
THE EXECUTIVE SUMMARY REPORTS ............................................................................................................................. 57
4.1
Executive Summary By Component Reports .................................................................................................................. 58
4.2
Executive Summary By Segment Reports ...................................................................................................................... 65
4.3
Executive Summary By Service Reports ........................................................................................................................ 71
4.4
Executive Summary By Component Type Reports ......................................................................................................... 77
THE OPERATIONAL KPI REPORTS...................................................................................................................................... 84
5.1
Network Performance Reports ........................................................................................................................................ 84
5.2
System Performance Reports .......................................................................................................................................... 96
5.3
Application Reports ...................................................................................................................................................... 108
5.4
Site Reports ................................................................................................................................................................... 117
5.5
Top Events Report ........................................................................................................................................................ 122
5.6
Uptime/Downtime Analysis Reports ............................................................................................................................ 132
5.7
History of Alarms ......................................................................................................................................................... 139
5.8
History of Unknowns .................................................................................................................................................... 144
CONSOLIDATED ANALYSIS REPORTS ............................................................................................................................. 149
6.1
Server Performance Report ........................................................................................................................................... 149
6.2
Zone Performance Report ............................................................................................................................................. 155
6.3
Services Report ............................................................................................................................................................. 167
6.3.1
Services Health Report.......................................................................................................................................... 167
6.3.2
Web Transaction Analysis Report ......................................................................................................................... 173
6.3.3
IIS Transaction Analysis Report ........................................................................................................................... 176
6.4
KPI Health Report......................................................................................................................................................... 182
COMPARISON REPORTS ....................................................................................................................................................... 193
7.1
Components Comparison Report .................................................................................................................................. 193
7.2
Tests Comparison Report .............................................................................................................................................. 202
7.3
Top N Reports ............................................................................................................................................................... 211
MEASUREMENT SNAPSHOT REPORTS ............................................................................................................................ 220
8.1
Snapshot Reports - Component ..................................................................................................................................... 220
8.2
Tests Snapshot Reports ................................................................................................................................................. 226
VIRTUALIZATION REPORTS ............................................................................................................................................... 233
9.1
Physical Servers – Hypervisor Overview Report .......................................................................................................... 233
9.2
Physical Servers - Resources Report ............................................................................................................................. 244
9.3
Physical Servers – Capacity Report .............................................................................................................................. 249
9.4
Virtual Machines – VMs Overview Report................................................................................................................... 255
9.5
Virtual Machines – VM Details Report ........................................................................................................................ 265
9.6
The VM Sprawl Report ................................................................................................................................................. 281
9.7
Virtual Machines - VM Changes Report ....................................................................................................................... 287
9.8
The Virtual Machines – VM Distribution Report ......................................................................................................... 291
9.9
The Virtual Machines – VM Capacity Planning Report ............................................................................................... 302
9.10
The User VMs Report ............................................................................................................................................... 309
9.11
Virtual Machines - Right Sizing Report .................................................................................................................... 317
9.12
The Virtualization Manager Report .......................................................................................................................... 322
9.13
Cluster Details Report ............................................................................................................................................... 337
9.14
Cluster - Resource Pools Report ............................................................................................................................... 346
9.15
Cluster - Physical Servers Report.............................................................................................................................. 369
9.16
Cluster - Virtual Machines Report ............................................................................................................................ 386
9.17
Cluster VM Sprawl Report........................................................................................................................................ 399
9.18
Cluster Capacity Planning Report ............................................................................................................................. 405
9.19
Datacenters Report .................................................................................................................................................... 409
9.20
VMotion Report ........................................................................................................................................................ 426
9.21
Datastores Report ...................................................................................................................................................... 451
9.22
Uptime Reports ......................................................................................................................................................... 464
CITRIX / VDI REPORTS .......................................................................................................................................................... 473
10.1
Zone Performance Report ......................................................................................................................................... 473
10.2
User Session Details Report ...................................................................................................................................... 487
10.3
User Activity Report ................................................................................................................................................. 497
10.4
User Session Analysis Report ................................................................................................................................... 507
10.5
Application Activity Report ...................................................................................................................................... 522
10.6
Application Usage Report ......................................................................................................................................... 536
10.7
User Logon Performance Report............................................................................................................................... 540
10.8
VDI Assessment Reports .......................................................................................................................................... 547
10.8.1
VDI Resource Usage report .................................................................................................................................. 547
10.8.2
VDI Application Activity Report .......................................................................................................................... 558
10.9
Application Launch Report ....................................................................................................................................... 563
CAPACITY PLANNING REPORTS ....................................................................................................................................... 573
11.1
System Capacity Analysis Report ............................................................................................................................. 573
11.2
Custom Capacity Analysis Report ............................................................................................................................ 584
11.3
Prediction Analysis Report ....................................................................................................................................... 589
11.4
Cumulation Analysis Report ..................................................................................................................................... 597
11.5
Correlation Analysis Report ...................................................................................................................................... 601
CONSOLIDATED EVENT LOG ANALYSIS REPORTS ..................................................................................................... 609
CONCLUSIONS ......................................................................................................................................................................... 614
Table of Figures
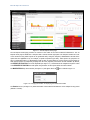
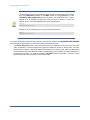
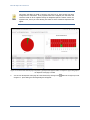
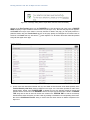
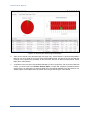
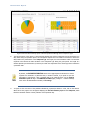
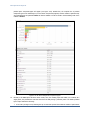
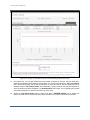
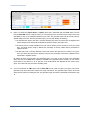
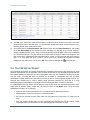
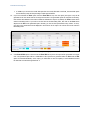
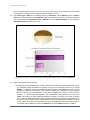
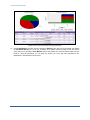
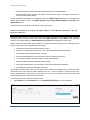
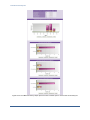
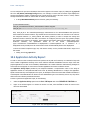
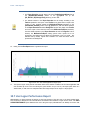
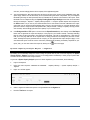
Figure 1.1: The eG Reporter Home page ................................................................................................................................................................... 2
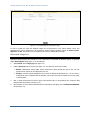
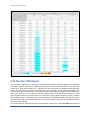
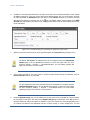
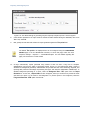
Figure 1.2: Changing the duration for displaying the infrastructure health ................................................................................................................ 2
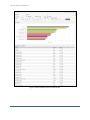
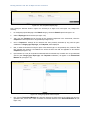
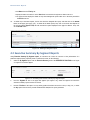
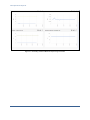
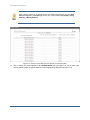
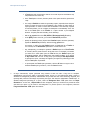
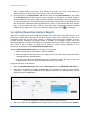
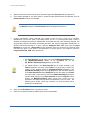
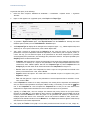
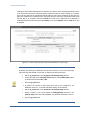
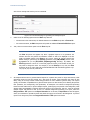
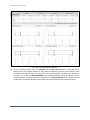
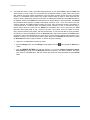
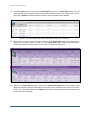
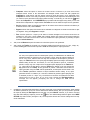
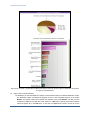
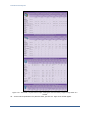
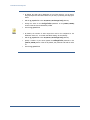
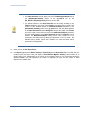
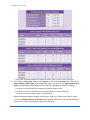
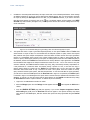
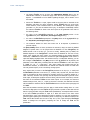
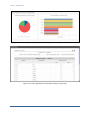
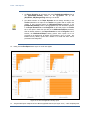
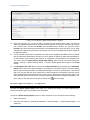
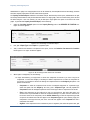
Figure 1.3: Event Analysis report for a particular day ............................................................................................................................................... 4
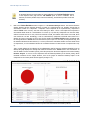
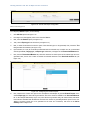
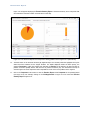
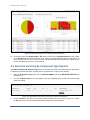
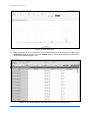
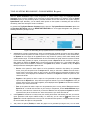
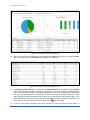
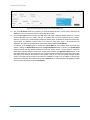
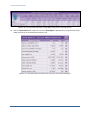
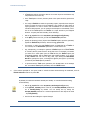
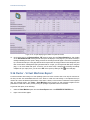
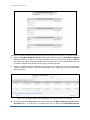
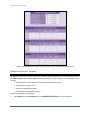
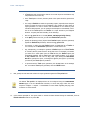
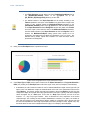
Figure 1.4: Executive Report of the Component that encountered unresolvable problems ........................................................................................ 5
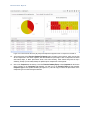
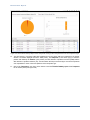
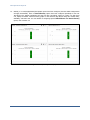
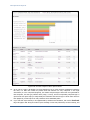
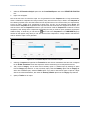
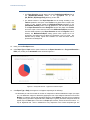
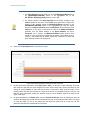
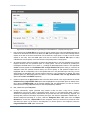
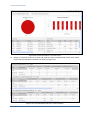
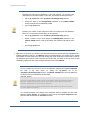
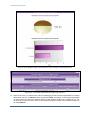
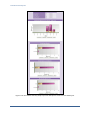
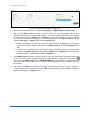
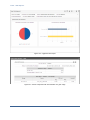
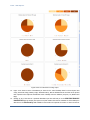
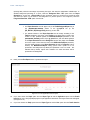
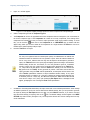
Figure 1.5: An Executive Service Report that appears upon clicking on a bar in the Services Health section of the Reporter Home ....................... 6
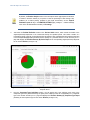
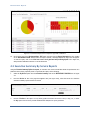
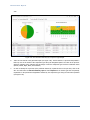
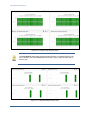
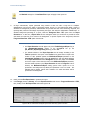
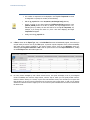
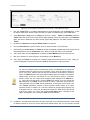
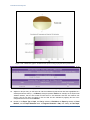
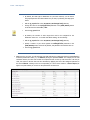
Figure 1.6: An Executive Summary By Component Type Report that appears when a Component Type’s bar graph in the Reporter Home page is
clicked .............................................................................................................................................................................................................. 7
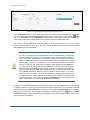
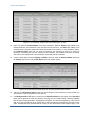
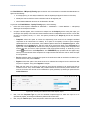
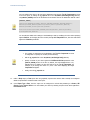
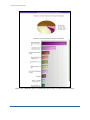
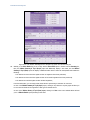
Figure 1.7: The File download dialog box ................................................................................................................................................................. 8
Figure 1.8: Saving the report as a PDF file ................................................................................................................................................................ 8
Figure 1.9: Defining the printer settings .................................................................................................................................................................... 9
Figure 1.10: Sending mails directly to specific recipients ....................................................................................................................................... 10
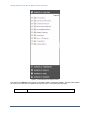
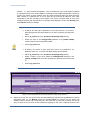
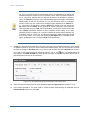
Figure 2.1: The Reporter menu sequence tree ......................................................................................................................................................... 12
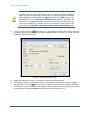
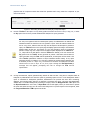
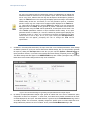
Figure 2.2: Adding a new schedule ......................................................................................................................................................................... 13
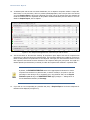
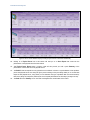
Figure 2.3: Adding a new schedule for a generated data report ............................................................................................................................... 16
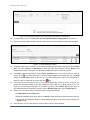
Figure 2.4: Clicking on the Schedules link ............................................................................................................................................................. 17
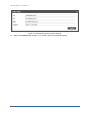
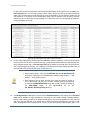
Figure 2.5: Viewing the list of schedules................................................................................................................................................................. 18
Figure 2.6: Link to modify your scheduled report details ........................................................................................................................................ 18
Figure 2.7: Viewing scheduled reports saved as PDF files ...................................................................................................................................... 20
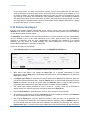
Figure 2.8: Specifying the Report Name under which the report conditions are to be saved ................................................................................... 22
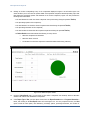
Figure 2.9: A message stating that the Report Name has been saved successfully .................................................................................................. 24
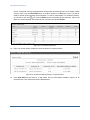
Figure 2.10: List of Report Names ......................................................................................................................................................................... 24
Figure 2.11: Selecting the favorites to be hidden ..................................................................................................................................................... 25
Figure 3.1: The eG Default Reports page ................................................................................................................................................................ 26
Figure 3.2: The Default Report Configuration page ................................................................................................................................................ 27
Figure 3.3: Measures associated with the selected test ............................................................................................................................................ 28
Figure 3.4: Associating the measures with the specified report type ....................................................................................................................... 28
Figure 3.5: Updating the association for a default network report ........................................................................................................................... 29
Figure 3.6: Configuring a default network summary report..................................................................................................................................... 29
Figure 3.7: Specifying the measures for which default system reports are to be generated ..................................................................................... 30
Figure 3.8: Clicking the Add to Summary button for generating the System Summary Reports ............................................................................. 30
Figure 3.9: Specifying the measures for which default application reports are to be generated ............................................................................... 31
Figure 3.10: List of measures for which default application reports are to be generated ......................................................................................... 32
Figure 3.11: Specifying the measures for which default service reports are to be generated ................................................................................... 33
Figure 3.12: Adding the measures to generate the Site specific Summary reprots................................................................................................... 33
Figure 3.13: The eG Specific Reports page ............................................................................................................................................................. 34
Figure 3.14: Configuring specific network reports .................................................................................................................................................. 34
Figure 3.15: Associating the Measures for configuring the Network Specific reports ............................................................................................. 35
Figure 3.16: Configuring specific system reports .................................................................................................................................................... 36
Figure 3.17: Associating the measures of the Application Process test ................................................................................................................... 37
Figure 3.18: Associating the measures of the OracleLocks test ............................................................................................................................... 37
Figure 3.19: Configuring specific site reports ......................................................................................................................................................... 38
Figure 3.20: The eG User Report configuration ...................................................................................................................................................... 39
Figure 3.21: Configuring user network reports........................................................................................................................................................ 39
Figure 3.22: Configuring user application reports ................................................................................................................................................... 41
Figure 3.23: Configuring user-specific service reports ............................................................................................................................................ 42
Figure 3.24: Defining the Consolidated and Citrix/VDI Report Defaults ................................................................................................................ 43
Figure 3.25: Selecting the measures to be displayed in a Consolidated Zone report ................................................................................................ 44
Figure 3.26: Measures associated with the Default Component type ...................................................................................................................... 45
Figure 3.27: Selecting the measures to be displayed in a Consolidated Server report ............................................................................................. 45
Figure 3.28: Viewing the list of percentile policies ................................................................................................................................................. 46
Figure 3.29: Adding a new policy ........................................................................................................................................................................... 47
Figure 3.30: Modifying a percentile policy ............................................................................................................................................................. 47
Figure 3.31: Deleting a percentile policy ................................................................................................................................................................. 48
Figure 3.32: Associating the percentile policy with a test ....................................................................................................................................... 49
Figure 3.33: Viewing the percentile policies that pre-exist...................................................................................................................................... 49
Figure 3.34: Viewing the measures that are associated with a percentile policy ...................................................................................................... 50
Figure 3.35: Configuring the thresholds that govern the 95th percentile value of resource usage metrics ............................................................... 50
Figure 3.36: Changing the display name of the measure ......................................................................................................................................... 51
Figure 3.37: The AD User Reports page ................................................................................................................................................................. 52
Figure 3.38 : Adding a domain ................................................................................................................................................................................ 52
Figure 3.39: Domains configured for generating the User Session Details report ................................................................................................... 53
Figure 3.40: Choosing the Security groups for which the User Session Details report is to be generated ............................................................... 53
Figure 3.41: Viewing the chosen Security groups ................................................................................................................................................... 54
Figure 3.42: Viewing the configured Security groups ............................................................................................................................................. 55
Figure 3.43: Specifying the Settings for discovering the Security groups ............................................................................................................... 56
Figure 4.1: Types of Executive Summary Reports .................................................................................................................................................. 58
Figure 4.2: Generating the Executive Summary By Component Report ................................................................................................................. 59
Figure 4.3: The generated Executive Summary By Component report .................................................................................................................... 60
Figure 4.4: The Snapshot that appears when a slice in the pie chart is clicked ........................................................................................................ 61
Figure 4.5: The Snapshot Report which appears when the bar corresponding to a particular date is clicked ........................................................... 62
Figure 4.6: The history of alarms corresponding to the layer clicked on ................................................................................................................. 62
Figure 4.7: The history of alarms pertaining to the layer clicked on ........................................................................................................................ 63
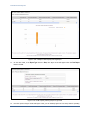
Figure 4.8: Data plotted on the bar graph ................................................................................................................................................................ 63
Figure 4.9: A message indicating that the report is being processed in the background .......................................................................................... 64
Figure 4.10: List of Background reports .................................................................................................................................................................. 64
Figure 4.11: Deleting a background report .............................................................................................................................................................. 65
Figure 4.12: Generating an Executive Summary By Segment report ...................................................................................................................... 65
Figure 4.13: The Executive Summary By Segment Report ..................................................................................................................................... 67
Figure 4.14: The Executive Summary report of the Component that is the root-cause of the problems in the segment .......................................... 68
Figure 4.15: The Executive Report of the Component causing problems in the segment on a particular day .......................................................... 69
Figure 4.16: The Executive Summary By Component Report that appears when a component is clicked on ......................................................... 70
Figure 4.17: Executive Report of the Component Type that is clicked on ............................................................................................................... 71
Figure 4.18: Generating an Executive Summary By Service Report ....................................................................................................................... 71
Figure 4.19: The Executive Summary By Service Report ....................................................................................................................................... 73
Figure 4.20: Executive Summary Report of the Component causing problems in the service performance ............................................................ 74
Figure 4.21: Executive Summary Report of the Component on a particular day ..................................................................................................... 75
Figure 4.22: Executive Summary Report of the Component that is clicked ............................................................................................................ 76
Figure 4.23: Executive Report of the Component that was clicked on .................................................................................................................... 77
Figure 4.24: Generating an Executive Summary By Component Type Report........................................................................................................ 77
Figure 4.25: The Executive Summary By Component Type Report ........................................................................................................................ 79
Figure 4.26: Executive Summary report of the Component that belongs to the Component Type .......................................................................... 80
Figure 4.27: Executive Summary Report of the Component causing a fall in the performance of the Component Type ........................................ 81
Figure 4.28: Executive Summary report of the Component that is clicked on ......................................................................................................... 82
Figure 4.29: Executive Summary report of the Component clicked on in the SUMMARY OF EVENTS section .................................................. 83
Figure 5.1: Providing the report specifications ........................................................................................................................................................ 84
Figure 5.2: Selecting the Service option from the Report for list............................................................................................................................. 85
Figure 5.3: Selecting the Segment option from the Report for list ........................................................................................................................... 85
Figure 5.4: Selecting the Zone option from the Report for list ................................................................................................................................ 86
Figure 5.5: The MORE OPTIONS drop down window for generating a Network Performance report ................................................................... 87
Figure 5.6: Generating a Detailed Network Performance Measure Report .............................................................................................................. 89
Figure 5.7: Generating a Network Measure Report using Trend data ...................................................................................................................... 90
Figure 5.8: A message stating that only the Trend option is supported for the given Timeline ............................................................................... 91
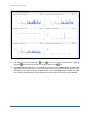
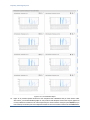
Figure 5.9: A sample Daily Summary report ........................................................................................................................................................... 92
Figure 5.10: A sample Hourly Summary report....................................................................................................................................................... 93
Figure 5.11: A sample Monthly Summary report .................................................................................................................................................... 93
Figure 5.12: The list of values that have been plotted on a particular graph ............................................................................................................ 94
Figure 5.13: An enlarged graph ............................................................................................................................................................................... 95
Figure 5.14: The detailed diagnosis of the measure associated with the enlarged graph ......................................................................................... 95
Figure 5.15: Providing the System Performance report specification ...................................................................................................................... 96
Figure 5.16: The default settings for generating the System Performance report .................................................................................................... 98
Figure 5.17: Generating System Overview Reports .............................................................................................................................................. 102
Figure 5.18: Generating the Top System Resource Consumers report................................................................................................................... 103
Figure 5.19: The default settings for the Top System Resource Consumers report ............................................................................................... 105
Figure 5.20: The Top System ReSource Consumers report ................................................................................................................................... 108
Figure 5.21: Generating the Application Performance report ................................................................................................................................ 108
Figure 5.22: The default settings for generating the Application Performance report ........................................................................................... 110
Figure 5.23: The Application Performance report ................................................................................................................................................. 114
Figure 5.24: Enlarged OracleTablespaces test graph displaying the descriptors (the tablespaces)......................................................................... 115
Figure 5.25: Graph of the top 5 space consuming tablespaces ............................................................................................................................... 116
Figure 5.26: Viewing the report for tablespaces that consume space in the range of 20-27% ............................................................................... 117
Figure 5.27: Generating a Site Operations report .................................................................................................................................................. 117
Figure 5.28: The default settings for the Website Performance report ................................................................................................................... 119
Figure 5.29: The Website Performance report ....................................................................................................................................................... 122
Figure 5.30: Event Analysis for a particular zone.................................................................................................................................................. 123
Figure 5.31: Event analysis across the environment .............................................................................................................................................. 123
Figure 5.32: An Event Analysis for Components .................................................................................................................................................. 126
Figure 5.33: An Event Analysis for Component-types .......................................................................................................................................... 127
Figure 5.34: An Event Analysis for Tests .............................................................................................................................................................. 129
Figure 5.35: An Event Analysis for Alarm Priorities............................................................................................................................................. 130
Figure 5.36: An Event Analysis for all the options offered ................................................................................................................................... 131
Figure 5.37: Specifying the criteria for Uptime/Downtime Analysis reports ......................................................................................................... 132
Figure 5.38: The default settings for generating the Uptime/Downtime Analysis reports ..................................................................................... 134
Figure 5.39: The Uptime Graph for Chosen Components ..................................................................................................................................... 136
Figure 5.40: Additional uptime details .................................................................................................................................................................. 137
Figure 5.41: The Uptime Data Report ................................................................................................................................................................... 138
Figure 5.42: The Reboot Details appearing in a separate window ......................................................................................................................... 138
Figure 5.43: The Uptime Data report displaying reboot details as well ................................................................................................................. 139
Figure 5.44: Generating the History of Alarms report ........................................................................................................................................... 140
Figure 5.45: The default settings for generating the History of Alarms report ...................................................................................................... 141
Figure 5.46: The HISTORY OF ALARMS report ................................................................................................................................................ 143
Figure 5.47: Generating a History of Unknowns report ......................................................................................................................................... 145
Figure 5.48: The default settings of the History of Unknowns report .................................................................................................................... 146
Figure 5.49: The HISTORY OF UNKNOWNS report .......................................................................................................................................... 148
Figure 6.1: Generating a Consolidated Server Report ........................................................................................................................................... 149
Figure 6.2: The default settings for generating a Server Performance report ......................................................................................................... 150
Figure 6.3: The Server Performance Report .......................................................................................................................................................... 153
Figure 6.4: Graph of a measure in the Server report .............................................................................................................................................. 154
Figure 6.5: An additional 'Show virtual machine' flag appearing if the 'Server' chosen is a virtualized component .............................................. 154
Figure 6.6: A Server Performance report for a virtual machine ............................................................................................................................. 155
Figure 6.7: Generating a Consolidated Zone Report.............................................................................................................................................. 156
Figure 6.8: The default settings for generating the Zone Performance report ........................................................................................................ 157
Figure 6.9: A graphical Zone Performance report ................................................................................................................................................. 161
Figure 6.10: A list of components with CPU utilization in a given range ............................................................................................................. 163
Figure 6.11: The server report that appears upon clicking on a bar chart .............................................................................................................. 164
Figure 6.12: The Zone Data Report ....................................................................................................................................................................... 165
Figure 6.13: The Executive report of the problem server in the zone performance report ..................................................................................... 166
Figure 6.14: The server report that appears when a server in the Consolidated Zone Data Report is clicked ........................................................ 166
Figure 6.15: Generating the Services Health report ............................................................................................................................................... 167
Figure 6.16: The default settings for generating the Services health report ........................................................................................................... 168
Figure 6.17: The Service Health report with 'Show Transactions' on .................................................................................................................... 170
Figure 6.18: The ServicesHealth report without the Show Transactions flag ........................................................................................................ 171
Figure 6.19: The individual component’s performance for the IIS webserver ....................................................................................................... 172
Figure 6.20: Shows the event analysis for the IIS web server ................................................................................................................................ 173
Figure 6.21: Generating the Web transaction Analysis report ............................................................................................................................... 174
Figure 6.22: The default settings for generating the Web Transaction Analysis report ......................................................................................... 174
Figure 6.23: The performance of the website hosted by a Web server .................................................................................................................. 176
Figure 6.24: Consolidated Reports- IIS Transaction Analysis .............................................................................................................................. 177
Figure 6.25: The default settings for generating the IIS Transaction Analysis report ............................................................................................ 178
Figure 6.26: IIS Transaction Analysis report when Summary option is chosen ..................................................................................................... 179
Figure 6.27: IIS Transaction Analysis report when Details option is chosen ......................................................................................................... 181
Figure 6.28: IIS Transaction Analysis report when Summary & Details option is chosen .................................................................................... 181
Figure 6.29: Generating the KPI Health report ..................................................................................................................................................... 182
Figure 6.30: The default settings for generating the KPI Health report ................................................................................................................. 184
Figure 6.31: The KPI Heath Report ....................................................................................................................................................................... 186
Figure 6.32: The KPI Health Report when the ‘By Component’ option is chosen ................................................................................................ 188
Figure 6.33: The KPI Health report when the By Infrastructure Tier option is clicked ......................................................................................... 189
Figure 6.34: The pop up window that lists the currently existing problems in the layer ........................................................................................ 190
Figure 6.35: The Problem History pop up window................................................................................................................................................ 191
Figure 6.36: The detailed diagnosis of the chosen measure ................................................................................................................................... 191
Figure 6.37: The pop up window displaying the health of the metric associated with the chosen Component Type ............................................. 192
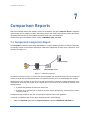
Figure 7.1: A sample environment ........................................................................................................................................................................ 193
Figure 7.2: Generating a Comparison report ......................................................................................................................................................... 194
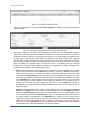
Figure 7.3: Defining the configuration for generating the Comparison report ....................................................................................................... 194
Figure 7.4: Adding the measures to be compared .................................................................................................................................................. 195
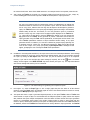
Figure 7.5: The default settings for generating the Comparison reports ................................................................................................................ 196
Figure 7.6: A single comparison graph .................................................................................................................................................................. 199
Figure 7.7: Graph for each of the measures chosen for comparison ...................................................................................................................... 200
Figure 7.8: Choosing independent components for comparison ............................................................................................................................ 201
Figure 7.9: Choosing the segment components to be compared ............................................................................................................................ 201
Figure 7.10: Choosing the zone components to be included in the comparison ..................................................................................................... 202
Figure 7.11: Generating the Comparison reports for tests ..................................................................................................................................... 203
Figure 7.12: Specifying the criteria for Comparison Reports - Tests ..................................................................................................................... 203
Figure 7.13: Selecting a Test, Measure, and Component for comparison .............................................................................................................. 204
Figure 7.14: Selecting from a pre-defined list of metrics....................................................................................................................................... 205
Figure 7.15: The default settings for generating a Comparison Reports - Tests .................................................................................................... 207
Figure 7.16: A comparison report displaying individual graphs for every chosen component .............................................................................. 210
Figure 7.17: A single graph comparing the CPU utilization across components ................................................................................................... 211
Figure 7.18: Selecting the Test, Measure, and Components to be compared ......................................................................................................... 212
Figure 7.19: The default settings for generating a Top – N Analysis report .......................................................................................................... 214
Figure 7.20: A Top N Graph Report where the Weighted Average flag is set to 'Yes' .......................................................................................... 217
Figure 7.21: The Top-N Graph report where the Weighted Average flag is set to 'No' ......................................................................................... 218
Figure 7.22: A Top N Data Report where the Weighted Average flag is set to 'Yes' ............................................................................................. 218
Figure 7.23: A Top N Data Report where the Weighted Average flag is set to 'No' .............................................................................................. 219
Figure 8.1: Generating a Snapshot report for a chosen component........................................................................................................................ 221
Figure 8.2: The default settings for generating a Snapshot report for a chosen component ................................................................................... 222
Figure 8.3: The Tests pop up window ................................................................................................................................................................... 223
Figure 8.4: The Snapshot report of a chosen component displaying metrics of an Abnormal state ....................................................................... 225
Figure 8.5: Generating a Snapshot report for a chosen test.................................................................................................................................... 227
Figure 8.6: The default settings for generating a snapshot report for a chosen test ................................................................................................ 228
Figure 8.7: The Tests Snapshot report displaying metrics in the Critical state alone ............................................................................................. 229
Figure 8.8: The Snapshot Report for a chosen test ................................................................................................................................................ 231
Figure 8.9: Snapshot Data ..................................................................................................................................................................................... 232
Figure 9.1: Selecting the report criteria for a Physical Servers report .................................................................................................................... 234
Figure 9.2: The default settings for generating the Physical Servers – Hypervisor Overview Report .................................................................... 235
Figure 9.4: A list of components with Physical CPU utilization in a given range ................................................................................................. 239
Figure 9.5: The server report that appears upon clicking on a bar chart in the Physical Servers report ................................................................. 240
Figure 9.6: A Physical Servers – Hypervisor Overview Data Report .................................................................................................................... 241
Figure 9.7: An Executive report of a virtual host................................................................................................................................................... 242
Figure 9.8: The Server report of the problem server .............................................................................................................................................. 242
Figure 9.9: A summary of the report criteria ......................................................................................................................................................... 243
Figure 9.10: Selecting the criteria for the Physical Servers - Resources report...................................................................................................... 245
Figure 9.11: The Physical Servers - Resources report ........................................................................................................................................... 247
Figure 9.12: Data report of the Overall physical CPU utilization measure on a daily basis .................................................................................. 249
Figure 9.13: Selecting the criteria for the Physical Servers - Capacity report ........................................................................................................ 250
Figure 9.14: The default settings for generating a Physical Servers – Capacity report .......................................................................................... 251
Figure 9.15: The Physical Servers - Capacity report ............................................................................................................................................. 253
Figure 9.16: The Physical Servers - Capacity report that is generated when the VMs option is selected .............................................................. 254
Figure 9.17: The Physical Servers - Capacity report that is generated when the Hosts & VMs option is selected ................................................. 255
Figure 9.18: Selecting the criteria for a Virtual Machines – VMs Overview report............................................................................................... 256
Figure 9.19: The default settings for generating the Virtual machines – VMs Overview report ............................................................................ 258
Figure 9.20: A Virtual Machines - VMs Overview graph report ........................................................................................................................... 260
Figure 9.21: A list of components with Physical CPU utilization in a given range ............................................................................................... 261
Figure 9.22: A Virtual Machine – VMs Overview Data Report ............................................................................................................................ 263
Figure 9.23: Specifying the criteria for generating the PHYSICAL RESOURCES USAGE report ......................................................................... 266
Figure 9.24: The default settings for generating a Physical Resources Usage report ............................................................................................. 267
Figure 9.25: A graphical Physical Resources Usage report ................................................................................................................................... 271
Figure 9.26: A Physical Resources Usage report of type Data .............................................................................................................................. 272
Figure 9.27: A Virtual Machines report revealing the health of each VM discovered on a chosen virtual host ..................................................... 273
Figure 9.28: Specifying the criteria for generating the Virtual Resources Usage report ........................................................................................ 273
Figure 9.29: The default settings for generating the Virtual Resources Usage report ............................................................................................ 276
Figure 9.30: A graphical Virtual Resources Usage report ..................................................................................................................................... 279
Figure 9.31: A Virtual Resources Usage report of type Data................................................................................................................................. 280
Figure 9.32: A Virtual Machines report revealing the health of each VM discovered on a chosen virtual host ..................................................... 281
Figure 9.33: Providing the specifications for the VM SPRAWL report ................................................................................................................ 282
Figure 9.34: The default settings for generating the VM Sprawl report................................................................................................................. 284
Figure 9.35: Graph showing the Powered On state of the VMs ............................................................................................................................. 285
Figure 9.36: Data report of the VMs in ESX environments ................................................................................................................................... 286
Figure 9.37: Data report of the VMs in VDI environments ................................................................................................................................... 287
Figure 9.38: Selecting the criteria for the VM Changes report .............................................................................................................................. 288
Figure 9.39: The default settings for generating the VM changes report ............................................................................................................... 289
Figure 9.40: The VM Changes report .................................................................................................................................................................... 291
Figure 9.41: Selecting the criteria for the Virtual machines - VM Distribution report........................................................................................... 292
Figure 9.42: The default settings for generating the Virtual Machines – VM Distribution report ......................................................................... 294
Figure 9.43: A graphical VM Distribution report .................................................................................................................................................. 297
Figure 9.44: Details of the hosts that fall within the distribution range clicked on ................................................................................................ 297
Figure 9.45: A Server Report revealing the overall performance of the ESX server clicked on ............................................................................ 300
Figure 9.46: The VM Distribution Data report ...................................................................................................................................................... 301
Figure 9.47: The detailed diagnosis of the Removed Guests measure ................................................................................................................... 302
Figure 9.48: Selecting the criteria for the Virtual Capacity report ......................................................................................................................... 303
Figure 9.49: The default settings for generating the Virtual Machines – Capacity Planning report ....................................................................... 305
Figure 9.50: The Virtual Machines - Capacity Planning Report ............................................................................................................................ 307
Figure 9.51: The Virtual Machines - Capacity Planning report when the Hosts option is selected ........................................................................ 308
Figure 9.52: The Virtual machines - Capacity Planning report when the Hosts and VMs option is selected ......................................................... 309
Figure 9.53: Navigating to the User VMs report from the eG Reporter interface .................................................................................................. 310
Figure 9.54: Generating the User VMs report ....................................................................................................................................................... 310
Figure 9.55: The default settings for generating the User VMs report ................................................................................................................... 312
Figure 9.56: A graphical User VMs report ............................................................................................................................................................ 316
Figure 9.57: The User VMs Data Report ............................................................................................................................................................... 317
Figure 9.58: Selecting the criteria for the VM Right Sizing report ........................................................................................................................ 318
Figure 9.59: The default settings for generating the Virtual Machines – Right Sizing report ................................................................................ 319
Figure 9.60: The Virtual Machines - Right Sizing Report ..................................................................................................................................... 320
Figure 9.61: The Virtual Machines Right Sizing Report showing the VMs that are currently oversized ............................................................... 321
Figure 9.62: The Vitual Machines - Right Sizing Report showing the VMs that are currently undersized ............................................................ 321
Figure 9.63: Selecting the criteria for the Virtualization Manager report .............................................................................................................. 323
Figure 9.64: The default settings for generating the Virtualization Manager report .............................................................................................. 324
Figure 9.65: The graphical Virtualization Manager report .................................................................................................................................... 328
Figure 9.66: A list of vCenters and the CPU Utilization of each Virtual Center .................................................................................................... 329
Figure 9.67: Specifying the criteria for a VCenters Data report ............................................................................................................................ 331
Figure 9.68: A Virtualization Manager Data Report if the ‘Include Stats for’ flag is set to ‘vCenters’ ................................................................. 332
Figure 9.69: The Executive Report of a vCenter server ......................................................................................................................................... 333
Figure 9.70: The Cluster Details report of the vCenter clicked on ......................................................................................................................... 333
Figure 9.71: A vCenters Data report if the ‘Include Stats for’ flag is set to ‘VM Clusters’ ................................................................................... 334
Figure 9.72: The Cluster Details report of a cluster clicked on .............................................................................................................................. 334
Figure 9.73: A vCenters Data report if the ‘Include Stats for’ flag is set to ‘Physical Servers’ ............................................................................. 335
Figure 9.74: The Server Report of the ESX server clicked on in the vCenter Data Report .................................................................................... 335
Figure 9.75: Selecting the criteria for the Cluster Details report............................................................................................................................ 337
Figure 9.76: The default settings for generating a Cluster Details report ............................................................................................................... 339
Figure 9.77: A graphical Cluster Details Report .................................................................................................................................................... 342
Figure 9.78: A list of vCenters and the number of ESX servers each one manages ............................................................................................... 342
Figure 9.79: The Data report comparing the resource usage across clusters .......................................................................................................... 344
Figure 9.80: The Resource Pools report that appears when a cluster is clicked on ................................................................................................ 345
Figure 9.81: The Physical Servers report that appears when the 'Physical Servers' option is chosen from 'Include Stats for' ................................ 345
Figure 9.82: The server report that appears when the Physical Server in a Physical Servers report is clicked ...................................................... 346
Figure 9.83: Providing the specifications of the Cluster - Resource Pools report .................................................................................................. 346
Figure 9.84: The default settings for generating the Cluster – Resource Pools report ........................................................................................... 348
Figure 9.85: A Cluster - Resource Pools report if the 'View by' option chosen is 'Timeline' and 'Report by' option is 'Resource pools' ............... 352
Figure 9.86: A Cluster - Resource pools report that appears when the 'View by' option is 'Timeline' and the 'Report by' option is 'Physical servers'
..................................................................................................................................................................................................................... 353
Figure 9.87: The Cluster -Resource pools report if the 'View by' selection is 'Timeline' and the 'Report by' selection is 'Virtual machines' ......... 354
Figure 9.88: The Cluster - Resource Pools report where the 'View by' selection is 'Distribution' and the 'Report by' option is 'Resource Pools' .. 354
Figure 9.89: The physical servers that fall within the usage range clicked on ....................................................................................................... 355
Figure 9.90: The Cluster - Resource pools report where the 'View by' selection is 'Distribution' and the 'Report by' selection is 'Physical Servers'
..................................................................................................................................................................................................................... 357
Figure 9.91: The physical servers that fall within the usage range clicked on ....................................................................................................... 358
Figure 9.92: A Cluster - Resource pools report that appears when the 'View by' option is 'Distribution' and 'Report by' option is 'Virtual Machines'
..................................................................................................................................................................................................................... 360
Figure 9.93: The virtual machines that fall within the usage range clicked on ...................................................................................................... 361
Figure 9.94: The Cluster Details Data Report........................................................................................................................................................ 363
Figure 9.95: A Cluster Details Report providing Physical Server information additionally .................................................................................. 364
Figure 9.96: An Executive Report of the physical server ...................................................................................................................................... 365
Figure 9.97: A Cluster Details Report additionally providing virtual machine information .................................................................................. 366
Figure 9.98: The Cluster Details report revealing the CPU and memory usage of every cluster on a vCenter ...................................................... 368
Figure 9.99: A report displaying the details of a particular cluster ........................................................................................................................ 369
Figure 9.100: Providing the specifications of the Cluster - Physical Servers report .............................................................................................. 370
Figure 9.101: The default settings for generating the Cluster – Physical Servers report ........................................................................................ 371
Figure 9.102: A Cluster - Physical Servers report if the 'View by' option chosen is 'Measures'............................................................................. 374
Figure 9.103: A Cluster - Physical Servers report that appears when the 'View by' option is 'Distribution'........................................................... 375
Figure 9.104: The physical servers that fall within the usage range clicked on ..................................................................................................... 376
Figure 9.105: A Cluster - Physical Servers Report that appears when the 'View by' option is 'Distribution' and 'Report for' option is 'Virtual
Machines' ..................................................................................................................................................................................................... 378
Figure 9.106: The physical servers that fall within the usage range clicked on ..................................................................................................... 379
Figure 9.107: The Cluster Details Data Report...................................................................................................................................................... 381
Figure 9.108: A Cluster Details Report providing Physical Server information additionally ................................................................................ 382
Figure 9.109: An Executive Report of the physical server .................................................................................................................................... 383
Figure 9.110: A Cluster Details Report additionally providing virtual machine information ................................................................................ 384
Figure 9.111: The Cluster - Physical servers report revealing the CPU and memory usage of every cluster on a vCenter .................................... 385
Figure 9.112: A report displaying the details of a particular cluster ...................................................................................................................... 386
Figure 9.113: Providing the specifications of the Cluster - Virtual Machines report ............................................................................................. 387
Figure 9.114: The default settings for generating the Cluster Virtual Machines report ......................................................................................... 388
Figure 9.115: A Cluster - Resource Pools report if the 'View by' option chosen is 'Timeline' and 'Report by' option is 'Resource pools' ............. 391
Figure 9.116: The Cluster -Virtual Machines report if the 'View by' selection is 'Timeline' and the 'Report by' selection is 'Virtual machines' .... 392
Figure 9.117: A Cluster - Resource pools report that appears when the 'View by' option is 'Distribution' and 'Report by' option is 'Virtual
Machines' ..................................................................................................................................................................................................... 393
Figure 9.118: The virtual machines that fall within the usage range clicked on .................................................................................................... 394
Figure 9.119: A Cluster Details Report additionally providing virtual machine information ................................................................................ 396
Figure 9.120: The Cluster Details report revealing the CPU and memory usage of every cluster on a vCenter .................................................... 397
Figure 9.121: A report displaying the details of a particular cluster ...................................................................................................................... 398
Figure 9.122: Providing the specifications for the Cluster VM SPRAWL report .................................................................................................. 400
Figure 9.123: The default settings for generating the Cluster VM Sprawl reportk ................................................................................................ 401
Figure 9.124: Graph showing the Powered On state of the VMs ........................................................................................................................... 403
Figure 9.125: Data report of the VMs in VDI environments ................................................................................................................................. 404
Figure 9.126: Generating a VM Capacity Planning report .................................................................................................................................... 405
Figure 9.127: The default settings for generating the Cluster Capacity Planning report ........................................................................................ 406
Figure 9.128: A Graphical VM Capacity Planning Report .................................................................................................................................... 408
Figure 9.129: A VM Capacity Planning Report of type Data ................................................................................................................................ 408
Figure 9.130: Selecting the criteria for the Datacenters report............................................................................................................................... 409
Figure 9.131: The default settings for generating the Datacenters report .............................................................................................................. 411
Figure 9.132: A Timeline graph of a Datacenters report focusing on cluster performance .................................................................................... 415
Figure 9.133: A Timeline graph of a Datacenters report focusing on Physical Server performance ...................................................................... 415
Figure 9.134: A Timeline graph of a Datacenters report focusing on the performance of VMs ............................................................................ 416
Figure 9.135: A Timeline graph of a Datacenters report focusing on the performance of datastores ..................................................................... 417
Figure 9.136: A distribution graph in the Datacenters report focusing on cluster performance ............................................................................. 419
Figure 9.137: The clusters that fall within the usage range clicked on .................................................................................................................. 419
Figure 9.138: A distribution graph in the Datacenters report focusing on physical server performance ................................................................ 421
Figure 9.139: The physical servers that fall within the usage range clicked on ..................................................................................................... 421
Figure 9.140: A distribution graph in the Datacenters report focusing on virtual machine performance ............................................................... 423
Figure 9.141: The virtual machines that fall within the usage range clicked on .................................................................................................... 424
Figure 9.142: The Datacenters Report of type Data............................................................................................................................................... 425
Figure 9.143: Specifying the criteria for generating a VMotions Summary Report ............................................................................................... 427
Figure 9.144: The default settings for generating the VMotion report ................................................................................................................... 429
Figure 9.145: The default VMotion Summary & Top N (Graph) report ................................................................................................................ 433
Figure 9.146: A VMotions Details report that provides details of all migrations that occurred in the specified Timeline ..................................... 434
Figure 9.147: The VMotion Details report that appears upon clicking a division in the bar chart ......................................................................... 434
Figure 9.148: The default VMotion Summary & Top N (Data) report .................................................................................................................. 435
Figure 9.149: The VMotion Summary Graph report if the VM option is chosen from the Summary list .............................................................. 436
Figure 9.150: The VMotion Data Report if the VM option is chosen from the Summary list ............................................................................... 437
Figure 9.151: The VMotion Summary Graph report if the Source ESX option is chosen from the Summary list ................................................. 438
Figure 9.152: The VMotion Data Report if the Source ESX option is chosen from the Summary list .................................................................. 439
Figure 9.153: The VMotion Summary Graph report if the Target ESX option is chosen from the Summary list .................................................. 440
Figure 9.154: The VMotion Data Report if the Target ESX option is chosen from the Summary list ................................................................... 441
Figure 9.155: The VMotion Summary Graph report if the Source Cluster option is chosen from the Summary list ............................................. 442
Figure 9.156: The VMotion Data Report if the Source Cluster option is chosen from the Summary list .............................................................. 443
Figure 9.157: The VMotion Summary Graph report if the Target ESX option is chosen from the Summary list .................................................. 444
Figure 9.158: The VMotion Data Report if the Target ESX option is chosen from the Summary list ................................................................... 445
Figure 9.159: Generating the VMotion Details report ........................................................................................................................................... 446
Figure 9.160: The default settings for generating the VMotion Details report....................................................................................................... 447
Figure 9.161: The VMotion Details report ............................................................................................................................................................ 451
Figure 9.162: Generating the Datastore Overview report ...................................................................................................................................... 452
Figure 9.163: The default settings for generating the Datastore Overview report.................................................................................................. 455
Figure 9.164: A Graphical DataStore Overview Report ........................................................................................................................................ 457
Figure 9.165: The physical servers that fall within the usage range clicked on ..................................................................................................... 458
Figure 9.166: The Data report for Data Storage .................................................................................................................................................... 458
Figure 9.167: Clicking on a 'Server' in the Data Storage Report............................................................................................................................ 459
Figure 9.168: Generating the DataStores VM Details report ................................................................................................................................. 460
Figure 9.169: The default settings for generating the DataStores VM Details report ............................................................................................ 461
Figure 9.170: The DataStores VM Details Report ................................................................................................................................................. 464
Figure 9.171: Specifying the criteria for Uptime reports ....................................................................................................................................... 465
Figure 9.172: The default settings for generating the Uptime Reports .................................................................................................................. 467
Figure 9.173: The Graphical Uptime report .......................................................................................................................................................... 470
Figure 9.174: Clicking on a bar in the Uptime report ............................................................................................................................................ 471
Figure 9.175: Reboot details.................................................................................................................................................................................. 471
Figure 10.1: Generating a Thin Client Zone Report .............................................................................................................................................. 474
Figure 10.2: The default settings for generating a thin client Zone Performance reprot ........................................................................................ 476
Figure 10.3: A graphical Zone report .................................................................................................................................................................... 480
Figure 10.4: A list of components with CPU utilization in a given range ............................................................................................................. 480
Figure 10.5: The server report that appears upon clicking on a bar chart .............................................................................................................. 481
Figure 10.6: The Zone Data Report ....................................................................................................................................................................... 484
Figure 10.7: The Server report of the problem server in the farm report ............................................................................................................... 485
Figure 10.8: Generating a User Session Details Report ......................................................................................................................................... 487
Figure 10.9: Selecting the Active Directory Group option .................................................................................................................................... 488
Figure 10.10: The default settings for generating the User Session Details report ................................................................................................. 490
Figure 10.11: The User Session Details report ...................................................................................................................................................... 491
Figure 10.12: The top applications used by the chosen user .................................................................................................................................. 493
Figure 10.13: Detailed diagnosis of the resource utilization of applications .......................................................................................................... 494
Figure 10.14: The graph of a user-configured measure ......................................................................................................................................... 495
Figure 10.15: The Active Directory group wise Thin client User report ............................................................................................................... 496
Figure 10.16: Selecting the criteria for the Thin Client - User Activity report....................................................................................................... 497
Figure 10.17: The default settings for generating the User Activity report ............................................................................................................ 499
Figure 10.18: The User Activity report ................................................................................................................................................................. 501
Figure 10.19: The data that appears upon clicking on the slice of the pie chart ..................................................................................................... 502
Figure 10.20: The User Activity report when the Timeline option is chosen......................................................................................................... 503
Figure 10.21: Selecting the zone based aggregation option ................................................................................................................................... 504
Figure 10.22: Zone based aggregation for the thin client user activity report ........................................................................................................ 504
Figure 10.23: Server based aggregation for the thin client user activity report ...................................................................................................... 505
Figure 10.24: Generating a User Session Analysis Report .................................................................................................................................... 507
Figure 10.25: The default settings for the generating the User Session Analysis report ........................................................................................ 510
Figure 10.26: A graphical User Session Analysis report ....................................................................................................................................... 513
Figure 10.27: A list of components with Active_sessions in a given range ......................................................................................................... 513
Figure 10.28: The server report that appears upon clicking on a bar chart ............................................................................................................ 514
Figure 10.29: The Session report for Citrix XenApp 4/5/6.x servers in a farm...................................................................................................... 516
Figure 10.30: The longest sessions in the farm ...................................................................................................................................................... 516
Figure 10.31: The top users of the farm ................................................................................................................................................................. 516
Figure 10.32: A day-wise distribution chart for the user activity on the zone ........................................................................................................ 517
Figure 10.33: The list of users to the farm on a particular date.............................................................................................................................. 517
Figure 10.34: User report of the user with completed sessions .............................................................................................................................. 518
Figure 10.35: The longest sessions on a particular server in the farm.................................................................................................................... 518
Figure 10.36: The top users on a particular server in the farm............................................................................................................................... 519
Figure 10.37: The day-wise distribution of users to a particular server ................................................................................................................. 519
Figure 10.38: The list of users who accessed a particular server on a specific date ............................................................................................... 520
Figure 10.39: Session details for every server in every component-type in the zone ............................................................................................ 521
Figure 10.40: Thin client application report .......................................................................................................................................................... 522
Figure 10.41: The default settings for generating an Application Activity report .................................................................................................. 525
Figure 10.42: A graphical Thin client Application Activity report ........................................................................................................................ 528
Figure 10.43: A list of applications with Processes running in a given range ..................................................................................................... 528
Figure 10.44: The Application Activity data report ............................................................................................................................................... 531
Figure 10.45: Top users of the application at the server-level ............................................................................................................................... 531
Figure 10.46: Zone-based aggregation .................................................................................................................................................................. 533
Figure 10.47: Top application users at the zone-level ........................................................................................................................................... 533
Figure 10.48: Aggregation at the server-level ....................................................................................................................................................... 533
Figure 10.49: Top application users at the server-level ......................................................................................................................................... 534
Figure 10.50: Generating the Application Usage report ........................................................................................................................................ 537
Figure 10.51: The default settings for generating an Application usage report for a thin client component .......................................................... 539
Figure 10.52: The Thin Client Application Usage report ...................................................................................................................................... 540
Figure 10.53: Generating the User Logon Performance report .............................................................................................................................. 541
Figure 10.54: The default settings for generating the User Logon Performance report ......................................................................................... 543
Figure 10.55: The graphical User Logon Performance report ............................................................................................................................... 544
Figure 10.56: A list of users with Avg Logon duration in a given range................................................................................................................ 545
Figure 10.57: The Data User Logon Performance report ....................................................................................................................................... 547
Figure 10.58: Selecting the criteria for the VDI Resource Usage report ................................................................................................................ 548
Figure 10.59: The default settings for generating the User Logon Performance report ......................................................................................... 549
Figure 10.60: The VDI Resource Usage report ..................................................................................................................................................... 551
Figure 10.61: The Desktops Resource Usage Details pop up window ................................................................................................................... 552
Figure 10.62: The VDI Resource Usage report that is generated when User option is chosen .............................................................................. 553
Figure 10.63: The Desktops Resource Usage Details pop up that appears when the User option is selected......................................................... 553
Figure 10.64: The VDI Resource usage report when Inside view option is selected .............................................................................................. 555
Figure 10.65: The Desktop Resource Usage Details pop up window displaying the Inside view metrics ............................................................. 556
Figure 10.66: The VDI Resource Usage report that is generated when Inside View and User options are chosen ................................................ 557
Figure 10.67: The Desktops Resource Usage Details window that appears upon clicking a slice of the pie chart ................................................. 558
Figure 10.68: Selecting the criteria for the VDI Application Activity report ......................................................................................................... 559
Figure 10.69: The default settings for generating the User Logon Performance report ......................................................................................... 561
Figure 10.70: The VDI Application Activity report .............................................................................................................................................. 562
Figure 10.71: The VDI Application Activity Details pop up window that appears upon clicking the Top CPU Applications .............................. 563
Figure 10.72: Generating the Application Launch report ...................................................................................................................................... 564
Figure 10.73: The default settings for generating the Application Launch report .................................................................................................. 565
Figure 10.74: The Application Launch report ....................................................................................................................................................... 567
Figure 10.75: The Application Launch Report for the top users of your environment ........................................................................................... 568
Figure 10.76: The data report when the Application option is chosen from the Details based on list .................................................................... 569
Figure 10.77: Drilling down the data report .......................................................................................................................................................... 570
Figure 10.78: The Data Application report when User option is selected from the Details based on list ............................................................... 571
Figure 10.79: Detailed data report for each application launch by the user ........................................................................................................... 572
Figure 11.1: The System Capacity Analysis report for a Service .......................................................................................................................... 574
Figure 11.2: The default settings for generating a System Capacity Analysis report by service ............................................................................ 575
Figure 11.3: The System Capacity Planning Report - Service ............................................................................................................................... 576
Figure 11.4: The System Capacity Planning Report for a Segment ....................................................................................................................... 577
Figure 11.5: The default settings for generating a System Capacity Analysis report for a chosen segment ........................................................... 578
Figure 11.6: The System Capacity Analysis Report - Segment ............................................................................................................................. 580
Figure 11.7: The System Capacity Analysis report for a chosen component of a component type ........................................................................ 581
Figure 11.8: The default settings for generating a System Capacity Analysis report for a chosen segment ........................................................... 582
Figure 11.9: The System Capacity Analysis Report - Component......................................................................................................................... 583
Figure 11.10: The Custom Capacity Analysis report before configuration ............................................................................................................ 584
Figure 11.11: Defining the tests for generating the Custom Capacity Analysis reports ......................................................................................... 585
Figure 11.12: The Custom Capacity Analysis report ............................................................................................................................................. 586
Figure 11.13: Modifying descriptors ..................................................................................................................................................................... 587
Figure 11.14: The Capacity Planning Report......................................................................................................................................................... 588
Figure 11.15: Day-wise percentile break up .......................................................................................................................................................... 589
Figure 11.16: The Prediction Analysis report ........................................................................................................................................................ 590
Figure 11.17: Defining the configuration for generating the Prediction Analysis report ....................................................................................... 590
Figure 11.18: Generating the Prediction Analysis report ....................................................................................................................................... 592
Figure 11.19: Modifying the descriptors ............................................................................................................................................................... 592
Figure 11.20: The default settings for generating a Prediction Analysis report ..................................................................................................... 593
Figure 11.21: The Prediction Report ..................................................................................................................................................................... 596
Figure 11.22: The Cumulation Analysis report generation .................................................................................................................................... 597
Figure 11.23: Defining the configuration for generating the Cumulation Analysis report ..................................................................................... 598
Figure 11.24: Generating a Cumulation Report ..................................................................................................................................................... 598
Figure 11.25: The default settings for generating a Cumulation Analysis report ................................................................................................... 599
Figure 11.26: A Cumulation Report ...................................................................................................................................................................... 601
Figure 11.27: Generating a Correlation Report...................................................................................................................................................... 602
Figure 11.28: Choosing the first measure for correlation ...................................................................................................................................... 602
Figure 11.29: Choosing the second measure for correlation .................................................................................................................................. 603
Figure 11.30: Generating the Capacity Correlation Report ................................................................................................................................... 603
Figure 11.31: The default settings for generating a Capacity Correlation report ................................................................................................... 604
Figure 11.32: A Graphical Capacity Correlation Report ....................................................................................................................................... 606
Figure 11.33: The Correlation Report when the Average option is chosen from the Plot list box ......................................................................... 606
Figure 11.34: A Correlation Report of type Data .................................................................................................................................................. 607
Figure 11.35: A Correlation Report of type Data when Average option is selected from the Plot text box ........................................................... 608
Figure 12.1: Generating a Consolidated Event Log Analysis Report .................................................................................................................... 610
Figure 12.2: The Consolidated Event Log Analysis Report .................................................................................................................................. 612
The eG Reporter Overview
The eG Reporter
For enhanced historical reports and analysis, eG Enterprise includes an optional eG Reporter solution. The eG
Reporter offers comprehensive pre-canned and customizable reports of the availability, performance, and usage of
the target infrastructure. Various types of reports are available via eG Reporter including:
Executive Summary reports: These reports offer a service level summary for each component of the IT
infrastructure. This summary depicts the percentage of time that a component has been problem free. The main
intent of these reports is to help senior management of an organization identify which components or domains
(i.e., component types) are most problem-prone in the IT infrastructure.
Operational KPI reports: While executive reports provide a high-level overview of the performance of an
infrastructure component, the operation reports provide detailed insights into specific measurements and how
they compare with their threshold bounds. While a number of pre-canned reports are available for each
component being monitored, administrators also have the flexibility to build customized reports.
Comparison reports:
Measurement Snapshot reports: These reports are ideal for post-mortem analysis. If an administrator is aware
While operation reports allow analysis of different metrics of a specific component,
comparison reports can be used for cross-correlation - i.e., to compare different metrics across different
components. For example, the response time of the network, server, database, application, etc. can be
compared and plotted in the same report.
that a problem occurred in the past during a certain period of time, he/she can use the Snapshot reports to
quickly identify which measurements for a specific component were not in conformance with their thresholds.
Consolidated Analysis reports: Use these reports to assess the performance of chosen server
farms/servers/services over time. Periodic analysis of overall performance enables administrators to accurately
predict behavioral trends and sizing requirements, and thus perform effective capacity planning.
Citrix / VDI Reports: These reports facilitate root-cause analysis and identification in Citrix/Terminal/VDI server
farms. Thinclient administrators can use these reports to assess the resource utilization of specific applications in
the farm, analyze user behavior across the farm, detect the open sessions in the farm, etc.
Compliance reports: In order to comply with emerging standards such as HIPPA, Sarbanes Oxley, etc., IT
infrastructure operators require a wide range of reports that reveal the service level achieved by a target
environment, the duration of service downtimes, etc. To cater to these compliance requirements, the eG
Reporter offers Compliance reports.
Virtualization reports: To enable users to oversee the performance of their virtualized infrastructure over time,
and to analyze the resource usage patterns of VMs and physical servers deployed on various virtualization
platforms, eG Reporter now includes Virtualization reports.
Using eG Reporter, users can login from anywhere, at any time, and view reports. By seamlessly integrating with eG
Enterprise, eG Reporter allows users to analyze any of thousands of metrics collected by the eG agents for trending,
capacity planning, problem diagnosis, or service level audits.
To open the eG Reporter, click on the Reporter tab page.
1
The eG Reporter Overview
Figure 1.1: The eG Reporter Home page
The eG Reporter Home page provides an overview of the health of the entire monitored infrastructure. The eG
Reporter home page is divided into a left panel and a context sensitive right panel. The left panel consists of a host
of tree structures using which reports can be generated easily. Using this left panel, administrators can find all the
reports that are applicable to say for example, a specific component type easily. These reports are grouped in an
easy to understand manner, so administrators need not click in several places to see the reports of most interest to
them. Reports specific to component groupings such as zones, segments, and services are also available. By default,
the REPORTS BY FUNCTION tree will be expanded (see Figure 1.1). This document will navigate through the nodes
of the REPORTS BY FUNCTION tree and explain the generation of each report within the nodes in detail.
The MORE OPTIONS drop down window (see Figure 1.2) will appear when the
icon is clicked in Figure 1.1.
Figure 1.2: Changing the duration for displaying the infrastructure health
The Duration list box (see Figure 1.2) allows the health of the monitored infrastructure to be analyzed for any period
(default is 2 weeks).
2
The eG Reporter Overview
The default duration of the reports displayed in the eG Reporter home page can be changed
using the homeDuration parameter in the [MISC] section of the eg_report.ini file (in the
<EG_INSTALL_DIR>\manager\config directory). By default, this parameter is set to 2 weeks.
However, it can be changed to a value in the range of 1 week to 4 weeks, or 1 month. For
example, to set 1 week as the default duration, do as depicted below:
[MISC]
homeDuration=1week
Similarly, to set the default duration to 4 weeks, do as depicted below:
[MISC]
homeDuration=4weeks
The right panel displays the Infrastructure Overview. There are four sections in the INFRASTRUCTURE OVERVIEW.
Each section sheds greater light on a critical aspect of the monitored environment.
1.
The Problem Distribution section reveals how problem-prone the infrastructure has been during the period
under consideration. The section displays bar graphs that indicate the number of critical, major, and minor
problems that occurred on a daily basis during the selected period. By looking at this section, an administrator
can determine the days when significant number of problems had occurred. Clicking on a particular division in a
bar will lead you to Figure 1.3, which will reveal the TOP EVENTS report that provides a summary of events
that affected infrastructure performance on that particular day.
3
The eG Reporter Overview
Figure 1.3: Event Analysis report for a particular day
4
The eG Reporter Overview
A mismatch between the total number of events reflected by the Problem Distribution section
of the Reporter home page and the TOP EVENTS report as such is inevitable. This is
because, the former provides a layer-wise event summary, and the latter provides a test-wise
summary.
2.
Next to the Problem Distribution section in Figure 1.1 is the Duration Analysis section. This section shows the
average duration and the maximum duration of events of a selected priority. For example, assume that an
environment consists of 2 components - component A and component B. On a particular day, component A
suffered Critical issues 5 times, with each issue lasting for about 2 hours. This implies that component A
encountered critical issues for a total duration of 10 hours (2 x 5) that day. Component B on the other hand,
suffered a critical issue at 12 noon, which was resolved at 4 PM, and another critical issue at 4.30 PM, which
was resolved at 5.30 PM. Accordingly, it can be concluded that, component B suffered critical issues for a
duration of 5 hours on that day. In such a case, the line graph in the Duration Analysis section will indicate that
the average duration of Critical issues was 450 minutes (10+5=15/2=7.5 * 60=450) on this particular day, and
the maximum duration was 600 minutes (i.e. 10 hours, which is the cumulative duration of all the critical events
of component A; it is the maximum because the cumulative duration of critical events of component B is only
5).
This is a good indicator of the efficiency of the administrative staff in fixing the problems identified by eG. By
default, this graph displays the average and maximum durations of the Critical issues in the environment. To
view the details of issues of another priority, select the priority from the list box adjacent to the section heading
Duration Analysis. To zero-in on the component that encountered problems (of the chosen priority) which
remained unresolved for the longest duration, click on the graph. An Executive Summary Report of the
component for the chosen period will then appear (see Figure 1.4).
Figure 1.4: Executive Report of the Component that encountered unresolvable problems
5
The eG Reporter Overview
By default, the Duration Analysis section of the eG Reporter Home page depicts the duration
of events in minutes. Instead, if you prefer to view the percentage of time during a day
problems (of a chosen priority) persisted in the target environment, set the Daywise
distribution reports in flag in the MONITOR SETTINGS page (Configure -> Monitor Settings
menu in the eG administrative interface) to Percentage.
3.
Just below the Problem Distribution section is the Services Health section, which reveals the health of the
segments/services/components in the environment during the specified period. This section consists of a
horizontal bar graph, each bar of which denotes the percentage of time a segment/service/component has been
in the Normal/Critical/Major/Minor/Unknown states. Clicking on a particular division in a bar will lead you to a
page that displays the Executive Suumary By Service Report of the corresponding segment/service/component
for the chosen Duration (see Figure 1.5).
Figure 1.5: An Executive Service Report that appears upon clicking on a bar in the Services Health section of the
Reporter Home
4.
From the Component Types At-A-Glance section, one can quickly infer, how well/how poorly each of the
component types have performed during the given period. Clicking on the bar corresponding to a component
type in this section will lead you to a page that displays the Executive Summary By Component Type Report
pertaining to that component type for the chosen Duration (see Figure 1.6).
6
The eG Reporter Overview
This section will depict the health of services, only when one or more services have been
configured in the environment. If only segments have been configured, then this section will
reveal the health of all the segments during the designated period. If neither services nor
segments exist, then a pie chart denoting the health of all the monitored components will
appear.
Figure 1.6: An Executive Summary By Component Type Report that appears when a Component Type’s bar graph in
the Reporter Home page is clicked
5.
You can save the Reporter Home page as a PDF document by clicking on the
of Figure 1.1. Upon clicking, the following dialog box will appear:
7
button at the right top corner
The eG Reporter Overview
Figure 1.7: The File download dialog box
6.
Selecting the Open with option in Figure 1.7 will save the report as a PDF file to a temporary folder, and
automatically open the PDF. To save the file to a specific location in the local disk, select the Save File option
and click the OK button. Doing so will open the Save As dialog box using which the name and location of the
PDF file can be specified (see Figure 1.8). After specifying the required details, click the Save button in Figure
1.8 to save the report as a PDF.
Figure 1.8: Saving the report as a PDF file
8
The eG Reporter Overview
The PDF files that are created while saving a report as a PDF, will contain the eG logo by
default. To ensure that all PDF files so created carry your company logo instead, change the
gif file specification provided against the pdfLogo parameter in the [MISC] section of the
eg_report.ini file (in the <EG_INSTALL_DIR>\manager\config directory). By default, this
parameter is set to logo.gif, which refers to the eG logo. Instead, you can specify the name
of the gif file containing your company’s logo here, but before that, ensure that the image
file is copied to the <EG_INSTALL_DIR>\manager\tomcat\webapps\final\reporter\images folder.
7.
To print the report, click on the
button in Figure 1.1. Upon clicking, you will be able to preview the graphs
in a separate window. The preview will be followed by a Print dialog box, which allows you to select the printer
and define its settings (see Figure 1.9).
Figure 1.9: Defining the printer settings
8.
Clicking on the OK button in Figure 1.9 will trigger the printing of the previewed report.
9.
The eG Reporter component also facilitates mailing of the displayed reports directly to specific recipients. To
achieve this, first, click on the
button in Figure 1.1. Figure 1.10 will then appear, using which the mail IDs
of the primary recipients, the mail IDs of the recipients to whom the reports need to be copied, etc. will have to
be specified. Also, an appropriate Subject can be provided for the mail (see Figure 1.10).
9
The eG Reporter Overview
Figure 1.10: Sending mails directly to specific recipients
10.
Finally, click the Submit button in Figure 1.10 to send the reports to the specified recipients.
10
Getting Familiar with the eG Reporter User interface
Getting Familiar with the eG
Reporter User Interface
This chapter explains you in detail on getting familiar with the user interface of the Reporter module of the eG
Enterprise Suite. Figure 2.1 provides you with an overview of the menu sequence tree of the Reporter module.
11
Getting Familiar with the eG Reporter User interface
Figure 2.1: The Reporter menu sequence tree
Each section of the Reporter menu sequence is discussed in detail in the following chapters. The below table explains
you briefly on the icons that are available at the right top corner of each Report generation page.
Icons
Purpose
12
Getting Familiar with the eG Reporter User interface
Clicking this icon will save the generated report
Clicking this icon will print the generated report
Use this icon to mail the generated report to specific individuals
Use this icon to view the data points that have been plotted in the report
Click on this icon to add the report as a favorite
Click on this icon to schedule the printing/mailing of the generated report
Click on this icon to save the generated report as a CSV file
Click on this icon to change the default settings of the report using the MORE
OPTIONS drop down window.
2.1 How to schedule printing/mailing of a generated report?
This section describes the step by step procedure involved in printing/mailing the report in detail:
1.
The eG Reporter also provides a useful report scheduling capability that automates the process of printing
and/or mailing specific reports (to specific individuals) at pre-defined intervals. To schedule the printing/mailing
of the reports displayed in the Reporter home page, click on the
button. In Figure 2.2 that appears next,
provide a name for the schedule against the Schedule Name text box in.
Figure 2.2: Adding a new schedule
2.
To indicate how often the report would have to be mailed to a specific recipient, select a frequency from the
13
Getting Familiar with the eG Reporter User interface
Mail list box. The options provided therein include: None, Daily, Weekly, Monthly, WeekEnd, and MonthEnd. If
you select the Weekly option, you even get to select the exact day of the week on which you want the report
mailed/printed, from the Mail On list. If you select the Monthly option from the Mail list, you can select the exact
date of the month on which you want the report to be mailed/printed, from the Mail On list.
14
Getting Familiar with the eG Reporter User interface
By default, WeekEnd reports are mailed every Sunday. This default setting can
however, be modified by editing the eg_services.ini file (in the
<EG_INSTALL_DIR>\manager\config directory). The ScheduleMailWeekend parameter
in the [MISC_ARGS] section of this file is set to Sunday, by default. If you so wish,
you can specify any other day of the week against this parameter, as shown below:
[MISC_ARGS]
ScheduleMailWeekend=Friday
Say, on September 24, 2014 (Wednesday), a report was generated with a Timeline
of 2 weeks; later that day, the same report was scheduled to be mailed Weekly.
This means that on the first day of the following week (which is Sunday September 28, 2014), the report will be automatically generated based on the
performance data collected during the last 2 weeks (i.e., for the period spanning
September 14 to September 28), and mailed to the specified recipients. Note that, if
a report is set to be mailed 'Weekly', such a setting only ensures that the report is
mailed once a week; it does not alter the Timeline of the original report. The same
applies to 'Monthly' schedules.
Now, let us take another example. Assume that on September 24, 2014 again, a
report with a Timeline of 2 weeks was scheduled to be mailed every WeekEnd
(which is say, Sunday). This means that on September 28, 2014 (Sunday), the
report will be automatically generated for a Timeline of 1 week (spanning
September 22 to September 28), and mailed to the specified recipients. Note that
'WeekEnd' schedules not only affect the frequency with which reports are mailed, but
also override the 'Timeline' of the original report. The same philosophy applies to
"MonthEnd" schedules.
By default, scheduled mails are sent before trend computation begins. However, if
need be, you can push schedule execution below trend computations - i.e., you can
instruct the eG Enterprise system to mail reports after trend calculations are done.
To ensure this, do the following:
o
Edit the eg_services.ini file in the <EG_INSTALL_DIR>\manager\config directory.
o
In the [MISC_ARGS] section of the file, a ScheduleReportsBeforeTrend flag exists
that is set to yes, by default. Change this to no, so that schedules are implemented
after trending is completed.
Summary reports will not be generated properly if this option is set. Reports with
measure graph, zone reports, comparison reports, etc., will be unaffected.
3.
You cannot SCHEDULE the automatic printing/mailing of reports with an Any
timeline.
If the report need not be mailed but the report is to be printed, then select None from this list box. If the report
is to be mailed to a specific recipient (i.e., if the Mail list box does not contain None), then mention the Mail ID
of the recipient.
15
Getting Familiar with the eG Reporter User interface
To ensure that the reports are mailed to the specified recipients, the SMTP mail
host and eG Administrator mail ID need to be properly configured in the eG
administrative interface (using the Alerts -> Mail Settings -> Server option).
When reports are sent by email, the body of the email will contain the reports so
sent in HTML format. You can, if you so desire, send the report as an attachment
by setting the SendMailAsAttachment flag to Yes (or True). This flag is available in
the
[MISC_ARGS]
section
of
the
eg_services.ini
file
(in
the
<EG_INSTALL_DIR>\manager\config directory).
4.
Then, indicate the Schedule Type. You can indicate when report scheduling is to occur by picking an option
from the Schedule Type list. To generate schedule reports at the end of every day, pick the Day end option from
this list. To generate schedule reports at a configured time every day, pick the Any time option from this list,
and then indicate the exact time of generation using the Schedule at time controls that then appear.
5.
If a Thin Client report that is generated in the data format is scheduled for printing/mailing, an additional
Schedule Format list box will appear in the SCHEDULE THIS REPORT pop up window (see Figure 2.3). By
default, the PDF option is selected which implies that the generated report will be mailed to the recipient in the
PDF format. To mail the report in CSV format select the CSV option from this list box.
Figure 2.3: Adding a new schedule for a generated data report
6.
By default, eG Reporter does not allow users to schedule the automatic printing of reports. If you want to
schedule report printing, then set the EnableSchedulePrint parameter in the [MISC_ARGS] section of the
eg_services.ini file (in the <EG_INSTALL_DIR>\manager\config directory) to true (default is false). Once this is
done, then, a Print list will additionally appear in the SAVE SCHEDULES page. Indicate the frequency with which
the report is to be printed by selecting an option from the Print list box. Here again, selecting None would
ensure that the report is not printed. In order to print the report as well as email the report to the chosen
recipients, then select an option from the Mail list and the Print list and specify the recipients in the Mail Id text
box.
16
Getting Familiar with the eG Reporter User interface
If a network printer is used for printing the reports, then ensure that the Tomcat service of
the eG manager is configured to use a domain user’s account. If only a local printer is used,
then the Tomcat service can run using the default local system account.
7.
By default, the details of the report for which you have scheduled printing/mailing will be listed under the
Details of Your Selection section. Finally, click on the SAVE button to register the schedule. Doing so will reveal
the following page that prompts you to click on the Schedules link.
Figure 2.4: Clicking on the Schedules link
8.
Clicking on the Schedules link will bring up Figure 2.5. Note that Figure 2.5 will also appear when the Options > Schedules -> Configure menu sequence in eG Reporter is followed.
17
Getting Familiar with the eG Reporter User interface
Figure 2.5: Viewing the list of schedules
9.
Figure 2.5 provides the details of all the existing schedules (including the newly added schedule). Clicking on a
SCHEDULE NAME here, will open Figure 2.2. Using this page, you can modify any of the displayed schedule
details, and then click the SAVE button therein to save the changes. Additionally, you can modify the details of
the report that is scheduled from this page. To do so, click on the Click here to modify your selection link
available against the Details of Your Selection section. This will lead you to the report generation page where
you can modify the details of the scheduled report.
Figure 2.6: Link to modify your scheduled report details
10.
To delete a schedule, just select the check box corresponding to the schedule to be deleted (see Figure 2.5),
and then, click the DELETE button. To select all the schedules in a page for deletion, select the check box
against the SCHEDULE NAME at the top of the page. In the SCHEDULES page, if the number of existing
schedules crosses 15, then the schedules list will be split across pages. Also, a Page text box will be available at
the bottom of every page. To go to a particular page, specify the page number in the text box and click on the
18
Getting Familiar with the eG Reporter User interface
Enter button in your keyboard. Page navigation can also be performed using the arrow buttons available at the
bottom of every page. The purpose of each arrow button is explained below:
Button
Purpose
Click to go to the first page
Click to go to the previous page
Click to go to the last page
Click to go to the next page
11.
You can also optionally configure the eG Enterprise system to save the reports that are scheduled to be emailed
and/or printed (as the case may be) as PDF files on the eG manager host. By default, this capability is disabled.
To enable the capability, edit the eg_services.ini file (in the <EG_INSTALL_DIR>\manager\config directory), and
set the SaveScheduleReport flag in the [MISC] section to yes. Once this flag is turned on, then all scheduled
reports will be automatically saved as PDF files in the <EG_INSTALL_DIR>\manager\scheduledReports folder, by
default. You can even override this default location by specifying a different location against the
SaveSchedulePath parameter in the [MISC] section. To view the reports so saved, follow the Options ->
Schedules -> View Reports menu sequence. Figure 2.7 will then appear. Suppose, if you do not wish to receive
the report by email but wish to save the report as PDF on the eG manager host, then specify a mail frequency
other than None in the Mail list and omit the Mail Id field (leave it as blank). This will ensure you that the email
is not sent but the report is saved to the eG manager host based on the mail frequency chosen by you in the
Mail list. In some cases, administrators may want to email and print the report at the same time. To do so, just
choose a frequency for generating the report from both the Mail and Print lists and specify the Mail Id to which
the report is to be emailed. This will help to keep track of the report on the eG manager host as well as the
inbox of the mail recipient.
19
Getting Familiar with the eG Reporter User interface
Figure 2.7: Viewing scheduled reports saved as PDF files
12.
Figure 2.7 displays all saved scheduled reports by default. If you want to view only those reports that were
scheduled to generate on a particular day, select that day from the Display Reports for list. You can filter the list
further by picking a Report Type.
13.
If required, you can even use the Search option to search for a particular report. In this case, type the whole or
part of the SCHEDULE NAME of that report in the Search text box and click the right-arrow button alongside. This
will automatically list all those scheduled reports with SCHEDULE NAMES that embed the specified Search string.
14.
To view any of the scheduled reports as a PDF file, click the VIEW button that corresponds to that report in
Figure 2.7. To delete any of the generated PDF documents, click on the ACTION icon that corresponds to it in
Figure 2.7.
15.
To delete multiple saved schedules at one shot, select the check boxes that precede each of the PDFs and click
the DELETE button.
16.
Also, if the number of scheduled reports saved as PDF crosses 15, then the list of saved schedules will be split
across pages. Also, a Page text box will be available at the bottom of every page. To go to a particular page,
specify the page number in the text box and click on the Enter button in your keyboard. Page navigation can
also be performed using the arrow buttons available at the bottom of every page. The purpose of each arrow
button is explained below:
20
Getting Familiar with the eG Reporter User interface
Button
Purpose
Click to go to the first page
Click to go to the previous page
Click to go to the last page
Click to go to the next page
Troubleshooting Tips:
Why does the eG Manager installed on a VM skip the generation of scheduled reports often?
When the eG Manager installed on a VM takes too long to time-synchronize with the virtual host on which it is
running, then the report schedules configured for Any time periods on this manager were skipped often. In order to
resolve this issue, set the AdjustAnyTimeScheduleDate flag that is available in the [MISC] section of the eg_report.ini
file in the <eg_install_dir>\manager\config directory to Yes. By default this flag is set to No. Now specify a time
duration (in minutes) against the CheckScheduleBeforeMin parameter. By default, this is set to 30 minutes. This
indicates that if the AdjustAnyTimeScheduleDate flag is set to Yes, then, before executing a report schedule, the eG
manager checks whether any schedules were skipped during the last 30 minutes (by default), and if so, runs that
schedule as well. This way, reports will be emailed as per schedule despite delays in time sync-up between the
virtual host and the VM running the eG manager.
2.2 How to save the report as a favorite?
This section explains the step by step procedure involved in saving a generated report as a favorite.
To allow users to quickly access key reports, the eG Reporter allows users to save their frequently accessed reports
as FAVORITES. To achieve this, first, click on the FAVORITES button. This will result in the display of the SAVE
FAVORITES page (see Figure 2.8). This page will display the report conditions mentioned in Figure 2.8. Now, give a
Name to the report.
21
Getting Familiar with the eG Reporter User interface
Figure 2.8: Specifying the Report Name under which the report conditions are to be saved
1.
To facilitate collaboration and knowledge sharing among administrators, eG Enterprise now allows users the
flexibility to share useful favorites they create with other users. For sharing a favorite report, you need to first
set a share type by selecting the desired option from the Sharing list box in Figure 2.8. The options are as
follows:
Private: If you set a favorite as Private, then all other users to the eG Enterprise system will be denied
access to that favorite. Only the creator of the favorite will be able to access it.
Public: If you set the favorite as Public, then only users with the following rights will have access to it:
Users with access to all the managed elements in the environment
Users with access to the segment/service/zone/component for which the favorite report was generated
Assume that a Zone report for a Default zone was added to FAVORITES and
allowed Public access. Say, a zone named MyZone was later created, to which 2
independent components were added. A user named john was also created, who
was granted monitoring rights to MyZone alone. This means that user john can
monitor only the 2 independent components that are part of MyZone. This user,
upon logging in, will not be able to access the report for the Default zone that was
added to FAVORITES, in spite of the Public access. This is because, for user john a
Default zone does not exist. eG Enterprise automatically creates a Default zone
only when the target environment consists of components that are not part of any
other zone. User john’s environment however consists of only the 2 independent
components that are already part of MyZone; this eliminates the need for a Default
zone, and thus explains why user john does not have access to the favorite report
for the Default zone.
If a favorite report has been allowed Public access, then users whose monitoring
scope does not include the component/segment/service/zone for which the report
was generated will not be allowed access to that favorite.
Share: On the other hand, if you choose the Share option from the Sharing list, then you can pick and
choose the users who need to be granted access to that view. To map users to a view, do the following:
22
Getting Familiar with the eG Reporter User interface
Select the users to be granted access from the Available Users list box.
Then, click on Grant to grant the selected users access to the favorite. Doing so shifts the selection to the
Selected Users list.
To revoke the access permission granted to a user, you can select the user from the Selected Users list,
and click the Revoke button.
Finally, click on Update to save the changes.
Assume that a Zone report for a Default zone was added to FAVORITES. Say, a
zone named MyZone was later created, to which 2 independent components were
added. A user named john was also created, who was granted monitoring rights to
MyZone alone. This means that user john can monitor only the 2 independent
components that are part of MyZone. Also, assume that this user was allowed
Share access to the favorite report for the Default zone.
However, when user john logs into eG Reporter, he will find that he is not able to view
the favorite report for the Default zone that was shared with him. This is because, for
user john, a Default zone does not exist. eG Enterprise automatically creates a Default
zone only when the target environment consists of components that are not part of any
other zone. User john’s environment however consists of only the 2 independent
components that are already part of MyZone; this eliminates the need for a Default
zone, and thus explains why user john does not have access to the favorite report for
the Default zone.
If a user is allowed Share access to a favorite report, but he/she does not have the
privilege to monitor the component/segment/service/zone for which the report was
originally generated, then the user will not be able to access the report, in spite of
the Share access.
A user without access to eG Reporter cannot view any of the favorites shared with
him/her.
A favorite can be deleted only by the user who creates it. The shared users on the
other hand, can only view the favorites, and cannot delete them.
2.
Finally, click on SAVE to save the favorite.
3.
When this is done, the following message (see Figure 2.9) will appear indicating that the Report Name has been
automatically added to the FAVORITES list.
23
Getting Familiar with the eG Reporter User interface
Figure 2.9: A message stating that the Report Name has been saved successfully
Clicking on the View Favorites option from the FAVORITES tile of the eG Reporter will reveal a list of FAVORITE
NAME comprising of report conditions saved for future use (see Figure 2.10). Note that this page will also appear if
the Favorites link in Figure 2.9 is clicked. If too many favorites are listed in this page, you can quickly search for a
particular favorite using the Favorite Search text box in this page. Specify the whole/part of the favorite name to
search for in the Search text box, and click the
button adjacent to it. All favorite names that embed the specified
string will then appear in this page.
Figure 2.10: List of Report Names
4.
If other users have shared their favorites with you, then details of those favorites will be listed separately in the
Favorites Shared by other Users section as depicted in the Figure 2.10. This section provides the name of the
shared favorite. Against every FAVORITE NAME, it displays the user who originally created the favorite and
shared it with the current user in the SHARED BY column. The report type of the favorite is listed in the REPORT
TYPE along with the time at which the favorite was created in the CREATION TIME. To hide the unnecessary
shared favorites select the favorite you want to hide by providing a checkmark in the corresponding check boxes.
Now click on Hide Selected Favorites. Doing so ensures that the chosen favorite as hidden as depicted in the
Figure 2.11.
24
Getting Familiar with the eG Reporter User interface
Figure 2.11: Selecting the favorites to be hidden
5.
If the favorites run across multiple pages, then a Page text box will be available at the bottom of every page. To
go to a particular page, specify the page number in the text box and click on Enter button in your keyboard.
Page navigation can also be performed using the arrow buttons available at the bottom of every page (see
Figure 2.11). The purpose of each arrow button is explained below:
Button
Purpose
Click to go to the first page
Click to go to the previous page
Click to go to the last page
Click to go to the next page
To reuse a favorite, the user would just have to click on the FAVORITE NAME displayed in Figure 2.11. Upon clicking,
Figure 2.11 will reappear. To delete a favorite, just select the check box before the favorite to be deleted (see Figure
2.11), and then, click the DELETE button. To select all the favorites in a page for deletion, select the check box
adjacent to the FAVORITE NAME at the top of the page.
25
Getting Familiar with the eG Reporter User Interfac e
Report Configuration
For enhanced historical reports and analysis, eG Enterprise includes an optional eG Reporter solution. The eG
Reporter offers comprehensive pre-canned and customizable reports of the availability, performance, and usage of
the target infrastructure.
Basically, the Executive, Comparison, and Snapshot reports do not require configuration by the eG administrator. All
other reports generated by the eG Enterprise suite requires configuration. The Reporter option of the Settings tile
that appears when the
icon against the Admin tab is clicked, permits administrators to customize the reports.
This option comprises of the following sub-menus:
Default Reports
SpecificReports
User Reports
Consolidated Reports
Capacity Planning Reports
eG Enterprise includes a number of pre-canned operation report templates. These templates define the set of metrics
that are plotted together on the same timeline for cross-correlation and analysis. The menu options listed above
provide various ways of overriding the defaults.
3.1 Default Reports
This option provides a way for an administrator to refine the default report templates provided with eG Enterprise. To
configure default reports, first, select the Default Reports option by following the menu sequence: Admin -> Settings
-> Reporter. Doing so will reveal the following page (see Figure 3.1).
Figure 3.1: The eG Default Reports page
Clicking the Add New button in Figure 3.2 will reveal Figure 3.2 using which you can add the measures of your choice
for configuring the report templates.
26
Getting Familiar with the eG Reporter User Interfac e
Figure 3.2: The Default Report Configuration page
In order to provide the users with adequate insight into the performance of the critical network, server, and
application tiers of their infrastructure, the eG Reporter further classifies operations reports as Network, System,
Application and Site. The sections to come will discuss each of these classifications at length.
Network Reports
Operations reports targeting the network tier of an infrastructure are classified as Network Reports. To generate
default Network Reports using Figure 3.2, do the following:
1.
Select Network as the Category type (see Figure 3.3).
2.
Select a Report type from the list box (see Figure 3.3). The options to choose from include:
Measure: Measurement reports depict various measurement values plotted with time of day. The time
period for these reports can be configured by the user.
Summary: Summary reports highlight the service levels of different measurements (i.e., the % of time a
measurement was in compliance with its threshold). The service levels can be assessed on an hourly, daily,
or monthly basis.
3.
Next, to select the measures for which a report of the selected type is to be generated, first, choose the Test
that generates the measures (see Figure 3.3).
4.
Upon selection, all the measures associated with the selected test will appear in the DISASSOCIATED MEASURES
list (see Figure 3.3).
27
Getting Familiar with the eG Reporter User Interfac e
Figure 3.3: Measures associated with the selected test
5.
Then, from the Disassociated Measures list, select the measures for which reports of the selected type are to
be generated. Next, click on the < button to transfer the selected measures to the ASSOCIATED MEASURES
list. Finally, click on the Add button. This ensures that reports of the selected type are generated for the
measures available in the Associated Measures list. Figure 3.3, Figure 3.4, and Figure 3.5 depict this process
clearly.
Figure 3.4: Associating the measures with the specified report type
28
Getting Familiar with the eG Reporter User Interfac e
The Associated Measures will be
displayed
Figure 3.5: Updating the association for a default network report
Figure 3.6: Configuring a default network summary report
6.
Upon updating, the associated measures will be displayed as indicated by Figure 3.5. In the example depicted
by Figure 3.6, Avg network delay and Min network delay are the measures that have been chosen for
generating default Network-Measure reports. If summary reports are to be generated for the same set of
measures, then click on the Add to Summary button in Figure 3.5.
7.
However, in our example, the Avg network delay, Min network delay, Availability, and Packet loss are the
measures that have been chosen for generating default Network-Summary reports (see Figure 3.5).
8.
Settings so updated can be deleted using the
9.
Clicking the
icon agains tht eTest section will help you modify your selection. Figure 3.4 will then appear.
Now, to disassociate the measures of your choice, select them from the ASSOCIATED MEASURES list, click on the
> button, and finally, click on the Add button.
button.
System Reports
This category illustrates various reports of operating-system level metrics such as CPU, memory, and disk usage.
For configuring reports of the System category, select the System option and proceed in the same manner as
discussed above. Figure 3.7 depicts the process.
29
Getting Familiar with the eG Reporter User Interfac e
Figure 3.7: Specifying the measures for which default system reports are to be generated
In the example illustrated by Figure 3.7, note that three measures pertaining to the System Details test, namely,
Swap memory, Free memory and Scan rate, have been chosen for generating System-Measure reports. If summary
reports are to be generated for the same set of measures, then click on the Add to Summary button in Figure 3.8.
Figure 3.8: Clicking the Add to Summary button for generating the System Summary Reports
Application Reports
Application reports offer insights into an application’s performance. Different reports can be configured and provided
for each application.
For configuring reports belonging to the Application category, select the Application option and proceed as follows:
1.
Select a Report type from the list box (see Figure 3.9).
2.
Then, for generating reports for measures associated with a particular component type, select a type of
component from the Component type list box (see Figure 3.9).
3.
The Test list box will then be populated with all the tests associated with the selected component type. From
30
Getting Familiar with the eG Reporter User Interfac e
this list box, select the test that generates the measures for which reports are required (see Figure 3.9).
4.
Once a test is selected, all the measures associated with the selected test will appear in the DISASSOCIATED
MEASURES list (see Figure 3.9).
5.
Then, from the Disassociated Measures list, select the measures for which reports of the selected type are to
be generated (see Figure 3.9). Next, click on the < button to transfer the selected measures to the Associated
Measures list. Then, click on the Add button. This ensures that reports of the selected type for the chosen
component type are generated for the measures available in the Associated Measures list (see Figure 3.9).
6.
Similarly, measures associated with multiple tests can be chosen for report generation (see Figure 3.10).
Finally, click on the Update button.
Figure 3.9: Specifying the measures for which default application reports are to be generated
31
Getting Familiar with the eG Reporter User Interfac e
Figure 3.10: List of measures for which default application reports are to be generated
7.
In the example illustrated by Figure 3.9 and Figure 3.10, note that a host of measures for the tests related to
the Oracle Database have been included along with the Physical writes and Physical reads measure associated
with the Oracle TableSpaces test, for generating default Application-Measure reports. If summary reports are to
be generated for the same set of measures, then click on the Add to Summary button in Figure 3.10.
8.
Settings so updated can be deleted using the
9.
Now, to disassociate the measures, select them from the ASSOCIATED MEASURES list, click on the > button, and
finally, click on the Add button.
button.
Site Reports
Performance metrics relating to different web sites can be plotted in the Site category.
For configuring reports belonging to the Site category, select the Site option and proceed in the same manner as
discussed for Network reports. Figure 3.11 depicts this process.
32
Getting Familiar with the eG Reporter User Interfac e
Figure 3.11: Specifying the measures for which default service reports are to be generated
According to Figure 3.11, two measures pertaining to the Web Transactions test, namely, Aborts and Current
requests measures, have been chosen for generating default Site-Measure reports. If summary reports are to be
generated for the same set of measures, then click on the Add to Summary button in Figure 3.12.
Figure 3.12: Adding the measures to generate the Site specific Summary reprots
3.2 Specific Reports
In many cases, an administrator may want to specify a different set of metrics for each component being managed.
For example, the reports for the Oracle Database server running on the production server could be different from
that running on the staging server. Such reports that are specific to a particular component/application/site are
known as Specific Reports. To configure specific reports, select the Specific option from the Reports sub-menu of the
Configure menu. Like Default Reports, Specific Reports can also be categorized as Network, System, Application and
Site.
Network Reports
33
Getting Familiar with the eG Reporter User Interfac e
Figure 3.13: The eG Specific Reports page
Then, clicking the Add New button in Figure 3.13 will lead you to Figure 3.14. From Figure 3.14, configure the
following:
1.
For configuring reports belonging to the Network category, choose the Network option from Figure 3.14.
2.
Select a Report type from the list box (see Figure 3.14).
3.
Then, from the Component list box that lists all the managed components in the environment, select the
Component for which reports are to be generated (see Figure 3.14).
4.
Once a Component is selected, all the measures that were previously associated (if any) with the given
combination of Category type, Report type, and Component, will be displayed.
5.
Next, to select the measures for which a report of the selected type is to be generated, first, choose the Test
that generates the measures. The Test list box will list all those tests that are applicable to the selected
Component (see Figure 3.14).
6.
Upon selection of a test, all the measures associated with the selected test, but which are not yet associated
with the given Category type, Report type, and Component combination, will appear in the Disassociated
Measures list (see Figure 3.14).
Figure 3.14: Configuring specific network reports
7.
Now, from the Disassociated Measures list, select the measures for which reports of the selected type are to be
generated. Next, click on the < button to transfer the selected measures to the Associated Measures list (see
Figure 3.15).
34
Getting Familiar with the eG Reporter User Interfac e
Figure 3.15: Associating the Measures for configuring the Network Specific reports
8.
This ensures that Network Reports of the selected Report type for the chosen Component are generated for
each of the measures present in the ASSOCIATED MEASURES lists. In the example illustrated by Figure 3.15,
all the measures associated with the Network test have been chosen for generating network reports for the
component Client Desktop. If summary reports are to be generated for the same set of measures, then click on
the Add to Summary button.
9.
Settings so updated can be deleted using the
10.
Now, to disassociate the measures, select them from the Associated Measures list, click on the > button, and
finally, click on the Add button.
button.
System Reports
For configuring reports of the System category, select the System option and proceed in the same manner as
discussed above. Figure 3.16 depicts this process.
35
Getting Familiar with the eG Reporter User Interfac e
Figure 3.16: Configuring specific system reports
According to Figure 3.16, the CPU utilization and System CPU utilization measures of the System Details test have
been chosen for generating specific System-Measure reports for the component 192.168.9.10. If summary reports
are to be generated for the same set of measures, then click on the Add to Summary button.
Application Reports
For configuring reports belonging to the Application category, select the Application option (see Figure 3.17). Then,
proceed as follows:
1.
Select a Report type (Measure/Summary) from the list box (see Figure 3.17).
2.
Then, for generating reports for measures associated with a particular component type, select a Component
type (see Figure 3.17).
3.
Then, from the Component list box that lists all the managed components of the selected Component type,
select the Component for which reports are to be generated (see Figure 3.17).
4.
Once this is done, all the measures that have already been associated (if any) with the given combination of
Category type, Report type, Component type, and Component, will be displayed.
5.
Also, the Test list box will be populated with all the tests associated with the Component. From this list box,
select the test that generates the measures for which reports are required (see Figure 3.17).
6.
Once a test is selected, all the measures associated with the selected test will appear in the Disassociated
Measures list.
7.
Now, from the Disassociated Measures list, select the measures for which reports of the selected type are to be
generated. Next, click on the < button to transfer the selected measures to the Associated Measures list (see
Figure 3.17).
8.
Similarly, measures associated to multiple tests can be configured for a single report (see Figure 3.18).
36
Getting Familiar with the eG Reporter User Interfac e
Figure 3.17: Associating the measures of the Application Process test
Figure 3.18: Associating the measures of the OracleLocks test
9.
This ensures that Application Reports of the selected Report Type for the chosen Component are generated for
each of the measures picked from the Associated Measures list. In the example illustrated by Figure 3.17 and
Figure 3.18, note that the Processes running anf CPU utilization have been chosen for generating specific
Application-Measure reports. If summary reports are to be generated for the same set of measures, then click
on the Add to Summary button in Figure 3.18.
10.
Settings so updated can be deleted using the
11.
Now, to disassociate the measures, select them from the Associated Measures list, click on the > button, and
finally, click on the Add button.
button.
Site Reports
For configuring reports belonging to the Site category, select the Site option (see Figure 3.19). Then, proceed as
follows:
1.
Select a Report type (Measure/Summary) from the list box (see Figure 3.19).
2.
Then, for generating reports for measures associated with a particular site, select a site from the Sites list box
(see Figure 3.19).
3.
Once this is done, all the measures that have already been associated (if any) with the given combination of
Category type, Report type, and Site, will be displayed.
37
Getting Familiar with the eG Reporter User Interfac e
4.
Also, the Test list box will be populated with all the tests associated with the site. From this list box, select the
test that generates the measures for which reports are required (Figure 3.19).
5.
Once a test is selected, all the measures associated with the selected test will appear in the DISASSOCIATED
MEASURES list.
6.
Now, from the DISASSOCIATED MEASURES list, select the measures for which reports of the selected type are to
be generated. Next, click on the << Associate button to transfer the selected measures to the ASSOCIATED
MEASURES (see Figure 3.19) list.
7.
Finally, click on the Update button.
Figure 3.19: Configuring specific site reports
8.
This ensures that Site Reports of the selected Report type for the chosen site are generated for each of the
measures available in the Associated Measures list (see Figure 3.19). According to Figure 3.19, the Errors,
Requests and Aborts measures associated with the Web Transactions test has been chosen for generating
specific Site-Measure reports for the site1. If summary reports are to be generated for the same set of
measures, then click on the Add to Summary button.
9.
Settings so updated can be deleted using the
10.
Now, to disassociate the measures, select them from the Associated Measures list, click on the > button, and
finally, click on the Add button.
button.
3.3 User Reports
The eG manager also provides administrators the ability to define reports for individual users. To define a user
report, select the UserReports option from the Reporter menu of the Settings tile in the eG administrative interface.
Like Default Reports, User Reports can also be categorized as Network, System, Application and Site.
38
Getting Familiar with the eG Reporter User Interfac e
Figure 3.20: The eG User Report configuration
Network Reports
For configuring Network reports, do the following:
1.
Click Add New option from Figure 3.20.
2.
From Figure 3.21 that appears, select a user from the User list.
3.
Next, select the Network option (see Figure 3.21).
4.
Then, select a Report type from the list box (see Figure 3.21).
5.
Next, to select the measures for which a report of the selected type is to be generated, first, choose the Test
that generates the measures (see Figure 3.21).
6.
Upon selection of a test, all the measures associated with the selected test, but which are not yet associated
with the given User, Category type, and Report type combination, will appear in the Disassociated Measures list.
7.
Now, from the Disassociated Measures list, select the measures for which reports of the selected type are to be
generated. Next, click on the < button to transfer the selected measures to the Associated measures list (see
Figure 3.21).
Figure 3.21: Configuring user network reports
8.
Now, whenever the chosen user logs into the eG Reporter and attempts to generate Network Reports of the
selected Report type, the same will be generated for each of the measures available in the Associated Measures
list. In the example illustrated by Figure 3.21, note that the Avg network delay, Min network delay and Packet
loss measures associated with the Network test have been chosen for generating Network reports for the user
abdul2. If summary reports are to be generated for the same set of measures, then click on the Add to
Summary button in Figure 3.20.
39
Getting Familiar with the eG Reporter User Interfac e
9.
Settings so updated can be deleted using the
button.
10.
Now, to disassociate the measures, select them from the Associated Measures list, click on the > button, and
finally, click on the Add button.
System Reports
For configuring reports of the System category, select the user from the User list, choose the System option and then
proceed in the same manner as discussed for Network reports.
Application Reports
For configuring reports belonging to the Application category, do the following:
1.
Select a user from the User list (see Figure 3.22).
2.
Then, choose the Application option.
3.
Then, select a Report type (Measure/Summary) from the list box (see Figure 3.22).
4.
Next, for generating reports for measures associated with a particular component type, select a Component
type.
5.
Then, from the Component list box that lists all the managed components of the selected Component type,
select the Component for which reports are to be generated (see Figure 3.22).
6.
Also, the Test list box will be populated with all the tests associated with the Component. From this list box,
select the test that generates the measures for which reports are required (see Figure 3.22).
7.
Once a test is selected, all the measures associated with the selected test will appear in the Disassociated
Measures list (see Figure 3.22).
8.
Now, from the Disassociated Measures list, select the measures for which reports of the selected type are to be
generated. Next, click on the < button to transfer the selected measures to the Associated Measures list (see
Figure 3.22).
40
Getting Familiar with the eG Reporter User Interfac e
Figure 3.22: Configuring user application reports
9.
Now, whenever the chosen user logs into the eG Reporter and attempts to generate Application Reports of the
selected Report type, the same will be generated for each of the measures picked from the Associated
Measures list. In the example illustrated by Figure 3.22, the Current usage and Physical reads measure of the
OracleTablespaces test has been selected for generating Application-Measure reports for the user abdul2. If
summary reports are to be generated for the same set of measures, then click on the Add to Summary button.
10.
Settings so updated can be deleted using the
11.
Now, to disassociate the measures, select them from the Associated Measures list, click on the > button, and
finally, click on the Add button.
button.
Site Reports
For configuring reports belonging to the Site category, do the following:
1.
Select a user from the User list (see Figure 3.23).
2.
Next, select the Site category type (see Figure 3.23).
3.
Then, select a Report type (Measure/Summary) from the list box (see Figure 3.23).
4.
Once this is done, all the measures that have already been associated (if any) with the given combination of
Category type, and Report type, and User will be displayed.
5.
Also, the Test list box will be populated with all the tests associated with the site. From this list box, select the
test that generates the measures for which reports are required (see Figure 3.23).
6.
Once a test is selected, all the measures associated with the selected test will appear in the Disassociated
Measures list (see Figure 3.23).
7.
Now, from the Disassociated Measures list, select the measures for which reports of the selected type are to be
generated. Next, click on the < button to transfer the selected measures to the Associated Measures list (see
Figure 3.23).
8.
Finally, click on the Add button.
41
Getting Familiar with the eG Reporter User Interfac e
Figure 3.23: Configuring user-specific service reports
9.
In the example illustrated by Figure 3.23, the Connections and Requests measures have been chosen for
generating Site-Measure reports for user abdul2. If summary reports are to be generated for the same set of
measures, then click on the Add to Summary button.
10.
Settings so updated can be deleted using the
11.
Now, to disassociate the measures, select them from the Associated Measures list, click on the > button, and
finally, click on the Add button.
button.
User report specifications get the highest precedence, followed by component-specific
reports. Default report settings come into effect if neither user nor specific reports apply.
3.4 Consolidated Reports
The Consolidated Analysis reports option that the eG Reporter includes, provides a bird's eye view of infrastructure
performance. While detailed graphs are ideal for analyzing performance of one server or application or device in
detail, what IT operators of large infrastructures need to be able to see is a quick comparison of performance across
the servers in their infrastructure.
The comparison should span multiple metrics so that the IT operators can get at a glance consolidated view of their
infrastructure. The consolidated reports option addresses this requirement. Using this capability, IT operators can
quickly determine if there are hot-spots in their infrastructure, whether the load balancing is working as expected,
etc. Comparison of these reports over time can provide key indications regarding performance trends.
eG enterprise uses the grouping of servers as a Zone to define the scope of a consolidated report. Choosing the Zone
option, allows a consolidated report to be defined comparing all the servers in the Zone. The Server option
summarizes the performance of one of the components of the infrastructure.
42
Getting Familiar with the eG Reporter User Interfac e
Besides the above, eG Reporter provides the CITRIX / VDI Reports category that addresses the unique monitoring
requirements of thin client environments. This category provides valuable insights into different aspects of a thin
client infrastructure’s performance.
In order to enable you to focus on the critical/hyper-sensitive attributes of server/zone performance, eG Enterprise
allows you the flexibility to choose the measures that are to be displayed in a Zone or Server Consolidated Report. In
addition, the default Time period, Timeline, and Weekend settings for Consolidated and Thin Client reports can also
be set.
To achieve the above, do the following:
1.
Select the Consolidated Reports option from the Reporter menu of the Settings tile in the eG administrative
interface.
2.
Select a Report type from Figure 3.24 that appears. By default, Zone is selected. The other options are: Server,
Thin Client Session, Thin Client Application, and Thin Client User. The Thin Client reports are relevant for Citrix
and Terminal server environments.
Figure 3.24: Defining the Consolidated and Citrix/VDI Report Defaults
3.
Next, indicate the default Time period that is to be set for the chosen Report type.
4.
Similarly, the default Timeline setting for the Report type can also be specified. However, this setting applies to
Thin client reports only.
5.
Additionally, from the Weekend days list, you can select the days of the week that constitute a "weekend".
6.
To save the configurations, click on the Update button in Figure 3.24.
7.
Next, proceed to configure the measures to be displayed in the Consolidated Reports, by clicking on the Click
here hyperlink at the top of Figure 3.24.
8.
Figure 3.25 then appears. First, select the Report type (the options are Zone and Server) for which measures
are to be configured. The default selection is Zone. If the Report Type is Zone, then follow the steps given
below:
Choose the Component type for which the Zone report is to be generated. By default, the Default (All
Components) option is chosen here.
43
Getting Familiar with the eG Reporter User Interfac e
Figure 3.25: Selecting the measures to be displayed in a Consolidated Zone report
Next, select the Test to which the measures to be displayed in the report pertain.
Choose a Measure and provide a Display name for the measure in the report. If a Display name is not
provided, then the Measure name automatically becomes the Display name.
Measures that are associated with the Default (All Components) option will not be available
for selection while configuring measures for any other Component type.
Then, pick the functions to be applied to the values of the chosen Measure. Multiple functions can be
simultaneously selected. By default, the Avg and Max functions are available for selection. To add more
functions to the list, do the following:
Edit the eg_report.ini file in the <EG_INSTALL_DIR>\manager\config directory.
By default, the Function list in the [ZONE_REPORT] section of the file will be set to Avg and Max.
You can, if you so desire, append more functions to the list, or remove any of the existing
functions.
Finally, save the file.
Finally, add the specification by clicking on the Add button. The complete specification will then get added
to the Associated Measures list. Similarly, multiple specifications can be added to the list.
For the default Component type, Default (All Components), a few specifications pre-exist in the Associated
Measures list (see Figure 3.26). You can add more measures to this list, if required. This default list
automatically applies to all managed component-types. If measures are configured for a particular
component-type, then such measure configurations will only be appended to the default configurations.
44
Getting Familiar with the eG Reporter User Interfac e
Figure 3.26: Measures associated with the Default Component type
9.
Now, if the Report type is Server, then proceed in the following manner:
Select the Test to which the measures to be displayed in the report pertain (see Figure 3.27).
Figure 3.27: Selecting the measures to be displayed in a Consolidated Server report
Choose a Measure and provide a Display name for the measure in the report. If a Display name is not
provided, then the Measure name automatically becomes the Display name.
Finally, add the specification by clicking on the Add button. The complete specification will then get added
to the ASSOCIATED MEASURES list. Similarly, multiple specifications can be added to the list.
10.
To delete an entry from the Associated Measures list, select it and click the Delete button.
11.
To save the changes, click the Update button in Figure 3.27.
45
Getting Familiar with the eG Reporter User Interfac e
3.5 Configuring Percentile Values for Custom Capacity
Planning Report
The eG Reporter module offers a wide variety of reports using which one can cross-correlate and time-correlate
across thousands of metrics collected from across the environment. Reports generated using trend data particularly
can accurately reveal the past load and performance trends, using which future trends in load and usage can be
determined. The Avg, Sum, Max, and Min values computed by the eG Enterprise system on an hourly basis as part of
its trend computations, help a great deal in determining potential sizing inadequacies and planning the future
capacity of the environment. However, from a strict capacity planning perspective, Percentile values are deemed as
more effective pointers to capacity inadequacies than the avg, sum, max, and min values.
To enable users to effectively plan the capacity of their environment, eG Enterprise allows administrators to configure
the trend manager to compute percentile values, and then generate detailed Capacity Planning reports using the
computed percentiles.
To configure the minimum and maximum percentile values that the eG trend manager should compute for a
measure, do the following:
1.
Login to the eG administrative interface as admin.
2.
Follow the menu sequence: Settings -> Reporter -> Capacity Planning Reports.
By default, the Capacity Planning Reports option will not be available in the Reporter submenu - i.e., users are not allowed to configure/generate capacity planning reports by default.
To enable the generation of capacity planning reports, do the following:
3.
Edit the eg_services.ini file in the <EG_INSTALL_DIR>\manager\config directory.
In the [MISC_ARGS] section of the file, you will find a CapacityReportEnabled flag,
which is set to false by default. Change this flag to true.
Save the file.
By default, the Configure Percentile Policy tab page will open with the View option chosen (by default) from the
Percentile Policies list. If percentile definitions pre-exist, then the list of existing definitions will then appear. By
default, a definition named Default will pre-exist, which will be set to a maximum percentile value of 95 and a
minimum value of 5.
Figure 3.28: Viewing the list of percentile policies
4.
To add a new policy, click on the Add Percentile Policy button. This will invoke Figure 3.29.
46
Getting Familiar with the eG Reporter User Interfac e
Figure 3.29: Adding a new policy
5.
Here, provide a name for the percentile definition in the Percentile policy text box.
6.
Specify minimum and maximum percentile values in the Minimum and Maximum text boxes.
7.
Finally, click the Update button.
To modify a percentile definition, do the following:
1.
Click on the
button against the Percentile Policy of your choice from Figure 3.28.
Figure 3.30: Modifying a percentile policy
2.
From Figure 3.30 that appears, pick the Percentile Policy to be modified.
3.
The Minimum and Maximum values configured for the chosen percentile policy will then appear.
4.
Change the required values and click the Update button to save the changes.
47
Getting Familiar with the eG Reporter User Interfac e
To delete a percentile definition, do the following:
1.
Pick Percentile Policies to be deleted by selecting the corresponding check boxes (see Figure 3.28).
Figure 3.31: Deleting a percentile policy
2.
The
button will noe be enabled against the percentile Policies. Clicking on this button will delete the
percentile Policies. Note that eG Enterprise will allow the deletion of only those definitions that have not been
assigned to any measure yet.
3.6 Configuring the Capacity Planning Reports
Configuring the Capacity planning reports involves the following broad steps:
Enabling the Capacity Planning capability for specific tests
Associating the Percentile policies that were created earlier with the measures reported by a test
To achieve this, do the following:
1.
Follow the menu sequence: Settings -> Reporter -> Capacity Planning Reports.
2.
When Figure 3.32 appears, click on the Configure Tests tab page therein.
3.
Then, pick a Component Type from Figure 3.32.
48
Getting Familiar with the eG Reporter User Interfac e
Figure 3.32: Associating the percentile policy with a test
4.
By default, all tests associated with the chosen component-type will be listed in the Test Name list. Accordingly,
the All option is chosen by default from the Show Tests list. To view only those tests for which the 'capacity
planning capability' has already been enabled, pick the Capacity enabled option from the Show Tests list.
5.
Next, pick a Test Name. If the capacity planning capability is already enabled for the chosen test, then, the
Capacity Planning flag will be set to Enabled by default. If the capability is not yet enabled for the chosen test,
then the Capacity Planning flag will be set to Disabled by default. To enable this capability for the chosen test,
select the Enabled option.
6.
Then, proceed to configure each measure of the selected test to compute percentile values while performing
trending. For this, against each measure in Figure 3.32, pick the Percentile Policy that applies to that measure,
and then, pick the Minimum or Maximum option from the Report View list to indicate which value of the selected
Percentile Policy should be displayed in the report. This choice depends upon the nature of the measure - take
the CPU utilized measure for instance; since the CPU resource requirement of a system can be ascertained
based only on how high CPU usage was during a specific period of time in the past, it would make good sense
to associate the Maximum percentile value with the CPU utilized measure. Similarly, in the case of the Free
memory measure, where the memory requirement of a system can be determined by understanding how low
the free memory value was during the given Timeline, it would be more meaningful if the Minimum percentile
value is displayed in the report.
7.
Finally, click the Update button.
8.
Each measure will now be automatically associated with the Percentile Policy chosen from Figure 3.32. To view
which measures a particular percentile policy is associated, click the Configure Percentile Policy tab page in
Figure 3.32. Figure 3.33 appears listing all the percentile policies that pre-exist.
Figure 3.33: Viewing the percentile policies that pre-exist
9.
If any of the policies listed in Figure 3.33 have already been associated with one/more measures, a
will appear as shown in Figure 3.33.
49
button
Getting Familiar with the eG Reporter User Interfac e
10.
If you click on this button corresponding to a measure, Figure 3.34 will appear listing all those measures to
which the chosen percentile policy has been assigned.
Figure 3.34: Viewing the measures that are associated with a percentile policy
3.7 Configuring the Capacity Planning System Report Settings
If a system is configured with sufficient CPU, memory, bandwidth, and disk resources, the applications executing on
it seldom suffer performance degradations. Therefore, when planning the capacity of their mission-critical
applications/business services, administrators need to historically analyze how the systems hosting these
applications/supporting these business services used the physical resources that were at their disposal, identify usage
bottlenecks, and if required, recommend changes in system size as part of their capacity plans, so that unpleasant
application crashes or service outages can be averted in the future. Such a detailed appraisal of system-level
resource usage can be performed using the Systems Capacity Planning Report.
For each critical system resource that is monitored (CPU, memory, disk space, disk activity, and bandwidth), this
report computes and displays how that resource was utilized on an average (Avg) during a given timeline and also
computes the 95th percentile value of the corresponding usage measure. In addition, by comparing the 95 percentile
value with user-configured thresholds for the same, the report promptly detects and highlights resource usage
bottlenecks and the severity of these bottlenecks.
To configure the thresholds that should govern the 95th percentile value of the resource usage measures, do the
following:
1.
Follow the Configure -> Reporter -> Capacity Planning Reports menu sequence.
2.
When Figure 3.35 appears, click on the Configure System Reports tab page therein. When this is done, the
measures that capture system resource usage will be displayed - namely, CPU utilization, Physical memory
utilized, Percent disk space usage, Disk busy percentage, and Bandwidth usage.
Figure 3.35: Configuring the thresholds that govern the 95th percentile value of resource usage metrics
3.
You can change the display name of any of these measures by clicking on the corresponding
icon. Doing so
will invoke a small Display name pop-up (see Figure 3.36), specify the display name of your choice, and click
the Update button.
50
Getting Familiar with the eG Reporter User Interfac e
Figure 3.36: Changing the display name of the measure
4.
To begin configuring the thresholds for a measure, pick a Condition. This can be > (greater than) or < (lesser
than).
5.
Then, specify the Major Value and/or Critical Values (thresholds) for the measure. In the same way, you can
configure thresholds for the remaining measures. Finally, click the Update button to save the threshold settings.
6.
If the > Condition is chosen for a measure, then, during report generation, the eG Enterprise system will check
whether the 95th percentile value of that measure is 'greater than' its Major threshold configuration or Critical
threshold configuration. Likewise, if the < Condition is chosen, then the eG Enterprise system will check whether
the 95th percentile value is 'lesser than' the Major or Critical threshold configuration. If the Major threshold has
been violated, then the corresponding measure value will be highlighted in Orange in the report. Similarly, a
Critical threshold violation will result in the 95th percentile value being highlighted in Red in the report.
3.8 Procedure for discovering the domains of the Security
Groups
The eG Enterprise Suite provides you with a wide range of reports using which you can effectively monitor the
target environment. One among the reports that eG offers is the User Session Details report which can be
generated for each user of Security Group within in a domain. To generate such a report, you would be
required to follow the procedure as mentioned below:
1.
Follow the menu sequence: Settings -> Reporter -> AD User Report in the eG administrative interface. Figure
3.37 will then appear.
51
Getting Familiar with the eG Reporter User Interfac e
Figure 3.37: The AD User Reports page
2.
Clicking the Add a new domain button in Figure 3.37 will lead you to Figure 3.38 where you will be required to
add the domain of the active directory groups that need to be discovered.
Figure 3.38 : Adding a domain
3.
Specify the following in Figure 3.38:
First, provide a Display Name for the domain.
Next, specify the fully qualified Domain name.
Specify the port at which the domain operates in the Port No text box.
To connect to the Active Directory server and access the domain user information stored within, the eG
manager requires a domain user’s privileges. To facilitate this connection, provide a valid domain user’s
name and password against Domain User and Domain User’s Password.
Then, indicate whether the Active Directory server is SSL-enabled or not, by setting the SSL Enabled flag
to Yes or No, as the case may be. If the SSL Enabled flag is set to Yes, then you will have to follow the
procedure discussed in the Appendix of the eG User manual to ensure that the eG manager is able to
communicate with the AD server over SSL.
Once the Update button is clicked, the domain will be added in the AD USER REPORTS page as shown in
Figure 3.39.
52
Getting Familiar with the eG Reporter User Interfac e
Figure 3.39: Domains configured for generating the User Session Details report
4.
In order to select the Security groups for which the User Session Details report is to be generated, click on the
icon in Figure 3.39. Figure 3.40 will then appear.
Figure 3.40: Choosing the Security groups for which the User Session Details report is to be generated
5.
By default, all the Security groups will be listed in the right panel of Figure 3.40. If you wish to view the
Security groups of a chosen Organizational Unit within a domain, then click on the Organizational unit that is
available in the left panel of Figure 3.40. Select the Security groups for which the report is to be generated and
click the Update button.
6.
If you wish to view the Security groups that were selected, then, click the View Selection button of Figure 3.40.
Figure 3.41 will appear listing all the selected Security groups. To search for a particular Security group, use the
Search text box of Figure 3.40.
53
Getting Familiar with the eG Reporter User Interfac e
Figure 3.41: Viewing the chosen Security groups
7.
Once, the Security groups are selected and updated, click the
Figure 3.42 will then appear.
54
icon to view the configured Security groups.
Getting Familiar with the eG Reporter User Interfac e
Figure 3.42: Viewing the configured Security groups
8.
To modify the Domain, click on the
icon (see Figure 3.39).
9.
In order to delete a domain or if you do not wish to discover the Security groups of a particular domain, then
you can delete the domain by selecting the domain and clicking the
10.
icon.
Clicking on the
icon will lead you to Figure 3.43 using which you can define certain settings for the
discovery of the Security groups.
55
Getting Familiar with the eG Reporter User Interfac e
Figure 3.43: Specifying the Settings for discovering the Security groups
11.
12.
Figure 3.43 helps you define the following settings for discovering the Security groups:
If you wish to generate the report based on active directory groups, then set the Report by Security group
flag to Yes. By default, this flag will be set to No.
The Security groups can either be discovered on a daily/weekly basis. From the Discover frequency (in
days) drop-down list, select 1 for a daily discovery or 7 for a weekly discovery. If you wish to discover the
Security groups once in the number of days of your choice, you can do so by selecting a number ranging
from 1 to 7 from this list.
If the frequency with which the active directory groups have to be discovered is specified, then the time of
starting the discovery process also needs to be specified. To do so, select the time duration against the
Discovertime range list. If you want to start the discovery process between 8 PM and 9 PM, then select 20
from the first list and 21 from the second list. By default, the values specified in these lists are 20 and 21
respectively.
If you wish to generate logs using which you can troubleshoot issues in the future, then, select Yes against
the Enable debugs flag. By default, this flag is set to No.
Clicking the Update button will register the changes and help you generate the User Session Details report
accordingly.
The User Session Details report can now be generated for the users within each of the chosen Security groups.
56
The Executive Reports
The Executive Summary Reports
The report options offered by the Executive Summary node of the RPEORTS BY FUNCTION tree in the eG Reporter
provide a more high-level insight into the performance of the IT infrastructure elements. These reports aid the higher
tiers of the management to assess the performance of specific components, segments, services, and component
types, identify repeated issues (if any), analyze the root-cause of such issues, and advise a course of action.
57
The Executive Reports
Figure 4.1: Types of Executive Summary Reports
The sections to come will discuss each of these ExecutiveSummary Reports in detail.
4.1 Executive Summary By Component Reports
Using the Executive Summary By Component reports, you can receive an overview of the performance of a particular
component during a specific period. To achieve the same, do the following:
13.
Select the By Component option from the Executive Summary node of the REPORTS BY FUNCTION tree. (see
Figure 4.1).
14.
From the Component list box in the page that appears, select the component for which the executive summary
report needs to be viewed (see Figure 4.3). If there are too many components in the list to choose from, you
can narrow your search further by using the Filter by text box. Specify the whole/part of the component name
to search for in this text box, and click the right-arrow button next to it. The Component list will then be
58
The Executive Reports
populated with all component names that embed the specified search string. Select the component of your
choice from this list.
Figure 4.2: Generating the Executive Summary By Component Report
15.
Provide a Timeline for the report. You can either provide a fixed time line such as 1 hour, 2 days, etc., or select
the Any option from the list to provide a From and To date/time for report generation.
For every user registered with the eG Enterprise system, the administrator can indicate the
maximum timeline for which that user can generate a report. Once the maximum timeline is
set for a user, then, whenever that user logs into eG Reporter and attempts to generate a
report, the Timeline list box in the report page will display options according to the maximum
timeline setting of that user. For instance, if a user can generate a report for a maximum
period of 3 days only, then 3 days will be the highest option displayed in the Timeline list i.e., 3 days will be the last option in the fixed Timeline list. Similarly, if the user chooses the
Any option from the Timeline list and proceeds to provide a start date and end date for
report generation using the From and To specifications, eG Enterprise will first check if the
user's Timeline specification conforms to his/her maximum timeline setting. If not, report
generation will fail. For instance, for a user who is allowed to generate reports spanning over
a maximum period of 3 days only, the difference between the From and To dates
should never be over 3 days. If it is, then, upon clicking the Run Report button a
message box will appear, prompting the user to change the From and To
specification.
16.
In large environments, reports generated using months of data can take a long time to complete. With eG
Enterprise v6, administrators now have the option of generating reports on-line or in the background. When a
report is scheduled for background generation, administrators can proceed with their other monitoring,
diagnosis, and reporting tasks, while the eG manager is processing the report. This saves the administrator
valuable time. To schedule background processing of a report, select the Background Save - PDF option from
the Report Generation list. In this case, a Report Name text box will appear, where you would have to provide
the name with which the report is to be saved in the background. To process reports in the foreground, select
the Foreground Generation - HTML option from this list.
59
The Executive Reports
17.
The Report Generation list will appear only if the EnableBackgroundReport flag in
the [BACKGROUND_PROCESS] section of the eg_report.ini file (in the
{EG_INSTALL_DIR}\manager\config directory) is set to Yes.
The default selection in the Report Generation list will change according to the
Timeline specified for the report. If the Timeline set is greater than or equal to the
number of days specified against the MinDurationForReport parameter in the
[BACKGROUND_PROCESS] section of the eg_report.ini file, then the default
selection in the Report Generation list will be Background. On the other hand, if the
Timeline set for the report is lesser than the value of the MinDurationForReport
parameter, then the default selection in the Report Generation list will be
Foreground. This is because, the MinDurationForReport setting governs when
reports are to be processed in the background. By default, this parameter is set to
2 weeks - this indicates that by default, reports with a timeline of 2 weeks and
above will be processed in the background.
Finally, click on the Run Report button to generate the report. If the option chosen from the Report Generation
list is Foreground Generation - HTML, then, clicking on the Run Report button will invoke Figure 4.3.
Figure 4.3: The generated Executive Summary By Component report
18.
There are four sections in the generated report. The first section is a pie chart that provides a bird's-eye view of
the health of the component during the designated period. The slices of the pie chart and their respective colors
represent the percentage of time the component has been in different states (Normal, Critical, Major, Minor,
and Unknown).
60
The Executive Reports
19.
To facilitate quick and accurate root-cause identification, the eG Reporter component includes a unique drilldown feature. To use this feature, click on a problem (Critical/Major/Minor) slice in the pie chart. This will lead
you to the Snapshot Report of the chosen component (see Figure 4.4) for the chosen period. The snapshot will
reveal the measures that were responsible for the problem conditions indicated by the slice clicked on. For more
details on Snapshot Reports, refer to Chapter 1 .
Figure 4.4: The Snapshot that appears when a slice in the pie chart is clicked
20.
The second section of the Executive Summary By Component report depicts how well the component has
performed on a daily basis during the specified period. The information depicted here enables an executive to
detect the daily trends in the performance of the component. Here again, the various divisions within a bar and
their respective colors denote the state variations in the component during the given period. The height of a
division depends upon the duration (in minutes) for which the component has remained in a particular state.
By default, the DAYWISE DISTRIBUTION section of this page depicts the duration for which a
component has remained in a particular state, in minutes. Instead, if you prefer to view the
percentage of time during a day a component was in any particular state, set the Daywise
distribution reports in flag in the MONITOR SETTINGS page (Configure -> Settings menu in
the eG administrative interface) to Percentage.
21.
If you click on a bar corresponding to a particular date, then, a Snapshot Report of the chosen component for
that date will be displayed (see Figure 4.5).
61
The Executive Reports
Figure 4.5: The Snapshot Report which appears when the bar corresponding to a particular date is clicked
22.
The third section of the Executive Summary By Component report is a summary table that highlights the top
five alarms that have remained for the longest duration. The details displayed include the alarm priority, the
Layer in which the problem was detected, the Duration of the problem, the date and time of problem
occurrence (From) and the date and time of problem resolution (To). This information will help an executive
figure out which layers were responsible for some of the worst problems in the component. It is also a good
indicator of the efficiency of the administrative staff in fixing issues. If an entry in the To column is prefixed by
the phrase "Open @" it indicates that the problem remained open until the end of the chosen Timeline. To zeroin on the exact problem that affected a layer for the displayed Duration, click on the layer name hyperlink. An
Event History page (see Figure 4.6) will appear, listing the performance metrics that deviated causing the layer
to suffer for the displayed Duration.
Figure 4.6: The history of alarms corresponding to the layer clicked on
23.
The fourth section of the Executive Summary By Component report (see Figure 4.3) is an event summary,
which lists all the layers in the layer model of the chosen component, and displays the percentage of time
during the specified Timeline a layer encountered Critical/Major/Minor issues. This event summary, when
viewed along with the top 5 summary, will enable you to accurately identify the problem-prone layers of the
component (see Figure 4.3). Clicking on a layer name here will enable you to view all the measures that were
responsible for the problems in the layer during the chosen period (see Figure 4.7).
62
The Executive Reports
Figure 4.7: The history of alarms pertaining to the layer clicked on
24.
To view the data that is plotted on the bar graph of Figure 4.3, click on the DATA button therein. Figure 4.8 will
then appear. You can print the data or save it as a CSV file by clicking on the required icons at the right, top
corner of Figure 4.8.
Figure 4.8: Data plotted on the bar graph
25.
On the other hand, if the Background Save - PDF option is chosen from the Report Generation list, then, clicking
on the Run Report button will not invoke the report. Instead, a message depicted by Figure 4.9 will appear.
63
The Executive Reports
Figure 4.9: A message indicating that the report is being processed in the background
26.
To view the report, click on the Click here to see a list of generated and processing reports link in Figure 4.9.
27.
Figure 4.10 will then appear listing the executive reports that have been scheduled for background generation.
Figure 4.10: List of Background reports
28.
Alongside a report name in this page, you can view when background processing of the report started (Creation
Time), the report Timeline, the Date Range for which the report was generated, and the Status of the
background processing of the report. Once processing completes, the report is saved as a PDF file.
29.
If the Status column corresponding to a report displays Completed, then, you can view the report as a PDF by
clicking on the
icon against that report. If for some reason background processing fails, then the Status
column will display Failed instead. In this case, you can either regenerate the report in the background, or
delete the report. To regenerate the report, click on the
icon.
30.
If this page lists too many reports, then, you can apply one/more filter criteria on the list, so that you can
quickly view information related to only those background reports that are of specific interest to you. For
instance, to view the background reports of a particular type alone, select a Report Type from this page. To
view details pertaining to all background reports, pick the All Report Types option from the Report Type list.
31.
Similarly, you can view the status of a particular report, by doing the following:
Pick Report Name from the Filter by list.
Specify the whole/part of the report name in the Search text box and click the right-arrow button next to it.
The page will then display the details of only that background report, which has the name provided in the
Search text box.
32.
In the same way, you can even search for reports by status. For this, do the following:
64
The Executive Reports
Pick Status from the Filter by list.
Specify the status to search for in the Search text box and click the right-arrow button next to it.
The page will then display the details of only those background reports which are in the state provided in
the Search text box.
33.
To delete any of the listed reports, click on the check box alongside the report, and then click on the DELETE
button in this page (see Figure 4.11). To delete all the listed reports, first, click on the check box adjacent to
the column heading, Report TYPE; this will mark all the reports displayed in this page for deletion. Then, click
on the DELETE button.
Figure 4.11: Deleting a background report
4.2 Executive Summary By Segment Reports
Using Executive Summary By Segment reports, an executive can receive an overview of the performance of a
particular segment during a specific period. To achieve the same, do the following:
1.
Select the By Segment option from the Executive Summary node of the REPORTS BY FUNCTION tree of Figure
4.1. Figure 4.12 will then appear.
Figure 4.12: Generating an Executive Summary By Segment report
2.
From the Segment list box in the page that appears (see Figure 4.12), select the segment for which the
executive summary report needs to be viewed.
3.
Provide a Timeline for the report. You can either provide a fixed time line such as 1 hour, 2 days, etc., or select
the Any option from the list to provide a From and To date/time for report generation.
65
The Executive Reports
For every user registered with the eG Enterprise system, the administrator can indicate the
maximum timeline for which that user can generate a report. Once the maximum timeline is
set for a user, then, whenever that user logs into eG Reporter and attempts to generate a
report, the Timeline list box in the report page will display options according to the maximum
timeline setting of that user. For instance, if a user can generate a report for a maximum
period of 3 days only, then 3 days will be the highest option displayed in the Timeline list i.e., 3 days will be the last option in the fixed Timeline list. Similarly, if the user chooses the
Any option from the Timeline list and proceeds to provide a start date and end date for
report generation using the From and To specifications, eG Enterprise will first check if the
user's Timeline specification conforms to his/her maximum timeline setting. If not, report
generation will fail. For instance, for a user who is allowed to generate reports spanning over
a maximum period of 3 days only, the difference between the From and To dates should
never be over 3 days. If it is, then, upon clicking the Run Report button a message box will
appear, prompting the user to change the From and To specification.
4.
5.
In large environments, reports generated using months of data can take a long time to complete. With eG
Enterprise v5, administrators now have the option of generating reports on-line or in the background. When a
report is scheduled for background generation, administrators can proceed with their other monitoring,
diagnosis, and reporting tasks, while the eG manager is processing the report. This saves the administrator
valuable time. To schedule background processing of a report, select the Background Save - PDF option from
the Report Generation list. In this case, a Report Name text box will appear, where you would have to provide
the name with which the report is to be saved in the background. To process reports in the foreground, select
the Foreground Generation - HTML option from this list.
The Report Generation list will appear only if the EnableBackgroundReport flag in
the [BACKGROUND_PROCESS] section of the eg_report.ini file (in the
{EG_INSTALL_DIR}\manager\config directory) is set to Yes.
The default selection in the Report Generation list will change according to the
Timeline specified for the report. If the Timeline set is greater than or equal to the
number of days specified against the MinDurationForReport parameter in the
[BACKGROUND_PROCESS] section of the eg_report.ini file, then the default selection
in the Report Generation list will be Background. On the other hand, if the Timeline
set for the report is lesser than the value of the MinDurationForReport parameter,
then the default selection in the Report Generation list will be Foreground. This is
because, the MinDurationForReport setting governs when reports are to be
processed in the background. By default, this parameter is set to 2 weeks - this
indicates that by default, reports with a timeline of 2 weeks and above will be
processed in the background.
Finally, click on the RUN REPORT BUTTON to generate the report. If the option chosen from the Report
Generation list is Foreground Generation - HTML, then, clicking on the RUN REPORT BUTTON will invoke Figure
4.13.
66
The Executive Reports
Figure 4.13: The Executive Summary By Segment Report
6.
There are four sections in the generated report. The first section is a pie chart that provides a bird's-eye view of
the health of the segment during the designated period. The slices of the pie chart and their respective colors
represent the percentage of time the segment has been in different states (Normal, Critical, Major, Minor, and
Unknown).
7.
If a slice in the pie chart reveals problems with the segment, then you can zoom into the segment component
causing these problems, by clicking on the slice. Doing so will reveal the Executive Summary Report of the
segment Component that was most affected by the problems indicated by the slice clicked on, during the
specified period. For example, if you click on the Critical slice in the pie chart of Figure 4.13, then Figure 4.14
will appear. Using the Executive Summary By Segment report of Figure 4.14, you can conclude that the Active
Directory server in the segment was the one that suffered the maximum number of critical issues during the
specified period. This in turn would have affected the functioning of the entire segment.
67
The Executive Reports
Figure 4.14: The Executive Summary report of the Component that is the root-cause of the problems in the segment
8.
9.
The second section of the Executive Summary Report for a segment is a bar graph that depicts how well the
segment has performed on a daily basis during the specified period. The information depicted here will enable
an executive to detect the daily trends in the performance of the segment. Here again, the various divisions
within a bar and their respective colors denote the state variations in the segment during the given period. The
height of a division depends upon the duration (in minutes) for which the component has remained in a
particular state.
The state of a segment is determined based on the states of its individual
components. If any component of a segment is in a critical state, the segment
state is regarded as being critical.
By default, the DAYWISE DISTRIBUTION section of this page depicts the duration
for which a segment has remained in a particular state, in minutes. Instead, if you
prefer to view the percentage of time during a day a segment was in any particular
state, set the Daywise distribution reports in flag in the MONITOR SETTINGS page
(Configure -> Monitor Settings menu in the eG administrative interface) to
Percentage.
To know the root-cause of the Critical/Major/Minor problems that have occurred in the segment on a particular
day, simply click on the corresponding division in the bar of Figure 4.13. The Executive Summary Report of the
segment Component that has caused the problem (Critical/Major/Minor) on that day will appear (see Figure
4.15). For example, if you click on the Critical division in the bar corresponding to a day of the chosen Timeline,
68
The Executive Reports
Figure 4.15 will appear displaying the Executive Summary Report of the Active Directory server component that
encountered the maximum number of critical issues on that day.
Figure 4.15: The Executive Report of the Component causing problems in the segment on a particular day
10.
The third section of the Executive Summary By Segment Report is a summary table that highlights the top five
alarms that have remained for the longest duration. The details displayed include the alarm priority, the
segment Component in which the problem was detected, the Duration of the problem, the date and time of
problem occurrence (From) and the date and time of problem resolution (To). This information will help an
executive figure out which components were responsible for some of the worst problems in the segment.
11.
Click on the Component in this section to view the Executive Report of that Component for the specified period
(see Figure 4.16). For example, clicking on the CitrixAppController in Figure 4.13 will reveal the Executive
Summary Report of Figure 4.16.
69
The Executive Reports
Figure 4.16: The Executive Summary By Component Report that appears when a component is clicked on
12.
The fourth section of the Executive Summary By Segment report is another event summary, which not only lists
all the components in the chosen segment, but also indicates the percentage of time a component was faced
with Critical, Major, or Minor performance issues. This event summary, when viewed along with the top 5
summary, will help you accurately identify the problem-prone components of the segment.
13.
Click on the Component in this section to view the Executive Summary Report of that Component for the chosen
period. Clicking on the Component Type hyperlink, will lead you to the Executive Report of that particular
Component Type for the specified timeline (see Figure 4.17). This will help you assess the performance of the
component type as a whole during that timeline.
70
The Executive Reports
Figure 4.17: Executive Report of the Component Type that is clicked on
14.
On the other hand, if the Background Save - PDF option is chosen from the Report Generation list, then, clicking
on the RUN REPORT BUTTON will not invoke the report. Instead, a message depicted by Figure 4.9 will appear.
To view the report, click on the Click here to see a list of generated and processing reports link in Figure 4.9,
and proceed as indicated in Section 4.1 of this document.
4.3 Executive Summary By Service Reports
Using the Executive Summary By Service reports, an executive can receive a broad idea about the performance of a
particular service during a specific period. To generate this report, do the following:
1.
Select the By Service option from the Executive Summary node of the REPORTS BY FUNCTION tree of Figure
4.1.
2.
From the Service list box in the page that appears next (see Figure 4.18), select the service for which the
executive summary report needs to be viewed.
Figure 4.18: Generating an Executive Summary By Service Report
3.
Provide a Timeline for the report. You can either provide a fixed time line such as 1 hour, 2 days, etc., or select
the Any option from the list to provide a From and To date/time for report generation.
71
The Executive Reports
For every user registered with the eG Enterprise system, the administrator can indicate the
maximum timeline for which that user can generate a report. Once the maximum timeline is
set for a user, then, whenever that user logs into eG Reporter and attempts to generate a
report, the Timeline list box in the report page will display options according to the maximum
timeline setting of that user. For instance, if a user can generate a report for a maximum
period of 3 days only, then 3 days will be the highest option displayed in the Timeline list i.e., 3 days will be the last option in the fixed Timeline list. Similarly, if the user chooses the
Any option from the Timeline list and proceeds to provide a start date and end date for
report generation using the From and To specifications, eG Enterprise will first check if the
user's Timeline specification conforms to his/her maximum timeline setting. If not, report
generation will fail. For instance, for a user who is allowed to generate reports spanning over
a maximum period of 3 days only, the difference between the From and To dates
should never be over 3 days. If it is, then, upon clicking the Run Report button a
message box will appear, prompting the user to change the From and To
specification.
4.
5.
In large environments, reports generated using months of data can take a long time to complete.
Administrators now have the option of generating reports on-line or in the background. When a report is
scheduled for background generation, administrators can proceed with their other monitoring, diagnosis, and
reporting tasks, while the eG manager is processing the report. This saves the administrator valuable time. To
schedule background processing of a report, select the Background Save - PDF option from the Report
Generation list. In this case, a Report Name text box will appear, where you would have to provide the name
with which the report is to be saved in the background. To process reports in the foreground, select the
Foreground Generation - HTML option from this list.
The Report Generation list will appear only if the EnableBackgroundReport flag in
the [BACKGROUND_PROCESS] section of the eg_report.ini file (in the
{EG_INSTALL_DIR}\manager\config directory) is set to Yes.
The default selection in the Report Generation list will change according to the
Timeline specified for the report. If the Timeline set is greater than or equal to the
number of days specified against the MinDurationForReport parameter in the
[BACKGROUND_PROCESS] section of the eg_report.ini file, then the default
selection in the Report Generation list will be Background. On the other hand, if the
Timeline set for the report is lesser than the value of the MinDurationForReport
parameter, then the default selection in the Report Generation list will be
Foreground. This is because, the MinDurationForReport setting governs when
reports are to be processed in the background. By default, this parameter is set to
2 weeks - this indicates that by default, reports with a timeline of 2 weeks and
above will be processed in the background.
Finally, click on the Run Report button to generate the report. If the option chosen from the Report Generation
list is Foreground Generation - HTML, then, clicking on the Run Report button will invoke Figure 4.19.
72
The Executive Reports
Figure 4.19: The Executive Summary By Service Report
6.
There are four sections in the generated report (see Figure 4.19). The first section is a pie chart that provides a
bird's-eye view of the health of the service during the designated period. The slices of the pie chart and their
respective colors represent the percentage of time the service has been in different states (Normal, Critical,
Major, Minor, and Unknown).
7.
To drill down to the root-cause of the problems indicated by a slice in the pie chart, click on the slice. When this
is done, you will be lead to the Executive Summary Report of exactly that component (associated with the
chosen service), the performance of which was badly hit by the problems indicated by the slice clicked on. For
example, Figure 4.20 will appear when the ‘Critical’ slice in the pie chart of Figure 4.19 is clicked.
73
The Executive Reports
Figure 4.20: Executive Summary Report of the Component causing problems in the service performance
8.
From Figure 4.20, it is evident that the Exchange Client Access server is responsible for all the critical problems
in the service during the given timeline.
9.
The second section of Executive Summary By Service Report is a bar graph that depicts how well the service
has performed on a daily basis during the specified period. The information depicted here will enable an
executive to detect the daily trends in the performance of the service. Here again, the various divisions within a
bar and their respective colors denote the state variations in the service during the given period. The height of
a division depends upon the duration (in minutes) for which the service has remained in a particular state.
By default, the DAYWISE DISTRIBUTION section of this page depicts the duration for which a
segment has remained in a particular state, in minutes. Instead, if you prefer to view the
percentage of time during a day a segment was in any particular state, set the Daywise
distribution reports in flag in the MONITOR SETTINGS page (Configure -> Monitor Settings
menu in the eG administrative interface) to Percentage.
10.
When you click on a problem division in the bar, you will be able to view the Executive Report of the
Component, which was the root-cause for the occurrence of that problem in the service on that particular day.
For example, say, that you click on the Critical division in the bar that corresponds to 13th September 2014 of
the chosen timeline. Doing so will open Figure 4.21, which clearly indicates that the Exchange Client Access
server is responsible for all the Criticalr problems in the service on the 13th of September 2014.
74
The Executive Reports
Figure 4.21: Executive Summary Report of the Component on a particular day
11.
The third section is a summary table that highlights the top five alarms that have remained for the longest
duration. The details displayed include the alarm priority, the service Component in which the problem was
detected, the Duration of the problem, the date and time of problem occurrence (From) and the date and time
of problem resolution (To). This information will help an executive figure out which components were
responsible for some of the most severe problems in the service.
The state of a service is determined based on the states of its individual components. If any
component of a service is in a critical state, the service is regarded as being in a critical state.
12.
Click on the Component of your choice in this section to view the Executive Summary report of that Component
for the specified period (see Figure 4.22).
75
The Executive Reports
Figure 4.22: Executive Summary Report of the Component that is clicked
13.
The fourth section of the Executive Summary By Service Report is another event summary, which not only lists
all the components associated with the service, but also indicates the percentage of time a component
encountered Critical, Major, or Minor issues. This event summary, when viewed along with the top 5 summary,
will help you accurately identify the problem-prone components of the service. Clicking on the Component name
will reveal the Executive Summary Report of that component for the chosen Timeline (see Figure 4.23).
76
The Executive Reports
Figure 4.23: Executive Report of the Component that was clicked on
14.
On the other hand, if the Background Save - PDF option is chosen from the Report Generation list, then, clicking
on the Run Report button will not invoke the report. Instead, a message depicted by Figure 4.9 will appear. To
view the report, click on the Click here to see a list of generated and processing reports link in Figure 4.9, and
proceed as indicated in Section 4.1 of this document.
4.4 Executive Summary By Component Type Reports
Using Executive Summary By Component Type reports, an executive can receive a broad idea about the performance
of a particular component type during a specific period. To generate such a report, do the following:
1.
Select the By Component Type option from the EXECUTIVE SUMMARY node of the REPORTS BY FUNCTION tree
(see Figure 4.1).
2.
From the Component Type list box that appears, select the component-type for which the executive report
needs to be viewed.
Figure 4.24: Generating an Executive Summary By Component Type Report
3.
Provide a Timeline for the report. You can either provide a fixed time line such as 1 hour, 2 days, etc., or select
the Any option from the list to provide a From and To date/time for report generation.
77
The Executive Reports
For every user registered with the eG Enterprise system, the administrator can indicate the
maximum timeline for which that user can generate a report. Once the maximum timeline is
set for a user, then, whenever that user logs into eG Reporter and attempts to generate a
report, the Timeline list box in the report page will display options according to the maximum
timeline setting of that user. For instance, if a user can generate a report for a maximum
period of 3 days only, then 3 days will be the highest option displayed in the Timeline list i.e., 3 days will be the last option in the fixed Timeline list. Similarly, if the user chooses the
Any option from the Timeline list and proceeds to provide a start date and end date for
report generation using the From and To specifications, eG Enterprise will first check if the
user's Timeline specification conforms to his/her maximum timeline setting. If not, report
generation will fail. For instance, for a user who is allowed to generate reports spanning over
a maximum period of 3 days only, the difference between the From and To dates
should never be over 3 days. If it is, then, upon clicking the Run Report button a
message box will appear, prompting the user to change the From and To
specification.
4.
5.
In large environments, reports generated using months of data can take a long time to complete.
Administrators now have the option of generating reports on-line or in the background. When a report is
scheduled for background generation, administrators can proceed with their other monitoring, diagnosis, and
reporting tasks, while the eG manager is processing the report. This saves the administrator valuable time. To
schedule background processing of a report, select the Background Save - PDF option from the Report
Generation list. In this case, a Report Name text box will appear, where you would have to provide the name
with which the report is to be saved in the background. To process reports in the foreground, select the
Foreground Generation - HTML option from this list.
The Report Generation list will appear only if the EnableBackgroundReport flag in
the [BACKGROUND_PROCESS] section of the eg_report.ini file (in the
{EG_INSTALL_DIR}\manager\config directory) is set to Yes.
The default selection in the Report Generation list will change according to the
Timeline specified for the report. If the Timeline set is greater than or equal to the
number of days specified against the MinDurationForReport parameter in the
[BACKGROUND_PROCESS] section of the eg_report.ini file, then the default
selection in the Report Generation list will be Background. On the other hand, if the
Timeline set for the report is lesser than the value of the MinDurationForReport
parameter, then the default selection in the Report Generation list will be
Foreground. This is because, the MinDurationForReport setting governs when
reports are to be processed in the background. By default, this parameter is set to
2 weeks - this indicates that by default, reports with a timeline of 2 weeks and
above will be processed in the background.
Finally, click on the RUN REPORT BUTTON to generate the report. If the option chosen from the Report
Generation list is Foreground Generation - HTML, then, clicking on the RUN REPORT BUTTON will invoke Figure
78
The Executive Reports
4.25.
Figure 4.25: The Executive Summary By Component Type Report
6.
There are four sections in the generated report (see Figure 4.25). The first section is a pie chart that provides a
bird's-eye view of the health of the component type during the designated period. The slices of the pie chart
and their respective colors represent the percentage of time the component type has been in different states
(Normal, Critical, Major, Minor, and Unknown).
7.
In order to identify the root-cause of the problems denoted by a particular slice in the pie chart, click on the
slice. This will invoke the Executive Summary report of that Component of the chosen type that was primarily
responsible for the performance degradation suffered by the component type during the time frame specified
(see Figure 4.26).
79
The Executive Reports
Figure 4.26: Executive Summary report of the Component that belongs to the Component Type
8.
The second section of the report is a bar graph that depicts how well the component type has performed on a
daily basis during the specified period. The information depicted here will enable an executive to detect the
daily trends in the performance of the Component Type. Here again, the various divisions within a bar and their
respective colors denote the state variations in the component type during the given period. The height of a
division depends upon the duration (in minutes) for which the components of the chosen type have remained in
a particular state.
By default, the DAYWISE DISTRIBUTION section of this page depicts the duration for which a
segment has remained in a particular state, in minutes. Instead, if you prefer to view the
percentage of time during a day a segment was in any particular state, set the Daywise
distribution reports in flag in the MONITOR SETTINGS page (Configure -> Monitor Settings
menu in the eG administrative interface) to Percentage.
9.
To figure out the root-cause of the problems indicated by a particular division in a bar, click on the division.
When this is done, Figure 4.27 will appear displaying the Executive Summary report of that Component, which
faced the maximum number of these problems on that particular day.
80
The Executive Reports
Figure 4.27: Executive Summary Report of the Component causing a fall in the performance of the Component Type
10.
The third section is a summary table that highlights the top five alarms that have remained for the longest
duration. The details displayed include the alarm priority, the Component (of the chosen type) in which the
problem was detected, the Duration of the problem, the date and time of problem occurrence (From) and the
date and time of problem resolution (To). This information will help an executive figure out which components
were responsible for some of the worst problems of the component type.
11.
Click on the Component of your choice in this section to view the Executive Summary report of that Component
for the chosen period (see Figure 4.28).
81
The Executive Reports
Figure 4.28: Executive Summary report of the Component that is clicked on
12.
The fourth section of the Executive Summary report not only lists the components that were affected during the
specified period, but also the percentage of time each of the components suffered Critical, Major, and Minor
issues. This event summary, when viewed along with the top five summary, will help an executive identify the
problem-prone components of the component type.
13.
Click on the Component of your choice in this section to view the Executive Report of that Component for the
chosen period (see Figure 4.29).
82
The Executive Reports
Figure 4.29: Executive Summary report of the Component clicked on in the SUMMARY OF EVENTS section
14.
On the other hand, if the Background Save - PDF option is chosen from the Report Generation list, then, clicking
on the RUN REPORT BUTTON will not invoke the report. Instead, a message depicted by Figure 4.9 will appear.
To view the report, click on the Click here to see a list of generated and processing reports link in Figure 4.9,
and proceed as indicated in Section 4.1 of this document.
83
The Operation Reports
The Operational KPI Reports
As stated earlier, the report options offered by the operational KPI Reports tree provide the operations personnel with
basic, measure-level insight into the health of the network, system, and application tiers of the target infrastructure.
Accordingly, these reports are classified as: Network, System, Application, Site, and Event Analysis.
Of the above reports, the Network, System, Application, and Website reports are further classified as Default,
Specific, and User (see Chapter 3).
5.1 Network Performance Reports
To view a NETWORK PERFORMANCE report using this page, do the following:
1.
Select the Network Performance option from the Operational KPI reports node of the REPORTS BY FUNCTION
tree. Figure 5.1 then appears.
Figure 5.1: Providing the report specifications
2.
Administrators of large IT infrastructures, which are characterized by hundreds of components, may find it
difficult to pick and choose the components for which a report is to be generated; this is because, in such
environments, the Components list in this page will be populated with a large number of components, which
would naturally make component selection tough. To enable administrators of such environments to quickly
locate the components of interest to them and swiftly generate the reports, eG Enterprise provides a Report for
list that consists of a variety of filter options. By default, the Component option is chosen from this list (see
Figure 5.1) - this indicates that all the managed components of a chosen type will be available for selection in
the Components list by default. In addition to this, the Report for list provides the following filter options as
well:
o
Service: If the component for which reports are to be generated is involved in the delivery of a particular
service, then pick this option from the Report for list. Doing so will invoke a Service list from which a
service name is to be chosen (see Figure 5.2). Upon selection of a service, the component types that are
part of the service will populate the Component Type list in this page. Once you pick a component type, all
components of that type, which are engaged in the delivery of the chosen service, will be displayed as
candidates for selection in the Components list. If there are still too many components in the list to choose
from, you can narrow your search further by using the Search text box. Specify the whole/part of the
84
The Operation Reports
component name to search for in this text box, and click the
icon next to it. The Components list will
then be populated with all component names that embed the specified search string. Select the component
of your choice from this list.
Figure 5.2: Selecting the Service option from the Report for list
o
Segment: If the components for which a report is to be generated is part of a segment, pick the Segment
option from the Report for list. Then, select the segment of interest to you from the Segment list (see
Figure 5.3). This will populate the Component Type list with the types of components that are part of the
chosen segment. If you select a component type from the Component Type list, then, all components of
that type, which are part of the chosen segment, will be displayed in the Components list for selection. If
there are still too many components in the list to choose from, you can narrow your search further by using
the Search text box. Specify the whole/part of the component name to search for in this text box, and click
the
icon next to it. The Components list will then be populated with all component names that embed
the specified search string. Select the component of your choice from this list.
Figure 5.3: Selecting the Segment option from the Report for list
o
Zone: If the components for which a report is to be generated is part of a zone, pick the Zone option from
the Report for list (see Figure 5.4). To include sub-zones also in your search for components, set the
Include SubZones flag to Yes. Then, select the zone of interest to you from the Zone list. This will populate
the Component type list with the types of components that are part of the chosen zone. If you select a
component type from the Component type list, then, all components of that type, which are part of the
chosen zone, will be displayed in the Components list for selection. If there are too many components in
the list to choose from, you can narrow your search further by using the Search text box. Specify the
whole/part of the component name to search for in this text box, and click the
icon next to it. The
Components list will then be populated with all component names that embed the specified search string.
Select the component of your choice from this list.
85
The Operation Reports
Figure 5.4: Selecting the Zone option from the Report for list
3.
If the Components list consists of too many components, then viewing all the components and selecting the
ones you need for report generation could require endless scrolling. To avoid this, you can click the
button
next to the Components list. The COMPONENTS pop up window will then appear using which you can view
almost all the components in a single interface and select the ones to be included in the report.
4.
Then, select the period (Timeline) for which the graph is to be generated (see Figure 5.1). You can either
provide a fixed time line such as 1 hour, 2 days, etc., or select the Any option from the list to provide a From
and To date/time for report generation.
For every user registered with the eG Enterprise system, the administrator can indicate the
maximum timeline for which that user can generate a report. Once the maximum timeline is
set for a user, then, whenever that user logs into eG Reporter and attempts to generate a
report, the Timeline list box in the report page will display options according to the maximum
timeline setting of that user. For instance, if a user can generate a report for a maximum
period of 3 days only, then 3 days will be the highest option displayed in the Timeline list i.e., 3 days will be the last option in the fixed Timeline list. Similarly, if the user chooses the
Any option from the Timeline list and proceeds to provide a start date and end date for
report generation using the From and To specifications, eG Enterprise will first check if the
user's Timeline specification conforms to his/her maximum timeline setting. If not, report
generation will fail. For instance, for a user who is allowed to generate reports spanning over
a maximum period of 3 days only, the difference between the From and To dates should
never be over 3 days. If it is, then, upon clicking the Run Report button a message box will
appear, prompting the user to change the From and To specification.
5.
In addition to the settings discussed above, this report comes with a set of default specifications. These settings
are hidden by default. If you do not want to disturb these default settings, then you can proceed to generate
the report by clicking the Run Report button soon after you pick one/more Components for report generation.
However, if you want to view and then alter these settings (if required), click on the
button. The MORE
OPTIONS (see Figure 5.5) drop down window will then appear. The steps below discuss each of these settings
and how they can be customized.
86
The Operation Reports
Figure 5.5: The MORE OPTIONS drop down window for generating a Network Performance report
6.
From Figure 5.5, select the type of report to be generated from the Report Type list box. The options available
are:
Measure: Select this option if measurement values for different metrics have to be plotted with time of
day.
Summary: Select this option to plot the service level achievements of different metrics during a designated
period. When this option is chosen, a Duration list will appear with the following options:
o
Hourly Summary: This option, when chosen, highlights the service levels of different
measurements (i.e. the % of time a measurement was in compliance with its threshold) on an
hourly basis.
o
Daily Summary: This option, when chosen, highlights the service levels of different
measurements (i.e. the % of time a measurement was in compliance with its threshold) on a
daily basis.
o
Monthly Summary: This option, when chosen, highlights the service levels of different
measurements (i.e. the % of time a measurement was in compliance with its threshold) on a
monthly basis.
Trend: Selecting this option will enable you to plot the trend values of different metrics computed over a
period of time. Past trends in performance can be analyzed and accordingly, the future operational
capacity of the targets can be planned using this report. If you select Trend as the Report type, a Graph
Type list will appear. The Graph Type options are as follows:
o
Min/Max : Select this option to generate a report that plots the minimum and maximum values
registered by different metrics during a specified timeline.
o
Avg: Select this option to generate a report that plots the average values computed for various
metrics during a specified timeline.
o
Sum: Select this option to generate a report that plots the sum of the values of a measure
during a specified timeline.
7.
The speed with which a report is generated depends primarily on the report Timeline. While a Timeline that
varies between a couple of days to a week enables the eG Enterprise system to quickly retrieve the required
data, timelines that span multiple weeks/months could slow-down the data retrieval and report generation
process to a considerable extent, owing to the volume of data involved. In order to ensure quick and easy
access to reports, eG Enterprise provides you the option of enabling data retrieval from the Trend information in
the database, instead of the Detailed test information that is used by default for report generation. The Detailed
test information base comprises of multiple measurement records for a test - one or more each for every test
execution. Whereas, the Trend information includes only hourly, daily, and monthly summary computations for
a test performed on a continuous basis. For instance, during a period of 1 hour, a test that runs every 5
minutes inserts atleast 12 records into the Detailed test information base. On the other hand, the Trend
87
The Operation Reports
information base would consist of only 1 record for the same 1 hour period. Fewer the number of records,
query execution becomes much quicker, and data retrieval faster. By default, the Detailed option is selected
against the Show Data field in Figure 5.5 indicating that the report data is retrieved from the detailed test
information in the database by default. To enable the usage of trend data for report generation, select the
Trend option against Show Data. If need be, you can also ensure that all reports always use the Detailed test
tables alone by hiding the Show Data field from the reporter interface. To achieve this, do the following:
8.
9.
Login to the eG administrative interface as 'admin'.
Select the Manager option from the Settings tile that appears when the
clicked.
From the GENERAL SETTINGS page that then appears, if you set the Compute average/sum of metrics
while trending flag to No, then the Show Data field will not appear in the reporter interface; this denies
users access to the Trend option, and thus ensures that reports are always generated using the Detailed
tables.
icon against the Admin tab is
In large environments, reports generated using months of data can take a long time to complete.
Administrators now have the option of generating reports on-line or in the background. When a report is
scheduled for background generation, administrators can proceed with their other monitoring, diagnosis, and
reporting tasks, while the eG manager is processing the report. This saves the administrator valuable time. To
schedule background processing of a report, select the Background Save - PDF option from the Report
Generation list. In this case, a Report Name text box will appear, where you would have to provide the name
with which the report is to be saved in the background. To process reports in the foreground, select the
Foreground Generation - HTML option from this list.
The Report Generation list will appear only if the EnableBackgroundReport flag in
the [BACKGROUND_PROCESS] section of the eg_report.ini file (in the
{EG_INSTALL_DIR}\manager\config directory) is set to Yes.
The default selection in the Report Generation list will change according to the
Timeline specified for the report. If the Timeline set is greater than or equal to the
number of days specified against the MinDurationForReport parameter in the
[BACKGROUND_PROCESS] section of the eg_report.ini file, then the default
selection in the Report Generation list will be Background. On the other hand, if the
Timeline set for the report is lesser than the value of the MinDurationForReport
parameter, then the default selection in the Report Generation list will be
Foreground. This is because, the MinDurationForReport setting governs when
reports are to be processed in the background. By default, this parameter is set to
2 weeks - this indicates that by default, reports with a timeline of 2 weeks and
above will be processed in the background.
Finally, click on the Run Report button to generate the graph. If the option chosen from the Report Generation
list is Foreground Generation - HTML, then, clicking on the Run Report button will invoke Figure 5.6.
88
The Operation Reports
Figure 5.6: Generating a Detailed Network Performance Measure Report
10.
To enable trend table usage, select Trend from Show Data, provide a report Timeline, and click the Run Report
button. In this case, Figure 5.7 will appear.
89
The Operation Reports
Figure 5.7: Generating a Network Measure Report using Trend data
90
The Operation Reports
A Trend report will not include the data for the current day since trend data is only
computed at the end of the day.
If the Trend option is chosen, the time period of the report should be greater than
1 day.
The usage of Detailed test tables for generating reports, especially those that span
weeks, increases the stress on the eG database, thus resulting in undue delays in
report generation. In order to ensure that the database is not choked by requests
for voluminous data, you can configure eG Enterprise to automatically "force" the
use of the Trend option if the Timeline of a report exceeds a pre-configured
duration. To specify this time boundary, do the following:
o
Edit the eg_report.ini file in the <EG_INSTALL_DIR>\manager\config directory.
o
In the [MISC] section of the file, you will find a DetailedTime parameter.
o
Specify the duration (in days) beyond which Detailed reports cannot be generated,
against the DetailedTime parameter, and save the eg_report.ini file.
For instance, to make sure that Detailed reports are disallowed for a Timeline of
over 2 weeks, set the DetailedTime parameter to 14 and save the file.
o
Say, subsequently, you attempt to generate a Detailed report for a Fixed Timeline
of 3 weeks (which is greater than the 14-day limit set in our example). The instant
you select the 3 weeks option from the Fixed list box, the Detailed option gets
automatically disabled, and the Trend option gets enabled. Similarly, if you specify
an Any Timeline that runs over 14 days, then, upon clicking the Run Report button
to generate the report, the following message box appears informing you that only
the Trend option is permitted.
Figure 5.8: A message stating that only the Trend option is supported for the given Timeline
o
11.
To proceed with the Trend report generation, click the OK button in Figure 5.8 To
terminate Trend report generation, click the Cancel button.
Figure 5.6 and Figure 5.7 reveal the measure reports for the Network availability, Packet loss, Avg network
delay and Min network delay measures associated with Network Test. While the Network-Measure report
configuration specific to the host 192.168.10.8 includes all the above-mentioned measures, the default
configuration includes the Avg network delay and Min network delay measures only. If specific report
configurations exist for a chosen component, then they will override the default configurations. Therefore,
Figure 5.6 displays only the reports specific to component 192.168.10.8.
91
The Operation Reports
12.
Similarly, if no user/site/application/host-specific reports have been configured, then the default configurations
will apply automatically. Since no Network-Summary reports have been configured specifically for the host
192.168.10.8, the default configuration will come into play. Accordingly, Figure 5.9, Figure 5.10 and Figure
5.11, display the default network summary graphs for the measures Avg network delay, Min network delay,
Availability, and Packet loss. For more details on configuring specific Network-Measure and Network-Summary
reports, refer to Section 3.2.
Figure 5.9: A sample Daily Summary report
92
The Operation Reports
Figure 5.10: A sample Hourly Summary report
The Hourly Summary graph plots measurement data pertaining to a maximum duration of 24
hours. Therefore, even if the Timeline specified exceeds 1 day, the graph will report data for
24 hours only.
Figure 5.11: A sample Monthly Summary report
93
The Operation Reports
Since summary graphs can be generated using the Trend information base only, the Show
Data field disappears if the Report Type is set to any of the following: Daily Summary, Hourly
Summary, or Monthly Summary.
Figure 5.12: The list of values that have been plotted on a particular graph
13.
Now, to enlarge the graphs displayed in the NETWORK REPORT page (see Figure 5.6), click on them. Upon
clicking, another window will appear wherein the enlarged graph will be displayed (see Figure 5.13).
94
The Operation Reports
Figure 5.13: An enlarged graph
14.
When the enlarged report has a measure for which the detailed diagnosis capability has been enabled, then a
DIAGNOSIS button will also appear. Click on the DIAGNOSIS button to view the detailed diagnosis of that measure
for the chosen Timeline (see Figure 5.14).
Figure 5.14: The detailed diagnosis of the measure associated with the enlarged graph
95
The Operation Reports
15.
On the other hand, if the Background Save - PDF option is chosen from the Report Generation list, then clicking
on the Run Report button will not generate the report and display it in this page for your benefit. Instead, a
message indicating that the report is being processed in the background will appear. This will be accompanied
by a link that will lead you to the page that lists all the reports that are being processed in the background, and
their current status. If background report generation fails for a report, you can regenerate that report using this
page, or can even delete that report if need be. On the other hand, if background processing successfully
completes for your report, then, you can view a PDF of the report by clicking on the PDF icon in that page.
5.2 System Performance Reports
eG Enterprise offers two System Reports - a System Performance report and a Top System Resource Consumers
report. This section discusses both these reports.
System Performance Report
To receive an overview of system health, use the System Performance report. To generate this report, select the
System Performance option from the Operational KPI Reports node of the REPORTS BY FUNCTION tree.
Figure 5.15: Providing the System Performance report specification
In the context sensitive page that appears next, specify the following information (see Figure 5.15):
1.
Administrators of large IT infrastructures, which are characterized by hundreds of components, may find it
difficult to pick and choose the components for which a report is to be generated; this is because, in such
environments, the Components list in this page will be populated with a large number of components, which
would naturally make component selection tough. To enable administrators of such environments to quickly
locate the components of interest to them and swiftly generate the reports, eG Enterprise provides a Report for
list that consists of a variety of filter options. By default, the Component option is chosen from this list (see
Figure 5.15) - this indicates that all the managed components of a chosen type will be available for selection in
the Components list by default. In addition to this, the Report for list provides the following filter options asll:
o
Service: If the component for which reports are to be generated is involved in the delivery of a particular
service, then pick this option from the Report for list. Doing so will invoke a Service list from which a
service name is to be chosen. Upon selection of a service, the component types that are part of the service
will populate the Component Type list in this page. Once you pick a component type, all components of
that type, which are engaged in the delivery of the chosen service, will be displayed as candidates for
selection in the Components list. If there are still too many components in the list to choose from, you can
narrow your search further by using the Search text box. Specify the whole/part of the component name to
search for in this text box, and click the
icon next to it. The Components list will then be populated with
all component names that embed the specified search string. Select the component of your choice from
this list.
o
Segment: If the components for which a report is to be generated is part of a segment, pick the Segment
option from the Report for list. Then, select the segment of interest to you from the Segment list. This will
96
The Operation Reports
populate the Component Type list with the types of components that are part of the chosen segment. If
you select a component type from the Component Type list, then, all components of that type, which are
part of the chosen segment, will be displayed in the Components list for selection. If there are still too
many components in the list to choose from, you can narrow your search further by using the Search text
box. Specify the whole/part of the component name to search for in this text box, and click the
icon
next to it. The Components list will then be populated with all component names that embed the specified
search string. Select the component of your choice from this list.
o
Zone: If the components for which a report is to be generated is part of a zone, pick the Zone option from
the Report for list. To include sub-zones also in your search for components, set the Include Subzones flag
to Yes. Then, select the zone of interest to you from the Zone list. This will populate the Component Type
list with the types of components that are part of the chosen zone. If you select a component type from
the Component Type list, then, all components of that type, which are part of the chosen zone, will be
displayed in the Components list for selection. If there are too many components in the list to choose from,
you can narrow your search further by using the Search text box. Specify the whole/part of the component
name to search for in this text box, and click the
icon next to it. The Components list will then be
populated with all component names that embed the specified search string. Select the component of your
choice from this list.
2.
If the Components list consists of too many components, then viewing all the components and selecting the
ones you need for report generation could require endless scrolling. To avoid this, you can click the
button
next to the Components list. The COMPONENTS pop up window will then appear using which you can view
almost all the components in a single interface and select the ones for which the report is to be generated.
3.
Then, select the period (Timeline) for which the graph is to be generated (see Figure 5.17). You can either
provide a fixed time line such as 1 hour, 2 days, etc., or select the Any option from the list to provide a From
and To date/time for report generation.
For every user registered with the eG Enterprise system, the administrator can indicate the
maximum timeline for which that user can generate a report. Once the maximum timeline is
set for a user, then, whenever that user logs into eG Reporter and attempts to generate a
report, the Timeline list box in the report page will display options according to the maximum
timeline setting of that user. For instance, if a user can generate a report for a maximum
period of 3 days only, then 3 days will be the highest option displayed in the Timeline list i.e., 3 days will be the last option in the fixed Timeline list. Similarly, if the user chooses the
Any option from the Timeline list and proceeds to provide a start date and end date for
report generation using the From and To specifications, eG Enterprise will first check if the
user's Timeline specification conforms to his/her maximum timeline setting. If not, report
generation will fail. For instance, for a user who is allowed to generate reports spanning over
a maximum period of 3 days only, the difference between the From and To dates should
never be over 3 days. If it is, then, upon clicking the Run Report button a message box will
appear, prompting the user to change the From and To specification.
4.
In addition to the settings discussed above, this report comes with a set of default specifications. These settings
are hidden by default. If you do not want to disturb these default settings, then you can proceed to generate
the report by clicking the Run Report button soon after you pick a component from the Compoennts list.
However, if you want to view and then alter these settings (if required), click on the
button. The default
settings will then appear in the MORE OPTIONS drop down window (See Figure 5.16). The steps below discuss
97
The Operation Reports
each of these settings and how they can be customized.
Figure 5.16: The default settings for generating the System Performance report
5.
From Figure 5.16, select the type of report to be generated from the Report Type list box. The options are as
follows:
Measure: Select this option if measurement values for different metrics have to be plotted with time of
day.
Summary: Select this option to plot the service level achievements of different metrics during a designated
period. When this option is chosen, a Duration list will appear with the following options:
o
Hourly Summary: This option, when chosen, highlights the service levels of different
measurements (i.e. the % of time a measurement was in compliance with its threshold) on an
hourly basis.
o
Daily Summary: This option, when chosen, highlights the service levels of different
measurements (i.e. the % of time a measurement was in compliance with its threshold) on a
daily basis.
o
Monthly Summary: This option, when chosen, highlights the service levels of different
measurements (i.e. the % of time a measurement was in compliance with its threshold) on a
monthly basis.
Trend: Selecting this option will enable you to plot the trend values of different metrics computed over a
period of time. Past trends in performance can be analyzed and accordingly, the future operational
capacity of the targets can be planned using this report. If you select Trend as the Report type, a Graph
Type list will appear. The Graph Type options are as follows:
o
Min/Max : Select this option to generate a report that plots the minimum and maximum values
registered by different metrics during a specified timeline.
o
Avg: Select this option to generate a report that plots the average values computed for various
metrics during a specified timeline.
o
Sum: Select this option to generate a report that plots the sum of the values of a measure
during a specified timeline.
6.
The speed with which a report is generated depends primarily on the report Timeline. While a Timeline that
varies between a couple of days to a week enables the eG Enterprise system to quickly retrieve the required
data, timelines that span multiple weeks/months could slow-down the data retrieval and report generation
process to a considerable extent, owing to the volume of data involved. In order to ensure quick and easy
access to reports, eG Enterprise provides you the option of enabling data retrieval from the Trend information in
the database, instead of the Detailed test information that is used by default for report generation. The Detailed
test information based comprises of multiple measurement records for a test - one or more each for every test
execution. Whereas, the Trend information includes only hourly, daily, and monthly summary computations for
98
The Operation Reports
a test performed on a continuous basis. For instance, during a period of 1 hour, a test that runs every 5
minutes inserts atleast 12 records into the Detailed test information base. On the other hand, the Trend
information base would consist of only 1 record for the same 1 hour period. Fewer the number of records,
query execution becomes much quicker, and data retrieval faster. To use the trend data for report generation,
you will have to select the Trend option from the Show Data field in Figure 5.16. By default, the Detailed option
is selected here in Figure 5.16 indicating that the report data is retrieved from the detailed test information in
the database. If need be, you can also ensure that all reports always use the Detailed test tables alone by
hiding the Show Data field from the reporter interface. To achieve this, do the following:
Login to the eG administrative interface as 'admin'.
Select the Manager option from the Settings tile that appears when the
clicked
From the GENERAL SETTINGS page that then appears, if you set the Compute average/sum of metrics
while trending flag to No, then the Show Data field will not appear in the reporter interface; this denies
users access to the Trend option, and thus ensures that reports are always generated using the Detailed
tables.
99
icon against the Admin tab is
The Operation Reports
A Trend report will not include the data for the current day since trend data is only
computed at the end of the day.
If the Trend option is chosen, the time period of the report should be greater than
1 day.
The usage of Detailed test tables for generating reports, especially those that span
weeks, increases the stress on the eG database, thus resulting in undue delays in
report generation. In order to ensure that the database is not choked by requests
for voluminous data, you can configure eG Enterprise to automatically "force" the
use of the Trend option if the Timeline of a report exceeds a pre-configured
duration. To specify this time boundary, do the following:
o
Edit the eg_report.ini file in the <EG_INSTALL_DIR>\manager\config directory.
o
In the [MISC] section of the file, you will find a DetailedTime parameter.
o
Specify the duration (in days) beyond which Detailed reports cannot be generated,
against the DetailedTime parameter, and save the eg_report.ini file.
For instance, to make sure that Detailed reports are disallowed for a Timeline of
over 2 weeks, set the DetailedTime parameter to 14 and save the file.
7.
o
Say, subsequently, you attempt to generate a Detailed report for a Fixed Timeline
of 3 weeks (which is greater than the 14-day limit set in our example). The instant
you select the 3 weeks option from the Fixed list box, the Detailed option gets
automatically disabled, and the Trend option gets enabled. Similarly, if you specify
an Any Timeline that runs over 14 days, then, upon clicking the Run Report button
to generate the report, a message box appears (see Figure 5.8) informing you that
only the Trend option is permitted.
o
To proceed with the Trend report generation, click the OK button in Figure 5.8. To
terminate Trend report generation, click the Cancel button.
In large environments, reports generated using months of data can take a long time to complete.
Administrators now have the option of generating reports on-line or in the background. When a report is
scheduled for background generation, administrators can proceed with their other monitoring, diagnosis, and
reporting tasks, while the eG manager is processing the report. This saves the administrator valuable time. To
schedule background processing of a report, select the Background Save - PDF option from the Report
Generation list. In this case, a Report Name text box will appear, where you would have to provide the name
with which the report is to be saved in the background. To process reports in the foreground, select the
Foreground Generation - HTML option from this list.
100
The Operation Reports
8.
The Report Generation list will appear only if the EnableBackgroundReport flag in
the [BACKGROUND_PROCESS] section of the eg_report.ini file (in the
{EG_INSTALL_DIR}\manager\config directory) is set to Yes.
The default selection in the Report Generation list will change according to the
Timeline specified for the report. If the Timeline set is greater than or equal to the
number of days specified against the MinDurationForReport parameter in the
[BACKGROUND_PROCESS] section of the eg_report.ini file, then the default selection
in the Report Generation list will be Background. On the other hand, if the Timeline
set for the report is lesser than the value of the MinDurationForReport parameter,
then the default selection in the Report Generation list will be Foreground. This is
because, the MinDurationForReport setting governs when reports are to be
processed in the background. By default, this parameter is set to 2 weeks - this
indicates that by default, reports with a timeline of 2 weeks and above will be
processed in the background.
Finally, click on the Run Report button to generate the graph. If the option chosen from the Report Generation
list is Foreground Generation - HTML, then, clicking on the Run Report button will invoke Figure 5.17.
101
The Operation Reports
Figure 5.17: Generating System Overview Reports
9.
Figure 5.17 reveals that the configuration specific to the host 192.168.10.8 has gained precedence over the
default System-Measure report configurations. Therefore, the measures associated with the specific
configurations, which includes, CPU utilization, System CPU utilization, Run queue length, and Blocked
processes, have been plotted in a graph. For more details on configuring specific System-Measure reports, refer
to Section 3.2.
10.
On the other hand, if the Background Save - PDF option is chosen from the Report Generation list, then clicking
on the RUN REPORT BUTTON will not generate the report and display it in this page for your benefit. Instead, a
message indicating that the report is being processed in the background will appear. This will be accompanied
by a link that will lead you to the page that lists all the reports that are being processed in the background, and
their current status. If background report generation fails for a report, you can regenerate that report using this
page, or can even delete that report if need be. On the other hand, if background processing successfully
completes for your report, then, you can view a PDF of the report by clicking on the PDF icon in that page.
102
The Operation Reports
TOP SYSTEM RESOURCE CONSUMERS Report
While the System Performance report reveals irregularities in system resource usage, the Top System Resouce
Consumers report turns the spotlight on the root-cause of these usage excesses. For instance, using the System
Performance report you can proactively detect a potential contention for the CPU resources of a system. Using the
System Details report thereafter, you can identify which process on that system is consuming the CPU resources
excessively, and is thus causing the resource contention.
To generate the Top System Resource Consumers report, select the Top System Resource Consumers option from
the Operational KPI Reports node of the REPORTS BY FUNCTIONS tree. In the page that appears next, specify the
following information (see Figure 5.18):
Figure 5.18: Generating the Top System Resource Consumers report
1.
Administrators of large IT infrastructures, which are characterized by hundreds of systems, may find it difficult
to pick and choose the systems for which a report is to be generated; this is because, in such environments,
the Systems list in this page will be populated with a large number of systems, which would naturally make
system selection tough. To enable administrators of such environments to quickly locate the systems of interest
to them and swiftly generate the reports, eG Enterprise provides a Report for list that consists of a variety of
filter options. By default, the System option is chosen from this list (see Figure 5.17) - this indicates that all the
managed systems will be available for selection in the Systems list by default. In addition to this, the Report
for list provides the following filter options as well:
o
Service: If the system for which reports are to be generated is involved in the delivery of a particular
service, then pick this option from the Report for list. Doing so will invoke a Service list from which a
service name is to be chosen. Once you pick a service, all systems which are engaged in the delivery of the
chosen service, will be displayed as candidates for selection in the System list. Select the systems of your
choice from this list.
o
Segment: If the systems for which a report is to be generated are part of a segment, pick the Segment
option from the Report for list. Then, select the segment of interest to you from the Segment list. Then, all
systems, which are part of the chosen segment, will be displayed in the System list for selection. Select the
systems of your choice from this list.
o
Zone: If the systems for which a report is to be generated is part of a zone, pick the Zone option from the
Report for list. To include sub-zones also in your search for components, set the Include SubZones flag to
Yes. Then, select the zone of interest to you from the Zone list. This will populate the System list with the
systems that are part of the chosen zone. Select the systems of your choice from this list.
2.
If the Systems list consists of too many hosts, then viewing all the hosts and selecting the ones you need for
report generation could require endless scrolling. To avoid this, you can click the
button next to the
Systems list. This will expand the list so that you can view almost all the systems in a single interface and select
the ones for which the report is to be generated.
3.
Then, select the period (Timeline) for which the graph is to be generated (see Figure 5.20). You can either
103
The Operation Reports
provide a fixed time line such as 1 hour, 2 days, etc., or select the Any option from the list to provide a From
and To date/time for report generation.
For every user registered with the eG Enterprise system, the administrator can indicate the
maximum timeline for which that user can generate a report. Once the maximum timeline is
set for a user, then, whenever that user logs into eG Reporter and attempts to generate a
report, the Timeline list box in the report page will display options according to the maximum
timeline setting of that user. For instance, if a user can generate a report for a maximum
period of 3 days only, then 3 days will be the highest option displayed in the Timeline list i.e., 3 days will be the last option in the fixed Timeline list. Similarly, if the user chooses the
Any option from the Timeline list and proceeds to provide a start date and end date for
report generation using the From and To specifications, eG Enterprise will first check if the
user's Timeline specification conforms to his/her maximum timeline setting. If not, report
generation will fail. For instance, for a user who is allowed to generate reports spanning over
a maximum period of 3 days only, the difference between the From and To dates should
never be over 3 days. If it is, then, upon clicking the Run Report button a message box will
appear, prompting the user to change the From and To specification.
4.
The Metric option displays a pre-configured list of metrics for which the report can be generated. You can
simply select a performance parameter from the list, for which you wish to view a detailed report across the
systems. For example, just select the CPU Utilization metric from the Metrics list, and select all the systems for
which you wish to view the detailed report from the System list. By default, the Metric list comes with a set of
pre-configured parameters. You can expand the Metric list by adding more performance parameters to it. To
override the default Metric list, edit the eg_report.ini file (in the <EG_INSTALL_DIR>\manager\config directory),
and add a new metric to the [REPORT_TEMPLATES] section therein, in the following format:
<DisplayName>=<InternalTestName>:<InternalMeasureName>
To determine the internal test and measure names, refer to Page 212 of this document.
5.
In addition to the settings discussed above, this report comes with a set of default specifications. These settings
are hidden by default. If you do not want to disturb these default settings, then you can proceed to generate
the report by clicking the Run Report button soon after you pick an option from the Metric list. However, if you
want to view and then alter these settings (if required), click on the
button. The default settings will then
appear in the MORE OPTIONS drop down window (see Figure 5.19). The steps below discuss each of these
settings and how they can be customized.
104
The Operation Reports
Figure 5.19: The default settings for the Top System Resource Consumers report
6.
From Figure 5.19, select the type of report to be generated from the Report Type list box. The options are as
follows:
Graph: Select this option for a graphical representation of this report.
Data: To view this report in a table, select this option.
If you select the Report Type option as Graph, then the Show by option appears. Select any one of the
following options:
Max : Select this option to generate a report that plots the maximum value registered by different metrics
during a specified timeline.
Avg: Select this option to generate a report that plots the average values computed for the chosen metric
across all the chosen systems during a specified timeline.
7.
Likewise if you select the Report type as Data, then the Sort by option appears instead of the Show by option.
Here too, select any one of the following options from the list:
Max : Select this option to sort the processes of each chosen system by range of the maximum value
registered for the chosen metric during a specified timeline.
Avg: Select this option to generate a report in a tabular format that plots the average values computed for
the processes of each chosen metric for all the chosen systems during a specified timeline.
8.
If the timeline specified for the report needs to exclude the data collected during the Weekends, then set
Exclude weekends to Yes. If not, select No.
You can configure the days of the week that need to be considered as a ‘weekend’ using the
Days parameter in the [EXCLUDE_WEEKEND] section in the eg_report.ini file (in the
<EG_INSTALL_DIR>\manager\config directory). The Days parameter is set to Saturday,Sunday
by default. To change this weekend specification, enter two other days of the week against
the Days parameter.
105
The Operation Reports
9.
By default, the report provides the details of only the Top-10 processes for all the chosen systems that consume
high resources. You can choose a different top-n / last-n option from the Show list, if need be.
By default, the values displayed in the Show list range from TOP-10 to LAST-10. This is
because, the Showtop parameter in the [INFOS] section of the eg_report.ini file (in the
<EG_INSTALL_DIR>\manager\config directory) is set to 10, by default. You can, if required,
configure the Show list to display a different range of options. For this, specify a different
number against the Showtop parameter, and save the eg_report.ini file.
10.
Next, specify the start time and end time for report generation against the Time period field.
11.
By default, the Common Maximum flag is set to No. This indicates that by default, eG Enterprise does not set a
common maximum value for all graphs in a report - in other words, the maximum value differs from graph to
graph. This is because, the eG Enterprise system, by default, determines the maximum value for a graph by
comparing all the values reported by the corresponding measure during the specified Timeline. If you want to
set a common maximum value across all graphs in a view, set the Common Maximum flag to Yes. Once you set
the Common Maximum value to Yes, the Auto Maximum and Max Value fields will appear. By default, the Auto
Set Maximum Value flag is set to Yes. If this flag is set to No, you can set a custom maximum value for all the
graphs in the Max Value field. If you set the Auto Set Maximum Value flag to Yes, then the maximum value will
be auto-generated by the eG Enterprise system.
12.
Next, indicate the type of graphs to be generated in the report page - whether 3D or 2D - by choosing the
appropriate option from the Graph list. The default selection in this list is determined by the Show reporter
graphs in 3D flag in the MONITOR SETTINGS page of the eG administrative interface. If this flag is set to Yes,
then the 3D option will be selected by default in the Graph list. If this flag is set to No, then the default
selection in the Graph list will be 2D.
13.
In large environments, reports generated using months of data can take a long time to complete.
Administrators now have the option of generating reports on-line or in the background. When a report is
scheduled for background generation, administrators can proceed with their other monitoring, diagnosis, and
reporting tasks, while the eG manager is processing the report. This saves the administrator valuable time. To
schedule background processing of a report, select the Background Save - PDF option from the Report
Generation list. In this case, a Report Name text box will appear, where you would have to provide the name
with which the report is to be saved in the background. To process reports in the foreground, select the
Foreground Generation - HTML option from this list.
106
The Operation Reports
14.
The Report Generation list will appear only if the EnableBackgroundReport flag in
the [BACKGROUND_PROCESS] section of the eg_report.ini file (in the
{EG_INSTALL_DIR}\manager\config directory) is set to Yes.
The default selection in the Report Generation list will change according to the
Timeline specified for the report. If the Timeline set is greater than or equal to the
number of days specified against the MinDurationForReport parameter in the
[BACKGROUND_PROCESS] section of the eg_report.ini file, then the default selection
in the Report Generation list will be Background. On the other hand, if the Timeline
set for the report is lesser than the value of the MinDurationForReport parameter,
then the default selection in the Report Generation list will be Foreground. This is
because, the MinDurationForReport setting governs when reports are to be
processed in the background. By default, this parameter is set to 2 weeks - this
indicates that by default, reports with a timeline of 2 weeks and above will be
processed in the background.
Finally, click on the Run Report button to generate the report. If the option chosen from the Report Generation
list is Foreground Generation - HTML, then, clicking on the Run Report button will invoke Figure 5.20.
107
The Operation Reports
Figure 5.20: The Top System ReSource Consumers report
5.3 Application Reports
To generate application-specific reports, first, click on the Application Performance option from the Operational KPI
Reports node of the REPORTS BY FUNCTION tree. Figure 5.21 will then appear.
Figure 5.21: Generating the Application Performance report
In order to generate the Application Performance report, provide the following information:
1.
Administrators of large IT infrastructures, which are characterized by hundreds of components, may find it
difficult to pick and choose the components for which a report is to be generated; this is because, in such
108
The Operation Reports
environments, the Components list in this page will be populated with a large number of components, which
would naturally make component selection tough. To enable administrators of such environments to quickly
locate the components of interest to them and swiftly generate the reports, eG Enterprise provides a Report for
list that consists of a variety of filter options. By default, the Component option is chosen from this list (see
Figure 5.21) - this indicates that all the managed components of a chosen type will be available for selection in
the Components list by default. In addition to this, the Report for list provides the following filter options as
well:
o
Service: If the component for which reports are to be generated is involved in the delivery of a particular
service, then pick this option from the Report for list. Doing so will invoke a Service list from which a
service name is to be chosen. Upon selection of a service, the component types that are part of the service
will populate the Component Type list in this page. Once you pick a component type, all components of
that type, which are engaged in the delivery of the chosen service, will be displayed as candidates for
selection in the Components list. If there are still too many components in the list to choose from, you can
narrow your search further by using the Search text box. Specify the whole/part of the component name to
search for in this text box, and click the
icon next to it. The Components list will then be populated with
all component names that embed the specified search string. Select the component of your choice from
this list.
o
Segment: If the components for which a report is to be generated is part of a segment, pick the Segment
option from the Report for list. Then, select the segment of interest to you from the Segment list. This will
populate the Component Type list with the types of components that are part of the chosen segment. If
you select a component type from the Component Type list, then, all components of that type, which are
part of the chosen segment, will be displayed in the Components list for selection. If there are still too
many components in the list to choose from, you can narrow your search further by using the Search text
box. Specify the whole/part of the component name to search for in this text box, and click the
icon
button next to it. The Components list will then be populated with all component names that embed the
specified search string. Select the component of your choice from this list.
o
Zone: If the components for which a report is to be generated is part of a zone, pick the Zone option from
the Report for list. To include sub-zones also in your search for components, set the Include Subzones flag
to Yes. Then, select the zone of interest to you from the Zone list. This will populate the Component Type
list with the types of components that are part of the chosen zone. If you select a component type from
the Component Type list, then, all components of that type, which are part of the chosen zone, will be
displayed in the Components list for selection. If there are too many components in the list to choose from,
you can narrow your search further by using the Search text box. Specify the whole/part of the component
name to search for in this text box, and click the
icon next to it. The Components list will then be
populated with all component names that embed the specified search string. Select the component of your
choice from this list.
2.
If the Components list consists of too many components, then viewing all the components and selecting the
ones you need for report generation could require endless scrolling. To avoid this, you can click the
button
next to the Components list. The COMPONENTS pop up window will then appear using which you can view
almost all the components in a single interface and select the ones for which the report is to be generated.
3.
Then, select the period (Timeline) for which the graph is to be generated (see Figure 5.21). You can either
provide a fixed time line such as 1 hour, 2 days, etc., or select the Any option from the list to provide a From
and To date/time for report generation.
109
The Operation Reports
For every user registered with the eG Enterprise system, the administrator can indicate the
maximum timeline for which that user can generate a report. Once the maximum timeline is
set for a user, then, whenever that user logs into eG Reporter and attempts to generate a
report, the Timeline list box in the report page will display options according to the maximum
timeline setting of that user. For instance, if a user can generate a report for a maximum
period of 3 days only, then 3 days will be the highest option displayed in the Timeline list i.e., 3 days will be the last option in the fixed Timeline list. Similarly, if the user chooses the
Any option from the Timeline list and proceeds to provide a start date and end date for
report generation using the From and To specifications, eG Enterprise will first check if the
user's Timeline specification conforms to his/her maximum timeline setting. If not, report
generation will fail. For instance, for a user who is allowed to generate reports spanning over
a maximum period of 3 days only, the difference between the From and To dates
should never be over 3 days. If it is, then, upon clicking the Run Report button a
message box will appear, prompting the user to change the From and To
specification.
4.
In addition to the settings discussed above, this report comes with a set of default specifications. These settings
are hidden by default. If you do not want to disturb these default settings, then you can proceed to generate
the report by clicking the Run Report button soon after you pick one/more components from the Components
list. However, if you want to view and then alter these settings (if required), click on the
icon. The MORE
OPTIONS drop down window will then appear with the default settings (see Figure 5.22). The steps below
discuss each of these settings and how they can be customized.
Figure 5.22: The default settings for generating the Application Performance report
5.
From Figure 5.22, select the type of report to be generated from the Report Type list box. The options available
are as follows:
Measure: Select this option if measurement values for different metrics have to be plotted with time of
day.
Summary: Select this option to plot the service level achievements of different metrics during a designated
period. When this option is chosen, a Duration list will appear with the following options:
o
Hourly Summary: This option, when chosen, highlights the service levels of different
measurements (i.e. the % of time a measurement was in compliance with its threshold) on an
hourly basis.
o
Daily Summary: This option, when chosen, highlights the service levels of different
110
The Operation Reports
measurements (i.e. the % of time a measurement was in compliance with its threshold) on a
daily basis.
o
Monthly Summary: This option, when chosen, highlights the service levels of different
measurements (i.e. the % of time a measurement was in compliance with its threshold) on a
monthly basis.
Trend: Selecting this option will enable you to plot the trend values of different metrics computed over a
period of time. Past trends in performance can be analyzed and accordingly, the future operational
capacity of the targets can be planned using this report. If you select Trend as the Report type, a Graph
Type list will appear. The Graph Type options are as follows:
o
Min/Max : Select this option to generate a report that plots the minimum and maximum values
registered by different metrics during a specified timeline.
o
Avg: Select this option to generate a report that plots the average values computed for various
metrics during a specified timeline.
o
Sum: Select this option to generate a report that plots the sum of the values of a measure
during a specified timeline.
6.
The speed with which a report is generated depends primarily on the report Timeline. While a Timeline that
varies between a couple of days to a week enables the eG Enterprise system to quickly retrieve the required
data, timelines that span multiple weeks/months could slow-down the data retrieval and report generation
process to a considerable extent, owing to the volume of data involved. In order to ensure quick and easy
access to reports, eG Enterprise provides you the option of enabling data retrieval from the Trend information in
the database, instead of the Detailed test information that is used by default for report generation. The Detailed
test information based comprises of multiple measurement records for a test - one or more each for every test
execution. Whereas, the Trend information includes only hourly, daily, and monthly summary computations for
a test performed on a continuous basis. For instance, during a period of 1 hour, a test that runs every 5
minutes inserts atleast 12 records into the Detailed test information base. On the other hand, the Trend
information base would consist of only 1 record for the same 1 hour period. Fewer the number of records,
query execution becomes much quicker, and data retrieval faster. To use the trend data for report generation,
you will have to select the Trend option from the Show Data field in Figure 5.22. By default, the Detailed option
is selected here in Figure 5.22 indicating that the report data is retrieved from the detailed test information in
the database. If need be, you can also ensure that all reports always use the Detailed test tables alone by
hiding the Show Data field from the reporter interface. To achieve this, do the following:
Login to the eG administrative interface as 'admin'.
Select the Manager option from the Settings tile that appears when the
clicked.
From the GENERAL SETTINGS page that then appears, if you set the Compute average/sum of metrics
while trending flag to No, then the Show Data field will not appear in the reporter interface; this denies
users access to the Trend option, and thus ensures that reports are always generated using the Detailed
tables.
111
button against the Admin tab is
The Operation Reports
7.
A Trend report will not include the data for the current day since trend data is only
computed at the end of the day.
If the Trend option is chosen, the time period of the report should be greater than
1 day.
The usage of Detailed test tables for generating reports, especially those that span
weeks, increases the stress on the eG database, thus resulting in undue delays in
report generation. In order to ensure that the database is not choked by such
voluminous data requests, you can configure eG Enterprise to automatically "force"
the use of the Trend option if the Timeline of a report exceeds a pre-configured
duration. To specify this time boundary, do the following:
o
Edit the eg_report.ini file in the <EG_INSTALL_DIR>\manager\config directory.
o
In the [MISC] section of the file, you will find a DetailedTime parameter.
o
Specify the duration (in days) beyond which Detailed reports cannot be generated,
against the DetailedTime parameter, and save the eg_report.ini file.
o
For instance, to make sure that Detailed reports are disallowed for a Timeline of
over 2 weeks, set the DetailedTime parameter to 14 and save the file.
o
Say, subsequently, you attempt to generate a Detailed report for a Fixed Timeline
of 3 weeks (which is greater than the 14-day limit set in our example). The instant
you select the 3 weeks option from the Fixed list box, the Detailed option gets
automatically disabled, and the Trend option gets enabled. Similarly, if you specify
an Any Timeline that runs over 14 days, then, upon clicking the Run Report button
to generate the report, a message box appears (see Figure 5.8) informing you that
only the Trend option is permitted.
o
To proceed with the Trend report generation, click the OK button in the message
box.
In large environments, reports generated using months of data can take a long time to complete.
Administrators now have the option of generating reports on-line or in the background. When a report is
scheduled for background generation, administrators can proceed with their other monitoring, diagnosis, and
reporting tasks, while the eG manager is processing the report. This saves the administrator valuable time. To
schedule background processing of a report, select the Background Save - PDF option from the Report
Generation list. In this case, a Report Name text box will appear, where you would have to provide the name
with which the report is to be saved in the background. To process reports in the foreground, select the
Foreground Generation - HTML option from this list.
112
The Operation Reports
8.
The Report Generation list will appear only if the EnableBackgroundReport flag in
the [BACKGROUND_PROCESS] section of the eg_report.ini file (in the
{EG_INSTALL_DIR}\manager\config directory) is set to Yes.
The default selection in the Report Generation list will change according to the
Timeline specified for the report. If the Timeline set is greater than or equal to the
number of days specified against the MinDurationForReport parameter in the
[BACKGROUND_PROCESS] section of the eg_report.ini file, then the default selection
in the Report Generation list will be Background. On the other hand, if the Timeline
set for the report is lesser than the value of the MinDurationForReport parameter,
then the default selection in the Report Generation list will be Foreground. This is
because, the MinDurationForReport setting governs when reports are to be
processed in the background. By default, this parameter is set to 2 weeks - this
indicates that by default, reports with a timeline of 2 weeks and above will be
processed in the background.
Finally, click on the Run Report button to generate the graph. If the option chosen from the Report Generation
list is Foreground Generation - HTML, then, clicking on the Run Report button will invoke Figure 5.23.
113
The Operation Reports
Figure 5.23: The Application Performance report
9.
Figure 5.23 is a classic example for specific configurations overriding the default ones. Accordingly, ApplicationMeasure reports specifically defined for the Oracle server 192.168.10.8:1521:egurkha have been generated and
displayed. Also, note that the graphs for the OracleTablespaces test measures are descriptor-based. For more
details on configuring specific Application-Measure reports, refer to Section 3.2.
10.
In the case of measures that take descriptors, Figure 5.24 will be able to display a maximum of 10 descriptors
in one graph, by default. To view the complete list of descriptors more clearly, click on the graph. Note that the
OracleTablespaces test of Figure 5.24 takes descriptors. To view the descriptors more clearly, click on the
OracleTablespaces test graph (see Figure 5.24).
114
The Operation Reports
The maximum number of descriptors that can be displayed in the OPERATIONS REPORT
page is configurable. For that, set the MaxInfos parameter in the [INFOS] section of the
eg_report.ini (in the <EG_INSTALL_DIR>\manager\config directory) to the required value. By
default, this parameter will be set to 10, indicating that a maximum of 10 descriptors can be
plotted in a single graph in the APPLICATION PERFORMANCE page.
Figure 5.24: Enlarged OracleTablespaces test graph displaying the descriptors (the tablespaces)
11.
If a report comprising of more than 5 descriptors is enlarged, then Figure 5.24 will provide you with options to
restrict your view to specific descriptors only. In our example, let us view the graph pertaining to the top 5
tablespaces that have utilized the maximum space. To do so, first, select the Descriptors option from Figure
5.24. Then, select the Top - 5 option from the adjoining list box. Figure 5.25 will then appear.
115
The Operation Reports
Figure 5.25: Graph of the top 5 space consuming tablespaces
12.
Similarly, you can choose to view reports pertaining to the Top - 1 to the Top - 10 consumers of tablespace.
Alternatively, you can select the Range option. If this is done, then, using the adjoining text boxes you can
specify a minimum and maximum value. The eG Reporter will then generate a report for only those tablespaces
which currently consume space within the specified limits (see Figure 5.25). For example, to know the
tablespaces that consume space between the range of 20 to 27 %, specify ‘20’ in the text box before To, and
27 in the text box that follows To (see Figure 5.25). Figure 5.26 will then appear.
The threshold setting of a measure determines the options that will be displayed in the
Descriptor list box of Figure 5.24. If only a Minimum Threshold is set for a measure, then the
Descriptor list box will display ‘Last’ options and not ‘Top’ options. For example, the
Free_memory measure of the OracleTablespaces Test carries a Minimum threshold setting
only. In such a case, using the Descriptor option of Figure 5.24, you will be able to view
information on tablespaces with the least free space. In other words, the usual ‘Top - 1’ to
‘Top - 10’ options will be replaced by ‘Last - 1’ to ‘Last - 10’ options. Similarly, if a measure
carries only a Maximum Threshold setting, or both Minimum and Maximum thresholds, then
only the ‘Top’ options will be available in the Descriptor list box.
If a measure takes less than 10 descriptors, say only 5 descriptors, then the Descriptor list
box in Figure 5.24 will offer only the Top - 1 to Top - 5 options (or Last - 1 to Last - 5
options, as the case may be). If the number of descriptors exceeds 10, then the Descriptor
list box will provide an option range of Top - 1 to Top - 10 (or Last - 1 to Last - 10) only.
116
The Operation Reports
Figure 5.26: Viewing the report for tablespaces that consume space in the range of 20-27%
13.
On the other hand, if the Background Save - PDF option is chosen from the Report Generation list, then clicking
on the Run Report button will not generate the report and display it in this page for your benefit. Instead, a
message indicating that the report is being processed in the background will appear. This will be accompanied
by a link that will lead you to the page that lists all the reports that are being processed in the background, and
their current status. If background report generation fails for a report, you can regenerate that report using this
page, or can even delete that report if need be. On the other hand, if background processing successfully
completes for your report, then, you can view a PDF of the report by clicking on the
icon in that page.
5.4 Site Reports
To generate site-specific reports, first, click on the Website Performance option from the Operational KPI Reports
node of the REPORTS BY FUNCTION tree. In the page that appears next, provide the following information (see
Figure 5.27):
1.
From the Site drop-down list box, select the web sites for which a measurement graph is to be generated. This
list box will list all the fully configured web sites in the environment (see Figure 5.27).
Figure 5.27: Generating a Site Operations report
117
The Operation Reports
2.
Selecting a Site will result in the display of a ComponentType list box listing all component types associated with
the selected web site. From this list box, select the type of component for which reports are required.
3.
Once a component type is chosen, all components of the selected type that are associated with the chosen web
site will then be listed in the Components list. Pick a component of your choice from this list (see Figure
5.27). If the Components list consists of too many components, then viewing all the components and selecting
the ones you need for report generation could require endless scrolling. To avoid this, you can click the
button next to the Components list. The COMPONENTS pop up window will then appear using which you can
view almost all the components in a single interface and Select the ones for which the report is to be
generated.
4.
Then, select the period (Timeline) for which the graph is to be generated. You can either provide a fixed time
line such as 1 hour, 2 days, etc., or select the Any option from the list to provide a From and To date/time for
report generation.
For every user registered with the eG Enterprise system, the administrator can indicate the
maximum timeline for which that user can generate a report. Once the maximum timeline is
set for a user, then, whenever that user logs into eG Reporter and attempts to generate a
report, the Timeline list box in the report page will display options according to the maximum
timeline setting of that user. For instance, if a user can generate a report for a maximum
period of 3 days only, then 3 days will be the highest option displayed in the Timeline list i.e., 3 days will be the last option in the fixed Timeline list. Similarly, if the user chooses the
Any option from the Timeline list and proceeds to provide a start date and end date for
report generation using the From and To specifications, eG Enterprise will first check if the
user's Timeline specification conforms to his/her maximum timeline setting. If not, report
generation will fail. For instance, for a user who is allowed to generate reports spanning over
a maximum period of 3 days only, the difference between the From and To dates should
never be over 3 days. If it is, then, upon clicking the Run Report button a message box will
appear, prompting the user to change the From and To specification.
5.
In addition to the settings discussed above, this report comes with a set of default specifications. These settings
are hidden by default. If you do not want to disturb these default settings, then you can proceed to generate
the report by clicking the Run Report button soon after you pick one/more components for report generation
from the Components list. However, if you want to view and then alter these settings (if required), click on the
button. The default settings will then appear in the MORE OPTIONS drop down window (see Figure 5.28).
The steps below discuss each of these settings and how they can be customized.
118
The Operation Reports
Figure 5.28: The default settings for the Website Performance report
6.
Select the type of report to be generated from the Report Type list box (see Figure 5.28). The options available
are as follows:
Measure: Select this option if measurement values for different metrics have to be plotted with time of
day.
Summary: Select this option to plot the service level achievements of different metrics during a designated
period. When this option is chosen, a Duration list will appear with the following options:
o
Hourly Summary: This option, when chosen, highlights the service levels of different
measurements (i.e. the % of time a measurement was in compliance with its threshold) on an
hourly basis.
o
Daily Summary: This option, when chosen, highlights the service levels of different
measurements (i.e. the % of time a measurement was in compliance with its threshold) on a
daily basis.
o
Monthly Summary: This option, when chosen, highlights the service levels of different
measurements (i.e. the % of time a measurement was in compliance with its threshold) on a
monthly basis.
Trend: Selecting this option will enable you to plot the trend values of different metrics computed over a
period of time. Past trends in performance can be analyzed and accordingly, the future operational
capacity of the targets can be planned using this report. If you select Trend as the Report type, a Graph
Type list will appear. The Graph Type options are as follows:
o
Min/Max: Select this option to generate a report that plots the minimum and maximum values
registered by different metrics during a specified timeline.
o
Avg: Select this option to generate a report that plots the average values computed for various
metrics during a specified timeline.
o
Sum: Select this option to generate a report that plots the sum of the values of a measure
during a specified timeline.
7.
The speed with which a report is generated depends primarily on the report Timeline. While a Timeline that
varies between a couple of days to a week enables the eG Enterprise system to quickly retrieve the required
data, timelines that span multiple weeks/months could slow-down the data retrieval and report generation
process to a considerable extent, owing to the volume of data involved. In order to ensure quick and easy
access to reports, eG Enterprise provides you the option of enabling data retrieval from the Trend information in
the database, instead of the Detailed test information that is used by default for report generation. The Detailed
test information base comprises of multiple measurement records for a test - one or more each for every test
execution. Whereas, the Trend information includes only hourly, daily, and monthly summary computations for
a test performed on a continuous basis. For instance, during a period of 1 hour, a test that runs every 5
minutes inserts atleast 12 records into the Detailed test information base. On the other hand, the Trend
119
The Operation Reports
information base would consist of only 1 record for the same 1 hour period. Fewer the number of records,
query execution becomes that much quicker, and data retrieval faster. To use the trend data for report
generation, you will have to select the Trend option from the Show Data field in Figure 5.28. By default, the
Detailed option is selected here in Figure 5.28 indicating that the report data is retrieved from the detailed test
information in the database. If need be, you can also ensure that all reports always use the Detailed test tables
alone by hiding the Show Data field from the reporter interface. To achieve this, do the following:
8.
Login to the eG administrative interface as 'admin'.
Select the Manager option from the Settings tile that appears when the
clicked.
From the GENERAL SETTINGS page that then appears, if you set the Compute average/sum of metrics
while trending flag to No, then the Show Data field will not appear in the reporter interface; this denies
users access to the Trend option, and thus ensures that reports are always generated using the Detailed
tables.
button against the Admin tab is
A Trend report will not include the data for the current day since trend data is only
computed at the end of the day.
If the Trend option is chosen, the time period of the report should be greater than
1 day.
The usage of Detailed test tables for generating reports, especially those that span
weeks, increases the stress on the eG database, thus resulting in undue delays in
report generation. In order to ensure that the database is not choked by such
voluminous data requests, you can configure eG Enterprise to automatically "force"
the use of the Trend option if the Timeline of a report exceeds a pre-configured
duration. To specify this time boundary, do the following:
o
Edit the eg_report.ini file in the <EG_INSTALL_DIR>\manager\config directory.
o
In the [MISC] section of the file, you will find a DetailedTime parameter.
o
Specify the duration (in days) beyond which Detailed reports cannot be generated,
against the DetailedTime parameter, and save the eg_report.ini file.
o
For instance, to make sure that Detailed reports are disallowed for a Timeline of
over 2 weeks, set the DetailedTime parameter to 14 and save the file.
o
Say, subsequently, you attempt to generate a Detailed report for a Fixed Timeline
of 3 weeks (which is greater than the 14-day limit set in our example). The instant
you select the 3 weeks option from the Fixed list box, the Detailed option gets
automatically disabled, and the Trend option gets enabled. Similarly, if you specify
an Any Timeline that runs over 14 days, then, upon clicking the Run Report button
to generate the report, a message box appears (see Figure 5.8) informing you that
only the Trend option is permitted.
o
To proceed with the Trend report generation, click the OK button in the message
box.
In large environments, reports generated using months of data can take a long time to complete.
120
The Operation Reports
Administrators now have the option of generating reports on-line or in the background. When a report is
scheduled for background generation, administrators can proceed with their other monitoring, diagnosis, and
reporting tasks, while the eG manager is processing the report. This saves the administrator valuable time. To
schedule background processing of a report, select the Background Save - PDF option from the Report
Generation list. In this case, a Report Name text box will appear, where you would have to provide the name
with which the report is to be saved in the background. To process reports in the foreground, select the
Foreground Generation - HTML option from this list.
9.
The Report Generation list will appear only if the EnableBackgroundReport flag in
the [BACKGROUND_PROCESS] section of the eg_report.ini file (in the
{EG_INSTALL_DIR}\manager\config directory) is set to Yes.
The default selection in the Report Generation list will change according to the
Timeline specified for the report. If the Timeline set is greater than or equal to the
number of days specified against the MinDurationForReport parameter in the
[BACKGROUND_PROCESS] section of the eg_report.ini file, then the default
selection in the Report Generation list will be Background. On the other hand, if the
Timeline set for the report is lesser than the value of the MinDurationForReport
parameter, then the default selection in the Report Generation list will be
Foreground. This is because, the MinDurationForReport setting governs when
reports are to be processed in the background. By default, this parameter is set to
2 weeks - this indicates that by default, reports with a timeline of 2 weeks and
above will be processed in the background.
Finally, click on the Run Report button to generate the graph. If the option chosen from the Report Generation
list is Foreground Generation - HTML, then, clicking on the Run Report button will invoke Figure 5.29.
121
The Operation Reports
Figure 5.29: The Website Performance report
10.
These graphs are the ones that were configured specifically for the web site buy.abc.com (see Figure 5.29). For
more details on configuring specific Site-Measure reports, refer to Section 3.2.
11.
On the other hand, if the Background Save - PDF option is chosen from the Report Generation list, then clicking
on the RUN REPORT button will not generate the report and display it in this page for your benefit. Instead, a
message indicating that the report is being processed in the background will appear. This will be accompanied
by a link that will lead you to the page that lists all the reports that are being processed in the background, and
their current status. If background report generation fails for a report, you can regenerate that report using this
page, or can even delete that report if need be. On the other hand, if background processing successfully
completes for your report, then, you can view a PDF of the report by clicking on the
icon in that page.
5.5 Top Events Report
The Top Events report can be used to analyze the history of past events recorded by the eG Enterprise system, to
determine which component, component type, or test is seeing the most number of events. Events can also be
classified based on severity.
This report serves two main purposes. Administrators can use this report to identify which components or component
types are seeing the most events. Using this report, administrators can determine where the “weak links” in their
environment are. By classifying the events based on the test that generated the events, administrators can determine
which tests are generating the most events. By verifying the authenticity of events being reported for the tests with
the highest number of events, administrators can identify the tests for which the threshold settings may need to be
tuned (thereby minimizing the number of “false” alerts generated by the system).
To generate a Top Events report, do the following:
1.
Select the Top Events option from the Event Analysis node of the REPORTS BY FUNCTION tree.
2.
Figure 5.30 will then appear.
122
The Operation Reports
Figure 5.30: Event Analysis for a particular zone
3.
If you want to perform an analysis of events pertaining to a particular zone/segment/service, then select the
Zone, Segment, or Service option (as the case may be) from the Analyze by list box. You will then be prompted
to select a specific Zone, Segment, or Service to be analyzed.
4.
On the other hand, if you want to analyze the events related to all components across the monitored
infrastructure, then select the Component option from the Analyze by list box (see Figure 5.31).
Figure 5.31: Event analysis across the environment
5.
Next, you will find that Figure 5.30 offers four check boxes. You can select any/few/all the available check
boxes depending upon your reporting needs. For instance, to view the number of alerts that were generated for
every component in the target environment or in the selected zone, service, or segment during a particular
period, use the component option from the Group by section of Figure 5.30. By default, the Component
option is chosen.
6.
Specify a Timeline for the report. You can either provide a fixed time line such as 1 hour, 2 days, etc., or select
the Any option from the list to provide a From and To date/time for report generation.
123
The Operation Reports
For every user registered with the eG Enterprise system, the administrator can indicate the
maximum timeline for which that user can generate a report. Once the maximum timeline is
set for a user, then, whenever that user logs into eG Reporter and attempts to generate a
report, the Timeline list box in the report page will display options according to the maximum
timeline setting of that user. For instance, if a user can generate a report for a maximum
period of 3 days only, then 3 days will be the highest option displayed in the Timeline list i.e., 3 days will be the last option in the fixed Timeline list. Similarly, if the user chooses the
Any option from the Timeline list and proceeds to provide a start date and end date for
report generation using the From and To specifications, eG Enterprise will first check if the
user's Timeline specification conforms to his/her maximum timeline setting. If not, report
generation will fail. For instance, for a user who is allowed to generate reports spanning over
a maximum period of 3 days only, the difference between the From and To dates should
never be over 3 days. If it is, then, upon clicking the Run Report button a message box will
appear, prompting the user to change the From and To specification.
7.
Then, proceed to indicate whether the resulting report should include detailed event descriptions or not. By
default, the Event Analysis report displays an event summary along with a graph depicting event distribution
across the chosen parameters (i.e., Component, Component Type, Test, and/or Severity). Accordingly, the
Show Details flag is set to No by default. If you want the report to include complete event details, select the Yes
option.
8.
In large environments, reports generated using months of data can take a long time to complete.
Administrators now have the option of generating reports on-line or in the background. When a report is
scheduled for background generation, administrators can proceed with their other monitoring, diagnosis, and
reporting tasks, while the eG manager is processing the report. This saves the administrator valuable time. To
schedule background processing of a report, select the Background Save - PDF option from the Report
Generation list. In this case, a Report Name text box will appear, where you would have to provide the name
with which the report is to be saved in the background. To process reports in the foreground, select the
Foreground Generation - HTML option from this list.
124
The Operation Reports
The Report Generation list will appear only if the EnableBackgroundReport flag in
the [BACKGROUND_PROCESS] section of the eg_report.ini file (in the
{EG_INSTALL_DIR}\manager\config directory) is set to Yes.
The default selection in the Report Generation list will change according to the
Timeline specified for the report. If the Timeline set is greater than or equal to the
number of days specified against the MinDurationForReport parameter in the
[BACKGROUND_PROCESS] section of the eg_report.ini file, then the default
selection in the Report Generation list will be Background. On the other hand, if the
Timeline set for the report is lesser than the value of the MinDurationForReport
parameter, then the default selection in the Report Generation list will be
Foreground. This is because, the MinDurationForReport setting governs when
reports are to be processed in the background. By default, this parameter is set to
2 weeks - this indicates that by default, reports with a timeline of 2 weeks and
above will be processed in the background.
9.
Finally, click the Run Report button. If the option chosen from the Report Generation list is Foreground
Generation - HTML, and if the Component check box had been selected earlier, then, clicking on the Run Report
button will invoke Figure 5.32. Figure 5.32 displays a bar chart of the top 10 problem-prone components in the
monitored environment or in the chosen zone/segment/service. With the most problematic components thus
revealed, you can instantly proceed to investigate the reasons for the performance degradation, and promptly
initiate the necessary remedial measures.
10.
To know how all the other components have performed, look below the bar chart. You will find a tabulated list
of all the managed components in the environment or in the selected zone/ service/segment, and the number
of ALERTS that were generated for every component during the specified Timeline. Every number so displayed
will be expressed as a percentage of the total number of alerts (displayed at the end of the report), and this
value will appear in brackets alongside the number. Moreover, if the Show Details flag had been set to Yes for
the report, then an additional Details of events section will appear (see Figure 5.32), which will provide the
complete details of the events summarized above.
125
The Operation Reports
Figure 5.32: An Event Analysis for Components
11.
Similarly, if the Component Type option had been chosen from Figure 5.30, a bar chart revealing the top 10
126
The Operation Reports
problem-prone component-types will appear (see Figure 5.33). Besides this, the complete list of problem
component-types in the infrastructure or in the chosen zone/service/segment, and the number of problems they
encountered during the specified Timeline will also be available. The list is sorted in the descending order of the
number of ALERTS.
Figure 5.33: An Event Analysis for Component-types
12.
Likewise, if the TEST option had been chosen earlier, then, the resulting report will enable you to identify at a
single glance, the performance areas that have been hit badly during a particular period. The details provided
by this report include the following:
A bar chart (see Figure 5.34) denoting the top-10 tests that reported the maximum number of performance
127
The Operation Reports
issues; a quick glance at this bar chart enables administrators to easily identify the worst performance
areas in the environment as a whole or in the chosen zone/segment/service, and assess how badly they
have been affected.
A table that displays the complete list of tests that executed in the environment or in the
zone/service/segment, and the number of ALERTS per test (see Figure 5.34); accompanying every test is
a comma-separated list of problem measures reported by that test, in brackets; this list is sorted in the
descending order of the number of alerts, and provides an overview of the test behavior.
128
The Operation Reports
Figure 5.34: An Event Analysis for Tests
13.
On the other hand, if you had chosen the SEVERITY option from Figure 5.30, then, you would be able to view
the number of critical, major, and minor issues that attacked the environment or the selected
zone/service/segment during a given period. This again is graphically represented and available as a tabulation
129
The Operation Reports
as well, and clearly indicates the type of errors that were common (see Figure 5.35) during the specified
timeline.
Figure 5.35: An Event Analysis for Alarm Priorities
14.
For a deeper insight into the event patterns in your infrastructure or in the zone/segment/service that you have
chosen for analysis, you can employ a combination of the parameters provided in Figure 5.30 - i.e., you can
choose multiple options from the EVENT ANALYSIS page. For instance, selecting all the four options from Figure
5.30, will generate the report depicted by Figure 5.36.
130
The Operation Reports
Figure 5.36: An Event Analysis for all the options offered
15.
As you can see, Figure 5.36 displays a bar chart depicting the top-10 event producing combinations. Below the
bar chart, is a table that reveals the problem tests and measures for every component in the target
environment (or in the zone/service/segment), the number and percentage of alerts that were generated for
that component, the alert type (whether critical, major, or minor), and the corresponding component-type. A
quick look at this report helps you easily identify the bottleneck areas and the type of issues these areas are
been plagued by, so that steps for an early resolution can be immediately taken.
16.
If you want this event summary to be supplemented by detailed event information, then set the Show Details
flag in this page to Yes. Doing so invokes a report consisting of a bar chart, followed by an event summary, and
131
The Operation Reports
finally, a detailed event-by-event history, which includes the start time of the event, event duration, the
affected component, component type, test, and service, and a brief event description.
17.
On the other hand, if the Background Save - PDF option is chosen from the Report Generation list, then clicking
on the Run Report button will not generate the report and display it in this page for your benefit. Instead, a
message indicating that the report is being processed in the background will appear. This will be accompanied
by a link that will lead you to the page that lists all the reports that are being processed in the background, and
their current status. If background report generation fails for a report, you can regenerate that report using this
page, or can even delete that report if need be. On the other hand, if background processing successfully
completes for your report, then, you can view a PDF of the report by clicking on the
icon in that page.
5.6 Uptime/Downtime Analysis Reports
Uptime is a key measure of the general health and availability of the critical servers and network devices in an IT
infrastructure. Periodic uptime values that the eG agent reports for target servers and devices can alert you to
unscheduled reboots that occurred recently; however, to effectively assess server/device availability over time,
accurately determine unexpected and prolonged breaks in availability, and accordingly ascertain service level
achievements/slippages, a look at the total uptime of a server/device and the total number of reboots it experienced
over a period of time is necessary. To enable such an analysis for one/more critical components of an IT
infrastructure, eG Enterprise provides Uptime/Downtime Analysis reports.
Using the Uptime/Downtime Analysis reports, you can figure out the following:
Which servers/devices are the healthiest, in terms of availability?
Which servers/devices have been down for the longest period of time? How long was each server/device
unavailable during the specified timeline?
How many times during the designated period did a server/device reboot? How many of these were
scheduled reboots? How long was the server/device down before every reboot?
To generate this report, do the following:
1.
Select the Uptime/Downtime Analysis option from the Event Analysis node of the REPORTS BY FUNCTION tree.
2.
When Figure 5.37 appears, first indicate the Report Type to be generated. For viewing the uptime details of
components in a table, choose the Data option. For graphically representing the uptime/downtime of chosen
components, select the Graph option.
Figure 5.37: Specifying the criteria for Uptime/Downtime Analysis reports
3.
Next, pick an option from the Uptime for list and indicate whether the report to be generated is for Systems or
132
The Operation Reports
Network Devices.
4.
By default, selecting the Systems option from the Uptime for list will populate the Systems list box in Figure
5.37 with all the managed systems in the target environment. Similarly, by default, selecting the Network
Devices option from the Uptime for list will populate the Network Devices list box that will appear in this case,
with all the managed network devices in the target environment. You would have to pick and choose the
systems/network devices for which the report is to be generated from the Systems or Network Devices list box
(as the case may be).
5.
This implies that in the case of large IT infrastructures characterized by hundreds of components, a large
number of systems/network devices will be made available for selection in the Systems or Network Devices list
boxes; selecting the desired components from this ‘endless’ list will hence become a painful exercise. To ease
the pain involved in choosing the components for report generation, eG Enterprise provides an Analyze by list;
by selecting an option from this list, you can quickly condense the Systems or Network Devices list and then
swiftly identify the components of interest to you. By default, the Component option is chosen from the
Analyze by list - this indicates that by default, the Systems and Network Devices list will display all the managed
systems and network devices (as the case may be) in the target environment. The other options in the list
include:
o
Zone: To generate an uptime report for one/more components that are included in a zone, pick the Zone
option. A Zone drop-down list will then appear, from which you would have to select the zone to which the
components of interest to you belong. An Include Subzone flag also appears. Indicate whether the
components present within the sub-zones of the chosen zone are also to be to be considered for report
generation, by setting the Include Subzone flag to Yes.
o
Segment: If you want to generate an uptime report for one/more components that belong to a segment,
select the Segment option from Analyze by, and then pick the Segment from the drop-down list that
appears.
o
Service: If you want to generate an uptime report for one/more components involved in the delivery of a
service, select the Service option from Analyze by, and then pick the required Service from the drop-down
list that appears.
6.
Then, to further filter the components listed in the Systems (or Network Devices) list box, pick a Component
Type - this way, only those systems/network devices that are of the chosen type will be available for selection
in the Systems (or Network Devices) list box. By default, the ALL option is chosen here indicating that all
managed systems/network devices in the target environment will be displayed in the Systems (or Network
Devices) list box by default.
7.
Select the systems/network devices for which uptime reports are to be generated from the Systems or Network
Devices list box (as the case may be). If the list consists of too many Systems or Network Devices, then viewing
all the systems/network devices and selecting the ones you need for report generation could require endless
scrolling. To avoid this, you can click the
button next to the Systems or Network Devices list (as the case
may be). The SYSTEMS/NETWORK DEVICES pop up window will then appear using which you can view almost
all the systems/network devices in a single interface and select the ones for which the report is to be
generated.
8.
Then, specify the Timeline for the graph. You can either provide a fixed time line such as 1 hour, 2 days, etc.,
or select the Any option from the list to provide a From and To date/time for report generation.
133
The Operation Reports
For every user registered with the eG Enterprise system, the administrator can indicate the
maximum timeline for which that user can generate a report. Once the maximum timeline is
set for a user, then, whenever that user logs into eG Reporter and attempts to generate a
report, the Timeline list box in the report page will display options according to the maximum
timeline setting of that user. For instance, if a user can generate a report for a maximum
period of 3 days only, then 3 days will be the highest option displayed in the Timeline list i.e., 3 days will be the last option in the fixed Timeline list. Similarly, if the user chooses the
Any option from the Timeline list and proceeds to provide a start date and end date for
report generation using the From and To specifications, eG Enterprise will first check if the
user's Timeline specification conforms to his/her maximum timeline setting. If not, report
generation will fail. For instance, for a user who is allowed to generate reports spanning over
a maximum period of 3 days only, the difference between the From and To dates
should never be over 3 days. If it is, then, upon clicking the Run Report button a
message box will appear, prompting the user to change the From and To
specification.
9.
In addition to the settings discussed above, this report comes with a set of default specifications. These settings
are hidden by default. If you do not want to disturb these default settings, then you can proceed to generate
the report by clicking the Run Report button soon after you pick one/more Systems or Network Devices for
report generation. However, if you want to view and then alter these settings (if required), click on the
icon.
The default settings will then appear in the MORE OPTIONS drop down window (See Figure 5.38). The steps
below discuss each of these settings and how they can be customized.
Figure 5.38: The default settings for generating the Uptime/Downtime Analysis reports
10.
By default, the Uptime/Downtime Analysis report ignores all reboots that occur when a 'maintenance policy
configuration' is active on a component - in other words, such reboots are by default excluded from the count
of reboots displayed by the report. This default behavior is governed by the Include Maintenance flag, which is
set to No by default. You can however, optionally configure the Uptime report to include reboots that occur
during maintenance periods in its count of reboots. For this, set the Include Maintenance flag to Yes.
134
The Operation Reports
11.
If the timeline specified for the report needs to exclude the data collected during the Weekends, then set
Exclude weekends to Yes. If not, select No.
12.
If the Report Type is Data, then, a Show Details flag will appear set to No by default. This indicates that, by
default, the resulting Data report will not provide reboot details. To view reboot details along with the uptime
details, set the Show Details flag to Yes.
You can configure the days of the week that need to be considered as a ‘weekend’ using the
Days parameter in the [EXCLUDE_WEEKEND] section in the eg_report.ini file (in the
<EG_INSTALL_DIR>\manager\config directory). The Days parameter is set to Saturday,Sunday
by default. To change this weekend specification, enter two other days of the week against
the Days parameter.
13.
If the Report Type you have chosen is Graph, then a Chart drop-down list will appear from which you can select
how uptime/downtime should be represented in the graph - as a percentage? or in hours?. If the
%Uptime/%Downtime option is chosen, then the resulting graph will plot the percentage of time for which the
selected components have been up/down. On the other hand, if the Uptime/Downtime option is selected, then
the graph will plot the total number of hours for which the chosen components have been up/down.
14.
Next, select the data on the basis of which the report should be sorted. By default, the Downtime option is
chosen from the Sort by list.
15.
Since the default Sort by option is Downtime, by default, the report provides the details of only the top-10
components with the maximum downtime. If a different Sort by option, say Reboots, is chosen, then the report,
by default, will only pertain to the top-10 components in the environment, on the basis of the number of
reboots. You can choose a different top-n / last-n option from the Show list, if need be.
By default, the values displayed in the Show list range from TOP-10 to LAST-10. This is
because, the Showtop parameter in the [INFOS] section of the eg_report.ini file (in the
<EG_INSTALL_DIR>\manager\config directory) is set to 10, by default. You can, if required,
configure the Show list to display a different range of options. For this, specify a different
number against the Showtop parameter, and save the eg_report.ini file.
16.
Next, indicate the report Timeperiod.
By default, the Timeperiod is set to 24 hours. Accordingly, the From and To parameters in the
[TIMEFRAME] section of the eg_report.ini file (in the <EG_INSTALL_DIR>\manager\config
directory) are set to 00:00 and 24:00 respectively. If need be, you can override this default
setting by configuring a different timeframe against the From and/or To parameters.
135
The Operation Reports
17.
In large environments, reports generated using months of data can take a long time to complete.
Administrators now have the option of generating reports on-line or in the background. When a report is
scheduled for background generation, administrators can proceed with their other monitoring, diagnosis, and
reporting tasks, while the eG manager is processing the report. This saves the administrator valuable time. To
schedule background processing of a report, select the Background Save - PDF option from the Report
Generation list. In this case, a Report Name text box will appear, where you would have to provide the name
with which the report is to be saved in the background. To process reports in the foreground, select the
Foreground Generation - HTML option from this list.
The Report Generation list will appear only if the EnableBackgroundReport flag in
the [BACKGROUND_PROCESS] section of the eg_report.ini file (in the
{EG_INSTALL_DIR}\manager\config directory) is set to Yes.
The default selection in the Report Generation list will change according to the
Timeline specified for the report. If the Timeline set is greater than or equal to the
number of days specified against the MinDurationForReport parameter in the
[BACKGROUND_PROCESS] section of the eg_report.ini file, then the default
selection in the Report Generation list will be Background. On the other hand, if the
Timeline set for the report is lesser than the value of the MinDurationForReport
parameter, then the default selection in the Report Generation list will be
Foreground. This is because, the MinDurationForReport setting governs when
reports are to be processed in the background. By default, this parameter is set to
2 weeks - this indicates that by default, reports with a timeline of 2 weeks and
above will be processed in the background.
18.
Finally, click the Run Report button.
19.
If the Report Type is Graph, and the option chosen from the Report Generation list is Foreground Generation HTML, then clicking the Run Report button will reveal a bar graph (see Figure 5.39) depicting the uptime and
downtime of the chosen components. From this graph, you can easily identify the components that have been
unavailable during the specified Timeline, and the duration of the unavailability.
Figure 5.39: The Uptime Graph for Chosen Components
136
The Operation Reports
20.
Clicking on the bar corresponding to any of the components displayed in Figure 5.39 will invoke Figure 5.40
which will allow you to zoom into the uptime details of that particular component. Besides providing a pie chart
that depicts the percentage uptime and downtime of the chosen component, Figure 5.40 also provides the
following useful information:
The total duration for which the chosen component was up and running during the specified Timeline;
The percentage uptime of the component;
The total duration for which the chosen component was down during the specified Timeline;
The percentage downtime of the component;
The total number of reboots that the component experienced during the specified Timeline;
A Reboot Details section that indicates the following for every reboot:
When the component was shutdown
When the reboot occurred
The duration for which the component remained shutdown before being rebooted;
Figure 5.40: Additional uptime details
21.
Using the Uptime Details page, you can figure out how often a component was rebooted, and thus determine
whether such reboots were scheduled or unexpected.
22.
If the Report Type is Data, and the option chosen from the Report Generation list is Foreground Generation HTML, then clicking on the Run Report button will reveal Figure 5.41. For every component chosen, the Data
report reveals the total uptime, total downtime, percentage uptime, percentage downtime, and number of
137
The Operation Reports
reboots. Components with high uptime/downtime and those that rebooted frequently can be instantly isolated
using this report. Since the Show details flag is set to No by default for the Data report, Figure 5.41 will not
include a separate section providing reboot information. To view the reboot details of a component therefore,
you will have to click on the
icon under the Details column corresponding to that component. This icon will
appear only if that component was rebooted at least once during the specified Timeline.
Figure 5.41: The Uptime Data Report
23.
Figure 5.42 will then appear providing the reboot information in a separate window.
Figure 5.42: The Reboot Details appearing in a separate window
24.
If the Show Details flag had been set to Yes instead, then the reboot details available in Figure 5.43 be
provided as part of the original report itself as depicted below.
138
The Operation Reports
Figure 5.43: The Uptime Data report displaying reboot details as well
25.
On the other hand, if the Background Save - PDF option is chosen from the Report Generation list, then clicking
on the RUN REPORT BUTTON will not generate the report and display it in this page for your benefit. Instead, a
message indicating that the report is being processed in the background will appear. This will be accompanied
by a link that will lead you to the page that lists all the reports that are being processed in the background, and
their current status. If background report generation fails for a report, you can regenerate that report using this
page, or can even delete that report if need be. On the other hand, if background processing successfully
completes for your report, then, you can view a PDF of the report by clicking on the
icon in that page.
5.7 History of Alarms
The History of Alarms report, as its name suggests, provides details of all the alarms that were generated by the eG
manager during a configured period of time in the past.
If the user who logs into the eG Reporter console has been assigned only VMs for monitoring
(and not any other component), then the Operations menu will provide only the History of
Alarms report option. In this case, the History of Alarms will list all the historical alarms
related to the VMs that have been assigned to the current user.
Historical analysis of alarms reveals recurring issues and problem-prone components, and helps deduce problem
patterns. Using the filter option provided by the report, you can zoom into specific types of problems and scrutinize
them closely. The report also provides analytical tools like detailed diagnosis and graphs, which can be used to
perform a post-mortem of the problems and diagnose the root-cause of issues.
139
The Operation Reports
To generate this report, do the following:
1.
Select the History of Alarms option from the Event Analysis node of the REPORTS BY FUNCTION tree.
2.
Figure 5.44 then appears.
Figure 5.44: Generating the History of Alarms report
3.
You can build filter conditions using Figure 5.44 so that, you can selectively view the alarm history. The first
step towards building these filter conditions is selecting a basis for the filter. This can be achieved by picking an
option from the Analyze by list. The options available here are as follows:
o
Component : This is the default selection in the Analyze by list. This implies that by default, the HISTORY OF
ALARMS report is generated for all managed components in the environment. If you proceed with the
default selection, then, you will find that All is the default selection in the Component Type list, and all the
managed components in the environment populate the Components list. If you want to view the alarm
history of a particular component of a particular component-type, pick the type of your choice from the
Component Type list; this will make sure that the Components list consists of only those managed
components that are of the chosen type. You can then easily pick the component of your choice from the
Component list.
o
Zone: Selecting this option from the Analyze by list will invoke a Zone list. Select a particular zone from this
list, if you want to view the history of alarms related to that zone. An Include Subzones flag also appears.
By setting this flag to Yes, you can make sure that the alarm history also includes those alarms that are
associated with the sub-zones of the chosen zone.
Once a Zone is selected, the Component Type and Components lists will be populated with those
component types and components (respectively) that are part of the selected zone. To view the alarm
history of a component that is part of a zone, pick that component from the Components list. If the
Components list has too many components to choose from, then, you can condense the list by first picking
a Component Type; this will make sure that the Components list consists of those components in the
selected zone that are of the chosen type. You can then easily pick the component of your choice from the
Components list.
Note that the 'Zone' option will not be available in the 'Analyze by' list if no zones are configured in the
environment.
o
Segment: If this option is chosen from the Analyze by list, a Segment list will additionally appear. In order
to view the alarm history pertaining to a specific segment, pick a segment from the Segment list.
Once a Segment is selected, the Component Type and Components lists will be populated with those types
and components (respectively) that are part of the selected segment. To view the alarm history of a
component that is part of a segment, pick that component from the Components list. If the Components
list has too many components to choose from, then, you can condense the list by first picking a Component
Type; this will make sure that the Components list consists of those components in the selected segment
that are of the chosen type. You can then easily pick the component of your choice from the Components
140
The Operation Reports
list.
Note that the 'Segment' option will not be available in the 'Analyze By' list if no segments are configured in
the environment.
o
Service: If this option is chosen from the Analyze by list, a Service list will additionally appear. In order to
view the alarm history pertaining to a specific service, pick a service from the Service list.
Once you choose a Service, the Component Type and Components lists in Figure 5.44 will be populated
with those types and components (respectively) that are engaged in the delivery of the said service. If you
want to view the alarm history of a component that supports the selected service offering, pick that
component from the Components list. If the Components list has too many components to choose from,
then, you can condense the list by first picking a Component Type; this will make sure that the
Components list consists of those components in the selected service that are of the chosen type. You can
then easily pick the component of your choice from the Components list.
Note that the 'Service' option will not be available in the 'Analyze by' list if no services are configured in the
environment.
4.
If the Components list consists of too many components, then viewing all the components and selecting the
ones you need for report generation could require endless scrolling. To avoid this, you can click the
button
next to the Components list. The COMPONENTS pop up window will then appear using which you can view
almost all the components in a single interface and Select the ones for which the report is to be generated.
5.
For viewing the details of alarms that were generated during a specific time window, select a fixed Timeline, or
choose Any to provide a date/time range.
6.
In addition to the settings discussed above, this report comes with a set of default specifications. These settings
are hidden by default. If you do not want to disturb these default settings, then you can proceed to generate
the report by clicking the Run Report button soon after you pick one/more components from the Components
list. However, if you want to view and then alter these settings (if required), click on the
button. The default
settings will then appear in the MORE OPTIONS drop down window (see Figure 5.45). The steps below discuss
each of these settings and how they can be customized.
Figure 5.45: The default settings for generating the History of Alarms report
7.
You can even choose to view the details of past alarms that are of a particular priority, by selecting that priority
from the Priority list. All is the default selection here.
8.
If you wish to view the alarms assigned to a chosen user in your environment, then select the user from the
User(s) list. By default, All option will be chosen from this list indicating that the alarms pertaining to all the
users will be listed by default.
9.
Next, to view the alarms that have remained unresolved for a time period that is in excess of a specified
duration, select the greater than option from the Duration list, enter a value in the adjacent text box, and then
select a unit of time from the list box alongside. For example, to view the history of the alarms that have
141
The Operation Reports
remained unresolved for over 1 hour, select the greater than option, enter 1 in the text box alongside, and
select hours from the list box adjacent to it.
10.
Similarly, you can view the history of alarms that have remained unresolved for a time period lesser than a
specified duration. To achieve this, select the lesser than option from the Duration list, specify a value in the
adjacent text box, and select a unit of time from the list box.
11.
In addition, you can configure the number of event records to be displayed per page of the event history. By
default, 15 records are displayed per page. To display more records, select an appropriate value from the
Events per page list.
12.
In large environments, reports generated using months of data can take a long time to complete.
Administrators now have the option of generating reports on-line or in the background. When a report is
scheduled for background generation, administrators can proceed with their other monitoring, diagnosis, and
reporting tasks, while the eG manager is processing the report. This saves the administrator valuable time. To
schedule background processing of a report, select the Background Save - PDF option from the Report
Generation list. In this case, a Report Name text box will appear, where you would have to provide the name
with which the report is to be saved in the background. To process reports in the foreground, select the
Foreground Generation - HTML option from this list.
13.
The Report Generation list will appear only if the EnableBackgroundReport flag in
the [BACKGROUND_PROCESS] section of the eg_report.ini file (in the
{EG_INSTALL_DIR}\manager\config directory) is set to Yes.
The default selection in the Report Generation list will change according to the
Timeline specified for the report. If the Timeline set is greater than or equal to the
number of days specified against the MinDurationForReport parameter in the
[BACKGROUND_PROCESS] section of the eg_report.ini file, then the default
selection in the Report Generation list will be Background. On the other hand, if the
Timeline set for the report is lesser than the value of the MinDurationForReport
parameter, then the default selection in the Report Generation list will be
Foreground. This is because, the MinDurationForReport setting governs when
reports are to be processed in the background. By default, this parameter is set to
2 weeks - this indicates that by default, reports with a timeline of 2 weeks and
above will be processed in the background.
Finally, click the Run Report button to generate the report. Figure 5.46 then appears.
142
The Operation Reports
Figure 5.46: The HISTORY OF ALARMS report
14.
In this report, the details pertaining to every alarm like the start time, duration, name of the component,
component-type, test, alarm description, and the service (if any) that is impacted by the issue, are available.
Every row of alarm information will be accompanied by a colored indicator that indicates the corresponding
alarm priority. Critical alarms will be of the color red, major alarms will be in orange, and the minor ones come
in yellow. An alarm with the end time set to current denotes a problem that has still not been fixed.
15.
You can search the generated report for a particular alarm based on various criteria. For instance, to search for
alarm information related to all managed components of a particular type, provide the whole/part of the
component type to search for in theSearch text box and click the
icon alongside. Likewise, you can search
based on Component Name, Service, Test, and Alarm Description.
16.
Typically whenever an alarm is raised for the problems at the host-level of a component, the HISTORY OF
ALARMS page automatically sets the Component type to Host system, even if the component affected is say,
an Oracle Database server or a Web server. From this alarm information, users cannot determine the exact
Component type of the affected component. Moreover, help desk personnel may prefer to view the operating
system of the problem host as part of the alarm information displayed in the History of Alarms page, as such an
information will greatly simplify the troubleshooting process. To make sure that the History of Alarms page
enables help desk to easily understand, interpret, and solve problems affecting a host's performance, you can
optionally configure the eG Enterprise system to display the actual Component type, Host system, or the
affected Operating system for host-level alarms in the History of Alarms page. To enable this capability, do the
following:
Edit the eg_ui.ini flag in the <EG_INSTALL_DIR>\manager\config directory
In the [HOST_SYSTEM] section of this file, set the Show_HostSystem flag to any one of the following
values mentioned below:
o
Set the Show_HostSystem flag to HostSystem if you want the component type to be displayed
as Host system for the host-level alarms;
o
Set the Show_HostSystem flag to CompType if you want to display the affected component; This
is the default setting that is provided;
o
Set the Show_HostSystem flag to OS if you want to display the operating system of the host;
Finally, save the file.
143
The Operation Reports
This configuration affects the CURRENT ALARMS window, email/SMS alerts, and SNMP traps as
well.
17.
The HISTORY OF ALARMS report also comprises of the
icon, which when clicked, allows you to view the
graph of the corresponding measure for the last one hour. If the detailed diagnosis capability has been enabled
for the eG installation, then problem measures for which detailed diagnosis is available will be accompanied by
the
icon. When this icon is clicked, the detailed diagnosis of the measure will appear, throwing greater light
on the problem condition.
18.
The NEXT, PREVIOUS, LAST and FIRST buttons, and the Page text box are provided to enable you to easily
browse the alarm information that runs across pages.
19.
To save you the trouble of scrolling up the report everytime you want to relook at the report criteria, eG
Reporter now includes a separate section with a summary of your specifications. Clicking the
button in this
section expands your report criteria so that you can alter your specification at any point of time.
20.
To hide the expanded report criteria, simply click on the
button.
5.8 History of Unknowns
Besides alarms, eG Reporter also enables users to historically analyze those tests, measures and components that
were in an UNKNOWN state during a given timeline in the past. A test can switch to an UNKNOWN state when the eG
Enterprise system is unable to determine the state of one/more metrics that test reports - this could be because of
any of the following reasons:
The test could have been wrongly configured;
The eG agent executing the test could have suddenly stopped;
The eG agent may have been unable to pull out metrics from the server;
The eG agent executing the test may not be able to transmit the metrics collected by that test to the eG
manager, owing to say, poor network connectivity;
Performing effective reactive analysis on the UNKNOWN measures, will enable administrators to understand which
tests and measures often switched to the 'indeterminate' state and why, and which components and business
services were affected by this switch. For this analysis, the eG Reporter allows the generation of the History of
Unknowns report.
To generate this report, do the following:
1.
From the eG Reporter interface, select the History of Unknowns option from the Event Analysis node of the
REPORTS BY FUNCTION tree.
2.
Figure 5.47 will then appear.
144
The Operation Reports
Figure 5.47: Generating a History of Unknowns report
3.
From the Analyze by list, pick a criterion for filtering the Component Type list. By default, the Components
option will be chosen from the Analyze by list - this is why, all the managed component types in the
environment will be made available for selection in the Component Type list. In large environments
characterized by numerous components of heterogeneous types, this Component Type list will be very long,
making selection difficult! To avoid this, you can pick any of the following filter criteria instead from the Analyze
by list:
o
Service: Select this option if the components of interest to you are engaged in the delivery of a particular
business service. If this option is chosen, then a Service drop-down will appear, from which you can select
a specific service. The Component Type list will then be populated with only those component types that
are associated with the chosen service.
o
Segment: Select this option if the components of interest to you are part of a segment topology. If this
option is chosen, then a Segment drop-down will appear, from which you can select a specific segment.
The Component Type list will then be populated with only those types of the component that belong to the
chosen segment.
o
Zone: Select this option if the components of interest to you have been added to a specific zone. If this
option is chosen, then a Zone drop-down will appear, from which you can select a specific zone. The
Component Type list will then be populated with only those components that are part of the chosen zone.
If the selected Zone contains sub-zone, you can additionally indicate whether/not the component types that
are included in the sub-zones should also appear in the Component Type list. To include the sub-zone
components as well, set the Include Subzones flag to Yes; to disregard the components in sub-zones, set
this flag to No.
4.
Pick a type from the Component Type list.
5.
From the Components list, select one/more components for which the report is to be generated. If the
Components list consists of too many components, then viewing all the components and selecting the ones you
need for report generation could require endless scrolling. To avoid this, you can click the
icon next to the
Components list. The COMPONENTS pop up window will then appear using which you can view almost all the
components in a single interface and select the ones for which the report is to be generated.
6.
Then, specify the Timeline for the report. You can either provide a fixed time line such as 1 hour, 2 days, etc.,
or select the Any option from the list to provide a From and To date/time for report generation.
145
The Operation Reports
For every user registered with the eG Enterprise system, the administrator can indicate the
maximum timeline for which that user can generate a report. Once the maximum timeline is
set for a user, then, whenever that user logs into eG Reporter and attempts to generate a
report, the Timeline list box in the report page will display options according to the maximum
timeline setting of that user. For instance, if a user can generate a report for a maximum
period of 3 days only, then 3 days will be the highest option displayed in the Timeline list i.e., 3 days will be the last option in the fixed Timeline list. Similarly, if the user chooses the
Any option from the Timeline list and proceeds to provide a start date and end date for
report generation using the From and To specifications, eG Enterprise will first check if the
user's Timeline specification conforms to his/her maximum timeline setting. If not, report
generation will fail. For instance, for a user who is allowed to generate reports spanning over
a maximum period of 3 days only, the difference between the From and To dates should
never be over 3 days. If it is, then, upon clicking the Run Report button a message box will
appear, prompting the user to change the From and To specification.
7.
In addition to the settings discussed above, this report comes with a set of default specifications. These settings
are hidden by default. If you do not want to disturb these default settings, then you can proceed to generate
the report by clicking the Run Report button soon after you select one/more components from the Components
list for report generation. However, if you want to view and then alter these settings (if required), click on the
icon. The default settings will then appear in the MORE OPTIONS drop down window. The steps below
discuss each of these settings and how they can be customized.
Figure 5.48: The default settings of the History of Unknowns report
8.
If you wish to view the history of unknowns assigned to a chosen user in your environment, then select the
user from the User(s) list. By default, All option will be chosen from this list indicating that the tests and
measures in the Unknown state pertaining to all the users will be listed by default.
9.
Next, to know which tests and measures reported for which component were in an UNKNOWN state for a time
period that is in excess of a specified duration, select the greater than option from the Duration list, enter a
value in the adjacent text box, and then select a unit of time from the list box alongside. For example, to view
the tests and measures that have remained in the UNKNOWN state for over 1 hour, select the greater than
option, enter 1 in the text box alongside, and select hours from the list box adjacent to it.
10.
Similarly, you can view the tests and measures that were in an UNKNOWN state for a time period lesser than a
specified duration. To achieve this, select the lesser than option from the Duration list, specify a value in the
adjacent text box, and select a unit of time from the list box.
11.
In addition, you can configure the number of UNKNOWN event records to be displayed per page of the UNKNOWN
146
The Operation Reports
history. By default, 15 records are displayed per page. To display more records, select an appropriate value
from the Events per page list.
12.
13.
In large environments, reports generated using months of data can take a long time to complete.
Administrators now have the option of generating reports on-line or in the background. When a report is
scheduled for background generation, administrators can proceed with their other monitoring, diagnosis, and
reporting tasks, while the eG manager is processing the report. This saves the administrator valuable time. To
schedule background processing of a report, select the Background Save - PDF option from the Report
Generation list. In this case, a Report Name text box will appear, where you would have to provide the name
with which the report is to be saved in the background. To process reports in the foreground, select the
Foreground Generation - HTML option from this list.
The Report Generation list will appear only if the EnableBackgroundReport flag in
the [BACKGROUND_PROCESS] section of the eg_report.ini file (in the
{EG_INSTALL_DIR}\manager\config directory) is set to Yes.
The default selection in the Report Generation list will change according to the
Timeline specified for the report. If the Timeline set is greater than or equal to the
number of days specified against the MinDurationForReport parameter in the
[BACKGROUND_PROCESS] section of the eg_report.ini file, then the default selection
in the Report Generation list will be Background. On the other hand, if the Timeline
set for the report is lesser than the value of the MinDurationForReport parameter,
then the default selection in the Report Generation list will be Foreground. This is
because, the MinDurationForReport setting governs when reports are to be
processed in the background. By default, this parameter is set to 2 weeks - this
indicates that by default, reports with a timeline of 2 weeks and above will be
processed in the background.
Finally, click the RUN REPORT button to generate the report. Figure 5.49 then appears.
147
The Operation Reports
Figure 5.49: The HISTORY OF UNKNOWNS report
14.
The HISTORY OF UNKNOWNS report also comprises of a GRAPH icon, which when clicked, allows you to view the
graph of the corresponding measure for the last one hour.
15.
You can even search for UNKNOWN information based on any of the following Search options from the report:
a particular Component Name;
a Component Type;
a Service;
a Test;
a Measure;
Pick any of the aforesaid options and enter the component name/type/service/test/measure to search for in the
text box provided alongside.
16.
The NEXT, PREVIOUS, LAST and FIRST buttons, and the Page text box are provided to enable you to easily
browse the Unknown information that runs across pages.
148
Consolidated Reports
Consolidated Analysis Reports
The CONSOLIDATED ANALYSIS reports option that the eG Reporter includes provides a bird's eye view of infrastructure
performance. While detailed graphs are ideal for analyzing performance of one server or application or device in
detail, what IT operators of large infrastructures need to be able to see is a quick comparison of performance across
the servers in their infrastructure.
The comparison should span multiple metrics so that the IT operators can get at a glance consolidated view of their
infrastructure. The consolidated reports option addresses this requirement. Using this capability, IT operators can
quickly determine if there are hot-spots in their infrastructure, whether the load balancing is working as expected,
etc. Comparison of these reports over time can provide key indications regarding performance trends.
eG enterprise uses the grouping of servers as a Zone to define the scope of a consolidated report. Choosing the Zone
option, allows a consolidated report to be defined comparing all the servers in the Zone. The Server option
summarizes the performance of one of the components of the infrastructure.
While the Server reports enable assessment of individual server performance over time, the Zone report aids in
analyzing the collective performance of the servers in a zone.
6.1 Server Performance Report
To simplify individual server monitoring, eG Enterprise offers the Server Performance Report, where the critical
performance results of a particular server are aggregated over time and made available. Here, administrators can
configure the measures that need to appear in the report and also compute specific values such as average,
maximum, minimum etc., so that they are provided with more actionable information on server performance.
To view a Server Performance report, do the following:
1.
Select the Server Performance option from the Consolidated Analysis node of the REPORTS BY FUNCTION tree.
2.
Figure 6.1 will then appear. To monitor a specific server, select the Server from the list.
Figure 6.1: Generating a Consolidated Server Report
3.
Specify the report Timeline. You can either provide a fixed time line such as 1 hour, 2 days, etc., or select the
Any option from the list to provide a From and To date/time for report generation.
149
Consolidated Reports
For every user registered with the eG Enterprise system, the administrator can indicate the
maximum timeline for which that user can generate a report. Once the maximum timeline is
set for a user, then, whenever that user logs into eG Reporter and attempts to generate a
report, the Timeline list box in the report page will display options according to the maximum
timeline setting of that user. For instance, if a user can generate a report for a maximum
period of 3 days only, then 3 days will be the highest option displayed in the Timeline list i.e., 3 days will be the last option in the fixed Timeline list. Similarly, if the user chooses the
Any option from the Timeline list and proceeds to provide a start date and end date for
report generation using the From and To specifications, eG Enterprise will first check if the
user's Timeline specification conforms to his/her maximum timeline setting. If not, report
generation will fail. For instance, for a user who is allowed to generate reports spanning over
a maximum period of 3 days only, the difference between the From and To dates
should never be over 3 days. If it is, then, upon clicking the Run Report button a
message box will appear, prompting the user to change the From and To
specification.
4.
In addition to the settings discussed above, this report comes with a set of default specifications. These settings
are hidden by default. If you do not want to disturb these default settings, then you can proceed to generate
the report by clicking the Run Report button soon after select a Server. However, if you want to view and then
alter these settings (if required), click on the
icon. The default settings will then appear in the MORE
OPTIONS drop down window (see Figure 6.2). The steps below discuss each of these settings and how they can
be customized.
Figure 6.2: The default settings for generating a Server Performance report
5.
The speed with which a report is generated depends primarily on the report Timeline. While a Timeline that
varies between a couple of days to a week enables the eG Enterprise system to quickly retrieve the required
data, timelines that span multiple weeks/months could slow-down the data retrieval and report generation
process to a considerable extent, owing to the volume of data involved. In order to ensure quick and easy
access to reports, eG Enterprise provides you the option of enabling data retrieval from the Trend information in
the database, instead of the Detailed test information that is used by default for report generation. The Detailed
test information base comprises of multiple measurement records for a test - one or more each for every test
execution. Whereas, the Trend information includes only hourly, daily, and monthly summary computations for
a test performed on a continuous basis. For instance, during a period of 1 hour, a test that runs every 5
150
Consolidated Reports
minutes inserts atleast 12 records into the Detailed test information base. On the other hand, the Trend
information base would consist of only 1 record for the same 1 hour period. Fewer the number of records,
query execution becomes much quicker, and data retrieval faster. To use the trend data for report generation,
you will have to select the Trend option from the Show Data field in Figure 6.2. By default, the Detailed option is
selected in Figure 6.2 indicating that the report data is retrieved from the detailed test information in the
database. If need be, you can also ensure that all reports always use the Detailed test tables alone by hiding
the Show Data field from the reporter interface. To achieve this, do the following:
6.
Login to the eG administrative interface as 'admin'.
Select the Manager option from the Settings tile that appears when the
clicked.
From the GENERAL SETTINGS page that then appears, if you set the Compute average/sum of metrics
while trending flag to No, then the Show Data field will not appear in the reporter interface; this denies
users access to the Trend option, and thus ensures that reports are always generated using the Detailed
tables.
button against the Admin tab is
A Trend report will not include the data for the current day since trend data is only
computed at the end of the day.
If the Trend option is chosen, the time period of the report should be greater than
1 day.
The usage of Detailed test tables for generating reports, especially those that span
weeks, increases the stress on the eG database, thus resulting in undue delays in
report generation. In order to ensure that the database is not choked by such
voluminous data requests, you can configure eG Enterprise to automatically "force"
the use of the Trend option if the Timeline of a report exceeds a pre-configured
duration. To specify this time boundary, do the following:
o
Edit the eg_report.ini file in the <EG_INSTALL_DIR>\manager\config directory.
o
In the [MISC] section of the file, you will find a DetailedTime parameter.
o
Specify the duration (in days) beyond which Detailed reports cannot be generated,
against the DetailedTime parameter, and save the eg_report.ini file.
o
For instance, to make sure that Detailed reports are disallowed for a Timeline of
over 2 weeks, set the DetailedTime parameter to 14 and save the file.
o
Say, subsequently, you attempt to generate a Detailed report for a Fixed Timeline
of 3 weeks (which is greater than the 14-day limit set in our example). The instant
you select the 3 weeks option from the Fixed list box, the Detailed option gets
automatically disabled, and the Trend option gets enabled. Similarly, if you specify
an Any Timeline that runs over 14 days, then, upon clicking the Run Report button
to generate the report, a message box appears (see Figure 5.8) informing you that
only the Trend option is permitted.
o
To proceed with the Trend report generation, click the OK button in the message
box. To terminate Trend report generation, click the CANCEL button.
Specify the start time and end time for report generation in the Time period field.
151
Consolidated Reports
The default Time period to be displayed here can be configured using the CONSOLIDATED
REPORTS page in the eG administrative interface; to access this page, follow the menu
sequence: Settings -> Reporter -> Consolidated Reports. For more details regarding this
page, refer to Section 3.4 of this manual.
7.
If the timeline specified for the report needs to exclude the data collected during the Weekends, then set
Exclude weekends to Yes. If not, select No.
You can configure the days of the week that need to be considered as a ‘weekend’ using the
CONSOLIDATED REPORTS page in the eG administrative interface; to access this page, follow
the menu sequence: Settings -> Reporter -> Consolidated Reports. For more details
regarding this page, refer to Section 3.4 of this manual.
8.
In large environments, reports generated using months of data can take a long time to complete.
Administrators now have the option of generating reports on-line or in the background. When a report is
scheduled for background generation, administrators can proceed with their other monitoring, diagnosis, and
reporting tasks, while the eG manager is processing the report. This saves the administrator valuable time. To
schedule background processing of a report, select the Background Save - PDF option from the Report
Generation list. In this case, a Report Name text box will appear, where you would have to provide the name
with which the report is to be saved in the background. To process reports in the foreground, select the
Foreground Generation - HTML option from this list.
The Report Generation list will appear only if the EnableBackgroundReport flag in
the [BACKGROUND_PROCESS] section of the eg_report.ini file (in the
{EG_INSTALL_DIR}\manager\config directory) is set to Yes.
The default selection in the Report Generation list will change according to the
Timeline specified for the report. If the Timeline set is greater than or equal to the
number of days specified against the MinDurationForReport parameter in the
[BACKGROUND_PROCESS] section of the eg_report.ini file, then the default selection
in the Report Generation list will be Background. On the other hand, if the Timeline
set for the report is lesser than the value of the MinDurationForReport parameter,
then the default selection in the Report Generation list will be Foreground. This is
because, the MinDurationForReport setting governs when reports are to be
processed in the background. By default, this parameter is set to 2 weeks - this
indicates that by default, reports with a timeline of 2 weeks and above will be
processed in the background.
152
Consolidated Reports
9.
Finally, click the Run Report button to generate the report. If the option chosen from the Report Generation list
is Foreground Generation - HTML, then, clicking on the Run Report button will invoke Figure 6.3.
10.
Figure 6.3 provides user-configured details about the chosen server.
Figure 6.3: The Server Performance Report
11.
To view the graph (see Figure 6.4) pertaining to a configured measure, click on the corresponding
Figure 6.3.
153
icon in
Consolidated Reports
Figure 6.4: Graph of a measure in the Server report
12.
On the other hand, if the Background Save - PDF option is chosen from the Report Generation list, then clicking
on the RUN REPORT BUTTON will not generate the report and display it in this page for your benefit. Instead, a
message indicating that the report is being processed in the background will appear. This will be accompanied
by a link that will lead you to the page that lists all the reports that are being processed in the background, and
their current status. If background report generation fails for a report, you can regenerate that report using this
page, or can even delete that report if need be. On the other hand, if background processing successfully
completes for your report, then, you can view a PDF of the report by clicking on the PDF icon in that page.
13.
If the Server chosen from Figure 6.3 is a virtual component such as a VMware ESX server, a Citrix XenServer,
etc., then an additional Show virtual machine flag will appear as depicted by Figure 6.5.
Figure 6.5: An additional 'Show virtual machine' flag appearing if the 'Server' chosen is a virtualized component
14.
By default, the Show virtual machines flag is set to No, indicating that the resulting report reveals how the
chosen virtual Server utilizes the resources available to it. If you want the server report to reveal the details of a
particular VM on the chosen virtual Server, then set the Show virtual machines flag to Yes, and then select a VM
from the Virtual Machine list that then appears. The resulting Server report will then reveal details pertaining to
the resource usage by the chosen Virtual Machine and not the selected Server.
154
Consolidated Reports
Figure 6.6: A Server Performance report for a virtual machine
15.
The information that appears in the server report is configurable. To configure the details, you will have to
access the consolidated measures page in the eG administrative interface. To access this page, do the
following:
Select the Consolidated Reports option from the Reporter option of the Settings tile in the eG
administrative interface.
In the CONSOLIDATED REPORTS page that appears, click on the Configure metrics for specific component
type button.
The CONSOLIDATED MEASURES page then appears. To know how to configure measures for a Server
Performance report using this page, refer to Section 3.4 of this manual.
6.2 Zone Performance Report
In order to simplify the management of large environments, eG Enterprise allows Zone definitions, where every Zone
can typically comprise of individual components, segments, services, or even other zones. In large zones that consist
of tens of thousands of servers, it is very difficult for administrators to focus on the performance of individual servers
- a zone-wide overview of performance is hence desired. Therefore, to enable administrators to evaluate the
performance of specific component-types that constitute the zone, the suite provides Zone Performance Reports. This
report, by default, reveals the average performance of the component-type as a whole (e.g., all Oracle databases),
and also the average performance of the individual components of the chosen type. Besides indicating the health of
the component-type, this report enables administrators to instantly identify the component(s) that serves as the rootcause of the problems (if any) with the type. Moreover, the metrics to be displayed in the report and the functions to
be executed on them, are configurable. Administrators thus have the flexibility to configure the critical performance
areas alone for monitoring.
To generate a Zone Performance Report, do the following:
1.
Select the Zone Performance option from the Consolidated Analysis node of the REPORTS BY FUNCTION tree.
2.
Figure 6.7 will then appear. To monitor a particular type of component that belongs to a zone, select the Zone
to which the components of that type have been added.
155
Consolidated Reports
Figure 6.7: Generating a Consolidated Zone Report
If no zones pre-exist, then you can use the Default zone that is automatically created by eG
Enterprise. This zone includes all the independent components in the environment.
3.
All the component-types that have been added to the chosen zone will then be listed in the Component Type
list. For a report on a particular component-type, select the type from the list. To generate a report for all
component-types, pick the All option.
4.
Next, choose a Report Type (Graph or Data). The default Report Type is Graph. To closely observe and clearly
understand the behavior of a single performance parameter across a component-type, you can plot a single
measure's data alone in a Graph report.
5.
If the Report Type is Graph, a Measure list box will appear, containing the complete list of measures that you
have configured for the report. From this list, pick the Measure for which a graph is to be generated (see
Figure 6.7).
6.
Then, select the period (Timeline) for which the graph is to be generated. You can either provide a fixed time
line such as 1 hour, 2 days, etc., or select the Any option from the list to provide a From and To date/time for
report generation.
156
Consolidated Reports
For every user registered with the eG Enterprise system, the administrator can indicate the
maximum timeline for which that user can generate a report. Once the maximum timeline is
set for a user, then, whenever that user logs into eG Reporter and attempts to generate a
report, the Timeline list box in the report page will display options according to the maximum
timeline setting of that user. For instance, if a user can generate a report for a maximum
period of 3 days only, then 3 days will be the highest option displayed in the Timeline list i.e., 3 days will be the last option in the fixed Timeline list. Similarly, if the user chooses the
Any option from the Timeline list and proceeds to provide a start date and end date for
report generation using the From and To specifications, eG Enterprise will first check if the
user's Timeline specification conforms to his/her maximum timeline setting. If not, report
generation will fail. For instance, for a user who is allowed to generate reports spanning over
a maximum period of 3 days only, the difference between the From and To dates should
never be over 3 days. If it is, then, upon clicking the Run Report button a message box will
appear, prompting the user to change the From and To specification.
7.
In addition to the settings discussed above, this report comes with a set of default specifications. These settings
are hidden by default. If you do not want to disturb these default settings, then you can proceed to generate
the report by clicking the Run Report button soon after you pick a Measure (in case of a Graph report).
However, if you want to view and then alter these settings (if required), click on the
button. The default
settings will then appear in the MORE OPTIONS drop down window (see Figure 6.8). The steps below discuss
each of these settings and how they can be customized.
Figure 6.8: The default settings for generating the Zone Performance report
8.
The speed with which a report is generated depends primarily on the report Timeline. While a Timeline that
varies between a couple of days to a week enables the eG Enterprise system to quickly retrieve the required
data, timelines that span multiple weeks/months could slow-down the data retrieval and report generation
process to a considerable extent, owing to the volume of data involved. In order to ensure quick and easy
access to reports, eG Enterprise provides you the option of enabling data retrieval from the Trend information
in the database, instead of the Detailed test information that is used by default for report generation. The
Detailed test information base comprises of multiple measurement records for a test - one or more each for
every test execution. Whereas, the Trend information includes only hourly, daily, and monthly summary
computations for a test performed on a continuous basis. For instance, during a period of 1 hour, a test that
runs every 5 minutes inserts atleast 12 records into the Detailed test information base. On the other hand, the
Trend information base would consist of only 1 record for the same 1 hour period. Fewer the number of
157
Consolidated Reports
records, query execution becomes much quicker, and data retrieval faster. To use the trend data for report
generation, you will have to select the Trend option from the Show Data field in Figure 6.8. By default, the
Detailed option is selected in Figure 6.8 indicating that the report data is retrieved from the detailed test
information in the database. If need be, you can also ensure that all reports always use the Detailed test tables
alone by hiding the Show Data field from the reporter interface. To achieve this, do the following:
9.
Login to the eG administrative interface as 'admin'.
Select the Manager option from the Settings tile that appears when the
clicked.
From the GENERAL SETTINGS page that then appears, if you set the Compute average/sum of metrics
while trending flag to No, then the Show Data field will not appear in the reporter interface; this denies
users access to the Trend option, and thus ensures that reports are always generated using the Detailed
tables.
button against the Admin tab is
A Trend report will not include the data for the current day since trend data is only
computed at the end of the day.
If the Trend option is chosen, the time period of the report should be greater than
1 day.
The usage of Detailed test tables for generating reports, especially those that span
weeks, increases the stress on the eG database, thus resulting in undue delays in
report generation. In order to ensure that the database is not choked by such
voluminous data requests, you can configure eG Enterprise to automatically "force"
the use of the Trend option if the Timeline of a report exceeds a pre-configured
duration. To specify this time boundary, do the following:
o
Edit the eg_report.ini file in the <EG_INSTALL_DIR>\manager\config directory.
o
In the [MISC] section of the file, you will find a DetailedTime parameter.
o
Specify the duration (in days) beyond which Detailed reports cannot be generated,
against the DetailedTime parameter, and save the eg_report.ini file.
o
For instance, to make sure that Detailed reports are disallowed for a Timeline of
over 2 weeks, set the DetailedTime parameter to 14 and save the file.
o
Say, subsequently, you attempt to generate a Detailed report for a Fixed Timeline
of 3 weeks (which is greater than the 14-day limit set in our example). The instant
you select the 3 weeks option from the Fixed list box, the Detailed option gets
automatically disabled, and the Trend option gets enabled. Similarly, if you specify
an Any Timeline that runs over 14 days, then, upon clicking the Run Report button
to generate the report, a message box appears (see Figure 5.8) informing you that
only the Trend option is permitted.
o
To proceed with the Trend report generation, click the OK button in the message
box. To terminate Trend report generation, click the CANCEL button.
Next, specify the start time and end time for report generation against the Time period field.
158
Consolidated Reports
For every user registered with the eG Enterprise system, the administrator can indicate the
maximum timeline for which that user can generate a report. Once the maximum timeline is
set for a user, then, whenever that user logs into eG Reporter and attempts to generate a
report, the Timeline list box in the report page will display options according to the maximum
timeline setting of that user. For instance, if a user can generate a report for a maximum
period of 3 days only, then 3 days will be the highest option displayed in the Timeline list i.e., 3 days will be the last option in the fixed Timeline list. Similarly, if the user chooses the
Any option from the Timeline list and proceeds to provide a start date and end date for
report generation using the From and To specifications, eG Enterprise will first check if the
user's Timeline specification conforms to his/her maximum timeline setting. If not, report
generation will fail. For instance, for a user who is allowed to generate reports spanning over
a maximum period of 3 days only, the difference between the From and To dates should
never be over 3 days. If it is, then, upon clicking the Run Report button a message box will
appear, prompting the user to change the From and To specification.
The default Time period to be displayed here can be configured using the CONSOLIDATED
REPORTS page in the eG administrative interface; to access this page, follow the menu
sequence: Settings -> Reporter -> Consolidated Reports. For more details regarding this
page, refer to Section 3.4 of this manual.
10.
If the timeline specified for the report needs to exclude the data collected during the Weekends, then set
Exclude weekends to Yes. If not, select No.
You can configure the days of the week that need to be considered as a ‘weekend’ using the
CONSOLIDATED REPORTS page in the eG administrative interface; to access this page, follow
the menu sequence: Settings -> Reporter -> Consolidated Reports. For more details
regarding this page, refer to Section 3.4 of this manual.
11.
Besides a pie chart, the report of type Graph will also invoke a comparative bar graph. This bar graph will, by
default, reveal the top - 10 components (of a particular type or across all types) in the selected Zone in terms of
the Measure chosen. This is why, the Show list is set to Top-10 by default. You can however view any number
of top/bottom players in a particular performance area by picking any TOP or LAST option from the Show list.
159
Consolidated Reports
By default, the values displayed in the Show list range from TOP-10 to LAST-10. This is
because, the Showtop parameter in the [INFOS] section of the eg_report.ini file (in the
<EG_INSTALL_DIR>\manager\config directory) is set to 10, by default. You can, if required,
configure the Show list to display a different range of options. For this, specify a different
number against the Showtop parameter, and save the eg_report.ini file.
12.
In large environments, reports generated using months of data can take a long time to complete.
Administrators now have the option of generating reports on-line or in the background. When a report is
scheduled for background generation, administrators can proceed with their other monitoring, diagnosis, and
reporting tasks, while the eG manager is processing the report. This saves the administrator valuable time. To
schedule background processing of a report, select the Background Save - PDF option from the Report
Generation list. In this case, a Report Name text box will appear, where you would have to provide the name
with which the report is to be saved in the background. To process reports in the foreground, select the
Foreground Generation - HTML option from this list.
The Report Generation list will appear only if the EnableBackgroundReport flag in
the [BACKGROUND_PROCESS] section of the eg_report.ini file (in the
{EG_INSTALL_DIR}\manager\config directory) is set to Yes.
The default selection in the Report Generation list will change according to the
Timeline specified for the report. If the Timeline set is greater than or equal to the
number of days specified against the MinDurationForReport parameter in the
[BACKGROUND_PROCESS] section of the eg_report.ini file, then the default selection
in the Report Generation list will be Background. On the other hand, if the Timeline
set for the report is lesser than the value of the MinDurationForReport parameter,
then the default selection in the Report Generation list will be Foreground. This is
because, the MinDurationForReport setting governs when reports are to be
processed in the background. By default, this parameter is set to 2 weeks - this
indicates that by default, reports with a timeline of 2 weeks and above will be
processed in the background.
13.
Finally, click on the RUN REPORT BUTTON to generate the report.
14.
If the Report Type is Graph and the option chosen from the Report Generation list is Foreground Generation HTML, then, clicking on the Run Report button will invoke Figure 6.9, which will reveal the following:
A distribution pie chart that reveals the number of components in different distribution ranges (see Figure
6.9). The distribution ranges are obtained based on the first of the configured functions for the chosen
Measure. For instance, assume that CPU utilization is the chosen Measure. Say that you have configured
to display the Avg and Max of CPU utilization in the zone performance report. Typically, both these
configured values will appear only in a Data report. In the case of a Graph report however, the first of the
two functions - i.e., Avg of CPU utilization - alone is calculated for every component of the chosen
component-type. The resulting pie chart enables administrators to deduce at a single glance, the number
of components in which CPU utilization has been highest. Clicking on a particular slice in the pie chart lists
160
Consolidated Reports
the components that fall within the value range represented by that slice (see Figure 6.10). Against every
component name, the actual values for each of the configured functions (both Avg and Max, in our
example), and also the Health % of each of the components will be displayed. A zone-level Summary of
the chosen Measure and the Normal % will also be available.
Figure 6.9: A graphical Zone Performance report
161
Consolidated Reports
By default, the chart type for distribution is a pie chart. However, you can have a bar
graph depict the same data instead of a pie chart, by following the steps given below:
Edit the eg_report.ini file in the <EG_INSTALL_DIR>\manager\config directory.
o
Change the value of the chartTypeForDist parameter in the [ZONE_REPORT]
section of this file from the default Pie, to Bar.
Save the eg_report.ini file.
By default, the number of value ranges that need to be configured for the distribution
chart is 10. To override this default setting, do the following:
Edit the eg_report.ini file in the <EG_INSTALL_DIR>\manager\config directory.
Specify a number of your choice against the nofRangeForDist parameter in the
[ZONE_REPORT] section of this file. By default, this parameter will hold the value 10.
Save the eg_report.ini file.
162
Consolidated Reports
Figure 6.10: A list of components with CPU utilization in a given range
Below the pie chart, you will find a bar chart that indicates the components that have topped/failed in a
selected performance realm (i.e., the Measure) during the specified Timeline. For example, for the CPU
utilization measure, this bar chart reveals the components that are the top CPU-consumers. Like the pie
chart, the values for the bar chart are also calculated by applying the first of the configured functions on
the chosen Measure. Clicking on the bar corresponding to a server name results in a Server Report (see
Figure 6.11) that enables you to focus on the performance of that server.
163
Consolidated Reports
Figure 6.11: The server report that appears upon clicking on a bar chart
The number of components to be displayed in the Top <N> Components bar chart
is configurable. To specify the number, do the following:
o
Edit the eg_report.ini file in the <EG_INSTALL_DIR>\manager\config directory.
o
Specify a number of your choice against the NoOfServersforChart parameter in
the [ZONE_REPORT] section of the file. By default, the value displayed here is
10, indicating that, by default, the bar chart will be for the Top 10
Components. For example, if you change this value to 5, then a bar chart
displaying the Top 5 Components will appear.
o
Finally, save the eg_report.ini file.
164
Consolidated Reports
You can configure the colors to be used in the distribution chart and the Top <N>
Components bar chart in the zone report, by editing the eg_report.ini file in the
<EG_INSTALL_DIR>\manager\config directory. The [ZONE_REPORT] section of the file
defines the 20 default colors of the distribution and bar charts:
[ZONE_REPORT]
ChartColor=#8399b0,#ffd95a,#a4ac91,#98d980,#d5b996,#f48848,#8b8cc2,
#eb4052,#c4b3d0,#b18651,#ebb7ce,#028768,#f5c372,#887c65,#e4c536,
#b5582c,#f94989,#770d72,#97a067,#89aeb7
distColor=#115fa6,#f25454,#60bd68,#b276b2,#81bef7,#a61120,#ffd13e,
#770d72,#887c65,#a4ac91
You can override the default color settings of the distribution chart by modifying the colorcodes specifying against distColor. For changing the colors used by the Top <N> Components
chart, alter the codes listed against the ChartColor parameter.
15.
Unlike a Graph report, a Data report does not graphically represent the measure data. Instead, the configured
details are presented in a tabular format in the report.
16.
If the Report Type chosen is Data and the option chosen from the Report Generation list is Foreground
Generation - HTML, then, clicking on the Run Report button will invoke two tables providing the user- configured
details (see Figure 6.12) for the chosen component-type. By default, the Summary section of the report will
display the average values of each of the configured measures across the farm. In the section providing perserver information though, eG Enterprise will display multiple values for a measure depending upon the number
and type of functions that have been configured for the measure. For example, in Figure 6.12, note that the
second section displays both the Avg and Max values for the Cpu util measure, but only the Avg value for the
Disk busy measure.
Figure 6.12: The Zone Data Report
17.
Besides the above-mentioned details, the Data report also contains a Health % column (see Figure 6.12). This
165
Consolidated Reports
column indicates the percentage of time a particular server has been in the Normal state during the chosen
timeline. If a server has remained the constant victim of problems during the specified time period, then this
percentage will obviously be low. To drill down to the root-cause of the issues affecting the server, click on the
corresponding Health % value. This will lead you to the Executive report of the problem server, which will reveal
when and what type of problems were encountered by the server (see Figure 6.13).
Figure 6.13: The Executive report of the problem server in the zone performance report
18.
Also, to focus on the health of a particular server displayed in the Data report, click on the corresponding Server
name in Figure 6.12. The Server Report will then appear (see Figure 6.14).
Figure 6.14: The server report that appears when a server in the Consolidated Zone Data Report is clicked
19.
As stated earlier, you can configure the information that needs to appear in the zone report. To achieve this,
166
Consolidated Reports
you will have to access the consolidated measures page in the eG administrative interface. To access this page,
do the following:
Select the Consolidated Reports option from the Reporter option of the Settings tile in the eG
administrative interface.
In the CONSOLIDATED REPORTS page that appears, click on the Configure metrics for specific component
type button.
The CONSOLIDATED MEASURES page then appears. To know how to configure measures for a Server
Performance report using this page, refer to Section 3.4 of this manual.
6.3 Services Report
A zone report provides a quick overview of the performance of all the components in a specific geography, domain,
or server group. While this report is ideal for administrators and operations staff who are responsible for the zone,
there may be other administrators who are only interested in the performance of specific business services. These
administrators need reports that are specific to the business services that they are responsible for, and the
components involved in supporting these services. Services Reports included in the eG Reporter address this need.
There are three sets of reports in the eG Service report category. Let us now discuss each of the reports in detail in
the forthcoming sections.
6.3.1
Services Health Report
Irrespective of whether a service is a web site or not, a user may want to view the resource usage (e.g., CPU,
memory, disk utilization) and other key metrics about all the servers that support a specific service. The Services
Health report addresses this requirement. From this report, a user only sees all the components that are specific to a
chosen service, and can review performance metrics across all these components to identify any bottlenecks in the
infrastructure.
Figure 6.15 shows a Services Health report.
Assume a case, where the users accessing a specific service experience slow responsiveness and increase in number
of failed web transactions. In order to find out how well the service is performing, you need to have the reports that
will highlight the resource utilization and other key metrics about the servers that support this service.
In order to generate this report, do the following:
1.
Select the Services Health option from the Consolidated Analysis node of the REPORTS BY FUNCTION tree.
Figure 6.15: Generating the Services Health report
2.
Select the Service for which the report is to be generated from Figure 6.15.
3.
Upon selecting the Service to be monitored, select the Component Type. All the component types associated
with the selected service will be made available for you to choose from. For our example, we will select the IIS
web server component-type in the service and review its performance across the service.
167
Consolidated Reports
4.
Next, indicate whether the report should Show Transactions or not. The Show Transactions flag appears only if
the Service chosen is a web site service. If the Show Transactions flag is switched on, then the resulting
Services Health report will also provide insights into the performance of the transactions to the selected web
site. On the other hand, switching off the Show Transactions flag will result in a report that provides useful
information on general web site and web server performance, and no information that is transaction-specific.
5.
Specify a Timeline for the report.
For every user registered with the eG Enterprise system, the administrator can indicate the
maximum timeline for which that user can generate a report. Once the maximum timeline is
set for a user, then, whenever that user logs into eG Reporter and attempts to generate a
report, the Timeline list box in the report page will display options according to the maximum
timeline setting of that user. For instance, if a user can generate a report for a maximum
period of 3 days only, then 3 days will be the highest option displayed in the Timeline list i.e., 3 days will be the last option in the fixed Timeline list. Similarly, if the user chooses the
Any option from the Timeline list and proceeds to provide a start date and end date for
report generation using the From and To specifications, eG Enterprise will first check if the
user's Timeline specification conforms to his/her maximum timeline setting. If not, report
generation will fail. For instance, for a user who is allowed to generate reports spanning over
a maximum period of 3 days only, the difference between the From and To dates should
never be over 3 days. If it is, then, upon clicking the Run Report button a message box will
appear, prompting the user to change the From and To specification.
6.
In addition to the settings discussed above, this report comes with a set of default specifications. These settings
are hidden by default. If you do not want to disturb these default settings, then you can proceed to generate
the report by clicking the Run Report button soon after you pick a Component Type. However, if you want to
view and then alter these settings (if required), click on the
button. The default settings will then appear in
the MORE OPTIONS drop down window (see Figure 6.16). The steps below discuss each of these settings and
how they can be customized.
Figure 6.16: The default settings for generating the Services health report
7.
Specify the start time and end time for report generation against the Time period field (see Figure 6.16).
168
Consolidated Reports
8.
If the timeline specified for the report needs to exclude the data collected during the Weekends, then set
Exclude weekends to Yes. If not, select No.
The Weekend settings for a Consolidated Zone report will apply to this report too.
9.
In large environments, reports generated using months of data can take a long time to complete.
Administrators now have the option of generating reports on-line or in the background. When a report is
scheduled for background generation, administrators can proceed with their other monitoring, diagnosis, and
reporting tasks, while the eG manager is processing the report. This saves the administrator valuable time. To
schedule background processing of a report, select the Background Save - PDF option from the Report
Generation list. In this case, a Report Name text box will appear, where you would have to provide the name
with which the report is to be saved in the background. To process reports in the foreground, select the
Foreground Generation - HTML option from this list.
The Report Generation list will appear only if the EnableBackgroundReport flag in
the [BACKGROUND_PROCESS] section of the eg_report.ini file (in the
{EG_INSTALL_DIR}\manager\config directory) is set to Yes.
The default selection in the Report Generation list will change according to the
Timeline specified for the report. If the Timeline set is greater than or equal to the
number of days specified against the MinDurationForReport parameter in the
[BACKGROUND_PROCESS] section of the eg_report.ini file, then the default selection
in the Report Generation list will be Background. On the other hand, if the Timeline
set for the report is lesser than the value of the MinDurationForReport parameter,
then the default selection in the Report Generation list will be Foreground. This is
because, the MinDurationForReport setting governs when reports are to be
processed in the background. By default, this parameter is set to 2 weeks - this
indicates that by default, reports with a timeline of 2 weeks and above will be
processed in the background.
10.
Finally, click the Run Report button to generate the report.
11.
Figure 6.17 depicts the Services Health report for the IIS web servers involved in the delivery of a web site
service. Since the Show Transactions flag has been enabled in our example, you can see that a site-level and
individual web server-level summary on transaction health is included in the report. By default, all transactionrelated metrics such as Request_rate, Pct_errors, Pct_aborts, etc., appear in these sections. Below the
transaction-centric sections, you will find two more sections, the first of which summarizes the overall health of
the chosen Component Type, and the second providing valuable information on the performance of each
component of that type. In our example, we have shown the overall Health% of an Active Directory Server,
which stands at 100%.
169
Consolidated Reports
Figure 6.17: The Service Health report with 'Show Transactions' on
170
Consolidated Reports
As stated earlier, by default, all transaction-related metrics find a place in the transactionspecific sections of Figure 6.17. As for the remaining sections, the following measure
configurations apply:
Default measure configurations for the Consolidated Zone Report
Configurations specific to the chosen Component Type for the Consolidated Zone
Report
A default set of measures pre-configured for the Services report in the
[SERVICES_REPORT]
section
of
the
eg_report.ini
file
(in
the
<EG_INSTALL_DIR>\manager\config directory); these default measures are Request
rate, Pct errors, Data transmission rate, and Data received rate. You can, if you so
desire, add more default measures to the [SERVICES_REPORT] section in the format:
Default:<InternalTest>:<InternalMeasure>#<DisplayName>=<Comma-separated
list of functions>. To determine the internal test and measure names, use the
procedure explained in Page 212 of this manual.
For instance, if you want the report to display the number of current requests handled
by a web site, then your specification would be:
Default:WebSiteTest:Num_current_requests#Num_current_requests (Num)=Avg,Max
12.
Similarly, you can also remove one/more default measures or modify them.
If the Show Transactions flag had been disabled, then the web transaction related measures will not be
available in the report (see Figure 6.18).
Figure 6.18: The ServicesHealth report without the Show Transactions flag
13.
In order to zoom into the performance of a particular component of the chosen type, click on the Server link in
171
Consolidated Reports
the second section of Figure 6.17. A Server Report shedding light on the performance of the Apache web server
in our example then appears (see Figure 6.19).
Figure 6.19: The individual component’s performance for the IIS webserver
14.
To look into the anomalies that have affected the service, click on Health% link to display the Executive Report.
This report reveals when and what types of problems were impacting the service performance during the
specified Timeline (see Figure 6.20).
172
Consolidated Reports
Figure 6.20: Shows the event analysis for the IIS web server
15.
On the other hand, if the Background Save - PDF option is chosen from the Report Generation list, then clicking
on the Run Report button will not generate the report and display it in this page for your benefit. Instead, a
message indicating that the report is being processed in the background will appear. This will be accompanied
by a link that will lead you to the page that lists all the reports that are being processed in the background, and
their current status. If background report generation fails for a report, you can regenerate that report using this
page, or can even delete that report if need be. On the other hand, if background processing successfully
completes for your report, then, you can view a PDF of the report by clicking on the PDF icon in that page.
6.3.2
Web Transaction Analysis Report
The Web Transaction Analysis report is specific to web sites. This report provides a summary of the performance of
key web transaction metrics reported by eG agents for each web site. A web site may include multiple web servers,
with load balancing being used to distribute the requests across the web servers. For a specific time period (say 2
weeks), a user can use the Web Transaction Analysis report to view web transaction metrics across each of the web
servers used for a web site. Using this report, a user can determine the following:
Is the transaction load being balanced across all the web servers supporting the web site?
Are any unusual error patterns seen on specific web servers (e.g., because some content is not available
on one of the servers)?
Is there any unusual slowness observed on specific web servers?
Figure 6.21 shows a WebTransactions Analysis report for a web site.
In order to generate this report, do the following:
1.
Select the Web Transaction Analysis option from the Consolidated Analysis node of the REPORTS BY
FUNCTION tree.
173
Consolidated Reports
Figure 6.21: Generating the Web transaction Analysis report
2.
Select the Site for which the report is to be generated from Figure 6.21.
3.
Specify a Timeline for the report.
For every user registered with the eG Enterprise system, the administrator can indicate the
maximum timeline for which that user can generate a report. Once the maximum timeline is
set for a user, then, whenever that user logs into eG Reporter and attempts to generate a
report, the Timeline list box in the report page will display options according to the maximum
timeline setting of that user. For instance, if a user can generate a report for a maximum
period of 3 days only, then 3 days will be the highest option displayed in the Timeline list i.e., 3 days will be the last option in the fixed Timeline list. Similarly, if the user chooses the
Any option from the Timeline list and proceeds to provide a start date and end date for
report generation using the From and To specifications, eG Enterprise will first check if the
user's Timeline specification conforms to his/her maximum timeline setting. If not, report
generation will fail. For instance, for a user who is allowed to generate reports spanning over
a maximum period of 3 days only, the difference between the From and To dates should
never be over 3 days. If it is, then, upon clicking the Run Report button a message box will
appear, prompting the user to change the From and To specification.
4.
In addition to the settings discussed above, this report comes with a set of default specifications. These settings
are hidden by default. If you do not want to disturb these default settings, then you can proceed to generate
the report by clicking the Run Report button soon after you pick a Site. However, if you want to view and then
alter these settings (if required), click on the
button. The default settings will then appear in the MORE
OPTIONS drop down window (see Figure 6.22). The steps below discuss each of these settings and how they
can be customized.
Figure 6.22: The default settings for generating the Web Transaction Analysis report
174
Consolidated Reports
5.
Specify the start time and end time for report generation against the Time period field (see Figure 6.22).
6.
If the timeline specified for the report needs to exclude the data collected during the Weekends, then set
Exclude weekends to Yes. If not, select No.
The Weekend settings for a Zone Performance report will apply to this report too.
7.
In large environments, reports generated using months of data can take a long time to complete.
Administrators now have the option of generating reports on-line or in the background. When a report is
scheduled for background generation, administrators can proceed with their other monitoring, diagnosis, and
reporting tasks, while the eG manager is processing the report. This saves the administrator valuable time. To
schedule background processing of a report, select the Background Save - PDF option from the Report
Generation list. In this case, a Report Name text box will appear, where you would have to provide the name
with which the report is to be saved in the background. To process reports in the foreground, select the
Foreground Generation - HTML option from this list.
The Report Generation list will appear only if the EnableBackgroundReport flag in
the [BACKGROUND_PROCESS] section of the eg_report.ini file (in the
{EG_INSTALL_DIR}\manager\config directory) is set to Yes.
The default selection in the Report Generation list will change according to the
Timeline specified for the report. If the Timeline set is greater than or equal to the
number of days specified against the MinDurationForReport parameter in the
[BACKGROUND_PROCESS] section of the eg_report.ini file, then the default selection
in the Report Generation list will be Background. On the other hand, if the Timeline
set for the report is lesser than the value of the MinDurationForReport parameter,
then the default selection in the Report Generation list will be Foreground. This is
because, the MinDurationForReport setting governs when reports are to be
processed in the background. By default, this parameter is set to 2 weeks - this
indicates that by default, reports with a timeline of 2 weeks and above will be
processed in the background.
8.
Finally, click the Run Report button to generate the report.
9.
Figure 6.23 reveals the transaction-related metrics for the chosen Website.
175
Consolidated Reports
Figure 6.23: The performance of the website hosted by a Web server
All the metrics displayed in a WebTransaction Analysis report are pre-configured, and cannot
be altered.
10.
On the other hand, if the Background Save - PDF option is chosen from the Report Generation list, then clicking
on the Run Report button will not generate the report and display it in this page for your benefit. Instead, a
message indicating that the report is being processed in the background will appear. This will be accompanied
by a link that will lead you to the page that lists all the reports that are being processed in the background, and
their current status. If background report generation fails for a report, you can regenerate that report using this
page, or can even delete that report if need be. On the other hand, if background processing successfully
completes for your report, then, you can view a PDF of the report by clicking on the
6.3.3
icon in that page.
IIS Transaction Analysis Report
Whenever users to your mission-critical web sites (on an IIS web server) or web services (overlying an IIS web
server) complaint of slowdowns, the first step to troubleshooting these issues is identifying which specific
transaction(s) to the web sites is causing the slowdown. For this, you will have to periodically monitor the
responsiveness of key transactions to your web sites, so as to quickly and accurately identify slow transactions. Also,
by keenly observing the variations in the responsiveness of transactions over time, you can ascertain how often a
transaction experienced slowdowns in a given timeline, determine whether that transaction is prone to delays, and
investigate the root-cause of the same. To provide you with such in-depth historical insights into a transaction's
performance, eG Enterprise offers the IIS Transaction Analysis report. To generate this report, do the following:
176
Consolidated Reports
1.
Select the IIS Transaction Analysis option from the Consolidated Reports node of the REPORTS BY FUNCTION
tree.
2.
Figure 6.24 will appear.
Pick an IIS web server for which the report is to be generated from the Component list. In large environments,
where a multitude of components are being monitored, many IIS web servers may be listed in the Component list
box. Selecting a specific server from this 'bottom-less' list may take forever! You can hence filter your component list,
so that you have a smaller set of components to choose from. For this, you can optionally pick a Service. This
ensures that the Component list is populated with only those IIS web servers that are engaged in the delivery of a
web site service. Pick the Component of interest to you from this list. If still the Component list consists of too many
components, then viewing all the components and selecting the ones you need for report generation could require
endless scrolling. To avoid this, you can click the
button next to the Component list. The COMPONENTS pop up
window will then appear using which you can view almost all the components in a single interface and select the
ones for which the report is to be generated.
Figure 6.24: Consolidated Reports- IIS Transaction Analysis
3.
Selecting a Component will populate the Transaction list with all those transactions that have been configured
for the IIS Web Transactions test of that component. Pick the transaction(s) to be analyzed from this list.
4.
Then, choose a Category. You can either view a summary report or a detailed report by selecting an option
from the Category drop-down list. To view a summary report, select the Summary option from the Category list
and to view a detailed report, select the Details option. If you wish to view both the types of report at a single
shot for the selected transactions, then select the Summary & Details option from the Category drop-down list.
5.
Specify a Timeline for the report.
177
Consolidated Reports
For every user registered with the eG Enterprise system, the administrator can indicate the
maximum timeline for which that user can generate a report. Once the maximum timeline is
set for a user, then, whenever that user logs into eG Reporter and attempts to generate a
report, the Timeline list box in the report page will display options according to the maximum
timeline setting of that user. For instance, if a user can generate a report for a maximum
period of 3 days only, then 3 days will be the highest option displayed in the Timeline list i.e., 3 days will be the last option in the fixed Timeline list. Similarly, if the user chooses the
Any option from the Timeline list and proceeds to provide a start date and end date for
report generation using the From and To specifications, eG Enterprise will first check if the
user's Timeline specification conforms to his/her maximum timeline setting. If not, report
generation will fail. For instance, for a user who is allowed to generate reports spanning over
a maximum period of 3 days only, the difference between the From and To dates should
never be over 3 days. If it is, then, upon clicking the Run Report button a message box will
appear, prompting the user to change the From and To specification.
6.
In addition to the settings discussed above, this report comes with a set of default specifications. These settings
are hidden by default. If you do not want to disturb these default settings, then you can proceed to generate
the report by clicking the Run Report button soon after you pick a Category. However, if you want to view and
then alter these settings (if required), click on the
button. The default settings will then appear in the MORE
OPTIONS drop down window (see Figure 6.25). The steps below discuss each of these settings and how they
can be customized.
Figure 6.25: The default settings for generating the IIS Transaction Analysis report
7.
Next, specify the start time and end time for report generation against the Time period field.
8.
If the timeline specified for the report needs to exclude the data collected during the Weekends, then set
Exclude weekends to Yes. If you wish to collect data during weekends too, select No.
178
Consolidated Reports
The Weekend settings for a Consolidated Zone report will apply to this report too.
9.
In large environments, reports generated using months of data can take a long time to complete.
Administrators now have the option of generating reports on-line or in the background. When a report is
scheduled for background generation, administrators can proceed with their other monitoring, diagnosis, and
reporting tasks, while the eG manager is processing the report. This saves the administrator valuable time. To
schedule background processing of a report, select the Background Save - PDF option from the Report
Generation list. In this case, a Report Name text box will appear where you would have to provide the name
with which the report has to be saved in the background. To process reports in the foreground, select the
Foreground Generation - HTML option from this list.
The Report Generation list will appear only if the EnableBackgroundReport flag in
the [BACKGROUND_PROCESS] section of the eg_report.ini file (in the
{EG_INSTALL_DIR}\manager\config directory) is set to Yes.
The default selection in the Report Generation list will change according to the
Timeline specified for the report. If the Timeline set is greater than or equal to the
number of days specified against the MinDurationForReport parameter in the
[BACKGROUND_PROCESS] section of the eg_report.ini file, then the default selection
in the Report Generation list will be Background. On the other hand, if the Timeline
set for the report is lesser than the value of the MinDurationForReport parameter,
then the default selection in the Report Generation list will be Foreground. This is
because, the MinDurationForReport setting governs when reports are to be
processed in the background. By default, this parameter is set to 2 weeks - this
indicates that by default, reports with a timeline of 2 weeks and above will be
processed in the background.
10.
Finally, click the Run Report button to generate the report.
11.
If the Category chosen is Summary, and if the Report Generation mode is set to Foreground Generation - HTML,
then, clicking on the Run Report button will invoke Figure 6.26.
Figure 6.26: IIS Transaction Analysis report when Summary option is chosen
179
Consolidated Reports
12.
Figure 6.26 shows the Transaction Summary of the chosen Component. For every Transaction selected, this
summary will indicate the following by default:
the total number of requests to the transaction that were processed during the given timeline ( Total
Transactions);
the number and percentage of transaction requests that resulted in a slow response (Slow Transactions);
the percentage of normal transactions (Normal Transactions);
the average response time of slow transactions (Average Response Time);
the number of requests to the transaction (Number of requests);
If you wish to view or configure additional metrics that are transaction centric, then you can
add those measures in the [IIS_TRANSACTION_ANALYSIS] section of the eg_report.ini file in
the <EG_INSTALL_DIR>\manager\config directory. These measures have to be included in the
format
Default:<InternalTest>:<InternalMeasure>#<DisplayName>=<Comma-separated
list of functions>. To determine the internal test and measure names, use the procedure
explained in Page 212 of this manual.
For instance, if you want the report to display the Data transmitted by each transaction, then
your specification would be:
Default:SlowTransTest:Data_transmitted#avgData=Avg,Min,Max
Similarly, you can also remove one/more default measures.
From this summary, you can quickly isolate the 'most popular' transactions in terms of the number of requests.
Additionally, you can determine how often the transactions have been responding slowly to user requests and
thus, easily identify the 'least responsive' (i.e., slow) transactions.
13.
If the Details option is chosen from the Category drop down list, and the option chosen from the Report
Generation list is Foreground Generation - HTML, then, clicking on the Run Report button will invoke Figure 6.27.
180
Consolidated Reports
Figure 6.27: IIS Transaction Analysis report when Details option is chosen
14.
Figure 6.27 shows the Transaction Details of the chosen transactions. While the Summary report enables you to
instantly isolate the 'slow transactions' to the web sites on the IIS web server, the Details report enables you to
accurately point to the specific transaction requests that evoked a slow response. For every transaction request,
the Transaction Details report tells you when the transaction was requested, the web site to which the
transaction is associated, the user who requested for the transaction, the IP address from which the request
was received, the responsiveness of the transaction, and the data that was transmitted.
15.
To have a quick glance at both the Summary and Details at one shot, select the Summary & Details option from
the Category drop-down list, and click Run Report. Figure 6.28 will then appear.
Figure 6.28: IIS Transaction Analysis report when Summary & Details option is chosen
16.
This way, the IIS Transaction Analysis report not only sheds light on slow transactions, but also provides you
with pointers to when the slowdown occurred and why.
17.
If the Background Save - PDF option is chosen from the Report Generation list, then clicking on the Run Report
button will not generate the report and display it in this page for your benefit. Instead, a message indicating
that the report is being processed in the background will appear. This will be accompanied by a link, that will
lead you to the page that lists all the reports that are being processed in the background, and their current
status. If background report generation fails for a report, you can regenerate that report using this page, or can
181
Consolidated Reports
even delete that report if need be. On the other hand, if background processing successfully completes for your
report, then, you can view a PDF of the report by clicking on the
icon in that page.
Before emailing reports, ensure that the SMTP mail host and eG Administrator ID
are properly configured in the eG administrative interface (using the Alerts -> Mail
Settings -> Server Settings option).
When reports are sent by email, the body of the email will contain the reports so
sent in HTML format. You can, if you so desire, send the report as an attachment
by setting the SendMailAsAttachment flag to Yes (or True). This flag is available in
the
[MISC_ARGS]
section
of
the
eg_services.ini
file
(in
the
{EG_INSTALL_DIR}\manager\config directory).
6.4 KPI Health Report
Analyzing a large infrastructure with hundreds of servers can take a lot of time and effort, and it also requires a great
deal of expertise. Administrators may often find it tedious to analyze what exactly went wrong in their infrastructure
and where does the bottlenect lie. In order to solve such an ordeal, eG Enterprise has introduced the KPI Health
report. This report, when generated helps the administrators analyze the performance of an IT infrastructure in a few
clicks and highlight bottleneck areas in the infrastructure.
To generate this report, do the following:
1.
From the Consolidated Analysis node of the REPORTS BY FUNCTION tree, select KPI Health.
2.
Figure 6.29 will then appear.
Figure 6.29: Generating the KPI Health report
3.
Select a criterion for analysis from the Analyze by list box. Using this report, you can analyze the performance
of one/more independent components, or those that are part of a segment, service, or a zone. This way, you
can assess the impact of the performance of the components on a particular service/segment/zone’s
performance, and accordingly take performance decisions. The options provided by the Analyze by list box are
discussed hereunder:
o
Component: Select this option to choose the component(s) from across all the managed components in the
environment. For instance, for a report on the health of all the managed vSphere/ESX hosts in the
environment, select VMware vSphere ESX from the Component Type list and select Component from the
182
Consolidated Reports
Analyze by list.
o
Service: Select this option if the components for which a report is to be generated are involved in the
delivery of a business service. Then, select a Service.
o
Segment: Choose this option if the components to be evaluated are part of a segment. Then, pick a
Segment for analysis.
o
Zone: Pick this option for a report on the performance of components that are included in a zone. Then,
choose a Zone.
4.
By default, the By Component Type option will be selected from the Show Health Summary list box. This implies
that the report is generated based on the health of all the components of a chosen Component Type. If the By
Component option is chosen from this list, then the report will be generated for each component of the chosen
Component Type.
5.
Next, from the Component Type list, select the virtual server type for which this report is to be generated. If
this list consists of too many Component Types, then viewing all the component types and selecting the ones
you need for report generation could require endless scrolling. To avoid this, you can click the
icon next to
the Component Type list. This will open the COMPONENT TYPE pop up window using which you can view
almost all the component types in a single interface and Select the ones for which the report is to be
generated. If there are still too many component types in the list to choose from, you can narrow your search
further by using the Search text box. Specify the whole/part of the component type to search for in this text
box, and click the icon next to it. The Component Type list will then be populated with all component types that
embed the specified search string. Select the component type of your choice from this list.
6.
Specify a Timeline for the report.
For every user registered with the eG Enterprise system, the administrator can indicate the
maximum timeline for which that user can generate a report. Once the maximum timeline is
set for a user, then, whenever that user logs into eG Reporter and attempts to generate a
report, the Timeline list box in the report page will display options according to the maximum
timeline setting of that user. For instance, if a user can generate a report for a maximum
period of 3 days only, then 3 days will be the highest option displayed in the Timeline list i.e., 3 days will be the last option in the fixed Timeline list. Similarly, if the user chooses the
Any option from the Timeline list and proceeds to provide a start date and end date for
report generation using the From and To specifications, eG Enterprise will first check if the
user's Timeline specification conforms to his/her maximum timeline setting. If not, report
generation will fail. For instance, for a user who is allowed to generate reports spanning over
a maximum period of 3 days only, the difference between the From and To dates should
never be over 3 days. If it is, then, upon clicking the Run Report button a message box will
appear, prompting the user to change the From and To specification.
7.
In addition to the settings discussed above, this report comes with a set of default specifications. These settings
are hidden by default. If you do not want to disturb these default settings, then you can proceed to generate
the report by clicking the Run Report button soon after you pick one/more Component Types for report
generation. However, if you want to view and then alter these settings (if required), click on the
icon. The
default settings will then appear in the MORE OPTIONS drop down window (see Figure 6.30). The steps below
discuss each of these settings and how they can be customized.
183
Consolidated Reports
Figure 6.30: The default settings for generating the KPI Health report
8.
If the timeline specified for the report needs to exclude the data collected during the Weekends, then set
Exclude weekends to Yes. If not, select No.
By default, the weekend constitutes Saturday and Sunday. To override this default setting,
do the following:
Edit the eg_report.ini file in the <EG_INSTALL_DIR>\manager\config directory.
In the [VIRTUAL_MEASURE_GROUP] section of the file, the EXCLUDE_WEEKEND
parameter is set to Saturday,Sunday by default. You can modify this by setting the
EXCLUDE_WEEKEND parameter to a comma-separated list of other days of the week
- say Friday,Saturday.
Save the file after making the required changes.
9.
Next, indicate the report Timeperiod.
10.
In large environments, reports generated using months of data can take a long time to complete.
Administrators now have the option of generating reports on-line or in the background. When a report is
scheduled for background generation, administrators can proceed with their other monitoring, diagnosis, and
reporting tasks, while the eG manager is processing the report. This saves the administrator valuable time. To
schedule background processing of a report, select the Background Save - PDF option from the Report
Generation list. In this case, a Report Name text box will appear, where you would have to provide the name
with which the report is to be saved in the background. To process reports in the foreground, select the
Foreground Generation - HTML option from this list.
184
Consolidated Reports
The Report Generation list will appear only if the EnableBackgroundReport flag in
the [BACKGROUND_PROCESS] section of the eg_report.ini file (in the
{EG_INSTALL_DIR}\manager\config directory) is set to Yes.
The default selection in the Report Generation list will change according to the
Timeline specified for the report. If the Timeline set is greater than or equal to the
number of days specified against the MinDurationForReport parameter in the
[BACKGROUND_PROCESS] section of the eg_report.ini file, then the default selection
in the Report Generation list will be Background. On the other hand, if the Timeline
set for the report is lesser than the value of the MinDurationForReport parameter,
then the default selection in the Report Generation list will be Foreground. This is
because, the MinDurationForReport setting governs when reports are to be
processed in the background. By default, this parameter is set to 2 weeks - this
indicates that by default, reports with a timeline of 2 weeks and above will be
processed in the background.
11.
Finally, click the Run Report button to generate the report.
12.
The KPI Health report will be generated as shown in Figure 6.31.
185
Consolidated Reports
Figure 6.31: The KPI Heath Report
13.
From the generated report, you can easily identify the health of the target infrastructure. The generated report
consists of the Server Type column and the Key Performance Indicators and their Health(%) column. The Key
Performance Indicators and their Health column is further divided in terms of the layers available for the chosen
Component Type. The health of each layer is represented using distinct colors and values as mentioned in the
tabe below:
186
Consolidated Reports
Color
Value
Health
Green
100
OK
Orange
less than 100 and greater
than 90
Caution
Red
less than 90
Needs attention
Administrators can do the following to reconfigure the values with the values of their
choice:
Edit the eg_report.ini file in the <EG_INSTALL_DIR>\manager\config directory.
In
the [INFRASTRUCTURE_HEALTH_REPORT] section of the file, the
UnhealthyBound1 parameter is set to 100 and the UnhealthyBound2 parameter is
set to 90 by default. You can modify this by setting the values of your choice for
these paramenters. If you set the UnhealthyBound1 to 90 and the
UnhealthyBound2 to 80, then the color Red will appear for a value less than 80 in
the generated report and the color Orange will appear for the value less than 90
and greater than 80 in the generated report.
14.
Save the file after making the required changes.
If the By Component option is chosen from the Show Health Summary, then an additional Component column
will appear. The report will be generated for each individual component of the chosen Component Type (see
Figure 6.32).
187
Consolidated Reports
Figure 6.32: The KPI Health Report when the ‘By Component’ option is chosen
15.
If the By Infrastructure Tier option is chosen from the Show Health Summary, then an additional Infrastructure
Tier column will appear in the report. This Infrastructure Tier column shows the category name of the
Component Types that possess similar functionalities i.e, the component types with similar functionalities will be
logically grouped under a common category name. For example, the Oracle Database and Microsoft SQL
Component Types will be grouped under the Database Servers (see Figure 6.33).
188
Consolidated Reports
Figure 6.33: The KPI Health report when the By Infrastructure Tier option is clicked
16.
Administrators can further drill down the report and figure out the exact bottleneck area in the infrastructure by
clicking each problematic layer of the chosen Component Type. In our example, let us click on the Virtual
Servers layer of the Citrix Netscaler ADC component (see Figure 6.29), a pop up window will appear as shown
in Figure 6.34 listing the problems that are currently affecting the health of the layer.
189
Consolidated Reports
Figure 6.34: The pop up window that lists the currently existing problems in the layer
17.
From Figure 6.34, you can easily identify that each problem encounterd by the layer has been dealt with a
graphical representation and the duration of the problem. You can also easily identify the Test and the Measure
that is causing the problem and the total time duration for which this measure has been problematic can be
identified using the Total Problem Duration field. Additionally, a graph represents the exact time duration for
which this measure has been problematic. The Recommendation section helps you in interpreting the problem
and provides suggestions to overcome the problem (in some cases).
18.
Clicking the View Problem History button of Figure 6.34 opens a PROBLEM HISTORY pop up window (see
Figure 6.35) which lists the time periods during which the health of the chosen components were affected.
190
Consolidated Reports
Figure 6.35: The Problem History pop up window
19.
If the detailed diagnosis for a chosen measure is collected by the eG egent, then clicking on the
Figure 6.34 will lead you to Figure 6.36 that shows the Detailed diagnosis of the measure.
icon of
Figure 6.36: The detailed diagnosis of the chosen measure
20.
To view the health of all the measures that are associated with the chosen component and Component Type,
click on the Associated Metrics and Their Health% link in Figure 6.34. This will lead you to Figure 6.37 where
you will be able to figure out the measures that have been problematic and affecting the overall health of the
chosen Component Type.
191
Consolidated Reports
Figure 6.37: The pop up window displaying the health of the metric associated with the chosen Component Type
192
Comparison Reports
Comparison Reports
Apart from individual measure and summary reports, the eG Reporter also offers Comparison Reports. Comparison
reports enable users to compare, correlate, and analyze across a wide variety of performance metrics generated by
the monitored environment, so as to facilitate quick and accurate root-cause identification.
eG offers three types of Comparison reports, namely, COMPONENTS, TESTS, and TOP-N.
7.1 Components Comparison Report
The Components comparison report allows administrators to compare statistics pertaining to selected components.
For example, consider an environment comprising of a Web server supported by an Oracle server, Ldap server, and a
Dns server (see Figure 7.1).
Active Directory
User
Web server
Microsoft SQL server
Figure 7.1: A sample environment
Say that the web server in Figure 7.1 hosts a web site that depends upon the Microsoft SQL server for storage and
recovery of critical data. The Microsoft SQL server uses the Active Directory server for authenticating user accesses.
Assume that the user accessing the web site (on the web server) begins to experience a marked deterioration in the
responsiveness of the site. An increase in the response time of a web site could be caused by either/all of the
following reasons:
A network delay between the web server and the user
A problem in the response time of one/all of the other servers (Microsoft SQL, Active Directory) that the
web server relies on.
A comparison report provides an easy way of comparing the response times of each application.
To generate a comparison report for the above-mentioned scenario, do the following:
1.
Select the Components option from the Comparison Reports node of the REPORTS BY FUNCTION tree.
193
Comparison Reports
Figure 7.2: Generating a Comparison report
2.
Figure 7.2 will then appear. Click on the Please define configuration to specify the criteria for generating the
comparison reports.
Figure 7.3: Defining the configuration for generating the Comparison report
3.
When Figure 7.3 appears, first, select a filter criterion from the Report for list box. Administrators of large IT
infrastructures, which are characterized by hundreds of components, may find it difficult to pick and choose the
components for which a report is to be generated; this is because, in such environments, the Component list in
this page will be populated with a large number of components, which would naturally make component
selection tough. To enable administrators of such environments to quickly locate the components of interest to
them and swiftly generate the reports, eG Enterprise provides a Report for list that consists of a variety of filter
options. By default, the Component option is chosen from this list - this indicates that all the managed
components of a chosen type will be available for selection in the Component list by default. In addition to this,
the Report for list provides the following filter options as well:
o
Service: If the component for which reports are to be generated is involved in the delivery of a particular
service, then pick this option from the Report for list. Doing so will invoke a Service list from which a
service name is to be chosen. Upon selection of a service, the component types that are part of the service
will populate the Component type list in this page. Once you pick a component type, all components of that
type, which are engaged in the delivery of the chosen service, will be displayed as candidates for selection
in the Components list. If there are still too many components in the list to choose from, you can narrow
your search further by using the Filter by text box. Specify the whole/part of the component name to
search for in this text box, and click the right-arrow button next to it. The Component list will then be
populated with all component names that embed the specified search string. Select the component of your
choice from this list.
o
Segment: If the components for which a report is to be generated is part of a segment, pick the Segment
option from the Report for list. Then, select the segment of interest to you from the Segment list. This will
populate the Component type list with the types of components that are part of the chosen segment. If you
select a component type from the Component type list, then, all components of that type, which are part of
the chosen segment, will be displayed in the Components list for selection. If there are still too many
components in the list to choose from, you can narrow your search further by using the Filter by text box.
Specify the whole/part of the component name to search for in this text box, and click the right-arrow
button next to it. The Component list will then be populated with all component names that embed the
specified search string. Select the component of your choice from this list.
194
Comparison Reports
o
Zone: If the components for which a report is to be generated is part of a zone, pick the Zone option from
the Report for list. To include sub-zones also in your search for components, set the Include SubZones flag
to Yes. Then, select the zone of interest to you from the Zone list. This will populate the Component type
list with the types of components that are part of the chosen zone. If you select a component type from
the Component type list, then, all components of that type, which are part of the chosen zone, will be
displayed in the Components list for selection. If there are too many components in the list to choose from,
you can narrow your search further by using the Filter by text box. Specify the whole/part of the
component name to search for in this text box, and click the right-arrow button next to it. The Component
list will then be populated with all component names that embed the specified search string. Select the
component of your choice from this list.
4.
In the case of our example, the components to be compared are part of a web site service. Therefore, from the
Report for list, select Service as the basis for comparison. Doing so populates the Service list in Figure 7.3 with
the complete list of fully configured services in the environment. From this list, select the service for which the
comparison report is to be generated.
5.
The Component list in Figure 7.3 will then be populated with the components that are involved in the delivery of
the chosen Service. Pick the component that is a candidate for the comparison from this list.
6.
The Layer list box (see Figure 7.3) will now display the layers that are part of the layer model of the chosen
component. From this list, select the Layer for which a graph is to be generated.
7.
Upon selection of a layer, the Test list box (see Figure 7.3) will display the tests associated with that layer.
Select the Test that generates the measure for which a graph is to be generated.
8.
All the measures that will be generated by the selected test will then appear in the Measure list box (see Figure
7.3). From this list, pick the Measure that is to be included in the comparison report.
9.
If the chosen test consists of descriptors, then the same will be listed in the Descriptors list box. Select the
descriptor that needs to be included for comparison.
10.
If a meaningful name for the specification should be displayed on the graph, provide a Display Name here.
11.
Now, add these specifications to the list box below by clicking the Add button (see Figure 7.3).
12.
Similarly, add the specifications pertaining to all the measures that need to be compared and analyzed (see
Figure 7.4). In our example, to compare response times, add the response time measure related to the web
server, AD server, and Oracle server, and the Average delay measure pertaining to the web server.
Figure 7.4: Adding the measures to be compared
13.
If any of the added specifications need to be removed, click on the check box corresponding to the
specification, and then click the
button (see Figure 7.4). If all the specifications are to be removed at one
shot, simply select the check box before the Display Name column in Figure 7.4. Then, click the Remove button.
14.
Next, from the added measures, select the ones for which a comparison graph is to be generated by clicking on
195
Comparison Reports
the relevant check boxes. Since all the added measures in our example need to be compared, select them all.
15.
Then, specify the Timeline for the graph. You can either provide a fixed time line such as 1 hour, 2 days, etc.,
or select the Any option from the list to provide a From and To date/time for report generation.
For every user registered with the eG Enterprise system, the administrator can indicate the
maximum timeline for which that user can generate a report. Once the maximum timeline is
set for a user, then, whenever that user logs into eG Reporter and attempts to generate a
report, the Timeline list box in the report page will display options according to the maximum
timeline setting of that user. For instance, if a user can generate a report for a maximum
period of 3 days only, then 3 days will be the highest option displayed in the Timeline list i.e., 3 days will be the last option in the fixed Timeline list. Similarly, if the user chooses the
Any option from the Timeline list and proceeds to provide a start date and end date for
report generation using the From and To specifications, eG Enterprise will first check if the
user's Timeline specification conforms to his/her maximum timeline setting. If not, report
generation will fail. For instance, for a user who is allowed to generate reports spanning over
a maximum period of 3 days only, the difference between the From and To dates should
never be over 3 days. If it is, then, upon clicking the Run Report button a message box will
appear, prompting the user to change the From and To specification.
16.
In addition to the settings discussed above, this report comes with a set of default specifications. These settings
are hidden by default. If you do not want to disturb these default settings, then you can proceed to generate
the report by clicking the Run Report button soon after you pick the measures that are to be compared.
However, if you want to view and then alter these settings (if required), click on the
button. The default
settings will then appear in the MORE OPTIONS drop down window (see Figure 7.5). The steps below discuss
each of these settings and how they can be customized.
Figure 7.5: The default settings for generating the Comparison reports
17.
From Figure 7.5, select the Graph Type. To view a single graph that plots the values of all the selected
measures, select the Single option. If individual graphs for each of the selected measures need to be viewed,
then, select the Multiple option (see Figure 7.5).
18.
The speed with which a report is generated depends primarily on the report Timeline. While a Timeline that
varies between a couple of days to a week enables the eG Enterprise system to quickly retrieve the required
data, timelines that span multiple weeks/months could slow-down the data retrieval and report generation
process to a considerable extent, owing to the volume of data involved. In order to ensure quick and easy
access to reports, eG Enterprise provides you the option of enabling data retrieval from the Trend information in
the database, instead of the Detailed test information that is used by default for report generation. The Detailed
196
Comparison Reports
test information base comprises of multiple measurement records for a test - one or more each for every test
execution. Whereas, the Trend information includes only hourly, daily, and monthly summary computations for
a test performed on a continuous basis. For instance, during a period of 1 hour, a test that runs every 5
minutes inserts atleast 12 records into the Detailed test information base. On the other hand, the Trend
information base would consist of only 1 record for the same 1 hour period. Fewer the number of records,
query execution becomes much quicker, and data retrieval faster. To use the trend data for report generation,
you will have to select the Trend option from the Show Data field in Figure 7.5. By default, the Detailed option is
selected in Figure 7.5 indicating that the report data is retrieved from the detailed test information in the
database. If need be, you can also ensure that all reports always use the Detailed test tables alone by hiding
the Show Data field from the reporter interface. To achieve this, do the following:
Login to the eG administrative interface as 'admin'.
Select the Manager option from the Settings tile that appears when the
clicked.
From the GENERAL SETTINGS page that then appears, if you set the Compute average/sum of metrics
while trending flag to No, then the Show Data field will not appear in the reporter interface; this denies
users access to the Trend option, and thus ensures that reports are always generated using the Detailed
tables.
button against the Admin tab is
A Trend report will not include the data for the current day since trend data is only
computed at the end of the day. If the Trend option is chosen, the time period of
the report should be greater than 1 day.
The usage of Detailed test tables for generating reports, especially those that span
weeks, increases the stress on the eG database, thus resulting in undue delays in
report generation. In order to ensure that the database is not choked by such
voluminous data requests, you can configure eG Enterprise to automatically "force"
the use of the Trend option if the Timeline of a report exceeds a pre-configured
duration. To specify this time boundary, do the following:
Edit the eg_report.ini file in the <EG_INSTALL_DIR>\manager\config directory.
In the [MISC] section of the file, you will find a DetailedTime parameter.
Specify the duration (in days) beyond which Detailed reports cannot be generated,
against the DetailedTime parameter, and save the eg_report.ini file. For instance,
to make sure that Detailed reports are disallowed for a Timeline of over 2 weeks,
set the DetailedTime parameter to 14 and save the file. Say, subsequently, you
attempt to generate a Detailed report for a Fixed Timeline of 3 weeks (which is
greater than the 14-day limit set in our example). The instant you select the 3
weeks option from the Fixed list box, the Detailed option gets automatically
disabled, and the Trend option gets enabled. Similarly, if you specify an Any
Timeline that runs over 14 days, then, upon clicking the Run Report button to
generate the report, a message box appears (see Figure 5.8) informing you that
only the Trend option
To proceed with the Trend report generation, click on the OK button in the
message box. To terminate Trend report generation, click the Cancel button.
197
Comparison Reports
19.
20.
In large environments, reports generated using months of data can take a long time to complete.
Administrators now have the option of generating reports on-line or in the background. When a report is
scheduled for background generation, administrators can proceed with their other monitoring, diagnosis, and
reporting tasks, while the eG manager is processing the report. This saves the administrator valuable time. To
schedule background processing of a report, select the Background Save - PDF option from the Report
Generation list. In this case, a Report Name text box will appear, where you would have to provide the name
with which the report is to be saved in the background. To process reports in the foreground, select the
Foreground Generation - HTML option from this list.
The Report Generation list will appear only if the EnableBackgroundReport flag in
the [BACKGROUND_PROCESS] section of the eg_report.ini file (in the
{EG_INSTALL_DIR}\manager\config directory) is set to Yes.
The default selection in the Report Generation list will change according to the
Timeline specified for the report. If the Timeline set is greater than or equal to the
number of days specified against the MinDurationForReport parameter in the
[BACKGROUND_PROCESS] section of the eg_report.ini file, then the default selection
in the Report Generation list will be Background. On the other hand, if the Timeline
set for the report is lesser than the value of the MinDurationForReport parameter,
then the default selection in the Report Generation list will be Foreground. This is
because, the MinDurationForReport setting governs when reports are to be
processed in the background. By default, this parameter is set to 2 weeks - this
indicates that by default, reports with a timeline of 2 weeks and above will be
processed in the background.
Finally, click the Run Report button to generate the graph. If the Graph Type is set to Single, and the option
chosen from the Report Generation list is Foreground Generation - HTML, then, clicking on the Run Report
button will invoke Figure 7.6.
198
Comparison Reports
Figure 7.6: A single comparison graph
199
Comparison Reports
Figure 7.7: Graph for each of the measures chosen for comparison
21.
Similarly, if the Graphtype chosen is Multiple and the option chosen from the Report Generation list is
Foreground Generation - HTML, then, clicking on the Run Report button will invoke Figure 7.7. Both the figures
clearly illustrate that the problem is not with the network, but with the Oracle server. Note that the Oracle
server’s responsiveness has experienced quite a few surges during the specified Timeline. From Figure 7.6 and
Figure 7.7, it is evident that the slow down in the Oracle server has only rippled to the web server, thereby
affecting its performance.
22.
With that, we have demonstrated how to generate a report comparing the responsiveness of the components
involved in the delivery of a web site service. As stated earlier, besides service components, the comparison
reports page can be used to compare independent components, segment components, and even, zone
components. For instance, to compare independent components, select Component from the Report for list,
select an independent Component, pick the Layer, Test, Measure and Descriptor (if applicable) to be compared,
and click the Add button (see Figure 7.8). This way, multiple components can be chosen for comparison.
200
Comparison Reports
Figure 7.8: Choosing independent components for comparison
23.
Similarly, to draw a performance comparison chart for segment components, select Segment from the Report
for list, choose the Segment whose components are to be compared, select the segment Component that will
participate in the comparative analysis, pick the Layer, Test, Measure and Descriptor (if applicable) to be
compared, and click the Add button (see Figure 7.9). This way, multiple components from the same segment or
across segments can be chosen for comparison.
Figure 7.9: Choosing the segment components to be compared
24.
Likewise, for comparing performance across a particular zone, select Zone from the Report for list, choose the
Zone, select the zone Component that will participate in the comparison, pick the Layer, Test, Measure and
201
Comparison Reports
Descriptor (if applicable) to be compared, and click the Add button (see Figure 7.10). In the same manner,
multiple components from the same zone or across zones can be chosen for comparison.
Figure 7.10: Choosing the zone components to be included in the comparison
25.
On the other hand, if the Background Save - PDF option is chosen from the Report Generation list, then clicking
on the Run Report button will not generate the report and display it in this page for your benefit. Instead, a
message indicating that the report is being processed in the background will appear. This will be accompanied
by a link that will lead you to the page that lists all the reports that are being processed in the background, and
their current status. If background report generation fails for a report, you can regenerate that report using this
page, or can even delete that report if need be. On the other hand, if background processing successfully
completes for your report, then, you can view a PDF of the report by clicking on the PDF icon in that page.
7.2 Tests Comparison Report
The Comparison Reports -Components report is ideal if specific test results related to one or more components are
chosen for comparison. The Tests report, on the other hand, can be used if the metrics collected by one test have to
be plotted across multiple components. Such a report brings to light the best/worst candidates in a chosen
performance area; more time and focus can then be reserved for the problem-prone components. For instance, using
this report, you can compare the CPU utilization of all monitored components in the environment and identify the
most CPU-intensive component. The procedure for generating this report is as given below:
1.
Select the Tests option from the Comparison Reports node of the REPORTS BY FUNCTION tree.
202
Comparison Reports
Figure 7.11: Generating the Comparison reports for tests
2.
When Figure 7.11 appears, click on the Please define configuration to specify the criteria for comparing the
metrics across multiple components.
Figure 7.12: Specifying the criteria for Comparison Reports - Tests
3.
From Figure 7.12, select a filter criterion from the Report for list box. Administrators of large IT infrastructures,
which are characterized by hundreds of components, may find it difficult to pick and choose the components for
which a report is to be generated; this is because, in such environments, the Component list in this page will be
populated with a large number of components, which would naturally make component selection tough. To
enable administrators of such environments to quickly locate the components of interest to them and swiftly
generate the reports, eG Enterprise provides a Report for list that consists of a variety of filter options. By
default, the Component option is chosen from this list - this indicates that all the managed components of a
chosen type will be available for selection in the Component list by default. In addition to this, the Report for list
provides the following filter options as well:
o
Service: If the component for which reports are to be generated is involved in the delivery of a particular
service, then pick this option from the Report for list. Doing so will invoke a Service list from which a
service name is to be chosen. Upon selection of a service, the component types that are part of the service
will populate the Component type list in this page. Once you pick a component type, all components of that
type, which are engaged in the delivery of the chosen service, will be displayed as candidates for selection
in the Components list. If there are still too many components in the list to choose from, you can narrow
your search further by using the Search text box. Specify the whole/part of the component name to search
for in this text box, and click the
icon next to it. The Component list will then be populated with all
component names that embed the specified search string. Select the component of your choice from this
list.
o
Segment: If the components for which a report is to be generated is part of a segment, pick the Segment
option from the Report for list. Then, select the segment of interest to you from the Segment list. This will
populate the Component type list with the types of components that are part of the chosen segment. If you
select a component type from the Component type list, then, all components of that type, which are part of
the chosen segment, will be displayed in the Components list for selection. If there are still too many
203
Comparison Reports
components in the list to choose from, you can narrow your search further by using the Search text box.
Specify the whole/part of the component name to search for in this text box, and click the
icon next to
it. The Component list will then be populated with all component names that embed the specified search
string. Select the component of your choice from this list.
o
Zone: If the components for which a report is to be generated is part of a zone, pick the Zone option from
the Report for list. To include sub-zones also in your search for components, set the Include SubZones flag
to Yes. Then, select the zone of interest to you from the Zone list. This will populate the Component type
list with the types of components that are part of the chosen zone. If you select a component type from
the Component type list, then, all components of that type, which are part of the chosen zone, will be
displayed in the Components list for selection. If there are too many components in the list to choose from,
you can narrow your search further by using the Search text box. Specify the whole/part of the component
name to search for in this text box, and click the
icon next to it. The Component list will then be
populated with all component names that embed the specified search string. Select the component of your
choice from this list.
Since our example seeks to compare the CPU usage of all managed components in the environment, select
the Component option from the Compare list.
4.
Next, you will need to choose between the Metrics and Test options from the Select by Criteria list. If you select
the Test option, you will be expected to select a Test, then the Measure to be compared. For our example
therefore, you will first have to select System Details test, then choose the CPU utilization measure, and finally
select all the components displayed in the Component list (see Figure 7.13).
Figure 7.13: Selecting a Test, Measure, and Component for comparison
5.
On the other hand, the Metrics option offers pre-defined test/measure combinations. When this option is
chosen, you will see a pre-configured list of metrics displayed. Instead of selecting a specific Test and Measure
as required by the Test option, you can simply select a performance parameter from the Metrics list, and then
pick the components across which the parameter is to be compared. For our example therefore, you do not
have to remember the test and measure that returns the desired CPU usage value; instead, just select the
Server CPU utilization metric from the Metrics list, and select all the components from the Component list (see
Figure 7.14).
204
Comparison Reports
Figure 7.14: Selecting from a pre-defined list of metrics
6.
By default, the Metrics list comes with a set of pre-configured parameters. You can expand the Metrics list by
adding more performance parameters to it. To override the default Metrics list, edit the eg_report.ini file (in the
<EG_INSTALL_DIR>\manager\config directory), and add a new metric to the [REPORT_TEMPLATES] section therein,
in the following format:
<DisplayName>=<InternalTestName>:<InternalMeasureName>
For example, to compare the availability of network connection to all the components in the infrastructure, do
the following:
First, determine the Internal name of the test and measure to be configured. For that, do the following:
o
Open the eg_lang*.ini file (from the <EG_INSTALL_DIR>\manager\config directory), where * is the
language code that represents the language preference that you have set using the USER PROFILE
page. In this file, the component types, measure names, test names, layer names, measure
descriptions, and a wide range of other display information are expressed in a particular language,
and are mapped to their eG equivalents.
o
Now, search the eg_lang*.ini file for the test name of interest to you. In the case of our example,
search for “Network”.
o
Once it is found, determine which internal eG test it is mapped to. For instance, the eG equivalent of
the “Network” test is “NetworkTest”.
o
Similarly, you can also find the internal measure name that eG Enterprise uses for referring to the
Network availability measure; by default, this will be Availability.
Now that the eG internal names have been identified, proceed to configure the metric in the following
manner:
Network availability=NetworkTest:Availability
The DisplayName, Network availability, will be added to the Metrics list of Figure 7.14.
7.
If the Component list consists of too many components, then viewing all the components and selecting the
ones you need for report generation could require endless scrolling. To avoid this, you can click the
icon
next to the Component list. This will expand the Component list so that you can view almost all the components
in a single interface and select the ones for which the report is to be generated.
8.
If descriptors are relevant for the selected test/metric, a list of descriptors will be displayed in the Descriptor
205
Comparison Reports
text box. You can select the descriptors for which reports are to be generated. If the Descriptor list consists of
too many descriptors, then viewing all the descriptors and selecting the ones you need for report generation
could require endless scrolling. To avoid this, you can click the
icon next to the Descriptor list. This will
expand the Descriptor list so that you can view almost all the descriptors in a single interface and select the
ones for which the report is to be generated.
9.
To add the specification, click on the Add button. A separate entry for every chosen Component is then added
as shown in Figure 7.13. Similarly, details pertaining to multiple tests/metrics can be added to this list box. To
remove a specification, simply click on the check box corresponding to the specification, and click the
button.
10.
Next, pick and choose the specifications that need to participate in the analysis by clicking on the check box
corresponding to every specification. In our case, all the listed entries are to be compared. Therefore, just click
on the topmost check box in the column of check boxes to automatically select all the specifications at one
shot.
11.
Then, specify the Timeline for the graph. You can either provide a fixed time line such as 1 hour, 2 days, etc.,
or select the Any option from the list to provide a From and To date/time for report generation.
For every user registered with the eG Enterprise system, the administrator can indicate the
maximum timeline for which that user can generate a report. Once the maximum timeline is
set for a user, then, whenever that user logs into eG Reporter and attempts to generate a
report, the Timeline list box in the report page will display options according to the maximum
timeline setting of that user. For instance, if a user can generate a report for a maximum
period of 3 days only, then 3 days will be the highest option displayed in the Timeline list i.e., 3 days will be the last option in the fixed Timeline list. Similarly, if the user chooses the
Any option from the Timeline list and proceeds to provide a start date and end date for
report generation using the From and To specifications, eG Enterprise will first check if the
user's Timeline specification conforms to his/her maximum timeline setting. If not, report
generation will fail. For instance, for a user who is allowed to generate reports spanning over
a maximum period of 3 days only, the difference between the From and To dates should
never be over 3 days. If it is, then, upon clicking the Run Report button a message box will
appear, prompting the user to change the From and To specification.
12.
In addition to the settings discussed above, this report comes with a set of default specifications. These settings
are hidden by default. If you do not want to disturb these default settings, then you can proceed to generate
the report by clicking the Run Report button soon after you pick the measures that are to be compared.
However, if you want to view and then alter these settings (if required), click on the
button. The default
settings will then appear in the MORE OPTIONS drop down window (see Figure 7.15). The steps below discuss
each of these settings and how they can be customized.
206
Comparison Reports
Figure 7.15: The default settings for generating a Comparison Reports - Tests
13.
From Figure 7.15, select the Graph Type . To view a single graph that plots the values for all the selected
components, select the Single option. If individual graphs for each of the selected components need to be
viewed, then select the Multiple option (see Figure 7.15).
14.
The speed with which a report is generated depends primarily on the report Timeline. While a Timeline that
varies between a couple of days to a week enables the eG Enterprise system to quickly retrieve the required
data, timelines that span multiple weeks/months could slow-down the data retrieval and report generation
process to a considerable extent, owing to the volume of data involved. In order to ensure quick and easy
access to reports, eG Enterprise provides you the option of enabling data retrieval from the Trend information
in the database, instead of the Detailed test information that is used by default for report generation. The
Detailed test information base comprises of multiple measurement records for a test - one or more each for
every test execution. Whereas, the Trend information includes only hourly, daily, and monthly summary
computations for a test performed on a continuous basis. For instance, during a period of 1 hour, a test that
runs every 5 minutes inserts atleast 12 records into the Detailed test information base. On the other hand, the
Trend information base would consist of only 1 record for the same 1 hour period. Fewer the number of
records, query execution becomes much quicker, and data retrieval faster. To use the trend data for report
generation, you will have to select the Trend option from the Show Data field in Figure 7.15. By default, the
Detailed option is selected in Figure 7.15 indicating that the report data is retrieved from the detailed test
information in the database. If need be, you can also ensure that all reports always use the Detailed test tables
alone by hiding the Show Data field from the reporter interface. To achieve this, do the following:
Login to the eG administrative interface as 'admin'.
Select the Manager option from the Settings tile that appears when the
clicked.
From the GENERAL SETTINGS page that then appears, if you set the Compute average/sum of metrics
while trending flag to No, then the Show Data field will not appear in the reporter interface; this denies
users access to the Trend option, and thus ensures that reports are always generated using the Detailed
tables.
207
button against the Admin tab is
Comparison Reports
15.
A Trend report will not include the data for the current day since trend data is only
computed at the end of the day.
If the Trend option is chosen, the time period of the report should be greater than
1 day.
The usage of Detailed test tables for generating reports, especially those that span
weeks, increases the stress on the eG database, thus resulting in undue delays in
report generation. In order to ensure that the database is not choked by such
voluminous data requests, you can configure eG Enterprise to automatically "force"
the use of the Trend option if the Timeline of a report exceeds a pre-configured
duration. To specify this time boundary, do the following:
o
Edit the eg_report.ini file in the <EG_INSTALL_DIR>\manager\config directory.
o
In the [MISC] section of the file, you will find a DetailedTime parameter.
o
Specify the duration (in days) beyond which Detailed reports cannot be generated,
against the DetailedTime parameter, and save the eg_report.ini file.
o
For instance, to make sure that Detailed reports are disallowed for a Timeline of
over 2 weeks, set the DetailedTime parameter to 14 and save the file.
o
Say, subsequently, you attempt to generate a Detailed report for a Fixed Timeline
of 3 weeks (which is greater than the 14-day limit set in our example). The instant
you select the 3 weeks option from the Fixed list box, the Detailed option gets
automatically disabled, and the Trend option gets enabled. Similarly, if you specify
an Any Timeline that runs over 14 days, then, upon clicking the RUN REPORT
BUTTON to generate the report, a message box appears (see Figure 5.8) informing
you that only the Trend option is permitted.
o
To proceed with the Trend report generation, click the OK button in the message
box. To terminate Trend report generation, click the CANCEL button.
Typically, if the values of all the measures chosen for comparison are plotted in a single graph - i.e., if Graph
Type is set to Single - then eG Enterprise automatically computes a maximum value for that graph based on the
values reported by all the measures. However, if individual graphs are to be generated for each measure being
compared - i.e., if Graph Type is set to Multiple - then, the maximum value will differ across graphs. This is
because, in the case of the latter, by default, the maximum value for a graph is determined based on the values
reported by a single measure during a specified timeline. This is why, the Common Maximum flag is set to No
by default, if Graph Type is Multiple. The key limitation of having a maximum value per graph is the absence of
a common basis for comparison. For instance, if you are comparing disk space usage across partitions using
multiple graphs, you may find that the graph for disk C, where usage has varied between 60-80%, will have 80
as the maximum value, and the graph for disk D, where usage has varied between 40-50%, will have 50 as the
maximum value. A quick look at these graphs may not instantly reveal which disk partition is experiencing a
space crunch, as there will be no single threshold for comparison. Therefore, to effectively compare across
graphs, and to be able to accurately isolate performance issues, you can set a common maximum value for all
graphs displayed in this page. To achieve this, you need to set the Common Maximum flag to Yes. This
common maximum value can be auto-computed by eG Enterprise or can be user-configured. To auto-compute
the maximum value, set the Auto Maximum flag to Yes. By default, the Auto Maximum flag is set to No and if
you want to specify a value of your choice as the common maximum value across graphs, then, proceed to
provide a specific value in the Max Value field.
208
Comparison Reports
16.
In large environments, reports generated using months of data can take a long time to complete.
Administrators now have the option of generating reports on-line or in the background. When a report is
scheduled for background generation, administrators can proceed with their other monitoring, diagnosis, and
reporting tasks, while the eG manager is processing the report. This saves the administrator valuable time. To
schedule background processing of a report, select the Background Save - PDF option from the Report
Generation list. In this case, a Report Name text box will appear, where you would have to provide the name
with which the report is to be saved in the background. To process reports in the foreground, select the
Foreground Generation - HTML option from this list.
The Report Generation list will appear only if the EnableBackgroundReport flag in
the [BACKGROUND_PROCESS] section of the eg_report.ini file (in the
{EG_INSTALL_DIR}\manager\config directory) is set to Yes.
The default selection in the Report Generation list will change according to the
Timeline specified for the report. If the Timeline set is greater than or equal to the
number of days specified against the MinDurationForReport parameter in the
[BACKGROUND_PROCESS] section of the eg_report.ini file, then the default selection
in the Report Generation list will be Background. On the other hand, if the Timeline
set for the report is lesser than the value of the MinDurationForReport parameter,
then the default selection in the Report Generation list will be Foreground. This is
because, the MinDurationForReport setting governs when reports are to be
processed in the background. By default, this parameter is set to 2 weeks - this
indicates that by default, reports with a timeline of 2 weeks and above will be
processed in the background.
17.
Finally, click on the Run Report button to generate the report.
18.
Graphs depicted by Figure 7.16 will then appear.
209
Comparison Reports
Figure 7.16: A comparison report displaying individual graphs for every chosen component
210
Comparison Reports
Figure 7.17: A single graph comparing the CPU utilization across components
19.
The graph in Figure 7.16 will appear if the Graph Type chosen is Multiple. The graph in Figure 7.17 will appear
if the Graph Type chosen is Single.
7.3 Top N Reports
Using the Top N Reports offered by eG Enterprise, administrators can rank components/descriptors for every metric
collected by the eG Enterprise system. The report also reveals the best/worst players in a particular performance
area, thereby bringing to light components that are problem-prone, and which hence require continuous attention.
For example, to view the top 10 components with incoming traffic flow, do the following:
1.
Select the Top – N Analysis option from the Comparison Reports node of the REPORTS BY FUNCTION tree.
2.
Next, select a filter criterion from the Report for list box. In large environments comprising of hundreds of
components, users often find it difficult to choose a few specific components from the endless component list,
for drawing performance comparisons. Therefore, to enable users to quickly and easily pick the components to
be compared, the Report for list box provides users with multiple filter options. Selecting an option from this list
provides users with a smaller component window to choose from. The options provided by the Report for list
box are discussed hereunder:
Component: Select this option to choose the components for comparison from across all the managed
components in the environment
Service: Select this option if the components to be compared are involved in the delivery of a business
service. Then, pick the Service.
Segment: Choose this option if the components to be compared are part of a segment. Then, select the
Segment.
Zone: Pick this option to compare the performance of components that are included in one/more zones.
Then, by selecting an option from the Include Subzones list, indicate whether the Components list should
include components in the sub-zones of the chosen zone as well.
211
Comparison Reports
As our example seeks to determine the top incoming network traffic consuming customers from across all
components in the infrastructure, select Component from the Report for list.
3.
Next, choose between the Metrics and Test options from the Select by Criteria list. If you select the Test option,
you will be expected to select a Test, then the Measure for which a Top-N list is to be generated, and finally,
the Components in the infrastructure that will be participating in the evaluation. In the case of our example
therefore, you will first have to select Network Traffic test, then choose the Incoming traffic measure, and finally
select one/more Components displayed in the Components list (see Figure 7.18). If the Components list
consists of too many components, then viewing all the components and selecting the ones you need for report
generation could require endless scrolling. To avoid this, you can click the
button next to the Components
list. A COMPONENTS pop up window will then appear using which you can view almost all the components in a
single interface and Select the ones to be included in the top-n analysis easily.
Figure 7.18: Selecting the Test, Measure, and Components to be compared
4.
On the other hand, the Metrics option, if chosen from the Select by Criteria list, offers pre-defined test/measure
combinations. When this option is chosen, you will see a pre-configured list of metrics displayed. Instead of
selecting a specific Test and Measure as required by the Test option, you can simply select a performance
parameter from the Metrics list, and then pick the components from which the Top-N Components need to be
identified.
5.
By default, the Metrics list comes with a set of pre-configured parameters. You can expand the Metrics list by
adding more performance parameters to it. To override the default Metrics list, edit the eg_report.ini file (in the
<EG_INSTALL_DIR>\manager\config directory), and add a new metric to the [REPORT_TEMPLATES] section therein,
in the following format:
<DisplayName>=<InternalTestName>:<InternalMeasureName>
For example, if you wish to add the Data in flow measure of the Net Flows test, do the following:
First, determine the Internal name of the test and measure to be configured. For that, do the following:
o
Open the eg_lang*.ini file (from the <EG_INSTALL_DIR>\manager\config directory), where * is the
language code that represents the language preference that you have set using the USER
PROFILE page. In this file, the component types, measure names, test names, layer names,
measure descriptions, and a wide range of other display information are expressed in a particular
language, and are mapped to their eG equivalents.
o
Now, search the eg_lang*.ini file for the test name of interest to you. In the case of our example,
search for “Net Flows”.
o
Once it is found, determine which internal eG test it is mapped to. For instance, the eG
equivalent of the “Net Flows” test is “NetFlowTest".
o
Similarly, you can also find the internal measure name that eG Enterprise uses for referring to
the Data in flow measure; this will be Total_Flow_Data.
212
Comparison Reports
Now that the eG internal names have been identified, proceed to configure the metric in the following
manner:
Net flow=NetFlowTest: Total_Flow_Data
The DisplayName, Net flow, will be added to the Metrics list of Figure 7.18.
6.
Next, choose a Report Type (Graph or Data). The default Report Type is Graph. A Graph report graphically
represents the measure data.
7.
Then, specify the Timeline for the graph. You can either provide a fixed time line such as 1 hour, 2 days, etc.,
or select the Any option from the list to provide a From and To date/time for report generation.
For every user registered with the eG Enterprise system, the administrator can indicate the
maximum timeline for which that user can generate a report. Once the maximum timeline is
set for a user, then, whenever that user logs into eG Reporter and attempts to generate a
report, the Timeline list box in the report page will display options according to the maximum
timeline setting of that user. For instance, if a user can generate a report for a maximum
period of 3 days only, then 3 days will be the highest option displayed in the Timeline list i.e., 3 days will be the last option in the fixed Timeline list. Similarly, if the user chooses the
Any option from the Timeline list and proceeds to provide a start date and end date for
report generation using the From and To specifications, eG Enterprise will first check if the
user's Timeline specification conforms to his/her maximum timeline setting. If not, report
generation will fail. For instance, for a user who is allowed to generate reports spanning over
a maximum period of 3 days only, the difference between the From and To dates
should never be over 3 days. If it is, then, upon clicking the Run Report button a
message box will appear, prompting the user to change the From and To
specification.
8.
In addition to the settings discussed above, this report comes with a set of default specifications. These settings
are hidden by default. If you do not want to disturb these default settings, then you can proceed to generate
the report by clicking the Run Report button soon after you pick an option from the Components list. However,
if you want to view and then alter these settings (if required), click on the
button. The default settings will
then appear in the MORE OPTIONS drop down window. The steps below discuss each of these settings and how
they can be customized.
213
Comparison Reports
Figure 7.19: The default settings for generating a Top – N Analysis report
9.
Form Figure 7.19, enable the Show Descriptors flag if the descriptors of the chosen test should also be included
in the TOP-N analysis.
10.
The speed with which a report is generated depends primarily on the report Timeline. While a Timeline that
varies between a couple of days to a week enables the eG Enterprise system to quickly retrieve the required
data, timelines that span multiple weeks/months could slow-down the data retrieval and report generation
process to a considerable extent, owing to the volume of data involved. In order to ensure quick and easy
access to reports, eG Enterprise provides you the option of enabling data retrieval from the Trend information
in the database, instead of the Detailed test information that is used by default for report generation. The
Detailed test information based comprises of multiple measurement records for a test - one or more each for
every test execution. Whereas, the Trend information includes only hourly, daily, and monthly summary
computations for a test performed on a continuous basis. For instance, during a period of 1 hour, a test that
runs every 5 minutes inserts atleast 12 records into the Detailed test information base. On the other hand, the
Trend information base would consist of only 1 record for the same 1 hour period. Fewer the number of
records, query execution becomes much quicker, and data retrieval faster. To use the trend data for report
generation, you will have to select the Trend option from the Show Data field in Figure 7.19. By default, the
Detailed option is selected in Figure 7.19 indicating that the report data is retrieved from the detailed test
information in the database. If need be, you can also ensure that all reports always use the Detailed test tables
alone by hiding the Show Data field from the reporter interface. To achieve this, do the following:
Login to the eG administrative interface as 'admin'.
Select the Manager option from the Settings tile that appears when the
clicked.
From the GENERAL SETTINGS page that then appears, if you set the Compute average/sum of metrics
while trending flag to No, then the Show Data field will not appear in the reporter interface; this denies
users access to the Trend option, and thus ensures that reports are always generated using the Detailed
tables.
214
button against the Admin tab is
Comparison Reports
A Trend report will not include the data for the current day since trend data is only
computed at the end of the day.
If the Trend option is chosen, the time period of the report should be greater than
1 day.
The usage of Detailed test tables for generating reports, especially those that span
weeks, increases the stress on the eG database, thus resulting in undue delays in
report generation. In order to ensure that the database is not choked by such
voluminous data requests, you can configure eG Enterprise to automatically "force"
the use of the Trend option if the Timeline of a report exceeds a pre-configured
duration. To specify this time boundary, do the following:
o
Edit the eg_report.ini file in the <EG_INSTALL_DIR>\manager\config directory.
o
In the [MISC] section of the file, you will find a DetailedTime parameter.
o
Specify the duration (in days) beyond which Detailed reports cannot be generated,
against the DetailedTime parameter, and save the eg_report.ini file.
o
For instance, to make sure that Detailed reports are disallowed for a Timeline of
over 2 weeks, set the DetailedTime parameter to 14 and save the file.
o
Say, subsequently, you attempt to generate a Detailed report for a Fixed Timeline
of 3 weeks (which is greater than the 14-day limit set in our example). The instant
you select the 3 weeks option from the Fixed list box, the Detailed option gets
automatically disabled, and the Trend option gets enabled. Similarly, if you specify
an Any Timeline that runs over 14 days, then, upon clicking the Run Report button
to generate the report, a message box appears (see Figure 5.7) informing you that
only the Trend option is permitted.
o
To proceed with the Trend report generation, click the OK button in the message
box. To terminate Trend report generation, click the Cancel button.
11.
If the Show Descriptors flag is set to Yes, then, a Descriptor list will appear, from which you can pick the
descriptors that you want the TOP-N report to compare. To include all the descriptors that the chosen
test/metric supports in the top-n analysis, select the All Descriptors option. If the Descriptor list consists of too
many descriptors, then viewing all the descriptors and selecting the ones you need for report generation could
require endless scrolling. To avoid this, you can click the
button next to the Descriptor list. A DESCRIPTOR
pop up window will then appear using which you can view almost all the descriptors in a single interface and
select the ones to be included in the TOP-N analysis easily.
12.
Using the Weighted Average flag, you can indicate how the Avg value is to be computed for a chosen measure
for the purpose of this report. The status of the Weighted Average flag is relevant only if the Test chosen is a
descriptor-based test, and the descriptors are dynamic in nature. For instance, the Net flows test in our
example auto-discovers the net flows that are currently active on a Cisco router. For each net flow (i.e., source
IP - destination IP pair) so discovered, the test reports a variety of statistics. Unlike descriptors such as disk
partitions or processors that rarely change, the net flows are dynamic descriptors, which may change often; in
other words, a net flow that is active on the network now, may not communicate at all during the next
measurement period. The Net flows test will neither report metrics for the inactive descriptors nor display it in
the eG monitoring console. This is why, net flows are considered 'dynamic descriptors'.
215
Comparison Reports
By default, the TOP-N report compares the Avg value of the chosen measure across all selected descriptors.
Since the Weighted Average flag is set to No by default, this Avg is computed as the ratio of the sum total of
the measure values reported by a descriptor during the given timeline and the total number of times the test
ran during the same timeline. In case of dynamic descriptors however, the Avg values so computed may not
reveal the 'true picture of performance'. This is because, the test may not discover or report metrics for
dynamic descriptors throughout a given timeline. For example, take the case of the Net flows test. Say, the test
auto-discovered two net flows - namely, 'A' and 'B' - during its first measurement period; both net flows
registered a Data in Flow of 3 MB and 8 MB respectively. Assume that the second time the Net flows test ran, it
captured 5 MB of data in net flow 'A'. Net flow 'B' however was inactive during the second measurement period,
and hence, was not discovered at all. If the Weighted Average flag is set to No by default, then, the TOP-N
report will plot the Avg value of 4 MB (3+5=8/2=4) for net flow 'A' and 4 MB (8/2=4) again for net flow 'B'. If
you notice, unlike net flow 'A', where 8 MB of data was transacted over a period of time, in case of net flow 'B',
8 MB of data was transacted at one shot! Logically therefore, net flow 'B' has to be ranked above net flow 'A' in
terms of data in flow. However, since the default Avg value computation does not clearly bring out this
difference, both net flow 'A' and 'B' are treated at par in the TOP-N report! This is why, in case of dynamic
descriptors, you may want to set the Weighted Average flag to Yes. In this case, the eG Enterprise system
expresses Avg as the ratio of the sum total of the measure values reported by a descriptor during a given
timeline and the 'total number of times that descriptor was active' during the same timeline. This implies that if
the Weighted Average flag is set to Yes in the net flow example above, the Avg value for net flow 'A' will
continue to be 4 (3+5=8/2=4), but the same for net flow 'B' will be 8 MB (8/1=8). In the TOP-N report
therefore, net flow 'B' will be placed above net flow 'A', thereby accurately pointing you to the top
communicators over the network.
13.
To exclude weekends (Saturdays and Sundays) from the period of consideration, select the Yes option against
Exclude weekends.
14.
To view the Top-10 net flows, select Top-10 from the Show list. By default, the Top-<maximum number of
active descriptors for the test> will be the option chosen here - i.e., if this test takes a maximum of 5
descriptors, then the Top-5 option will be selected here by default.
The options to be listed in the Show list can be configured in the eg_report.ini file in the
<EG_INSTALL_DIR>\manager\config directory. To achieve this, set the ShowTop parameter in
the [INFOS] section of this list to a specific numeric value. For example, if you set ShowTop to
10, then the Show list will display the following options: Top-10, Top-2, Top-5, Last-10, Last2, and Last-5.
15.
Next, specify the report duration against Time period.
16.
Next, indicate the type of graphs to be generated in the report page - whether 3D or 2D - by choosing the
appropriate option from the Graph list. The default selection in this list is determined by the Show reporter
graphs in 3D flag in the MONITOR SETTINGS page of the eG administrative interface. If this flag is set to Yes,
then the 3D option will be selected by default in the Graph list. If this flag is set to No, then the default
selection in the Graph list will be 2D.
17.
Finally, click the Run Report button to generate the report.
18.
In large environments, reports generated using months of data can take a long time to complete.
Administrators now have the option of generating reports on-line or in the background. When a report is
scheduled for background generation, administrators can proceed with their other monitoring, diagnosis, and
216
Comparison Reports
reporting tasks, while the eG manager is processing the report. This saves the administrator valuable time. To
schedule background processing of a report, select the Background Save - PDF option from the Report
Generation list. In this case, a Report Name text box will appear, where you would have to provide the name
with which the report is to be saved in the background. To process reports in the foreground, select the
Foreground Generation - HTML option from this list.
19.
The Report Generation list will appear only if the EnableBackgroundReport flag in
the [BACKGROUND_PROCESS] section of the eg_report.ini file (in the
{EG_INSTALL_DIR}\manager\config directory) is set to Yes.
The default selection in the Report Generation list will change according to the
Timeline specified for the report. If the Timeline set is greater than or equal to the
number of days specified against the MinDurationForReport parameter in the
[BACKGROUND_PROCESS] section of the eg_report.ini file, then the default
selection in the Report Generation list will be Background. On the other hand, if the
Timeline set for the report is lesser than the value of the MinDurationForReport
parameter, then the default selection in the Report Generation list will be
Foreground. This is because, the MinDurationForReport setting governs when
reports are to be processed in the background. By default, this parameter is set to
2 weeks - this indicates that by default, reports with a timeline of 2 weeks and
above will be processed in the background.
In the case of our example, if the Report Type is Graph and the option chosen from the Report Generation list is
Foreground Generation - HTML, then, clicking on the Run Report button will invoke a bar chart depicting the
Top-10 consumers of incoming traffic, and the average Data in the incoming traffic flow (see Figure 7.20). If
the Weighted Average flag is set to Yes, then for the dynamic net flow descriptors, this average will be
calculated as the ratio of the sum total of the values reported by the Data in flow measure for a net flow during
the given timeline and the total number of times that net flow was active on the network during the same
timeline.
Figure 7.20: A Top N Graph Report where the Weighted Average flag is set to 'Yes'
20.
If the Weighted Average flag is set to No on the other hand, then for the dynamic descriptors, this average will
217
Comparison Reports
be calculated as the ratio of the sum total of the values reported by the Data in flow measure for a net flow
during the given timeline and the total number of times the Net flows test ran during the same time line (see
Figure 7.21).
Figure 7.21: The Top-N Graph report where the Weighted Average flag is set to 'No'
21.
In a Data report, on the other hand, the configured details are presented in a tabular format. Therefore, if the
Report Type is Data, then a report that lists the minimum, maximum, and average values for the Top-10 net
flows on the chosen router will appear (see Figure 7.22).
Figure 7.22: A Top N Data Report where the Weighted Average flag is set to 'Yes'
218
Comparison Reports
Figure 7.23: A Top N Data Report where the Weighted Average flag is set to 'No'
22.
On the other hand, if the Background Save - PDF option is chosen from the Report Generation list, then clicking
on the Run Report button will not generate the report and display it in this page for your benefit. Instead, a
message indicating that the report is being processed in the background will appear. This will be accompanied
by a link that will lead you to the page that lists all the reports that are being processed in the background, and
their current status. If background report generation fails for a report, you can regenerate that report using this
page, or can even delete that report if need be. On the other hand, if background processing successfully
completes for your report, then, you can view a PDF of the report by clicking on the PDF icon in that page.
219
Snapshot Reports
Measurement Snapshot Reports
The Measurement Snapshots feature of the eG Reporter enables users to perform effective reactive analysis.
Sometimes, while performing a routine monitoring exercise, some administrators might have become aware of a
problem only after a few hours of its occurrence. In some other cases, administrators might want to know all that
had transpired in the monitored environment during a brief period of their absence. The Measurement Snapshots
report feature of the eG Reporter helps such administrators perform a post-mortem procedure on the monitored
environment, analyze the state of the environment during the designated period, and diagnose the root-cause of
problems that had existed during that period.
Unlike other reports offered by the eG Reporter, which represent information graphically, the Measurement Snapshot
Reports, by default, provide the information as neatly tabulated data to enhance readability and understandability.
Measurement Snapshot reports are of two types, namely: Components and Tests.
8.1 Snapshot Reports - Component
If the Analysis by Component option is chosen, the user can generate and view key information pertaining to a
single/multiple tests associated with a chosen component. For example, to know how effectively a Microsoft SQL
server had performed during a particular period, do the following:
1.
Select the Analysis by Component option from the Measurement Snapshot node of the REPORTS BY FUNCTION
tree.
2.
Figure 8.1 will then appear.
3.
Administrators of large IT infrastructures, which are characterized by hundreds of components, may find it
difficult to pick and choose the components for which a report is to be generated; this is because, in such
environments, the Components list in this page will be populated with a large number of components, which
would naturally make component selection tough. To enable administrators of such environments to quickly
locate the components of interest to them and swiftly generate the reports, eG Enterprise provides a Report For
list that consists of a variety of filter options. By default, the Component option is chosen from this list (see
Figure 8.1) - this indicates that all the managed components of a chosen type will be available for selection in
the Component list by default. In addition to this, the Report For list provides the following filter options as well:
o
Service: If the component for which a report is to be generated is involved in the delivery of a particular
service, then pick this option from the Report For list. Doing so will invoke a Service list from which a
service name is to be chosen. Upon selection of a service, the component types that are part of the service
will populate the ComponentType list in this page. Once you pick a component type, all components of that
type, which are engaged in the delivery of the chosen service, will be displayed as candidates for selection
in the Component list. If there are still too many components in the list to choose from, you can narrow
your search further by using the Filter by text box. Specify the whole/part of the component name to
search for in this text box, and click the right-arrow button next to it. The Component list will then be
populated with all component names that embed the specified search string. Select the component of your
choice from this list.
220
Snapshot Reports
o
Segment: If the components for which a report is to be generated is part of a segment, pick the Segment
option from the Report For list. Then, select the segment of interest to you from the Segment list. This will
populate the ComponentType list with the types of components that are part of the chosen segment. If you
select a component type from the ComponentType list, then, all components of that type, which are part of
the chosen segment, will be displayed in the Component list for selection. If there are still too many
components in the list to choose from, you can narrow your search further by using the Filter by text box.
Specify the whole/part of the component name to search for in this text box, and click the right-arrow
button next to it. The Component list will then be populated with all component names that embed the
specified search string. Select the component of your choice from this list.
o
Zone: If the components for which a report is to be generated is part of a zone, pick the Zone option from
the Report For list. To include sub-zones also in your search for components, set the Include SubZones flag
to Yes. Then, select the zone of interest to you from the Zone list. This will populate the ComponentType
list with the types of components that are part of the chosen zone. If you select a component type from
the ComponentType list, then, all components of that type, which are part of the chosen zone, will be
displayed in the Components list for selection. If there are too many components in the list to choose from,
you can narrow your search further by using the Filter by text box. Specify the whole/part of the
component name to search for in this text box, and click the right-arrow button next to it. The Component
list will then be populated with all component names that embed the specified search string. Select the
component of your choice from this list.
4.
To view the data pertaining to a Microsoft SQL server, select the component from the Component list box of
Figure 8.1. If you have too many components to choose from, you can narrow your search further by using the
Filter by text box. Specify the whole/part of the component name to search for in this text box, and click the
right-arrow button next to it. The Component list will then be populated with all component names that embed
the specified search string. Select the component of your choice from this list.
Figure 8.1: Generating a Snapshot report for a chosen component
5.
Next, using the Timeline option, specify the period to which the snapshot report should pertain.
221
Snapshot Reports
For every user registered with the eG Enterprise system, the administrator can indicate the
maximum timeline for which that user can generate a report. Once the maximum timeline is
set for a user, then, whenever that user logs into eG Reporter and attempts to generate a
report, the Timeline list box in the report page will display options according to the maximum
timeline setting of that user. For instance, if a user can generate a report for a maximum
period of 3 days only, then 3 days will be the highest option displayed in the Timeline list i.e., 3 days will be the last option in the fixed Timeline list. Similarly, if the user chooses the
Any option from the Timeline list and proceeds to provide a start date and end date for
report generation using the From and To specifications, eG Enterprise will first check if the
user's Timeline specification conforms to his/her maximum timeline setting. If not, report
generation will fail. For instance, for a user who is allowed to generate reports spanning over
a maximum period of 3 days only, the difference between the From and To dates should
never be over 3 days. If it is, then, upon clicking the Run Report button a message box will
appear, prompting the user to change the From and To specification.
6.
In addition to the settings discussed above, this report comes with a set of default specifications. These settings
are hidden by default. If you do not want to disturb these default settings, then you can proceed to generate
the report by clicking the RUN REPORT BUTTON soon after you pick a Component. However, if you want to view
and then alter these settings (if required), click on the
button. The MORE OPTIONS drop down window will
then appear with the default settings as shown in Figure 8.2. The steps below discuss each of these settings
and how they can be customized.
Figure 8.2: The default settings for generating a Snapshot report for a chosen component
7.
Now, select the test/tests for which a snapshot report is to be generated. Since our example involves
assessment of the overall performance of the chosen component, select all the tests from the Tests list (see
Figure 8.2). If the Tests list consists of too many tests, then viewing all the tests and selecting the ones you
need for report generation could require endless scrolling. To avoid this, you can click the
button next to
the Tests list. This will expand the Tests list in the Tests pop up window (see Figure 8.3) using which you can
view almost all the tests in a single interface and select the ones for which the report is to be generated.
222
Snapshot Reports
Figure 8.3: The Tests pop up window
8.
If one/more of the chosen tests support descriptors, then, you can configure the snapshot report to display the
historical information related to specific descriptors alone. For this, specify the whole/part of the descriptor
name to search for in the Descriptor Search text box. The report in this case will display the historical measures
of only those tests that support descriptors with names that embed the specified Descriptor Search string.
9.
By default, the snapshot report displays all the metrics that were reported by the chosen tests during the given
timeline, regardless of the state of the measures. This is why, the All option is chosen by default from the State
list. If need be, you can have the report display the metrics of a particular state alone or a combination of
states. For that, pick an option from the State list. The options provided by this list are as follows:
Critical & Major
Critical & Major & Minor
Critical
Major
Minor
Abnormal - if this option is chosen, then, measures that are of Critical, Major, Minor, and Unknown states
will be displayed.
Normal
Unknown
10.
In large environments, reports generated using months of data can take a long time to complete.
Administrators now have the option of generating reports on-line or in the background. When a report is
scheduled for background generation, administrators can proceed with their other monitoring, diagnosis, and
reporting tasks, while the eG manager is processing the report. This saves the administrator valuable time. To
schedule background processing of a report, select the Background Save - PDF option from the Report
Generation list. In this case, a Report Name text box will appear, where you would have to provide the name
with which the report is to be saved in the background. To process reports in the foreground, select the
Foreground Generation - HTML option from this list.
223
Snapshot Reports
The Report Generation list will appear only if the EnableBackgroundReport flag in
the [BACKGROUND_PROCESS] section of the eg_report.ini file (in the
{EG_INSTALL_DIR}\manager\config directory) is set to Yes.
The default selection in the Report Generation list will change according to the
Timeline specified for the report. If the Timeline set is greater than or equal to the
number of days specified against the MinDurationForReport parameter in the
[BACKGROUND_PROCESS] section of the eg_report.ini file, then the default selection
in the Report Generation list will be Background. On the other hand, if the Timeline
set for the report is lesser than the value of the MinDurationForReport parameter,
then the default selection in the Report Generation list will be Foreground. This is
because, the MinDurationForReport setting governs when reports are to be
processed in the background. By default, this parameter is set to 2 weeks - this
indicates that by default, reports with a timeline of 2 weeks and above will be
processed in the background.
11.
Finally, click on the Run Report button in Figure 8.1.
12.
Figure 8.4 displays a snapshot report that focuses on only those measures that were in an Abnormal state
during the chosen timeline.
224
Snapshot Reports
Figure 8.4: The Snapshot report of a chosen component displaying metrics of an Abnormal state
13.
If the Report Generation mode is set to Foreground Generation - HTML, then critical information pertaining to
each of the tests executing on the Microsft SQL server will then appear (see Figure 8.4). Such information
includes:
The Measure name
A low watermark of the measure during the specified period
A high watermark of the measure during the specified period
225
Snapshot Reports
The average measure value
The total number of measurements
The percentage of normal, critical, major, minor, and unknown measurements during the specified period
14.
The measure name will be prefixed by an indicator of the state of the measure during the specified period. The
state can be: Critical, Major, Minor, Normal, and Unknown. eG Enterprise determines the state of a measure
during the given period, by applying the following norms:
If the Critical % of the measure is greater than 0, then the state of the measure is Critical (
).
If the Critical % of the measure is 0, but the Major % is greater than 0, then the state of the measure is
Major (
).
If the Critical and Major percentages are 0, but the Minor % is greater than 0, then the state of the
measure is Minor (
).
If the Critical, Major, and Minor percentages are 0, but the Unknown % is greater than 50, then the state of
the measure is Unknown (
)
If the Normal % is 100%, then the state of the measure is Normal (
).
For example, take the case of the Max Cursor opentime measure of the SQL Open Cursors in Figure 8.4 above.
In this case, note that though the Normal % of the measure is 7%, the state of the measure is Critical. This is
because, the Critical % of the measure is 90.9 (which is greater than 0).
15.
Clicking on the
button against a measure will invoke a graph of the measure for the stated period.
16.
Similarly, clicking on the Data button will provide the values that have been plotted on the graph. Here, values
that have violated the set thresholds will be highlighted. While a value that has fallen below the threshold will
be accompanied by a down arrow icon, the value that has exceeded the threshold will be accompanied by an
up arrow icon.
17.
Clicking on the
icon against a measure will provide you with detailed measures, which throw more light on
the indicated problem condition.
18.
On the other hand, if the Background Save - PDF option is chosen from the Report Generation list, then clicking
on the RUN REPORT BUTTON will not generate the report and display it in this page for your benefit. Instead, a
message indicating that the report is being processed in the background will appear. This will be accompanied
by a link that will lead you to the page that lists all the reports that are being processed in the background, and
their current status. If background report generation fails for a report, you can regenerate that report using this
page, or can even delete that report if need be. On the other hand, if background processing successfully
completes for your report, then, you can view a PDF of the report by clicking on the
icon in that page.
8.2 Tests Snapshot Reports
The Analysis by Test option allows users to view the information pertaining to a single/multiple components on which
a particular test executes. For example, to assess the availability and resource usage of critical host-level processes
across the environment, do the following:
1.
Select the Analysis by Test option from the Measurement Snapshot node of the REPORTS BY FUNCTION tree.
2.
Figure 8.5 will then appear.
226
Snapshot Reports
Figure 8.5: Generating a Snapshot report for a chosen test
3.
Administrators of large IT infrastructures, which are characterized by hundreds of components, may find it
difficult to pick and choose the components for which a report is to be generated; this is because, in such
environments, the Components list in this page will be populated with a large number of components, which
would naturally make component selection tough. To enable administrators of such environments to quickly
locate the components of interest to them and swiftly generate the reports, eG Enterprise provides a Report For
list that consists of a variety of filter options. By default, the Component option is chosen from this list (see
Figure 8.5) - this indicates that all the managed components of a chosen type will be available for selection in
the Components list by default. In addition to this, the Report For list provides the following filter options as
well:
o
Service: If the component for which a report is to be generated is involved in the delivery of a particular
service, then pick this option from the Report For list. Doing so will invoke a Service list from which a
service name is to be chosen. Upon selection of a service, the component types that are part of the service
will populate the ComponentType list in this page. Once you pick a component type, all components of that
type, which are engaged in the delivery of the chosen service, will be displayed as candidates for selection
in the Components list (see Figure 8.6). If there are still too many components in the list to choose from,
you can narrow your search further by using the Search text box. Specify the whole/part of the component
name to search for in this text box, and click the
icon next to it. The Components list will then be
populated with all component names that embed the specified search string. Select the component of your
choice from this list.
o
Segment: If the components for which a report is to be generated is part of a segment, pick the Segment
option from the Report For list. Then, select the segment of interest to you from the Segment list. This will
populate the ComponentType list with the types of components that are part of the chosen segment. If you
select a component type from the ComponentType list, then, all components of that type, which are part of
the chosen segment, will be displayed in the Components list for selection (see Figure 8.6). If there are still
too many components in the list to choose from, you can narrow your search further by using the Search
text box. Specify the whole/part of the component name to search for in this text box, and click the
icon next to it. The Components list will then be populated with all component names that embed the
specified search string. Select the component of your choice from this list.
o
Zone: If the components for which a report is to be generated is part of a zone, pick the Zone option from
the Report For list. To include sub-zones also in your search for components, set the Include SubZones flag
to Yes. Then, select the zone of interest to you from the Zone list. This will populate the ComponentType
list with the types of components that are part of the chosen zone. If you select a component type from
the ComponentType list, then, all components of that type, which are part of the chosen zone, will be
displayed in the Components list for selection (See Figure 8.6). If there are too many components in the
list to choose from, you can narrow your search further by using the Search text box. Specify the
whole/part of the component name to search for in this text box, and click the
icon next to it. The
Components list will then be populated with all component names that embed the specified search string.
Select the component of your choice from this list.
4.
To view the data pertaining to process performance across component types, select Processes from the Tests
list box of Figure 8.7 and select the All option from the ComponentType list.
5.
Next, using the Timeline option, specify the period to which the snapshot report should pertain.
227
Snapshot Reports
For every user registered with the eG Enterprise system, the administrator can indicate the
maximum timeline for which that user can generate a report. Once the maximum timeline is
set for a user, then, whenever that user logs into eG Reporter and attempts to generate a
report, the Timeline list box in the report page will display options according to the maximum
timeline setting of that user. For instance, if a user can generate a report for a maximum
period of 3 days only, then 3 days will be the highest option displayed in the Timeline list i.e., 3 days will be the last option in the fixed Timeline list. Similarly, if the user chooses the
Any option from the Timeline list and proceeds to provide a start date and end date for
report generation using the From and To specifications, eG Enterprise will first check if the
user's Timeline specification conforms to his/her maximum timeline setting. If not, report
generation will fail. For instance, for a user who is allowed to generate reports spanning over
a maximum period of 3 days only, the difference between the From and To dates should
never be over 3 days. If it is, then, upon clicking the Run Report button a message box will
appear, prompting the user to change the From and To specification.
6.
In addition to the settings discussed above, this report comes with a set of default specifications. These settings
are hidden by default. If you do not want to disturb these default settings, then you can proceed to generate
the report by clicking the RUN REPORT BUTTON soon after you pick a Component Type. However, if you want to
view and then alter these settings (if required), click on the
button. The MORE OPTIONS drop down window
will then appear with the default settings as shown in Figure 8.6. The steps below discuss each of these
settings and how they can be customized.
Figure 8.6: The default settings for generating a snapshot report for a chosen test
7.
Select the Components for which the Processes test information is required (see Figure 8.6). If the Components
list consists of too many components, then viewing all the components and selecting the ones you need for
report generation could require endless scrolling. To avoid this, you can click the
button next to the
Components list.The COMPONENTS pop up window will then appear using which you can view almost all the
components in a single interface and select the ones for which the report is to be generated.
228
Snapshot Reports
8.
By default, the snapshot report displays all the metrics that were reported by the chosen test during the given
timeline, regardless of the state of the measures. This is why, the All option is chosen by default from the State
list. If need be, you can have the report display the metrics of a particular state alone or a combination of
states. For that, pick any other option from the State list. The options provided by this list are as follows:
Critical & Major
Critical & Major & Minor
Critical
Major
Minor
Abnormal - if this option is chosen, then, measures that are of Critical, Major, Minor, and Unknown states
will be displayed.
Normal
Unknown
9.
Figure 8.7 displays a snapshot report that focuses on only those measures that were of a Critical state during
the chosen timeline.
Figure 8.7: The Tests Snapshot report displaying metrics in the Critical state alone
10.
You can optionally configure the snapshot report to display the historical information related to specific
descriptors alone. For this, specify the whole/part of the descriptor name to search for in the Descriptor Search
text box (see Figure 8.6). The report in this case will display the historical measures of only those descriptors
with names that embed the specified Descriptor Search string.
11.
In large environments, reports generated using months of data can take a long time to complete.
Administrators now have the option of generating reports on-line or in the background. When a report is
229
Snapshot Reports
scheduled for background generation, administrators can proceed with their other monitoring, diagnosis, and
reporting tasks, while the eG manager is processing the report. This saves the administrator valuable time. To
schedule background processing of a report, select the Background Save - PDF option from the Report
Generation list. In this case, a Report Name text box will appear, where you would have to provide the name
with which the report is to be saved in the background. To process reports in the foreground, select the
Foreground Generation - HTML option from this list.
The Report Generation list will appear only if the EnableBackgroundReport flag in
the [BACKGROUND_PROCESS] section of the eg_report.ini file (in the
{EG_INSTALL_DIR}\manager\config directory) is set to Yes.
The default selection in the Report Generation list will change according to the
Timeline specified for the report. If the Timeline set is greater than or equal to the
number of days specified against the MinDurationForReport parameter in the
[BACKGROUND_PROCESS] section of the eg_report.ini file, then the default selection
in the Report Generation list will be Background. On the other hand, if the Timeline
set for the report is lesser than the value of the MinDurationForReport parameter,
then the default selection in the Report Generation list will be Foreground. This is
because, the MinDurationForReport setting governs when reports are to be
processed in the background. By default, this parameter is set to 2 weeks - this
indicates that by default, reports with a timeline of 2 weeks and above will be
processed in the background.
12.
Finally, click on the Run Report button in Figure 8.5.
13.
If the Report Generation mode is set to Foreground Generation - HTML, then, clicking on the Run Report button
will reveal Figure 8.8.
230
Snapshot Reports
Figure 8.8: The Snapshot Report for a chosen test
14.
The critical information pertaining to the Processes test of each of the selected components will then appear
(see Figure 8.8). Such information includes
The Measure name
A low watermark of the measure during the specified period
A high watermark of the measure during the specified period
The average measure value
The total number of measurements
The percentage of normal, critical, major, minor, and unknown measurements during the specified period
15.
The measure name will be prefixed by an indicator of the state of the measure during the specified period. The
state can be: Critical, Major, Minor, Normal, and Unknown. eG Enterprise determines the state of a measure
during the given period, by applying the following norms:
If the Critical % of the measure is greater than 0, then the state of the measure is Critical (
).
If the Critical % of the measure is 0, but the Major % is greater than 0, then the state of the measure is
Major (
).
If the Critical and Major percentages are 0, but the Minor % is greater than 0, then the state of the
measure is Minor (
).
If the Critical, Major, and Minor percentages are 0, but the Unknown % is greater than 50, then the state of
the measure is Unknown (
).
If the Normal % is 100%, then the state of the measure is Normal (
231
).
Snapshot Reports
16.
Clicking on the
button against a measure will invoke a graph of the measure for the stated period.
17.
Similarly, clicking on the Data button against a measure will provide the values that have been plotted on the
graph. Here, values that have violated the set thresholds will be highlighted. While a value that has fallen below
the threshold will be accompanied by a down arrow icon, the value that has exceeded the threshold will be
accompanied by an up arrow icon (see Figure 8.9).
Figure 8.9: Snapshot Data
18.
On the other hand, if the Background Save - PDF option is chosen from the Report Generation list, then clicking
on the Run Report button will not generate the report and display it in this page for your benefit. Instead, a
message indicating that the report is being processed in the background will appear. This will be accompanied
by a link that will lead you to the page that lists all the reports that are being processed in the background, and
their current status. If background report generation fails for a report, you can regenerate that report using this
page, or can even delete that report if need be. On the other hand, if background processing successfully
completes for your report, then, you can view a PDF of the report by clicking on the
icon in that page.
Snapshot reports (both Components and Tests) perform state computations using the
metrics reported by the tests during the chosen period.
232
Virtualization Reports
Virtualization Reports
As the virtualization technology helps enterprises greatly in conserving space and resources, the last decade
witnessed many enterprises virtualize their mission-critical service offerings, with the hope of transferring the
reliability of virtualized platforms to their end-user services. Moreover, the recent rise in the popularity of “virtualism”
has resulted in many new platforms invade the virtualization space - the leading players being VMware ESX, Citrix
XenServers, Solaris LDoms, Microsoft HyperV, etc. In order to reap the benefits of each distinct technology,
enterprises too are deploying more than one virtualization platform, thereby increasing the complexity of their service
composition and adding to the administrator’s misery! Hence, administrators these days require a solution that can:
monitor heterogenous virtualized environments efficiently and report sporadic spikes in resource usage;
help perform effective comparative and time-based analysis of resource usage across physical servers
and/or virtual machines on a server, so that problem patterns and problem sources come to light;
In recent times, eG Enterprise has emerged as an undisputed expert in the monitoring and management of a variety
of virtualization platforms, namely: VMware ESX, Citrix XenServers, Solaris Containers, Solaris LDoms, and Microsoft
Virtual Server. While the solution’s In-N-Out monitoring approach captures live the abnormalities in the actual and
relative resource usage of VMs, the exclusive Virtualization report category that the tool provides enables
administrators to perform the following easily and effectively:
oversee the performance of a physical server or a server farm over time;
compare the resource usage across physical servers;
analyze how resource-intensive the VMs on a server are by reviewing its impact on both the physical and
allocated resources;
Towards this end, the Virtualization category offers the following reports.
9.1 Physical Servers – Hypervisor Overview Report
The Physical Servers – Hypervisor Overview report provides deep insights into the performance of a chosen physical
server or a server farm during a specified timeline, and enables administrators to figure out the following:
Is the server adequately sized in terms of resources?
Which physical server in the farm has been consistently consuming resources excessively?
Which physical server in the farm hosts the maximum number of VMs?
Which physical server is the busiest in the farm in terms of disk activity and network traffic handled over
time?
Which physical server in the farm has been the most problem-prone in the given time slot? What were the
top problems encountered by that physical server?
Based on the findings of this report, administrators can prudently plan the future capacity of a physical server or
server farm.
233
Virtualization Reports
To generate this report, do the following:
1.
Follow the menu sequence: REPORTS BY FUNCTION -> Virtualization ->Physical servers -> Hypervisor
Overivew.
2.
Figure 9.1 then appears. For a graphical report, select Graph as the Report Type.
Figure 9.1: Selecting the report criteria for a Physical Servers report
3.
To generate a Physical Servers report, select Physical Servers from the Selection list. Selecting the Virtual
machines option will lead you to the Virtual Machines – Overview report.
4.
The Component Type list displays all the managed virtual component-types – e.g., VMware vSphere ESX, Citrix
XenServer, etc. For a report on ESX servers, select VMware vSphere ESX.
5.
Then, select a criterion for analysis from the Analyze by list box. Using this report, you can analyze the
performance of one/more independent virtualized components, or those that are part of a segment, service, or
a zone. This way, you can assess the impact of the performance of the virtual components on a particular
service/segment/zone’s performance, and accordingly take performance decisions. The options provided by the
Analyze by list box are discussed hereunder:
o
Component: Select this option to choose the component(s) from across all the managed components in the
environment. For instance, for a report on the performance of all the managed vSphere/ESX hosts in the
environment, select VMware vSphere ESX from the Component Type list, select Component from the
Analyze by list, and then select all the virtual hosts listed in the Components list of Figure 9.1.
6.
o
Service: Select this option if the components for which a report is to be generated are involved in the
delivery of a business service. Then, select a Service.
o
Segment: Choose this option if the virtual hosts to be evaluated are part of a segment. Then, pick a
Segment for analysis.
o
Zone: Pick this option for a report on the performance of virtual components that are included in a zone.
Then, choose a Zone.
If the Components list consists of too many components, then viewing all the components and selecting the
ones you need for report generation could require endless scrolling. To avoid this, you can click the
button
next to the Components list. This will expand the Components list so that you can view almost all the
components in a single interface and select the ones for which the report is to be generated.
7.
Typically, for a Data report, users can configure the measures that need to feature in the report and the
functions (eg., Avg, Max, etc.) to be applied on them. However, if the Report Type chosen is Graph, you will be
required to select the Measure for which the graph is to be generated. For instance, to assess how the
managed physical ESX servers in the environment use the CPU resources available to them, choose CPU Esx/Physical CPU utilization measure from the Measure list. The Graph report that then appears reveals the top
CPU consumers in the chosen component-list.
8.
Then, specify the Timeline for the graph. You can either provide a fixed time line such as 1 hour, 2 days, etc.,
234
Virtualization Reports
or select the Any option from the list to provide a From and To date/time for report generation.
For every user registered with the eG Enterprise system, the administrator can indicate the
maximum timeline for which that user can generate a report. Once the maximum timeline is
set for a user, then, whenever that user logs into eG Reporter and attempts to generate a
report, the Timeline list box in the report page will display options according to the maximum
timeline setting of that user. For instance, if a user can generate a report for a maximum
period of 3 days only, then 3 days will be the highest option displayed in the Timeline list i.e., 3 days will be the last option in the fixed Timeline list. Similarly, if the user chooses the
Any option from the Timeline list and proceeds to provide a start date and end date for
report generation using the From and To specifications, eG Enterprise will first check if the
user's Timeline specification conforms to his/her maximum timeline setting. If not, report
generation will fail. For instance, for a user who is allowed to generate reports spanning over
a maximum period of 3 days only, the difference between the From and To dates should
never be over 3 days. If it is, then, upon clicking the Run Report button a message box will
appear, prompting the user to change the From and To specification.
9.
In addition to the settings discussed above, this report comes with a set of default specifications. These settings
are hidden by default. If you do not want to disturb these default settings, then you can proceed to generate
the report by clicking the Run Report button soon after you pick a Component. However, if you want to view
and then alter these settings (if required), click on the
button. The default settings will then appear in the
MORE OPTIONS drop down window (see Figure 9.2). The steps below discuss each of these settings and how
they can be customized.
Figure 9.2: The default settings for generating the Physical Servers – Hypervisor Overview Report
10.
The speed with which a report is generated depends primarily on the report Timeline. While a Timeline that
varies between a couple of days to a week enables the eG Enterprise system to quickly retrieve the required
data, timelines that span multiple weeks/months could slow-down the data retrieval and report generation
process to a considerable extent, owing to the volume of data involved. In order to ensure quick and easy
235
Virtualization Reports
access to reports, eG Enterprise provides you the option of enabling data retrieval from the Trend information in
the database, instead of the Detailed test information that is used by default for report generation. The Detailed
test information based comprises of multiple measurement records for a test - one or more each for every test
execution. Whereas, the Trend information includes only hourly, daily, and monthly summary computations for
a test performed on a continuous basis. For instance, during a period of 1 hour, a test that runs every 5
minutes inserts atleast 12 records into the Detailed test information base. On the other hand, the Trend
information base would consist of only 1 record for the same 1 hour period. Fewer the number of records,
query execution becomes much quicker, and data retrieval faster. To use the trend data for report generation,
you will have to select the Trend option from the Show Data field in Figure 9.2. By default, the Detailed option is
selected in Figure 9.2 indicating that the report data is retrieved from the detailed test information in the
database. If need be, you can also ensure that all reports always use the Detailed test tables alone by hiding
the Show Data field from the reporter interface. To achieve this, do the following:
Login to the eG administrative interface as 'admin'.
Select the Manager option from the Settings tile that appears when the
clicked.
From the GENERAL SETTINGS page that then appears, if you set the Compute average/sum of metrics
while trending flag to No, then the Show Data field will not appear in the reporter interface; this denies
users access to the Trend option, and thus ensures that reports are always generated using the Detailed
tables.
236
button against the Admin tab is
Virtualization Reports
A Trend report will not include the data for the current day since trend data is only
computed at the end of the day.
If the Trend option is chosen, the time period of the report should be greater than 1
day.
The usage of Detailed test tables for generating reports, especially those that span
weeks, increases the stress on the eG database, thus resulting in undue delays in report
generation. In order to ensure that the database is not choked by such voluminous data
requests, you can configure eG Enterprise to automatically "force" the use of the Trend
option if the Timeline of a report exceeds a pre-configured duration. To specify this time
boundary, do the following:
o
Edit the eg_report.ini file in the <EG_INSTALL_DIR>\manager\config directory.
o
In the [MISC] section of the file, you will find a DetailedTime parameter.
o
Specify the duration (in days) beyond which Detailed reports cannot be generated,
against the DetailedTime parameter, and save the eg_report.ini file.
o
For instance, to make sure that Detailed reports are disallowed for a Timeline of
over 2 weeks, set the DetailedTime parameter to 14 and save the file.
o
Say, subsequently, you attempt to generate a Detailed report for a Fixed Timeline
of 3 weeks (which is greater than the 14-day limit set in our example). The instant
you select the 3 weeks option from the Fixed list box, the Detailed option gets
automatically disabled, and the Trend option gets enabled. Similarly, if you specify
an Any Timeline that runs over 14 days, then, upon clicking the RUN REPORT
BUTTON to generate the report, a message box appears (see Figure 5.8) informing
you that only the Trend option is permitted.
o
To proceed with the Trend report generation, click the OK button in the message
box. To terminate Trend report generation, click the CANCEL button.
11.
To indicate how many of the top/least resource users the resulting graph should depict, so as not to clutter the
display, select an option from the Show list.
12.
If the timeline specified for the report needs to exclude the data collected during the Weekends, then set
Exclude weekends to Yes. If not, select No.
13.
Next, indicate the report Timeperiod.
14.
In large environments, reports generated using months of data can take a long time to complete.
Administrators now have the option of generating reports on-line or in the background. When a report is
scheduled for background generation, administrators can proceed with their other monitoring, diagnosis, and
reporting tasks, while the eG manager is processing the report. This saves the administrator valuable time. To
schedule background processing of a report, select the Background Save - PDF option from the Report
Generation list. In this case, a Report Name text box will appear, where you would have to provide the name
with which the report is to be saved in the background. To process reports in the foreground, select the
Foreground Generation - HTML option from this list.
237
Virtualization Reports
The Report Generation list will appear only if the EnableBackgroundReport flag in
the [BACKGROUND_PROCESS] section of the eg_report.ini file (in the
{EG_INSTALL_DIR}\manager\config directory) is set to Yes.
The default selection in the Report Generation list will change according to the
Timeline specified for the report. If the Timeline set is greater than or equal to the
number of days specified against the MinDurationForReport parameter in the
[BACKGROUND_PROCESS] section of the eg_report.ini file, then the default selection
in the Report Generation list will be Background. On the other hand, if the Timeline
set for the report is lesser than the value of the MinDurationForReport parameter,
then the default selection in the Report Generation list will be Foreground. This is
because, the MinDurationForReport setting governs when reports are to be
processed in the background. By default, this parameter is set to 2 weeks - this
indicates that by default, reports with a timeline of 2 weeks and above will be
processed in the background.
15.
Finally, click the Run Report button.
16.
If the Report Type is Graph and the option chosen from the Report Generation list is Foreground Generation HTML, then, clicking on the RUN REPORT button will invoke Figure 9.3.
Figure 9.3: A Physical Servers – Hypervisor Overview report
17.
If the Report Type is Graph, then Figure 9.3 will appear comprising of the following:
A distribution pie chart that reveals the number of components in different distribution ranges (see Figure
9.3). The distribution ranges are obtained by applying the first of the configured functions for the chosen
Measure. For instance, assume that Registered VMs is the chosen Measure. Say that you have configured
to display the Avg and Max of Registered VMs in a Data report. Typically, both these configured values will
appear only in the Data report. In the case of a Graph report however, the first of the two functions - i.e.,
Avg of Registered VMs - alone is calculated for every component of the chosen component-type. The
238
Virtualization Reports
resulting pie chart enables administrators to determine, at a glance, which managed physical ESX servers
in the environment have been configured with the maximum number of guests. Clicking on a particular
slice in the pie chart lists the components that fall within the value range represented by that slice (see
Figure 9.4). Against every component name, the actual values for each of the configured functions (both
Avg and Max, in our example), and also the Health % of each of the components will be displayed. A
zone/segment/service/component-type-level Summary of the chosen Measure and the Health % will also
be available.
Figure 9.4: A list of components with Physical CPU utilization in a given range
By default, the chart type for distribution is a pie chart. However, you can have a bar graph
depict the same data instead of a pie chart, by following the steps given below:
Edit the eg_report.ini file in the <EG_INSTALL_DIR>\manager\config directory.
Change the value of the chartTypeForDist parameter in the [VIRTUAL_HOST] section
of this file from the default Pie, to Bar.
Save the eg_report.ini file.
By default, the number of value ranges that need to be configured for the
distribution chart is 10. To override this default setting, do the following:
Edit the eg_report.ini file in the <EG_INSTALL_DIR>\manager\config directory.
Specify a number of your choice against the nofRangeForDist parameter in the
[VIRTUAL_HOST] section of this file. By default, this parameter will hold the value 10.
Save the eg_report.ini file.
239
Virtualization Reports
Adjacent to the pie chart, you will find a bar chart that indicates the components that have topped/failed in
a selected performance realm (i.e., the Measure) during the specified Timeline. For example, for the
Registered guests measure, this bar chart reveals the components that are the loaded with guests. Like the
pie chart, the values for the bar chart are also calculated by applying the first of the configured functions
on the chosen Measure. Clicking on the bar corresponding to a server name results in a Server Report (see
Figure 9.5) that enables you to focus on the performance of that server.
Figure 9.5: The server report that appears upon clicking on a bar chart in the Physical Servers report
You can configure the colors to be used in the distribution chart and the Top <N>
Components bar chart in the zone report, by editing the eg_report.ini file in the
<EG_INSTALL_DIR>\manager\config directory. The [VIRTUAL_HOST] section of the file defines
the 20 default colors of the distribution and bar charts:
[VIRTUAL_HOST]
ChartColor=#8399b0,#ffd95a,#a4ac91,#98d980,#d5b996,#f48848,#8b8cc2,
#eb4052,#c4b3d0,#b18651,#ebb7ce,#028768,#f5c372,#887c65,#e4c536,
#b5582c,#f94989,#770d72,#97a067,#89aeb7
distColor=#115fa6,#f25454,#60bd68,#b276b2,#81bef7,#a61120,#ffd13e,
#770d72,#887c65,#a4ac91
You override the default color settings of the distribution chart by modifying the color-codes
specifying against distColor. For changing the colors used by the Top <N> Components chart,
alter the codes listed against the ChartColor parameter.
240
Virtualization Reports
The number of components to be displayed in the Top <N> Components bar chart
is configurable. To specify the number, do the following:
Edit the eg_report.ini file in the <EG_INSTALL_DIR>\manager\config directory.
Specify a number of your choice against the NoOfServersforChart parameter in the
[VIRTUAL_HOST] section of the file. By default, the value displayed here is 10,
indicating that, by default, the bar chart will be for the Top 10 Components. For
example, if you change this value to 5, then a bar chart displaying the Top 5
Components will appear. This configuration governs the options listed in the Show
field in Figure 9.1.
Finally, save the eg_report.ini file.
18.
Unlike a Graph report, a Data report does not graphically represent the measure data. Instead, the configured
details are presented in a tabular format in the report.
19.
If the Report Type is Data, then clicking the Run Report button will invoke Figure 9.6.
20.
The Data report will display multiple values for a measure depending upon the number and type of functions
that have been configured for the measure (see Figure 9.6).
Figure 9.6: A Physical Servers – Hypervisor Overview Data Report
21.
The first row of the Data report displays a Summary of the performance of all the servers that have been
chosen for the report. Below this row, server-wise performance details will appear. These details together
provide users with an overview of the health of the ESX server farm.
22.
Besides user-configured measures, the Data report also contains a Health % column. For the Summary row, this
column indicates the overall health of the chosen virtual servers. For each server, this column indicates the
percentage of time a particular server has been in the Normal state during the chosen timeline. If a server has
remained the constant victim of problems during the specified time period, then this percentage will obviously
be low. To drill down to the root-cause of the issues affecting the server, click on the corresponding Health %
value. This will lead you to the Executive report of the problem server, which will reveal when and what type of
problems were encountered by the server (see Figure 9.7).
241
Virtualization Reports
Figure 9.7: An Executive report of a virtual host
23.
Also, to focus on the health of a particular server displayed in the Data report, click on the corresponding Server
name in (see Figure 9.6). The Server Report will then appear (see Figure 9.8).
Figure 9.8: The Server report of the problem server
24.
If the Background Save - PDF option is chosen from the Report Generation list, then clicking on the Run Report
button will not generate the report and display it in this page for your benefit. Instead, a message indicating
that the report is being processed in the background will appear. This will be accompanied by a link that will
lead you to the page that lists all the reports that are being processed in the background, and their current
status. If background report generation fails for a report, you can regenerate that report using this page, or can
even delete that report if need be. On the other hand, if background processing successfully completes for your
report, then, you can view a PDF of the report by clicking on the
25.
icon in that page.
To save you the trouble of scrolling up the report everytime you want the review the report criteria, eG
242
Virtualization Reports
Reporter now includes a separate section with the summary of your report specification. By default, this
section appears with a
button. Clicking on this button (see Figure 9.9) before the report; will expand the
report specification using which you can view/modify the criteria specified for generating the report.
Figure 9.9: A summary of the report criteria
As stated earlier, you can configure the information that needs to appear in the Physical Servers report, by editing
the eg_report.ini file in the <EG_INSTALL_DIR>\manager\config directory. For example, to generate the report depicted
by Figure 9.6, specify the following in the [VIRTUAL_HOST] section of the eg_report.ini file:
[VIRTUAL_HOST]
EsxGuestStatusTest:Registered_guests#Registered VMs=Avg
EsxGuestStatusTest:Guests_powered_on#Powered On VMs=Avg,Max
EsxMemoryTest:Memory_consumed#Consumed Memory=Avg
EsxMemoryTest:Pct_free_memory#Free Memory=Avg
EsxCpuTest:Usage#CPU Usage=Avg
EsxDiskUsageTest:Percent_usage#Disk Usage=Avg
EsxDiskTest:Issued_commands#Disk Commands=Avg
EsxDiskTest:Commands_aborted#Disk Command Aborts=Avg
EsxNetworkTest:Data_transmitted#Network Traffic Out=Avg
EsxNetworkTest:Data_received#Network Traffic In=Avg
EsxNetworkTest:Usage#Network Usage=Avg
Typically, measure configurations in the [VIRTUAL_HOST] section of the eg_report.ini file should be of the following
format:
<InternalTest>:<InternalMeasure>#<Display name of measure>=<Comma-separated list of functions>
Before proceeding with the configuring, determine the internal component type, test, and measure names, using the
procedure discussed in Page 212 of this manual.
Accordingly, in the first line of the example above:
EsxGuestStatusTest is the <InternalTest> that reports the measure of interest to us
Registered_guests is the <InternalMeasure> that is to be displayed in the report page
The display name of the measure is Registered VMs, and finally,
Avg is the function that is to be executed on the value of the Registered_guests measure
The other measures that have been configured are: Guests_powered_on, Memory_consumed,
Pct_free_memory, CPU usage, Percent_usage,
Data_transmitted, Data_received, Network usage.
Issued_commands,
Commands_aborted,
This indicates for each chosen physical server, the following values will be displayed in the report:
The average number of registered VMs
The average and maximum number of powered-on VMs
The average of memory consumed
The average of free memory
The average of CPU usage
243
Virtualization Reports
The average of disk usage
The average number of disk commands issued
The average of number of disk commands aborted
The average of outgoing network traffic
The average of incoming network traffic
The average of network usage
If functions such as Avg, Max, etc., are not explicitly configured in the
[VIRTUAL_GUEST] section in the manner discussed above, then report will, by
default, display the average (Avg) values for the configured measures.
If a display name is not provided for a measure, then the actual measure name will
automatically become the display name.
9.2 Physical Servers - Resources Report
This report provides deep insights into the resource utilization of the physical servers on a day-to-day basis as well as
on a monthly basis. Using this report, the administrators can easily figure out the following:
How well the CPU of the physical server has been utilized over a period of time? Is it under-utilized or overutilized?
Has the maximum CPU utilization limit reached?
How well the memory of the physical server has been utilized? Are adequate memory resources available?
What is the network usage of the physical server? Is the network available to the physical server?
How well the disk of the physical server is utilized? Is it adequately sized or if additional disk is required for
the storage activity of the physical server?
To generate the Physical Servers - Resources report, do the following:
1.
Follow the menu sequence: REPORTS BY FUNCTION -> Virtualization ->Physical Servers -> Hypervisor
Resources.
2.
Figure 9.10 now appears. First, select a criterion for analysis from the Report For list box. Using this report, you
can view the resource utilization of independent physical servers or those that are part of a segment, service, or
a zone. The options provided by the Report For list box are discussed hereunder:
o
Component: Select this option to choose the component(s) from across all the managed components in the
environment. For instance, for a report on the resource utilization of the managed vSphere/ESX hosts in
the environment, select VMware vSphere ESX from the Component Type list, select Component from the
Report For list, and then select all the virtual hosts listed in the Component list of Figure 9.10. If the
Component list consists of too many components, then viewing all the components and selecting the ones
you need for report generation could require endless scrolling. To avoid this, you can click the
button
next to the Component list. The COMPONENTS pop up window will then appear using which you can view
almost all the components in a single interface and select the ones for which the report is to be generated.
244
Virtualization Reports
o
Service: Select this option to generate the report for all components that are involved in the delivery of a
business service. Then, select a Service.
o
Segment: Choose this option if the virtual hosts to be evaluated are configured on the virtual hosts that are
part of a segment. Then, pick a Segment for analysis.
o
Zone: Pick this option for a report on the status of the components managed on all virtual hosts that are
included in a zone. Then, choose a Zone. Also, indicate whether the virtual servers present within the subzones of the chosen zone are also to be considered for report generation, by selecting an option from the
Include Subzones list.
Figure 9.10: Selecting the criteria for the Physical Servers - Resources report
3.
Next, from the Component Type list, pick the component type for which the report is to be generated. By
default, all managed component types in your environment will be listed here.
4.
Based on the criterion chosen from the Report For list, the Components list will be populated. Select one/more
of the listed components to generate a report. If the Components list consists of too many components, then
viewing all the components and selecting the ones you need for report generation could require endless
scrolling. To avoid this, you can click the
icon next to the Components list. The COMPONENTS pop up
window will then appear using which you can view almost all the components in a single interface and select
the ones for which the report is to be generated.
5.
Pick an option from the Criteria list box for which the report is to be generated. By default, this report enables
you to figure out the CPU utilization, Memory utilization and Network usage of the chosen component. If the
chosen component is VMware vSphere ESX as in Figure 9.10, then the report will be generated for the storage
activity of the component as well. By default, all the options i.e., CPU, Memory, Network listed in this list box
will be selected. If you wish to view the report for a single Criteria of your choice, you may just select that
criteria alone from this list box.
6.
In large environments, reports generated using months of data can take a long time to complete.
Administrators now have the option of generating reports on-line or in the background. When a report is
scheduled for background generation, administrators can proceed with their other monitoring, diagnosis, and
reporting tasks, while the eG manager is processing the report. This saves the administrator valuable time. To
schedule background processing of a report, select the Background Save - PDF option from the Report
Generation list. In this case, a Report Name text box will appear, where you would have to provide the name
with which the report is to be saved in the background. To process reports in the foreground, select the
Foreground Generation - HTML option from this list.
245
Virtualization Reports
7.
The Report Generation list will appear only if the EnableBackgroundReport flag in
the [BACKGROUND_PROCESS] section of the eg_report.ini file (in the
{EG_INSTALL_DIR}\manager\config directory) is set to Yes.
The default selection in the Report Generation list will change according to the
Timeline specified for the report. If the Timeline set is greater than or equal to the
number of days specified against the MinDurationForReport parameter in the
[BACKGROUND_PROCESS] section of the eg_report.ini file, then the default selection
in the Report Generation list will be Background. On the other hand, if the Timeline
set for the report is lesser than the value of the MinDurationForReport parameter,
then the default selection in the Report Generation list will be Foreground. This is
because, the MinDurationForReport setting governs when reports are to be
processed in the background. By default, this parameter is set to 2 weeks - this
indicates that by default, reports with a timeline of 2 weeks and above will be
processed in the background.
Finally, click the Run Report button. Figure 9.11 will now appear.
246
Virtualization Reports
Figure 9.11: The Physical Servers - Resources report
247
Virtualization Reports
8.
9.
Figure 9.11 shows a graphical report on the utilization of various resources of the chosen component. This
report provides you with the resource utilization of the component on a day-to-day basis and on a monthly
basis. Using this report, you can easily identify, on which particular day/month the resource has been overutilized/under-utilized. In addition to this, you can also view the thresholds set for the measure from the graph.
Suppose if the Critical/Major/Minor thresholds are set for the Overall physical CPU utilization measure, then the
threshold limits will be displayed as colored dots for the measure in both the daily report and the monthly
report. When you mouse over the colored dots on a daily graph report, you will get to see the exact date and
threshold for that measure on that day. Likewise, when you mouse over the threshold limit on a monthly graph,
you will view the average threshold for that measure during the chosen month. In places where thresholds are
not applicable, say for e.g., the Minimum/Maximum Used physical memory graph, the total physical memory of
the component is specified in the graph as against the threshold values.
By default, the number of days and number of months for which the graph is
generated is 30 and 12 respectively. To override this default setting, do the
following:
Edit the eg_report.ini file in the <EG_INSTALL_DIR>\manager\config directory.
To override the daily report graph, specify a number of your choice against the
TimePeriodforDays parameter in the [PHYSICAL_SERVERS_RESOURCES] section of
this file. By default, this parameter will hold the value 30.
To override the monthly report graph, specify a number of your choice against the
TimePeriodforMonths parameter in the [PHYSICAL_SERVERS_RESOURCES] section of
this file. By default, this parameter will hold the value 12.
Save the eg_report.ini file.
Apart from the graphical report, you can also view the data report for each individual graph by clicking on the
icon present above each graph as in Figure 9.11. Upon doing so, a data report will appear for that chosen
graph. Figure 9.12 shows the data report of the Daily – Overall physical CPU utilization graph. In this data table,
you can view the physical CPU utilization of the chosen component on a daily basis and the corresponding
threshold limits that were set for that measure.
248
Virtualization Reports
Figure 9.12: Data report of the Overall physical CPU utilization measure on a daily basis
While the actual Network usage of the component is represented for the Components
types like VMware vSphere Esx, VMware vSphere VDI, Hyper – V, Hyper – V VDI, Oracle
VDI etc, the Network usage for the Citrix Xenserver component type is represented as a
combination of I/O Read rate and I/O Write rate.
9.3 Physical Servers – Capacity Report
The Physical Servers - Capacity report provides deep insights into the resource utilization of the hosts in the physical
server farm and enables the administrators to actually compare the resource utilization of all the hosts in the physical
server farm. Apart from this, the report also helps you to figure out the following:
The resource hungry hosts in the physical server farm;
The root cause to the paucity of resources on the hosts can be diagnosed by quickly drilling down to the
VMs operating on the hosts – Is it due to the resource hungry processes on the hosts or the resource
intensive VMs or because of the over allocation of resources to the VMs?;
Based on this report, you can plan the future migration activity of the VMs by identifying those VMs that consume
high resources of a host. This way, you can release the resources of a resource intensive host. Apart from this, you
can also identify whether these hosts are capable of accommodating additional VMs to them? Are there enough
249
Virtualization Reports
resources in the hosts to support those additional VMs or should the capacity of the hosts need to be enhanced to
handle the additional load of the VMs either at present or in the future?
To generate the Physical Servers - Capacity report, do the following:
1.
Follow the menu sequence: REPORTS BY FUNCTION -> Virtualization -> Physical Servers -> Capacity in the eG
Reporter interface.
2.
Figure 9.13 appears. First, select a criterion for analysis from the Analyze by list box. Using this report, you can
analyze the capacity of the hosts and virtual machines hosted on independent virtual servers or those that are
part of a segment, service, or a zone. The options provided by the Analyze by list box are discussed hereunder:
o
Component: Select this option to choose the component(s) from across all the managed virtualized
components in the environment. For instance, for a report on the capacity of VMs on all the managed
vSphere/ESX hosts in the environment, select VMware vSphere ESX from the Component Type list, select
Component from the Analyze by list, and then select all the virtual hosts listed in the Component list of
Figure 9.13. If the Component list consists of too many components, then viewing all the components and
selecting the ones you need for report generation could require endless scrolling. To avoid this, you can
click the
icon next to the Component list. The COMPONENTS pop up window will then appear using
which you can view almost all the components in a single interface and select the ones for which the report
is to be generated.
o
Service: Select this option to generate the report for all virtual servers that are involved in the delivery of a
business service. Then, select a Service.
o
Segment: Choose this option if the virtual servers to be evaluated are configured on the virtual hosts that
are part of a segment. Then, pick a Segment for analysis.
o
Zone: Pick this option for a report on the status of virtual servers managed on all virtual hosts that are
included in a zone. Then, choose a Zone. Also, indicate whether the virtual servers present within the subzones of the chosen zone are also to be considered for report generation, by selecting an option from the
Include Subzone list.
Figure 9.13: Selecting the criteria for the Physical Servers - Capacity report
3.
Next, from the Component Type list, pick the virtualized component-type for which the report is to be
generated. By default, all managed virtualization platforms will be listed here.
4.
Based on the criterion chosen from the Analyze by list, the Component list will be populated. Select one/more of
the listed components to generate a report. If the Component list consists of too many components, then
viewing all the components and selecting the ones you need for report generation could require endless
scrolling. To avoid this, you can click the
icon next to the Component list. The COMPONENTS pop up
window will then appear using which you can view almost all the components in a single interface and select
the ones for which the report is to be generated.
5.
Next, using the Timeline option, specify the period to which this report should pertain.
250
Virtualization Reports
For every user registered with the eG Enterprise system, the administrator can indicate the
maximum timeline for which that user can generate a report. Once the maximum timeline is
set for a user, then, whenever that user logs into eG Reporter and attempts to generate a
report, the Timeline list box in the report page will display options according to the maximum
timeline setting of that user. For instance, if a user can generate a report for a maximum
period of 3 days only, then 3 days will be the highest option displayed in the Timeline list i.e., 3 days will be the last option in the fixed Timeline list. Similarly, if the user chooses the
Any option from the Timeline list and proceeds to provide a start date and end date for
report generation using the From and To specifications, eG Enterprise will first check if the
user's Timeline specification conforms to his/her maximum timeline setting. If not, report
generation will fail. For instance, for a user who is allowed to generate reports spanning over
a maximum period of 3 days only, the difference between the From and To dates should
never be over 3 days. If it is, then, upon clicking the Run Report button a message box will
appear, prompting the user to change the From and To specification.
6.
In addition to the settings discussed above, this report comes with a set of default specifications. These settings
are hidden by default. If you do not want to disturb these default settings, then you can proceed to generate
the report by clicking the Run Report button soon after you pick an option from the Component list. However, if
you want to view and then alter these settings (if required), click on the
button. The default settings will
then appear in the MORE OPTIONS drop down window (see Figure 9.14). The steps below discuss each of
these settings and how they can be customized.
Figure 9.14: The default settings for generating a Physical Servers – Capacity report
7.
Pick an option from the Show VMs list box to view the current capacity of the hosts and individual VMs that are
hosted in the virtualized environment. By default, the Hosts option will appear in this list box indicating that the
251
Virtualization Reports
capacity of the hosts in the virtual environment can be viewed at a single glance. In order to view the current
capacity of individual VMs, select the VMs option from this list. Choose the Hosts & VMs option to clearly
understand the current capacity of the hosts and the corresponding VMs at a single glance.
8.
eG Enterprise System offers the flexibility of allowing the administrators to view the VMs/Hosts that consume
high/low resources from the generated report at a single glance. This can be achieved by providing the
lower/higher threshold limits of your choice i.e., providing the Minor/Major/Critical values in the appropriate
colored text boxes against the Low Utilization Limit and High Utilization Limit options. Doing so, whenever the
VMs/Hosts violate the specified threshold values, the current capacity of that particular VM/Host will be
highlighted with the corresponding color of the specified text box in the generated report. This way, you can
easily identify the VMs/Hosts that consume high/low resources in your environment. By default, the values
specified against the Minor/Major/Critical text boxes of the Low Utilization Limit and High Utilization Limit
options will be 5/10/15 and 85/90/95 respectively.
9.
Choose an option from the Apply Limits list box so that the values that fall in the range mentioned in the Low
Utilization Limit and High Utilization Limit options will be highlighted in the generated report. By default, all the
three options (CPU/Memory/Disk) will be selected indicating that the administrators can view the resource
intensive/resource hungry VMs/Hosts based on their CPU/Disk/Memory utilization.
10.
Next, indicate the report Timeperiod.
11.
In large environments, reports generated using months of data can take a long time to complete.
Administrators now have the option of generating reports on-line or in the background. When a report is
scheduled for background generation, administrators can proceed with their other monitoring, diagnosis, and
reporting tasks, while the eG manager is processing the report. This saves the administrator valuable time. To
schedule background processing of a report, select the Background Save - PDF option from the Report
Generation list. In this case, a Report Name text box will appear, where you would have to provide the name
with which the report is to be saved in the background. To process reports in the foreground, select the
Foreground Generation - HTML option from this list.
12.
The Report Generation list will appear only if the EnableBackgroundReport flag in
the [BACKGROUND_PROCESS] section of the eg_report.ini file (in the
{EG_INSTALL_DIR}\manager\config directory) is set to Yes.
The default selection in the Report Generation list will change according to the
Timeline specified for the report. If the Timeline set is greater than or equal to the
number of days specified against the MinDurationForReport parameter in the
[BACKGROUND_PROCESS] section of the eg_report.ini file, then the default selection
in the Report Generation list will be Background. On the other hand, if the Timeline
set for the report is lesser than the value of the MinDurationForReport parameter,
then the default selection in the Report Generation list will be Foreground. This is
because, the MinDurationForReport setting governs when reports are to be
processed in the background. By default, this parameter is set to 2 weeks - this
indicates that by default, reports with a timeline of 2 weeks and above will be
processed in the background.
Clicking on the RUN REPORT button in Figure 9.13 will reveal the Physical Servers - Capacity report as in Figure
9.15.
252
Virtualization Reports
Figure 9.15: The Physical Servers - Capacity report
13.
Figure 9.15 shows the Physical Servers - Capacity report that is generated when the Hosts option is chosen
from the Show VMs list box. Using this report, you can easily figure out the actual resource usage of the hosts
and identify if there is any potential bottleneck on the hosts. The generated report will list the CPU, Memory
and disk usage of the host. From the generated report, you can easily identify the following:
The allocated CPU and the CPU that is currently utilized by the hosts. The actual value in Megahertz and
the percentage of CPU utilized will be indicated in separate columns. (see Figure 9.15).
The memory that is currently available in the host and the memory that is currently in use by the virtual
host. The actual memory usage in MB and the percentage of memory utilized will be represented in
separate columns.
The disk space that is currently allocated to each host and the disk space that is currently in use by the
host. The actual disk space that is utilized (in GB) and the percentage of disk space utilization will be
represented in separate columns.
By default, the hosts will be sorted in the descending order. If you wish to sort the hosts in the descending
order, then click on the down arrow adjacent to the Host in the generated report. Likewise, you can sort the
report based on any column. To do so, just click on the measurement units displayed in each column of the
report. The column will now be sorted in ascending order.
14.
If you have selected the VMs option from the Show VMs list box, then the report (see Figure 9.16) will be
generated for all the VMs that are hosted in the target environment. The generated report will list all the VMs
along with the host that is hosting the VMs. The generated report will consist of the details as discussed in step
13.
253
Virtualization Reports
Figure 9.16: The Physical Servers - Capacity report that is generated when the VMs option is selected
15.
If the Hosts & VMs option is chosen from the Show Criteria list box, then the report will be generated as in
Figure 9.17. The generated report will be a combination of the report that is generated when the Hosts and the
VMs option are selected individually. In this report, you will be able to view the capacity of each individual host
and the VMs that are hosted through that host.
254
Virtualization Reports
Figure 9.17: The Physical Servers - Capacity report that is generated when the Hosts & VMs option is selected
9.4 Virtual Machines – VMs Overview Report
The Virtual Machines – VMs Overview report provides administrator with a closer look at the status and resource
usage patterns of the VMs on a particular server or a server farm. Using this report, administrators can figure out the
following:
How many VMs across the environment are in a powered-off state? Which ones are they?
255
Virtualization Reports
What percentage of time has a VM been in a powered-off state?
Are VMs adequately sized in terms of resources?
Is any VM utilizing the allocated resources extensively?
How mildly/badly is the resource usage of a VM impacting the physical resources available with the server?
The details displayed in this report enable administrators to identify resource-intensive VMs and review resource
allocations to these VMs and the physical server hosting them. Potential resource bottlenecks can be detected early
using this report and alleviated. Critical performance decisions such as whether or not to move a VM to another
physical server can also be taken based on the findings of this report. Unused VMs causing an unnecessary resource
drain can also be identified, and pulled down if need be.
To generate this report, do the following:
1.
Follow the menu sequence: REPORTS BY FUNCTION -> Virtualization -> Virtual Machines -> VMs Overview in
the eG Reporter interface.
2.
Figure 9.18 then appears. For a graphical report, select Graph as the Report Type.
Figure 9.18: Selecting the criteria for a Virtual Machines – VMs Overview report
3.
To generate a VMs Overview report, select Virtual Machines from the Selection list.
4.
The Component Type report displays all the managed virtual component-types – e.g., VMware vSphere ESX,
Citrix XenServer, etc. For a report on ESX servers, select VMware vSphere ESX.
5.
Then, select a criterion for analysis from the Analyze by list box. Using this report, you can analyze the
performance of one/more independent virtualized components, or those that are part of a segment, service, or
a zone. This way, you can assess the impact of the performance of the virtual components on a particular
service/segment/zone’s performance, and accordingly take performance decisions. The options provided by the
Analyze by list box are discussed hereunder:
o
Component: Select this option to choose the component(s) from across all the managed components in the
environment. For instance, for a report on the performance of all the managed ESXi hosts in the
environment, select VMware vSphere ESX from the Component Type list, select Component from the
Analyze by list, and then select all the virtual hosts listed in the Components list of Figure 9.18.
6.
o
Service: Select this option if the components for which a report is to be generated are involved in the
delivery of a business service. Then, select a Service.
o
Segment: Choose this option if the virtual hosts to be evaluated are part of a segment. Then, pick a
Segment for analysis.
o
Zone: Pick this option for a report on the performance of virtual components that are included in a zone.
Then, choose a Zone.
If the Components list consists of too many components, then viewing all the components and selecting the
256
Virtualization Reports
ones you need for report generation could require endless scrolling. To avoid this, you can click the
icon
next to the Components list. The COMPONENTS pop up window will then appear using which you can view
almost all the components in a single interface and select the ones for which the report is to be generated.
7.
Typically, for a Data report, users can configure the measures that need to feature in the report and the
functions to be applied on them in the eg_report.ini file in the <EG_INSTALL_DIR>\manager\config directory.
However, if the Report Type chosen is Graph, you will be required to select the Measure for which the graph is
to be generated from Figure 9.18. For instance, to assess how the managed VMs in the environment use the
CPU resources available to them, choose EsxGuestDetails/Physical CPU utilization measure from the Measure
list. The Graph report that then appears reveals the top CPU consumers in the chosen server farm.
8.
Then, specify the Timeline for the graph. You can either provide a fixed time line such as 1 hour, 2 days, etc.,
or select the Any option from the list to provide a From and To date/time for report generation.
For every user registered with the eG Enterprise system, the administrator can indicate the
maximum timeline for which that user can generate a report. Once the maximum timeline is
set for a user, then, whenever that user logs into eG Reporter and attempts to generate a
report, the Timeline list box in the report page will display options according to the maximum
timeline setting of that user. For instance, if a user can generate a report for a maximum
period of 3 days only, then 3 days will be the highest option displayed in the Timeline list i.e., 3 days will be the last option in the fixed Timeline list. Similarly, if the user chooses the
Any option from the Timeline list and proceeds to provide a start date and end date for
report generation using the From and To specifications, eG Enterprise will first check if the
user's Timeline specification conforms to his/her maximum timeline setting. If not, report
generation will fail. For instance, for a user who is allowed to generate reports spanning over
a maximum period of 3 days only, the difference between the From and To dates should
never be over 3 days. If it is, then, upon clicking the Run Report button a message box will
appear, prompting the user to change the From and To specification.
9.
In addition to the settings discussed above, this report comes with a set of default specifications. These settings
are hidden by default. If you do not want to disturb these default settings, then you can proceed to generate
the report by clicking the Run Report button soon after you pick a Component. However, if you want to view
and then alter these settings (if required), click on the
button. The default settings will then appear in the
MORE OPTIONS drop down window (see Figure 9.19). The steps below discuss each of these settings and how
they can be customized.
257
Virtualization Reports
Figure 9.19: The default settings for generating the Virtual machines – VMs Overview report
10.
The Graph report comprises of a pie chart followed by a bar chart. If you want the VM names in the bar chart
to be accompanied by their corresponding physical server names, then set the Display by Physical Server flag to
Yes. By default, the flag is set to No.
11.
To indicate how many of the top/least resource users the resulting graph should depict, so as not to clutter the
display, select an option from the Show list.
12.
The speed with which a report is generated depends primarily on the report Timeline. While a Timeline that
varies between a couple of days to a week enables the eG Enterprise system to quickly retrieve the required
data, timelines that span multiple weeks/months could slow-down the data retrieval and report generation
process to a considerable extent, owing to the volume of data involved. In order to ensure quick and easy
access to reports, eG Enterprise provides you the option of enabling data retrieval from the Trend information in
the database, instead of the Detailed test information that is used by default for report generation. The Detailed
test information based comprises of multiple measurement records for a test - one or more each for every test
execution. Whereas, the Trend information includes only hourly, daily, and monthly summary computations for
a test performed on a continuous basis. For instance, during a period of 1 hour, a test that runs every 5
minutes inserts atleast 12 records into the Detailed test information base. On the other hand, the Trend
information base would consist of only 1 record for the same 1 hour period. Fewer the number of records,
query execution becomes much quicker, and data retrieval faster. To use the trend data for report generation,
you will have to select the Trend option from the Show Data field in Figure 9.19. By default, the Detailed option
is selected in Figure 9.19 indicating that the report data is retrieved from the detailed test information in the
database. If need be, you can also ensure that all reports always use the Detailed test tables alone by hiding
the Show Data field from the reporter interface. To achieve this, do the following:
Login to the eG administrative interface as 'admin'.
Select the Manager option from the Settings tile that appears when the
clicked.
From the GENERAL SETTINGS page that then appears, if you set the Compute average/sum of metrics
while trending flag to No, then the Show Data field will not appear in the reporter interface; this denies
users access to the Trend option, and thus ensures that reports are always generated using the Detailed
tables.
258
button against the Admin tab is
Virtualization Reports
A Trend report will not include the data for the current day since trend data is only
computed at the end of the day.
If the Trend option is chosen, the time period of the report should be greater than 1
day.
The usage of Detailed test tables for generating reports, especially those that span
weeks, increases the stress on the eG database, thus resulting in undue delays in report
generation. In order to ensure that the database is not choked by such voluminous data
requests, you can configure eG Enterprise to automatically "force" the use of the Trend
option if the Timeline of a report exceeds a pre-configured duration. To specify this time
boundary, do the following:
Edit the eg_report.ini file in the <EG_INSTALL_DIR>\manager\config directory.
In the [MISC] section of the file, you will find a DetailedTime parameter.
Specify the duration (in days) beyond which Detailed reports cannot be generated,
against the DetailedTime parameter, and save the eg_report.ini file.
For instance, to make sure that Detailed reports are disallowed for a Timeline of
over 2 weeks, set the DetailedTime parameter to 14 and save the file.
Say, subsequently, you attempt to generate a Detailed report for a Fixed Timeline
of 3 weeks (which is greater than the 14-day limit set in our example). The instant
you select the 3 weeks option from the Fixed list box, the Detailed option gets
automatically disabled, and the Trend option gets enabled. Similarly, if you specify
an Any Timeline that runs over 14 days, then, upon clicking the RUN REPORT
BUTTON to generate the report, a message box appears (see Figure 5.7) informing
you that only the Trend option is permitted.
To proceed with the Trend report generation, click the OK button in the message
box. To terminate Trend report generation, click the CANCEL button.
13.
If the timeline specified for the report needs to exclude the data collected during the Weekends, then set
Exclude weekends to Yes. If not, select No.
14.
Next, indicate the report Timeperiod.
15.
In large environments, reports generated using months of data can take a long time to complete.
Administrators now have the option of generating reports on-line or in the background. When a report is
scheduled for background generation, administrators can proceed with their other monitoring, diagnosis, and
reporting tasks, while the eG manager is processing the report. This saves the administrator valuable time. To
schedule background processing of a report, select the Background Save - PDF option from the Report
Generation list. In this case, a Report Name text box will appear, where you would have to provide the name
with which the report is to be saved in the background. To process reports in the foreground, select the
Foreground Generation - HTML option from this list.
259
Virtualization Reports
16.
The Report Generation list will appear only if the EnableBackgroundReport flag in
the [BACKGROUND_PROCESS] section of the eg_report.ini file (in the
{EG_INSTALL_DIR}\manager\config directory) is set to Yes.
The default selection in the Report Generation list will change according to the
Timeline specified for the report. If the Timeline set is greater than or equal to the
number of days specified against the MinDurationForReport parameter in the
[BACKGROUND_PROCESS] section of the eg_report.ini file, then the default
selection in the Report Generation list will be Background. On the other hand, if the
Timeline set for the report is lesser than the value of the MinDurationForReport
parameter, then the default selection in the Report Generation list will be
Foreground. This is because, the MinDurationForReport setting governs when
reports are to be processed in the background. By default, this parameter is set to
2 weeks - this indicates that by default, reports with a timeline of 2 weeks and
above will be processed in the background.
Finally, click the Run Report button.
Figure 9.20: A Virtual Machines - VMs Overview graph report
17.
If the Report Type is Graph and the option chosen from the Report Generation list is Foreground Generation HTML, then, clicking on the Run Report button will invoke Figure 9.20, which will reveal the following:
A distribution pie chart that reveals the number of VMs in different distribution ranges (see Figure 9.20).
The distribution ranges are obtained based on the first of the configured functions for the chosen
Measure. For instance, assume that Physical CPU utilization is the chosen Measure. Say that you have
configured to display the Avg and Max of Physical CPU utilization in a Data report. Typically, both these
configured values will appear only in the Data report. In the case of a Graph report however, the first of
260
Virtualization Reports
the two functions - i.e., Avg of Physical CPU utilization - alone is calculated for every VM on the chosen
virtual component-type. The resulting pie chart enables administrators to deduce, at a glance, the number
of components where the chosen performance metric has fared well and/or badly. Clicking on a particular
slice in the pie chart lists the VMs that fall within the value range represented by that slice (see Figure
9.21). Against every VM name, the actual values for each of the configured functions (both Avg and Max,
in our example) will be displayed. A zone/segment/service/component-type-level Summary of the chosen
Measure will also be available.
Figure 9.21: A list of components with Physical CPU utilization in a given range
261
Virtualization Reports
By default, the chart type for distribution is a pie chart. However, you can have a
bar graph depict the same data instead of a pie chart, by following the steps given
below:
Edit the eg_report.ini file in the <EG_INSTALL_DIR>\manager\config directory.
Change the value of the chartTypeForDist parameter in the [VIRTUAL_GUEST]
section of this file from the default Pie, to Bar.
Save the eg_report.ini file.
By default, the number of value ranges that need to be configured for the
distribution chart is 10. To override this default setting, do the following:
Edit the eg_report.ini file in the <EG_INSTALL_DIR>\manager\config directory.
Specify a number of your choice against the nofRangeForDist parameter in the
[VIRTUAL_GUEST] section of this file. By default, this parameter will hold the value
10.
Save the eg_report.ini file.
Adjacent to the pie chart, you will find a bar chart that indicates the VMs that have topped/failed in a
selected performance realm (i.e., the Measure) during the specified Timeline. For example, for the
Physical CPU utilization measure, this bar chart reveals the VMs that are the top CPU-consumers. Like the
pie chart, the values for the bar chart are also calculated by applying the first of the configured functions
on the chosen Measure.
You can configure the colors to be used in the distribution chart and the Top <N>
Components bar chart in the zone report, by editing the eg_report.ini file in the
<EG_INSTALL_DIR>\manager\config directory. The [VIRTUAL_GUEST] section of the file defines
the 20 default colors of the distribution and bar charts:
[VIRTUAL_GUEST]
ChartColor=#8399b0,#ffd95a,#a4ac91,#98d980,#d5b996,#f48848,#8b8cc2,
#eb4052,#c4b3d0,#b18651,#ebb7ce,#028768,#f5c372,#887c65,#e4c536,
#b5582c,#f94989,#770d72,#97a067,#89aeb7
distColor=#115fa6,#f25454,#60bd68,#b276b2,#81bef7,#a61120,#ffd13e,
#770d72,#887c65,#a4ac91
You override the default color settings of the distribution chart by modifying the color-codes
specifying against distColor. For changing the colors used by the Top <N> Components chart,
alter the codes listed against the ChartColor parameter.
262
Virtualization Reports
The number of components to be displayed in the Top <N> Components bar chart
is configurable. To specify the number, do the following:
Edit the eg_report.ini file in the <EG_INSTALL_DIR>\manager\config directory.
Specify a number of your choice against the NoOfServersforChart parameter in the
[VIRTUAL_GUEST] section of the file. By default, the value displayed here is 10,
indicating that, by default, the bar chart will be for the Top 10 Components. For
example, if you change this value to 5, then a bar chart displaying the Top 5
Components will appear. This configuration governs the options listed in the Show
list box in Figure 9.18.
Finally, save the eg_report.ini file.
18.
Unlike a Graph report, a Data report does not graphically represent the measure data. Instead, the configured
details are presented in a tabular format in the report.
19.
If the Report Type is Data, then upon clicking the Run Report button Figure 9.22 will be invoked.
20.
The Data report will display multiple values for a measure depending upon the number and type of functions
that have been configured for the measure. By default however, the VM Powered on measure will be displayed
as the percentage of time for which the corresponding VM had been in a powered-on state on a physical server
(see Figure 9.22).
Figure 9.22: A Virtual Machine – VMs Overview Data Report
21.
The first row of the Data report displays a Summary of the performance of all the VMs configured on the
chosen virtual hosts. Below this row, server-wise performance details will appear. These details together
provide users with an overview of the health of virtual machines in the server farm. Clicking on a Virtual
Machine here will lead you to the Physical Resources Usage report, using which you can assess how resourceefficient the VM is.
22.
If the Background Save - PDF option is chosen from the Report Generation list, then clicking on the Run Report
button will not generate the report and display it in this page for your benefit. Instead, a message indicating
that the report is being processed in the background will appear. This will be accompanied by a link that will
263
Virtualization Reports
lead you to the page that lists all the reports that are being processed in the background, and their current
status. If background report generation fails for a report, you can regenerate that report using this page, or can
even delete that report if need be. On the other hand, if background processing successfully completes for your
report, then, you can view a PDF of the report by clicking on the
icon in that page.
As stated earlier, you can configure the information that needs to appear in the Virtual Machines report, by
editing the eg_report.ini file in the <EG_INSTALL_DIR>\manager\config directory. For example, to generate the
report depicted by Figure 9.22, specify the following in the [VIRTUAL_GUEST] section of the eg_report.ini file:
[VIRTUAL_GUEST]
EsxGuestTest:Cpu_used#CPU Used=Avg
EsxGuestTest:Cpu_usage#CPU Usage=Avg
EsxGuestTest:Ready#Ready Time=Avg
EsxGuestTest:Powered_on#VM Powered On=
EsxGuestTest:Configured_memory#Configured Memory=Avg
EsxGuestTest:Active_memory#Active memory=Avg
EsxGuestTest:Memory_usage#Memory Usage=Avg
EsxGuestTest:Total_capacity#Disk Capacity=Avg
EsxGuestTest:Data_writes#Disk Writes=Avg
EsxGuestTest:Data_reads#Disk Reads=Avg
EsxGuestTest:Data_transmitted#Network Traffic Out=Avg
EsxGuestTest:Data_received#Network Traffic In=Avg
Typically, measure configurations in the [VIRTUAL_GUEST] section of the eg_report.ini file should be of the following
format:
<InternalTest>:<InternalMeasure>#<Display name of measure>=<Comma-separated list of functions>
Before proceeding with the configuring, determine the internal component type, test, and measure names, using the
procedure discussed in Page 212 of this manual.
Accordingly, in the first line of the example above:
EsxGuestTest is the <InternalTest> that reports the measure of interest to us
CPU_used is the <InternalMeasure> that is to be displayed in the report page
The display name of the measure is CPU Used, and finally,
Avg is the function that is to be executed on the value of the CPU_used measure
The other measures that have been configured are: CPU_usage, Ready, Powered_on, Configured_memory,
Active_memory,
Data_received.
Memory_usage,
Total_capacity,
Data_writes,Data_reads,
This indicates for each chosen physical server, the following values will be displayed in the report:
The average CPU used by a VM, in Mhz and Percentage
The average time for which CPU was in a ready state
The average configured memory
The average active memory
The average memory usage
264
Data_transmitted,
Virtualization Reports
The average disk capacity
The average disk reads and writes
The average of incoming and outgoing network traffic
If functions such as Avg, Max, etc., are not explicitly configured in the
[VIRTUAL_GUEST] section in the manner discussed above, then report will, by
default, display the average (Avg) values for the configured measures.
If a display name is not provided for a measure, then the actual measure name will
automatically become the display name.
9.5 Virtual Machines – VM Details Report
The Virtual Machines - Details report enables administrators to zoom into a particular VM, analyze its performance up,
close, and accurately determine the following:
Has the VM been frequently moved to other hosts?
Which are the servers to which a VM has been Vmotioned during a given period?
Why was the VM moved? Is it because the VM is resource-intensive and is hence eroding the physical
resources of the host, or is it owing to the fact that the host is not adequately sized to support the VM’s
operations?
How well is the VM using the resources allocated to it? Are spikes in usage sporadic/consistent? Have these
usage patterns impacted the performance of any of the hosts on which the VM was
Vmotioned/XenMotioned to during the designated period? What could be the reason for this anomaly - a
resource-hungry application executing on the VM or insufficient resource allocation to the VM by the host?
To facilitate this analysis, the Virtual Machines - Details category of reports helps generate two types of reports namely, the Physical Resources Usage report, and the Virtual Resources Usage report.
Physical Resources Usage Report
Using the Physical Resources Usage report, administrators can track the movement of a VM across physical servers,
compare the relative resource usage of that VM across these physical servers, and determine why the move
happened in the first place - is the VM so resource-hungry that it drains the physical server of its resources, or are
one/more hosts starved for resources?
To generate the Physical Resources Usage report, do the following:
1.
Follow the menu sequence: REPORTS BY FUNCTION -> Virtualization -> Virtual Machines -> VM Details in the
eG Reporter interface.
2.
From the Selection list in Figure 9.23, pick the Physical Resources Usage option.
265
Virtualization Reports
Figure 9.23: Specifying the criteria for generating the PHYSICAL RESOURCES USAGE report
3.
Next, select Graph from the Report Type field to generate a graphical report. For a data report, select the Data
option.
4.
Pick the virtual component type for which the report is to be generated from the Component Type list.
5.
All the guests executing on all managed components of the chosen Component Type will then be available in
the Virtual Machine list. By default, if eG Enterprise discovers over 100 VMs on physical servers of the chosen
type, then a Filter by field will appear in Figure 9.23 (not shown in Figure 9.23) to enable you to trim down the
Virtual Machine list and quickly locate the VM that interests you. To filter the VM list, just enter the whole/part
of the VM name that you are looking for in the Filter by text box and click the right-arrow button next to it. Only
those VMs with names that embed the specified string will then be listed in the Virtual Machine list. Pick a VM
from this list to focus on its performance.
As stated earlier, by default, the Filter by text box appears if the number of VMs is equal to
or over 100. To override this default setting, do the following:
Edit the eg_report.ini file in the <EG_INSTALL_DIR>\manager\config directory.
In the [MEASURE_GROUP] section of the file, set the MoreVMs to a different value.
The default is 100.
Save the file.
6.
If you want to analyze the performance of the chosen VM only on those ESX servers that are managed by a
particular vCenter server, pick this server from the vCenter list. Upon selecting a vCenter, the ESX servers
managed by that vCenter server will be available for selection in the Physical Servers list.
7.
Selecting All from the vCenter list on the other hand allows you to compare the performance of the VM across
all ESX servers, regardless of whether/not they are managed by vCenter. In this case therefore, all eG-managed
ESX servers will be available for selection in the Physical Servers list.
8.
Pick one/more of the physical servers listed in the Physical Servers list for report generation. If this list consists
of too many physical servers, then viewing all the components and selecting the ones you need for report
generation could require endless scrolling. To avoid this, you can click the
button next to the Physical
266
Virtualization Reports
Servers list. The PHYSICAL SERVERS pop up window will then appear using which you can view almost all the
physical severs in a single interface and select the ones for which the report is to be generated.
9.
Then, specify the Timeline for the graph. You can either provide a fixed time line such as 1 hour, 2 days, etc.,
or select the Any option from the list to provide a From and To date/time for report generation.
For every user registered with the eG Enterprise system, the administrator can indicate the
maximum timeline for which that user can generate a report. Once the maximum timeline is
set for a user, then, whenever that user logs into eG Reporter and attempts to generate a
report, the Timeline list box in the report page will display options according to the maximum
timeline setting of that user. For instance, if a user can generate a report for a maximum
period of 3 days only, then 3 days will be the highest option displayed in the Timeline list i.e., 3 days will be the last option in the fixed Timeline list. Similarly, if the user chooses the
Any option from the Timeline list and proceeds to provide a start date and end date for
report generation using the From and To specifications, eG Enterprise will first check if the
user's Timeline specification conforms to his/her maximum timeline setting. If not, report
generation will fail. For instance, for a user who is allowed to generate reports spanning over
a maximum period of 3 days only, the difference between the From and To dates should
never be over 3 days. If it is, then, upon clicking the Run Report button a message box will
appear, prompting the user to change the From and To specification.
10.
In addition to the settings discussed above, this report comes with a set of default specifications. These settings
are hidden by default. If you do not want to disturb these default settings, then you can proceed to generate
the report by clicking the Run Report button soon after you pick one/more Physical Servers. However, if you
want to view and then alter these settings (if required), click on the
button. The default settings will then
appear in the MORE OPTIONS drop down window (see Figure 9.24). The steps below discuss each of these
settings and how they can be customized.
Figure 9.24: The default settings for generating a Physical Resources Usage report
11.
eG Enterprise collects a wide range of physical resource usage metrics - i.e., ‘outside view’ metrics - from a VM.
Using the Physical Resources Usage report, you can focus on how a chosen VM utilizes a specific resource - say
CPU, memory, disk space, etc. For this purpose, by default, eG Enterprise groups the physical resource usage267
Virtualization Reports
metrics of a VM into four different ‘resource groups’, based on the ‘resource type’. These groups are, namely:
Memory usage, CPU usage, Disk usage, and Network usage. For instance, all key metrics related to memory
usage - eg., allocated memory size, Memory max limited, Target memory, etc. - are by default included in the
Memory usage group. Also, to provide administrators with a clearer view of a VM’s resource usage, eG
Enterprise, by default, computes the Avg and Max values of every metric in a group, and displays one/all of the
computed values in the report. To know how the chosen VM has used a particular resource across the selected
Components, pick one of the above-mentioned resource groups from the Measure Group list. On the other
hand, if you want to generate a report that brings out the overall resource usage of a VM across the chosen
Components, then select All from the Measure Group list.
The default resource groups - Memory usage, CPU usage, Disk usage, and Network usage are hard-coded in the eG Enterprise system. The names of these groups cannot be changed,
and no new resource groups can be introduced. However, if need be, additional metrics can
be included in the default groups, and additional functions can be applied to any of the
grouped metrics. For instance to add the CPU guaranteed to VM metric to the CPU usage
group, do the following:
Edit the eg_report.ini file in the <EG_INSTALL_DIR>\manager\config directory.
In the [MEASURE_GROUP] section of the file, insert a line for the new metric, in the
following format:
Cpu_usage:<InternalTestName>:<InternalMeasureName>=<Comma-separated list of
functions>
For the CPU guaranteed to VM measure therefore, your specification should be:
Cpu_usage:EsxGuestTest:Cpu_guaranteed=Avg,Max
To know the <InternalTestName> and <InternalMeasureName>, refer to the
procedure discussed in Page 212 of this document.
Finally, save the file.
Similarly, new metrics/functions can be added to the Memory_usage, Disk_usage, and
Network_usage groups.
12.
The speed with which a report is generated depends primarily on the report Timeline. While a Timeline that
varies between a couple of days to a week enables the eG Enterprise system to quickly retrieve the required
data, timelines that span multiple weeks/months could slow-down the data retrieval and report generation
process to a considerable extent, owing to the volume of data involved. In order to ensure quick and easy
access to reports, eG Enterprise provides you the option of enabling data retrieval from the Trend information in
the database, instead of the Detailed test information that is used by default for report generation. The Detailed
test information based comprises of multiple measurement records for a test - one or more each for every test
execution. Whereas, the Trend information includes only hourly, daily, and monthly summary computations for
a test performed on a continuous basis. For instance, during a period of 1 hour, a test that runs every 5
minutes inserts atleast 12 records into the Detailed test information base. On the other hand, the Trend
information base would consist of only 1 record for the same 1 hour period. Fewer the number of records,
query execution becomes much quicker, and data retrieval faster. To use the trend data for report generation,
you will have to select the Trend option from the Show Data field in Figure 9.24. By default, the Detailed option
268
Virtualization Reports
is selected in Figure 9.24 indicating that the report data is retrieved from the detailed test information in the
database. If need be, you can also ensure that all reports always use the Detailed test tables alone by hiding
the Show Data field from the reporter interface. To achieve this, do the following:
13.
Login to the eG administrative interface as 'admin'.
Select the Manager option from the Settings tile that appears when the
clicked.
From the GENERAL SETTINGS page that then appears, if you set the Compute average/sum of metrics
while trending flag to No, then the Show Data field will not appear in the reporter interface; this denies
users access to the Trend option, and thus ensures that reports are always generated using the Detailed
tables.
button against the Admin tab is
A Trend report will not include the data for the current day since trend data is only
computed at the end of the day.
If the Trend option is chosen, the time period of the report should be greater than 1 day.
The usage of Detailed test tables for generating reports, especially those that span
weeks, increases the stress on the eG database, thus resulting in undue delays in report
generation. In order to ensure that the database is not choked by such voluminous data
requests, you can configure eG Enterprise to automatically "force" the use of the Trend
option if the Timeline of a report exceeds a pre-configured duration. To specify this time
boundary, do the following:
Edit the eg_report.ini file in the <EG_INSTALL_DIR>\manager\config directory.
In the [MISC] section of the file, you will find a DetailedTime parameter.
Specify the duration (in days) beyond which Detailed reports cannot be generated,
against the DetailedTime parameter, and save the eg_report.ini file.
For instance, to make sure that Detailed reports are disallowed for a Timeline of
over 2 weeks, set the DetailedTime parameter to 14 and save the file.
Say, subsequently, you attempt to generate a Detailed report for a Fixed Timeline
of 3 weeks (which is greater than the 14-day limit set in our example). The instant
you select the 3 weeks option from the Fixed list box, the Detailed option gets
automatically disabled, and the Trend option gets enabled. Similarly, if you specify
an Any Timeline that runs over 14 days, then, upon clicking the RUN REPORT
BUTTON to generate the report, a message box appears (see Figure 5.8) informing
you that only the Trend option is permitted.
To proceed with the Trend report generation, click the OK button in the message
box. To terminate Trend report generation, click the CANCEL button.
If the timeline specified for the report needs to exclude the data collected during the Weekends, then set
Exclude weekends to Yes. If not, select No.
269
Virtualization Reports
By default, the weekend constitutes Saturday and Sunday. To override this default setting,
do the following:
Edit the eg_report.ini file in the <EG_INSTALL_DIR>\manager\config directory.
In the [MEASURE_GROUP] section of the file, the EXCLUDE_WEEKEND parameter is
set to Saturday,Sunday by default. You can modify this by setting the
EXCLUDE_WEEKEND parameter to a comma-separated list of other days of the week
- say Friday,Saturday.
Save the file after making the required changes.
14.
Next, indicate the report Time period.
15.
In large environments, reports generated using months of data can take a long time to complete.
Administrators now have the option of generating reports on-line or in the background. When a report is
scheduled for background generation, administrators can proceed with their other monitoring, diagnosis, and
reporting tasks, while the eG manager is processing the report. This saves the administrator valuable time. To
schedule background processing of a report, select the Background Save - PDF option from the Report
Generation list. In this case, a Report Name text box will appear, where you would have to provide the name
with which the report is to be saved in the background. To process reports in the foreground, select the
Foreground Generation - HTML option from this list.
The Report Generation list will appear only if the EnableBackgroundReport flag in
the [BACKGROUND_PROCESS] section of the eg_report.ini file (in the
{EG_INSTALL_DIR}\manager\config directory) is set to Yes.
The default selection in the Report Generation list will change according to the
Timeline specified for the report. If the Timeline set is greater than or equal to the
number of days specified against the MinDurationForReport parameter in the
[BACKGROUND_PROCESS] section of the eg_report.ini file, then the default
selection in the Report Generation list will be Background. On the other hand, if the
Timeline set for the report is lesser than the value of the MinDurationForReport
parameter, then the default selection in the Report Generation list will be
Foreground. This is because, the MinDurationForReport setting governs when
reports are to be processed in the background. By default, this parameter is set to
2 weeks - this indicates that by default, reports with a timeline of 2 weeks and
above will be processed in the background.
16.
Finally, click the Run Report button.
17.
If the Report Type is Graph and the option chosen from the Report Generation list is Foreground Generation HTML, then, clicking on the Run Report button will invoke Figure 9.25. The Graph report applies the first of the
configured functions (i.e., Avg by default) on every metric in the chosen group, and generates time-of-day
graphs revealing the variations in the computed values across the chosen Components during the specified
270
Virtualization Reports
period. These graphs help determine whether/not the chosen VM has made optimal use of the critical resource
on every physical server that it has been moved to during the stated period, and enables you to understand
whether excessive usage of the chosen resource by the VM is the reason for its movement.
Figure 9.25: A graphical Physical Resources Usage report
18.
If the Report Type were Data, then you would not be required to choose a Measure Group. The Data report
applies all the configured functions (i.e., both Avg and Max by default) on every metric in every measure group
271
Virtualization Reports
for each Component chosen, and displays all the computed values in a tabular format, once the Run Report
button is clicked (see Figure 9.26). Under the individual measure groups, a component-wide Summary of each
metric will be available, followed by the details of the resource usage of every component. In addition, the Data
report also reveals how much time the VM spent on each of the chosen Components; this way, any change in
the performance of the physical server during that time can be attributed to the presence of the VM. To focus
on the performance of all the VMs on a particular virtual component, click on any of the component links in the
data report. Figure 9.27 then appears indicating how every VM executing on that component has performed
during the given period.
Figure 9.26: A Physical Resources Usage report of type Data
272
Virtualization Reports
Figure 9.27: A Virtual Machines report revealing the health of each VM discovered on a chosen virtual host
19.
The Data report explores the overall resource usage of a VM across all the physical servers that it has visited
during the given period. Using this report, you can accurately identify which resources have been over-utilized
by the VM and on which physical server.
Virtual Resources Usage Report
The Virtual Resources Usage report turns an administrator’s attention to resource-intensive VMs and improper
resource allocations to a VM.
To generate this report, do the following:
1.
Follow the menu sequence: REPORTS BY FUNCTION -> Virtualization -> Virtual Machines -> VM Details in the
eG Reporter interface.
2.
From the Selection list in Figure 9.28, pick the Virtual Resources Usage option.
Figure 9.28: Specifying the criteria for generating the Virtual Resources Usage report
3.
Next, select Graph from the Report Type field to generate a graphical report. For a data report, select the Data
option.
4.
Pick the virtual component type for which the report is to be generated from the Component Type list.
5.
All the guests executing on all managed components of the chosen Component Type will then be available in
273
Virtualization Reports
the Virtual Machine list. By default, if eG Enterprise discovers over 100 VMs on physical servers of the chosen
type, then a Filter by field will appear in Figure 9.28 (not shown in Figure 9.28) to enable you to trim down the
Virtual Machine list and quickly locate the VM that interests you. To filter the VM list, just enter the whole/part
of the VM name that you are looking for in the Filter by text box and click the right-arrow button next to it. Only
those VMs with names that embed the specified string will then be listed in the Virtual Machine list. Pick a VM
from this list to focus on its performance.
As stated earlier, by default, the Filter by text box appears if the number of VMs is equal to
or over 100. To override this default setting, do the following:
Edit the eg_report.ini file in the <EG_INSTALL_DIR>\manager\config directory.
In the [VIRTUAL_MEASURE_GROUP] section of the file, set the MoreVMs to a different
value. The default is 100.
Save the file.
6.
If you want to analyze the performance of the chosen VM only on those ESX servers that are managed by a
particular vCenter server, pick this server from the vCenter list. Upon selecting a vCenter, the ESX servers
managed by that vCenter server will be available for selection in the Physical Servers list.
7.
Selecting All from the vCenter list on the other hand allows you to compare the performance of the VM across
all ESX servers, regardless of whether/not they are managed by vCenter. In this case therefore, all eG-managed
ESX servers will be available for selection in the Physical Servers list.
8.
Pick one/more of the physical servers listed in the Physical Servers list for report generation. If this list consists
of too many physical servers, then viewing all the servers and selecting the ones you need for report generation
could require endless scrolling. To avoid this, you can click the
button next to the Physical Servers list. This
will expand the Physical Servers list so that you can view almost all the components in a single interface and
select the ones for which the report is to be generated.
9.
eG Enterprise collects a wide range of virtual resource usage metrics - i.e., ‘inside view’ metrics - from a VM.
Using the Virtual Resources Usage report, you can focus on how a chosen VM utilizes a specific resource - say
CPU, memory, disk space, etc. For this purpose, by default, eG Enterprise groups the virtual resource usage
metrics of a VM into six different ‘resource groups’, based on the ‘resource type’. These groups are, namely:
Memory usage, CPU usage , Disk usage, Network usage, Tcp Connection, and Uptime Status. For instance, all
key metrics related to memory usage – e.g., allocated memory size, Memory max limited, Target memory, etc.
- are by default included in the Memory usage group. Also, to provide administrators with a clearer view of a
VM’s resource usage, eG Enterprise, by default, computes the Avg and Max values of every metric in a group,
and displays these values in the report. To know how the chosen VM has used a particular resource across the
selected Components, pick one of the above-mentioned resource groups from the Measure Group list. On the
other hand, if you want to generate a report that brings out the overall resource usage of a VM across the
chosen Components, then select All from the Measure Group list.
274
Virtualization Reports
The default resource groups Memory usage, CPU usage, Disk usage, Network usage, Tcp
Connection, and Uptime Status - are hard-coded in the eG Enterprise system. The names of
these groups cannot be changed, and no new resource groups can be introduced. However,
if need be, additional metrics can be included in the default groups, and additional functions
can be applied to any of grouped metrics. For instance to add the Run queue in VM metric to
the CPU usage group, do the following:
Edit the eg_report.ini file in the <EG_INSTALL_DIR>\manager\config directory.
In the [VIRTUAL_MEASURE_GROUP] section of the file, insert a line for the new
metric, in the following format:
Cpu_usage:<InternalTestName>:<InternalMeasureName>=<Comma-separated list of
functions>
For the Run queue in VM measure therefore, your specification should be:
Cpu_usage:VmgSystemTest:Run_ueue_length=Avg,Max
To know the <InternalTestName> and <InternalMeasureName>, refer to the
procedure discussed in Page 212 of this document.
Finally, save the file.
Similarly, new metrics/functions can be added to the Memory_usage, Disk_usage,
Network_usage, Tcp Connection, and Uptime Status groups.
10.
Then, specify the Timeline for the graph. You can either provide a fixed time line such as 1 hour, 2 days, etc.,
or select the Any option from the list to provide a From and To date/time for report generation.
For every user registered with the eG Enterprise system, the administrator can indicate the
maximum timeline for which that user can generate a report. Once the maximum timeline is
set for a user, then, whenever that user logs into eG Reporter and attempts to generate a
report, the Timeline list box in the report page will display options according to the maximum
timeline setting of that user. For instance, if a user can generate a report for a maximum
period of 3 days only, then 3 days will be the highest option displayed in the Timeline list i.e., 3 days will be the last option in the fixed Timeline list. Similarly, if the user chooses the
Any option from the Timeline list and proceeds to provide a start date and end date for
report generation using the From and To specifications, eG Enterprise will first check if the
user's Timeline specification conforms to his/her maximum timeline setting. If not, report
generation will fail. For instance, for a user who is allowed to generate reports spanning over
a maximum period of 3 days only, the difference between the From and To dates should
never be over 3 days. If it is, then, upon clicking the Run Report button a message box will
appear, prompting the user to change the From and To specification.
11.
In addition to the settings discussed above, this report comes with a set of default specifications. These settings
275
Virtualization Reports
are hidden by default. If you do not want to disturb these default settings, then you can proceed to generate
the report by clicking the RUN REPORT BUTTON soon after you pick one/more Physical Servers. However, if you
want to view and then alter these settings (if required), click on the
button. The default settings will then
appear in the MORE OPTIONS drop down window (see Figure 9.29). The steps below discuss each of these
settings and how they can be customized.
Figure 9.29: The default settings for generating the Virtual Resources Usage report
12.
The speed with which a report is generated depends primarily on the report Timeline. While a Timeline that
varies between a couple of days to a week enables the eG Enterprise system to quickly retrieve the required
data, timelines that span multiple weeks/months could slow-down the data retrieval and report generation
process to a considerable extent, owing to the volume of data involved. In order to ensure quick and easy
access to reports, eG Enterprise provides you the option of enabling data retrieval from the Trend information in
the database, instead of the Detailed test information that is used by default for report generation. The Detailed
test information based comprises of multiple measurement records for a test - one or more each for every test
execution. Whereas, the Trend information includes only hourly, daily, and monthly summary computations for
a test performed on a continuous basis. For instance, during a period of 1 hour, a test that runs every 5
minutes inserts atleast 12 records into the Detailed test information base. On the other hand, the Trend
information base would consist of only 1 record for the same 1 hour period. Fewer the number of records,
query execution becomes much quicker, and data retrieval faster. To use the trend data for report generation,
you will have to select the Trend option from the Show Data field in Figure 9.29. By default, the Detailed option
is selected in Figure 9.29 indicating that the report data is retrieved from the detailed test information in the
database. If need be, you can also ensure that all reports always use the Detailed test tables alone by hiding
the Show Data field from the reporter interface. To achieve this, do the following:
Login to the eG administrative interface as 'admin'.
Select the Manager option from the Settings tile that appears when the
clicked.
From the GENERAL SETTINGS page that then appears, if you set the Compute average/sum of metrics
while trending flag to No, then the Show Data field will not appear in the reporter interface; this denies
users access to the Trend option, and thus ensures that reports are always generated using the Detailed
tables.
276
button against the Admin tab is
Virtualization Reports
13.
A Trend report will not include the data for the current day since trend data is only
computed at the end of the day.
If the Trend option is chosen, the time period of the report should be greater than 1
day.
The usage of Detailed test tables for generating reports, especially those that span
weeks, increases the stress on the eG database, thus resulting in undue delays in report
generation. In order to ensure that the database is not choked by such voluminous data
requests, you can configure eG Enterprise to automatically "force" the use of the Trend
option if the Timeline of a report exceeds a pre-configured duration. To specify this time
boundary, do the following:
Edit the eg_report.ini file in the <EG_INSTALL_DIR>\manager\config directory.
In the [MISC] section of the file, you will find a DetailedTime parameter.
Specify the duration (in days) beyond which Detailed reports cannot be generated,
against the DetailedTime parameter, and save the eg_report.ini file.
For instance, to make sure that Detailed reports are disallowed for a Timeline of
over 2 weeks, set the DetailedTime parameter to 14 and save the file.
Say, subsequently, you attempt to generate a Detailed report for a Fixed Timeline
of 3 weeks (which is greater than the 14-day limit set in our example). The instant
you select the 3 weeks option from the Fixed list box, the Detailed option gets
automatically disabled, and the Trend option gets enabled. Similarly, if you specify
an Any Timeline that runs over 14 days, then, upon clicking the RUN REPORT
BUTTON to generate the report, a message box appears (see Figure 5.8) informing
you that only the Trend option is permitted.
To proceed with the Trend report generation, click the OK button in the message
box. To terminate Trend report generation, click the CANCEL button.
If the timeline specified for the report needs to exclude the data collected during the Weekends, then set
Exclude weekends to Yes. If not, select No.
277
Virtualization Reports
By default, the weekend constitutes Saturday and Sunday. To override this default setting,
do the following:
Edit the eg_report.ini file in the <EG_INSTALL_DIR>\manager\config directory.
In the [VIRTUAL_MEASURE_GROUP] section of the file, the EXCLUDE_WEEKEND
parameter is set to Saturday,Sunday by default. You can modify this by setting the
EXCLUDE_WEEKEND parameter to a comma-separated list of other days of the week
- say Friday,Saturday.
Save the file after making the required changes.
14.
Next, indicate the report Time period.
15.
In large environments, reports generated using months of data can take a long time to complete.
Administrators now have the option of generating reports on-line or in the background. When a report is
scheduled for background generation, administrators can proceed with their other monitoring, diagnosis, and
reporting tasks, while the eG manager is processing the report. This saves the administrator valuable time. To
schedule background processing of a report, select the Background Save - PDF option from the Report
Generation list. In this case, a Report Name text box will appear, where you would have to provide the name
with which the report is to be saved in the background. To process reports in the foreground, select the
Foreground Generation - HTML option from this list.
16.
The Report Generation list will appear only if the EnableBackgroundReport flag in
the [BACKGROUND_PROCESS] section of the eg_report.ini file (in the
{EG_INSTALL_DIR}\manager\config directory) is set to Yes.
The default selection in the Report Generation list will change according to the
Timeline specified for the report. If the Timeline set is greater than or equal to the
number of days specified against the MinDurationForReport parameter in the
[BACKGROUND_PROCESS] section of the eg_report.ini file, then the default selection
in the Report Generation list will be Background. On the other hand, if the Timeline
set for the report is lesser than the value of the MinDurationForReport parameter,
then the default selection in the Report Generation list will be Foreground. This is
because, the MinDurationForReport setting governs when reports are to be
processed in the background. By default, this parameter is set to 2 weeks - this
indicates that by default, reports with a timeline of 2 weeks and above will be
processed in the background.
Finally, click the Run Report button. If the Report Type is Graph and the option chosen from the Report
Generation list is Foreground Generation - HTML, then clicking on the Run Report button invokes Figure 9.30.
The Graph report applies the first of the configured functions (i.e., Avg by default) on every metric in the
chosen group, and generates time-of-day graphs revealing the variations in the computed values across the
278
Virtualization Reports
chosen Components during the specified period. These graphs help determine whether applications executing
on the VM are consuming the resources allocated to the VM excessively, or whether the VMs are inadequately
sized.
Figure 9.30: A graphical Virtual Resources Usage report
17.
If the Report Type were Data, then you would not be required to choose a Measure Group. The Data report
applies all the configured functions (i.e., both Avg and Max by default) on every metric in every measure group,
and displays all the computed values in a tabular format, once the Run Report button is clicked (see Figure
9.31). Under the individual measure groups, a component-wide Summary of each metric will be available,
followed by the details of the resource usage of every component. To zoom into the overall health of all the
VMs executing on a particular Component (i.e., physical server) displayed in the data report, click on the
component. Figure 9.32 appears allowing you a sneak peek at the performance of every VM executing on that
virtual host.
279
Virtualization Reports
Figure 9.31: A Virtual Resources Usage report of type Data
280
Virtualization Reports
Figure 9.32: A Virtual Machines report revealing the health of each VM discovered on a chosen virtual host
18.
The Data report explores the overall resource usage of a VM across all the physical servers that it has visited
during the given period. Using this report, you can accurately identify which virtual resources have been overutilized by the VM and on which physical server.
19.
On the other hand, if the Background Save - PDF option is chosen from the Report Generation list, then clicking
on the Run Report button will not generate the report and display it in this page for your benefit. Instead, a
message indicating that the report is being processed in the background will appear. This will be accompanied
by a link that will lead you to the page that lists all the reports that are being processed in the background, and
their current status. If background report generation fails for a report, you can regenerate that report using this
page, or can even delete that report if need be. On the other hand, if background processing successfully
completes for your report, then, you can view a PDF of the report by clicking on the
icon in that page.
9.6 The VM Sprawl Report
Large virtualized environments are typically characterized by a multitude of virtual hosts, each hosting tens of virtual
machines. Administrators need to periodically review the usage of these VMs in order to identify those VMs that have
been utilized optimally and those that have been under-utilized. Since each VM, regardless of its powered-on state
and user activity, consumes disk space and memory, the knowledge of unused/under-used VMs will enable
administrators to decide whether/not to pull down such VMs in an effort to conserve valuable physical resources. The
resources thus released may be used to support critical operations performed by other VMs or to avert
slowdowns/performance degradations experienced by mission-critical applications executing on these VMs.
To provide administrators with insights into the state and usage of VMs across their virtualized environment, and to
enable them to instantly identify unused VMs, eG Enterprise offers the VM Sprawl report. Using this report,
administrators can figure out the following:
How many VMs across the environment are in a powered-off state? Which ones are they?
What percentage of time has a VM been in a powered-off state?
Are there any powered-on VMs to which users have not logged in for a long time? If so, which ones are
they?
How much memory and disk space has each unused VM been configured with? Can the removal of these
unused VMs improve the performance of other VMs and applications executing on them?
281
Virtualization Reports
To generate this report, do the following:
1.
Follow the menu sequence: REPORTS BY FUNCTION -> Virtualization -> Virtual Machines -> VM Sprawl in the
eG Reporter interface. Figure 9.33 then appears.
Figure 9.33: Providing the specifications for the VM SPRAWL report
2.
As shown in Figure 9.33, for a graphical report, select Graph as the Report Type. For a tabular report, select
Data.
3.
Then, select a criterion for analysis from the Analyze by list box. Using this report, you can analyze the
performance of one/more independent virtualized components, or those that are part of a Zone. The options
provided by the Analyze by list box are discussed hereunder:
o
Component: Select this option to choose the component(s) from across all the managed components in the
environment. For instance, for a report on the performance of all the managed ESX hosts in the
environment, select VMware vSphere ESX from the Component Type list, select Component from the
Analyze by list, and then select all the virtual hosts listed in the Component list.
o
Zone: Pick this option for a report on the performance of virtual components that are included in a zone.
Then, choose a Zone. When a zone is picked, the Include Subzone flag is set to "Yes" by default, indicating
that the virtual components within the Subzones of the chosen zone will also be considered for report
generation. To exclude Subzones from the scope of your report, set this flag to "No". The Component
Types list will then be populated with the virtual component types that are part of the chosen zone (and
Subzone, if Include Subzone is set to "Yes"). Selecting a type from this list will populate the Components
list with all components of that type, which are present in the selected zone. Select the required
components from this list.
282
Virtualization Reports
By default, the Component Types that are supported by this report are specified in the eg_report.ini
file available in the {EG_INSTALL_DIR}\manager\config directory. To extend support to a new virtual
component type, edit the eg_report.ini file, and append the internal name of the new component-type
to the comma-separated list of types that pre-exists against the Components parameter in the
[VM_SPRAWL] section of the file. For example, if an IBM pSeries Component Type has to be included
in the eg_report.ini file, then include pSeries_server (internal name of the IBM pseries) to the commaseparated list of Components as indicated below:
Components=Oracle_vm_server,VMWare_VDI_Box,Xen_VDI_Box,HyperV_VDI_Box,Redhat_linux_hpv,
Redhat_linux_vdi,Oracle_vdi_VirtualBox,Vmware_esx_server,VmEsx_i_server,Xen_virtual_server,
Hyperv_server,Vmware_vdi_server,VmVdi_i_server,Xen_desktop_server,HyperV_VDI_server,
pSeries_server,KVM_server,KVM_vdi_server
4.
If the Component list consists of too many components, then viewing all the components and selecting the ones
you need for report generation could require endless scrolling. To avoid this, you can click the
button next
to the Component list. The COMPONENTS pop up window will then appear using which you can view almost all
the components in a single interface and select the ones for which the report is to be generated.
5.
Then, specify the Timeline for the graph. You can either provide a fixed time line such as 1 hour, 2 days, etc.,
or select the Any option from the list to provide a From and To date/time for report generation.
For every user registered with the eG Enterprise system, the administrator can indicate the maximum
timeline for which that user can generate a report. Once the maximum timeline is set for a user, then,
whenever that user logs into eG Reporter and attempts to generate a report, the Timeline list box in
the report page will display options according to the maximum timeline setting of that user. For
instance, if a user can generate a report for a maximum period of 3 days only, then 3 days will be the
highest option displayed in the Timeline list - i.e., 3 days will be the last option in the fixed Timeline
list. Similarly, if the user chooses the Any option from the Timeline list and proceeds to provide a start
date and end date for report generation using the From and To specifications, eG Enterprise will first
check if the user's Timeline specification conforms to his/her maximum timeline setting. If not, report
generation will fail. For instance, for a user who is allowed to generate reports spanning over a
maximum period of 3 days only, the difference between the From and To dates should never be over
3 days. If it is, then, upon clicking the Run Report button a message box will appear, prompting the
user to change the From and To specification.
6.
In addition to the settings discussed above, this report comes with a set of default specifications. These settings
are hidden by default. If you do not want to disturb these default settings, then you can proceed to generate
the report by clicking the Run Report button soon after you pick one/more components from the Components
list. However, if you want to view and then alter these settings (if required), click on the
button. The default
settings will then appear in the MORE OPTIONS drop down window (see Figure 9.35). The steps below discuss
283
Virtualization Reports
each of these settings and how they can be customized.
Figure 9.34: The default settings for generating the VM Sprawl report
7.
8.
Select one of the following options from the Metric drop down list.
o
For ESX hosts in the environment, the default selection from the Metric drop-down is Powered On.
o
For VDI environments, the Metric drop-down will provide an additional Powered On With User option.
Then, select a convenient show option from the Show drop list.
The Show drop down list appears only when a graphical report is to be generated. The
selection from this list governs the maximum number of VMs to be displayed in the bar
graph. The default options of the Show list are: Top-25, Top-50, All, Last-25, Last-50. This
default setting is governed by the ShowTop parameter in the [VM_SPRAWL] section of the
eg_report.ini file (in the {EG_INSTALL_DIR}\manager\config directory). By default, this
ShowTop parameter is set to 50. To view bar graphs for a more or less number of VMs, you
may want to change this value. For example, if you set ShowTop to 100, then, the Show
drop-down list in the report page will provide administrators with the following options: Top100, Top-50, All, Last-100, and Last-50.
9.
eG Enterprise allows users to generate desired reports for a specific time period. In large environments, while
generating reports for long time periods, say a few weeks to months, report generation was found to slow
down, owing to the large volume of data being processed. If users needed to generate many such reports
quickly, the slowdown compelled them to generate these reports one after another, thus affecting the speed of
their operations, and consequently, their productivity. eG Enterprise now includes a background processing
feature that will enable users to process multiple reports, spanning long time periods in the background, while
allowing them the bandwidth to generate short-term reports in the foreground. This way, users can generate
multiple reports with little-to-no loss of time. To schedule background processing of a report, select the
Background Save - PDF option from the Report Generation list. In this case, a Report Name text box will appear,
where you would have to provide the name with which the report is to be saved in the background. To process
reports in the foreground, select the Foreground Generation - HTML option from this list.
284
Virtualization Reports
10.
The Report Generation list will appear only if the EnableBackgroundReport flag in
the [BACKGROUND_PROCESS] section of the eg_report.ini file (in the
{EG_INSTALL_DIR}\manager\config directory) is set to Yes.
The default selection in the Report Generation list will change according to the
Timeline specified for the report. If the Timeline set is greater than or equal to the
number of days specified against the MinDurationForReport parameter in the
[BACKGROUND_PROCESS] section of the eg_report.ini file, then the default
selection in the Report Generation list will be Background. On the other hand, if the
Timeline set for the report is lesser than the value of the MinDurationForReport
parameter, then the default selection in the Report Generation list will be
Foreground. This is because; the MinDurationForReport setting governs, when
reports are to be processed in the background. By default, this parameter is set to
2 weeks - this indicates that by default, reports with a timeline of 2 weeks and
above will be processed in the background.
Finally, click the Run Report button to generate the report.
Figure 9.35: Graph showing the Powered On state of the VMs
11.
For ESX virtual hosts environment, if the Report Type is Graph, you will view a report comprising a bar chart
that reveals the VMs that have been configured on all the chosen virtual hosts, and the percentage of time
(during the chosen Timeline) for which each VM has been in a powered-on state. Using this graph, you can
instantly identify VMs that have remained in a powered-off state for a considerably long time; this way, VMs
that have been unnecessarily eroding the allocated resources can be identified. Figure 9.35 shows the bar
graph of this report.
12.
For VDI environments, if the Display option chosen is Powered On With User, then, the resulting bar chart will
reveal the percentage of time each VM in the environment has been in the powered on state with a user logged
in. Using this graph, you can not only identify VMs that have been powered-off for a long time, but also
powered-on VMs that have remained idle for a long time.
285
Virtualization Reports
You can configure the bar colors of the bar chart in the report, by editing the eg_report.ini
file in the {EG_INSTALL_DIR}\manager\config directory. The FusionColorForPowerOnPercent
parameter in the [VM_SPRAWL] section of the file defines the default colors of the bars in
your graph. You can change any of the color codes to change the color of a bar.
13.
Unlike a Graph report, a Data report does not graphically represent the measure data. Instead, the configured
details are presented in a tabular format in the report.
14.
If the Report Type is Data, select a column name by which the report data is to be sorted from the Sort by list.
Then, like in the case of a Graph report, specify a Timeline for which the report is to be generated and finally,
click on the Run Report button.
15.
For each VM configured on the chosen virtual components, the data report will display the percentage of time
for which that VM was in a powered-on state during the stated timeline (Refer Figure 9.36). In addition, the
Last Powered On time of a VM is also revealed - this is nothing but the last time the eG agent checked the
status of the VM and found that it was powered-on. Using this information, you can determine whether the VM
was powered-on or off during the last measurement period. Also the measures such as Memory and Disk
Capacity can also be viewed per VM, thus enabling you to assess how removal of unused VMs will impact the
resource availability on the host.
Figure 9.36: Data report of the VMs in ESX environments
16.
In case of VDI environments, the data report will additionally reveal the percentage of time for which each VM
was powered-on with an active user session; this way, you can quickly identify powered-on VMs that have been
idle for long time periods. Also, a Last User Access Time will be available for each VM, which will reveal the last
time a user had logged into that VM - this is nothing but the last time the eG agent checked the state of the VM
and found that it was powered on with a user session active on it. Figure 9.37 will reveal the data report for the
VDI environments.
286
Virtualization Reports
Figure 9.37: Data report of the VMs in VDI environments
17.
If the Background Save - PDF option is chosen from the Report Generation list, then clicking on the Run Report
button will not generate the report and display it in this page for your benefit. Instead, a message indicating
that the report is being processed in the background will appear. This will be accompanied by a link, which will
lead you to the page that lists all the reports that are being processed in the background, and their current
status. If background report generation fails for a report, you can regenerate that report using this page, or can
even delete that report if need be. On the other hand, if background processing successfully completes for your
report, then, you can view a PDF of the report by clicking on the
icon in that page.
Before emailing reports, ensure that the SMTP mail host and eG Administrator mail
ID are properly configured in the eG administrative interface (using the Alerts ->
Mail Settings -> Server Settings option).
When reports are sent by email, the body of the email will contain the reports so
sent in HTML format. You can, if you so desire, send the report as an attachment
by setting the SendMailAsAttachment flag to Yes (or True). This flag is available in
the
[MISC_ARGS]
section
of
the
eg_services.ini
file
(in
the
{EG_INSTALL_DIR}\manager\config directory).
9.7 Virtual Machines - VM Changes Report
Large virtualized environments often consist of too many VMs hosted on the virtual server. Apart from monitoring
these VMs, monitoring the addition, migration and removal of VMs from the virtual server poses a major problem for
the administrators. Using the VM Changes report, you can easily identify the VMs that are currently added to and
removed from the virtual server. In addition to this, administrators can figure out those VMs that were migrated
within the resource pools of the virtual server or outside the virtual server.
Essential Pre-requisites for generating the VM Changes report:
In order to generate the VM Changes report, ensure that the VM Movement test is enabled. By default, this test
is disabled. To enable the test, go to the ENABLE / DISABLE TESTS page in the eG admin interface using the
menu sequence: Agents -> Tests -> Enable/Disable, pick the component-type for which these tests are to be
enabled as the Component type, set Performance as the Test type, choose the tests from the DISABLED TESTS
list, and click on the >> button to move the tests to the ENABLED TESTS list. Finally, click the Update button.
Once the test is enabled, ensure that the test is up and running i.e., collecting the required metrics.
287
Virtualization Reports
To generate the VM Changes report, do the following:
1.
Follow the menu sequence: REPORTS BY FUNCTION -> Virtualization -> Virtual Machines -> VM Changes.
2.
Figure 9.38 will then appear. By default, the Report for list will display VMware vCenter as its selection.
Figure 9.38: Selecting the criteria for the VM Changes report
3.
4.
Next, from the Components list, select the vCenter server(s) for which this report is to be generated. By default,
all the managed vCenter servers in your environment will be listed here. This is because, the default selection
from the Analyze by list is Component. You can however narrow your search by opting to view only those
vCenter servers that are part of a service/segment/zone in the VMware vCenter list. For this, select the Zone,
Service, or Segment, option from the Analyze By field:
o
Selecting the Zone option will allow you to select the desired zone from the Zone list box. To include the
vCenter servers within a specific subzone also in the VMware vCenter list, set the Include subzone flag to
Yes.
o
In the same way, to make the vCenter servers that are part of a particular segment or service available for
selection in the VMware vCenter list, select Service or Segment from the Analyze By list box. Then, select
the desired service or segment from the Service or Segment list.
If the Components list consists of too many vCenter servers, then viewing all the components and selecting the
ones you need for report generation could require endless scrolling. To avoid this, you can click the
button
next to the Components list. The COMPONENTS pop up window will then appear using which you can view
almost all the vCenter servers in a single interface and select the ones for which the report is to be generated.
5.
Select an option from the Measures list for which the report is to be generated. By default, All option is chosen
from this list indicating that this report will be generated for all the VMs that are added, removed and migrated
from the chosen vCenter components.
6.
Specify the report Timeline. You can either provide a fixed time line such as 1 hour, 2 days, etc., or select the
Any option from the list to provide a From and To date/time for report generation.
288
Virtualization Reports
For every user registered with the eG Enterprise system, the administrator can indicate the
maximum timeline for which that user can generate a report. Once the maximum timeline is
set for a user, then, whenever that user logs into eG Reporter and attempts to generate a
report, the Timeline list box in the report page will display options according to the maximum
timeline setting of that user. For instance, if a user can generate a report for a maximum
period of 3 days only, then 3 days will be the highest option displayed in the Timeline list i.e., 3 days will be the last option in the fixed Timeline list. Similarly, if the user chooses the
Any option from the Timeline list and proceeds to provide a start date and end date for
report generation using the From and To specifications, eG Enterprise will first check if the
user's Timeline specification conforms to his/her maximum timeline setting. If not, report
generation will fail. For instance, for a user who is allowed to generate reports spanning over
a maximum period of 3 days only, the difference between the From and To dates should
never be over 3 days. If it is, then, upon clicking the Run Report button a message box will
appear, prompting the user to change the From and To specification.
7.
In addition to the settings discussed above, this report comes with a set of default specifications. These settings
are hidden by default. If you do not want to disturb these default settings, then you can proceed to generate
the report by clicking the Run Report button soon after you pick an option from the Components list. However,
if you want to view and then alter these settings (if required), click on the
icon. The default settings will
then appear in the MORE OPTIONS drop down window (see Figure 9.39). The steps below discuss each of
these settings and how they can be customized.
Figure 9.39: The default settings for generating the VM changes report
8.
The Migration Filter list box will appear only when either the All or Migrated VMs option is chosen from the
Measures list. By default, All migrations option is chosen from this list box. If you wish to generate the report
for those VMs that have migrated across clusters alone, select the Migrations across cluster option from this
list.
9.
Next, specify the start time and end time for report generation against the Time period field.
10.
If the timeline specified for the report needs to exclude the data collected during the Weekends, then set
Exclude weekends to Yes. If not, select No.
289
Virtualization Reports
By default, the weekend constitutes Saturday and Sunday. To override this default setting,
do the following:
11.
12.
Edit the eg_report.ini file in the <EG_INSTALL_DIR>\manager\config directory.
In the [MEASURE_GROUP] section of the file, the EXCLUDE_WEEKEND parameter is
set to Saturday,Sunday by default. You can modify this by setting the
EXCLUDE_WEEKEND parameter to a comma-separated list of other days of the week
- say Friday,Saturday.
Save the file after making the required changes.
In large environments, reports generated using months of data can take a long time to complete.
Administrators now have the option of generating reports on-line or in the background. When a report is
scheduled for background generation, administrators can proceed with their other monitoring, diagnosis, and
reporting tasks, while the eG manager is processing the report. This saves the administrator valuable time. To
schedule background processing of a report, select the Background Save - PDF option from the Report
Generation list. In this case, a Report Name text box will appear, where you would have to provide the name
with which the report is to be saved in the background. To process reports in the foreground, select the
Foreground Generation - HTML option from this list.
The Report Generation list will appear only if the EnableBackgroundReport flag in
the [BACKGROUND_PROCESS] section of the eg_report.ini file (in the
{EG_INSTALL_DIR}\manager\config directory) is set to Yes.
The default selection in the Report Generation list will change according to the
Timeline specified for the report. If the Timeline set is greater than or equal to the
number of days specified against the MinDurationForReport parameter in the
[BACKGROUND_PROCESS] section of the eg_report.ini file, then the default selection
in the Report Generation list will be Background. On the other hand, if the Timeline
set for the report is lesser than the value of the MinDurationForReport parameter,
then the default selection in the Report Generation list will be Foreground. This is
because, the MinDurationForReport setting governs when reports are to be
processed in the background. By default, this parameter is set to 2 weeks - this
indicates that by default, reports with a timeline of 2 weeks and above will be
processed in the background.
Finally, click the Run Report button. Figure 9.40 will now appear.
290
Virtualization Reports
Figure 9.40: The VM Changes report
13.
Figure 9.40 shows a tabular VM changes report for a chosen vCenter server. If All option is chosen from the
Measures list and the Foreground Generation –HTML option is chosen from the Report Generation list, then the
report consists of the following sections:
Added VMs – This section will list out all the VMs that are currently added to the vCenter server and the
exact target i.e., the host/resource pool/cluster to which the VMs were added can be identified. In
addition, the resource allocation to the VMs can also be identified using this report.
Migrated VMs – This section helps you to identify which are the VMs that are migrated from a source
host/cluster/resource pool to the target host/cluster/resource pool.
Removed VMs – This section lists all the VMs that are removed from the vCenter server and the source
from which the VMs have been removed i.e., the host/cluster/resource pool from which the VMs were
removed can be identified.
If Added VMs option is chosen from the Measures list and the Foreground Generation –HTML option is chosen
from the Report Generation list, then the generated report will display only the Added VMs section. Likewise
this report can be generated for the migrated VMs and the removed VMs by choosing the appropriate option
from the Measures list.
9.8 The Virtual Machines – VM Distribution Report
In large virtualized farms, it is often difficult for administrators to know the VMs configured on the various virtual
hosts and the current status of each VM. The use of VMotion/XenMotion technologies to migrate resource-intensive
VMs to hosts that are well-sized, compounds the problem, as tracking the movement of VMs across hosts becomes a
herculean task.
The Virtual Machines – VM Distribution report is ideal for such farms as it provides administrators with the following:
a quick look at the VMs registered with a few/all virtual hosts in the environment;
the powered-on status of the VMs;
which VMs were VMotioned/XenMotioned to or from chosen virtual hosts in the environment during the
configured timeline;
To generate the Virtual Machines - VM Distribution report, do the following:
1.
Follow the menu sequence: REPORTS BY FUNCTION -> Virtualization -> Virtual machines -> VM Distribution in
the eG Reporter interface.
2.
Figure 9.41 then appears. First, indicate the type of report to be generated by selecting either Graph or Data as
the Report Type. To generate a graphical report, select the Graph option. To select a data-based report, pick
Data as the Report Type.
291
Virtualization Reports
Figure 9.41: Selecting the criteria for the Virtual machines - VM Distribution report
3.
Next, from the Component Type list, pick the virtualized component type for which the report is to be
generated. By default, all managed virtualization platforms will be listed here.
4.
Then, select a criterion for analysis from the Analyze by list box. Using this report, you can analyze the status of
VMs that are configured on one/more independent virtualized components, or those that are configured on
virtual hosts that are part of a segment, service, or a zone. The options provided by the Analyze by list box are
discussed hereunder:
o
Component: Select this option to choose the component(s) from across all the managed virtualized
components in the environment. For instance, for a report on the status of VMs on all the managed
vSphere/ESX hosts in the environment, select VMware vSphere ESX from the the Component Type list,
select Component from the Analyze by list, and then select all the virtual hosts listed in the Components list
of Figure 9.41.
o
Service: Select this option if the components for which a report is to be generated are involved in the
delivery of a business service. Then, select a Service.
o
Segment: Choose this option if the virtual hosts to be evaluated are part of a segment. Then, pick a
Segment for analysis.
o
Zone: Pick this option for a report on the status of VMs on one/more virtual components that are included
in a zone. Then, choose a Zone. Also, indicate whether the virtual hosts present within the sub-zones of
the chosen zone are also to be to be considered for report generation, by selecting an option from the
Include subzones list.
5.
Based on the criterion chosen from the Analyze by list, the Components list will be populated. Select one/more
of the listed components to generate a report. If the Components list consists of too many components, then
viewing all the components and selecting the ones you need for report generation could require endless
scrolling. To avoid this, you can click the
icon next to the Components list. The COMPONENTS pop up
window will then appear using which you can view almost all the components in a single interface and select
the ones for which the report is to be generated.
6.
If the Report Type is Graph, you will have to select the Measure for which the graphical report is to be
generated. The Measure list is updated with pre-configured measures. By default, all measures indicating the
status of VMs will be available in the Measure list.
7.
The Graph report typically provides a pie chart that depicts the VM distribution across the chosen components,
and a bar chart that indicates the number of VMs per chosen component. By selecting an option from the Show
list, you can indicate the maximum number of components to be displayed in the bar chart.
292
Virtualization Reports
The options available in the Show list are configurable. To do so, follow the steps given
below:
8.
Edit the eg_report.ini file in the <EG_INSTALL_DIR>\manager\config directory.
Specify a number of your choice against the NoOfServersforChart parameter in the
[VIRTUAL_GUEST_STATUS] section of the file. By default, the value displayed here is
10, indicating that, by default, the Show list will contain the Top-5, Top-10, Last5,and Last-10 options. If the report is to be generated for a total of 5 components
only, then you might want to change the value of the NoOfServersforChart
parameter to 5 instead. In such a case therefore, the Show list will contain the
Top-3, Top-5, Last-3, and Last-5 options only. This way, based on the number of
Components chosen for report generation, you can specify any value against the
NoOfServersforChart parameter.
Finally, save the eg_report.ini file.
Then, specify the Timeline for the graph. You can either provide a fixed time line such as 1 hour, 2 days, etc.,
or select the Any option from the list to provide a From and To date/time for report generation.
For every user registered with the eG Enterprise system, the administrator can indicate the
maximum timeline for which that user can generate a report. Once the maximum timeline is
set for a user, then, whenever that user logs into eG Reporter and attempts to generate a
report, the Timeline list box in the report page will display options according to the maximum
timeline setting of that user. For instance, if a user can generate a report for a maximum
period of 3 days only, then 3 days will be the highest option displayed in the Timeline list i.e., 3 days will be the last option in the fixed Timeline list. Similarly, if the user chooses the
Any option from the Timeline list and proceeds to provide a start date and end date for
report generation using the From and To specifications, eG Enterprise will first check if the
user's Timeline specification conforms to his/her maximum timeline setting. If not, report
generation will fail. For instance, for a user who is allowed to generate reports spanning over
a maximum period of 3 days only, the difference between the From and To dates should
never be over 3 days. If it is, then, upon clicking the Run Report button a message box will
appear, prompting the user to change the From and To specification.
9.
In addition to the settings discussed above, this report comes with a set of default specifications. These settings
are hidden by default. If you do not want to disturb these default settings, then you can proceed to generate
the report by clicking the Run Report button soon after you pick an option from the Show list. However, if you
want to view and then alter these settings (if required), click on the
button. The default settings will then
appear in the MORE OPTIONS drop down window (see Figure 9.42). The steps below discuss each of these
settings and how they can be customized.
293
Virtualization Reports
Figure 9.42: The default settings for generating the Virtual Machines – VM Distribution report
10.
The speed with which a report is generated depends primarily on the report Timeline. While a Timeline that
varies between a couple of days to a week enables the eG Enterprise system to quickly retrieve the required
data, timelines that span multiple weeks/months could slow-down the data retrieval and report generation
process to a considerable extent, owing to the volume of data involved. In order to ensure quick and easy
access to reports, eG Enterprise provides you the option of enabling data retrieval from the Trend information in
the database, instead of the Detailed test information that is used by default for report generation. The Detailed
test information based comprises of multiple measurement records for a test - one or more each for every test
execution. Whereas, the Trend information includes only hourly, daily, and monthly summary computations for
a test performed on a continuous basis. For instance, during a period of 1 hour, a test that runs every 5
minutes inserts atleast 12 records into the Detailed test information base. On the other hand, the Trend
information base would consist of only 1 record for the same 1 hour period. Fewer the number of records,
query execution becomes much quicker, and data retrieval faster. To use the trend data for report generation,
you will have to select the Trend option from the Show Data field in Figure 9.42. By default, the Detailed option
is selected in Figure 9.42 indicating that the report data is retrieved from the detailed test information in the
database. If need be, you can also ensure that all reports always use the Detailed test tables alone by hiding
the Show Data field from the reporter interface. To achieve this, do the following:
Login to the eG administrative interface as 'admin'.
Select the Manager option from the Settings tile that appears when the
clicked.
From the GENERAL SETTINGS page that then appears, if you set the Compute average/sum of metrics
while trending flag to No, then the Show Data field will not appear in the reporter interface; this denies
users access to the Trend option, and thus ensures that reports are always generated using the Detailed
tables.
294
button against the Admin tab is
Virtualization Reports
11.
A Trend report will not include the data for the current day since trend data is only
computed at the end of the day.
If the Trend option is chosen, the time period of the report should be greater than
1 day.
The usage of Detailed test tables for generating reports, especially those that span
weeks, increases the stress on the eG database, thus resulting in undue delays in
report generation. In order to ensure that the database is not choked by such
voluminous data requests, you can configure eG Enterprise to automatically "force"
the use of the Trend option if the Timeline of a report exceeds a pre-configured
duration. To specify this time boundary, do the following:
Edit the eg_report.ini file in the <EG_INSTALL_DIR>\manager\config directory.
In the [MISC] section of the file, you will find a DetailedTime parameter.
Specify the duration (in days) beyond which Detailed reports cannot be
generated, against the DetailedTime parameter, and save the eg_services.ini
file.
For instance, to make sure that Detailed reports are disallowed for a Timeline
of over 2 weeks, set the DetailedTime parameter to 14 and save the file.
Say, subsequently, you attempt to generate a Detailed report for a Fixed
Timeline of 3 weeks (which is greater than the 14-day limit set in our
example). The instant you select the 3 weeks option from the Fixed list box,
the Detailed option gets automatically disabled, and the Trend option gets
enabled. Similarly, if you specify an Any Timeline that runs over 14 days, then,
upon clicking the RUN REPORT BUTTON to generate the report, a message box
appears (see Figure 5.7) informing you that only the Trend option is permitted.
To proceed with the Trend report generation, click the OK button in the
message box. To terminate Trend report generation, click the CANCEL button.
If the timeline specified for the report needs to exclude the data collected during the Weekends, then set
Exclude weekends to Yes. If not, select No.
295
Virtualization Reports
By default, the weekend constitutes Saturday and Sunday. To override this default setting,
do the following:
Edit the eg_report.ini file in the <EG_INSTALL_DIR>\manager\config directory.
In the [VIRTUAL_GUEST_STATUS] section of the file, the EXCLUDE_WEEKEND
parameter is set to Saturday,Sunday by default. You can modify this by setting the
EXCLUDE_WEEKEND parameter to a comma-separated list of other days of the week
- say Friday,Saturday.
Save the file after making the required changes.
12.
Next, indicate the report Time period.
13.
In large environments, reports generated using months of data can take a long time to complete.
Administrators now have the option of generating reports on-line or in the background. When a report is
scheduled for background generation, administrators can proceed with their other monitoring, diagnosis, and
reporting tasks, while the eG manager is processing the report. This saves the administrator valuable time. To
schedule background processing of a report, select the Background Save - PDF option from the Report
Generation list. In this case, a Report Name text box will appear, where you would have to provide the name
with which the report is to be saved in the background. To process reports in the foreground, select the
Foreground Generation - HTML option from this list.
14.
The Report Generation list will appear only if the EnableBackgroundReport flag in
the [BACKGROUND_PROCESS] section of the eg_report.ini file (in the
{EG_INSTALL_DIR}\manager\config directory) is set to Yes.
The default selection in the Report Generation list will change according to the
Timeline specified for the report. If the Timeline set is greater than or equal to the
number of days specified against the MinDurationForReport parameter in the
[BACKGROUND_PROCESS] section of the eg_report.ini file, then the default selection
in the Report Generation list will be Background. On the other hand, if the Timeline
set for the report is lesser than the value of the MinDurationForReport parameter,
then the default selection in the Report Generation list will be Foreground. This is
because, the MinDurationForReport setting governs when reports are to be
processed in the background. By default, this parameter is set to 2 weeks - this
indicates that by default, reports with a timeline of 2 weeks and above will be
processed in the background.
Finally, click the Run Report button. If the Report Type is Graph and the option chosen from the Report
Generation list is Foreground Generation - HTML, then, clicking on the Run Report button will invoke Figure 9.43.
296
Virtualization Reports
Figure 9.43: A graphical VM Distribution report
15.
Figure 9.43 comprises of the following:
A distribution pie chart that reveals the number of virtual hosts in different distribution ranges (see Figure
9.43). The distribution ranges are obtained by applying the first of the configured functions on the chosen
Measure. For instance, assume that Registered VMs is the chosen Measure. Say that you have configured
to display the Avg and Max of this measure in a Data report. Typically, both these configured values will
appear only in the Data report. In the case of a Graph report however, the first of the two functions - i.e.,
Avg of Registered VMs - alone is calculated for every virtual host chosen from the Component list. The
resulting pie chart enables administrators to deduce, at a glance, the number of virtual hosts with
powered-on VMs. Clicking on a particular slice in the pie chart lists the virtual hosts that fall within the
value range represented by that slice (see Figure 9.44). Against every virtual host, the actual values for
each of the configured functions (both Avg and Max, in our example) will be displayed. A
zone/component-type-level Summary of the chosen Measure will also be available.
Figure 9.44: Details of the hosts that fall within the distribution range clicked on
297
Virtualization Reports
By default, the chart type for distribution is a pie chart. However, you can have a
bar graph depict the same data instead of a pie chart, by following the steps given
below:
Edit the eg_report.ini file in the <EG_INSTALL_DIR>\manager\config directory.
Change
the
value
of
the
chartTypeForDist
parameter
[VIRTUAL_GUEST_STATUS] section of this file from the default Pie, to Bar.
Save the eg_report.ini file.
in
the
By default, the number of value ranges that need to be configured for the
distribution chart is 10. To override this default setting, do the following:
Edit the eg_report.ini file in the <EG_INSTALL_DIR>\manager\config directory.
Specify a number of your choice against the nofRangeForDist parameter in the
[VIRTUAL_GUEST_STATUS] section of this file. By default, this parameter will hold the
value 10.
Save the eg_report.ini file.
Adjacent to the pie chart, you will find a bar chart that indicates the virtual hosts that have topped/failed
in a selected performance realm (i.e., the Measure) during the specified Timeline. For example, for the
Registered VMs measure, this bar chart reveals the virtual hosts that have a large number of VMs
powered on. Like the pie chart, the values for the bar chart are also calculated by applying the first of the
configured functions on the chosen Measure. To zoom into the performance of a particular ESX server,
click on its corresponding bar. Figure 9.45 then appears revealing how that ESX server has performed
overall, during the specified Timeline.
298
Virtualization Reports
You can configure the colors to be used in the distribution chart and the Top <N> Components bar
chart in the zone report, by editing the eg_report.ini file in the <EG_INSTALL_DIR>\manager\config
directory. The [VIRTUAL_GUEST_STATUS] section of the file defines the 20 default colors of the
distribution and bar charts:
[VIRTUAL_GUEST]
ChartColor=#8399b0,#ffd95a,#a4ac91,#98d980,#d5b996,#f48848,#8b8cc2,
#eb4052,#c4b3d0,#b18651,#ebb7ce,#028768,#f5c372,#887c65,#e4c536,
#b5582c,#f94989,#770d72,#97a067,#89aeb7
distColor=#115fa6,#f25454,#60bd68,#b276b2,#81bef7,#a61120,#ffd13e,
#770d72,#887c65,#a4ac91
You override the default color settings of the distribution chart by modifying the color-codes
specifying against distColor. For changing the colors used by the Top <N> Components chart, alter
the codes listed against the ChartColor parameter.
The number of components to be displayed in the Top <N> Components bar chart is
configurable. To specify the number, do the following:
Edit the eg_report.ini file in the <EG_INSTALL_DIR>\manager\config directory.
Specify a number of your choice against the NoOfServersforChart parameter in the
[VIRTUAL_GUEST_STATUS] section of the file. By default, the value displayed here is
10, indicating that, by default, the bar chart will be for the Top 10 Components. For
example, if you change this value to 5, then a bar chart displaying the Top 5
Components will appear. This is the same parameter that governs the options
available in the Show list of Figure 9.41.
Finally, save the eg_report.ini file.
299
Virtualization Reports
Figure 9.45: A Server Report revealing the overall performance of the ESX server clicked on
16.
Unlike a Graph report, a Data report does not graphically represent the measure data. Instead, the configured
details are presented in a tabular format in the report. If you select the Data option from Report Type, then you
will not have to select a particular measure for the data report. Instead, you will have to select the column by
which the resultant data report is to be sorted from the Sort By list. Also, pick Foreground Generation - HTML
from the Report Generation list.
17.
If you then click on the Run Report button, a report depicted by Figure 9.46 will appear.
300
Virtualization Reports
Figure 9.46: The VM Distribution Data report
18.
For every component chosen from the Components list, the Data report displays the values computed by
applying each of the configured functions on every measure configured for the report. This provides you with
an overview of the status of VMs on every virtual host, over the given timeline. By clicking on the Max value of
a measure, you can view the DETAILED DIAGNOSIS of that measure revealing the details of VMs that are in the
corresponding state - for instance, clicking on the Max value of the Removed Guests measure in Figure 9.46 will
reveal Figure 9.47 that lists the names of the VMs that were removed during the last measurement period.
301
Virtualization Reports
Figure 9.47: The detailed diagnosis of the Removed Guests measure
19.
In addition, the report also provides time-of-day graphs for each of the configured measures, using which you
can analyze the variations in VM status over time.
You can configure the measures and functions for which the VM Distribution report is to be generated. To
achieve this, follow the steps given below:
Edit the eg_report.ini file in the <EG_INSTALL_DIR>\manager\config directory.
By default, the [VIRTUAL_GUEST_STATUS] section of the file includes entries of the following format for the
measures and functions applicable to the VM Distribution report:
<InternalTestName>#<InternalMeasureName>#<DisplayNameofMeasure>=<Comma-separated
functions to be applied>
list
of
Refer to the procedure discussed in the Page 212 of this manual to determine the internal name of a
test/measure.
You can remove one/more of the measure confgurations that pre-exist by deleting or commenting the
corresponding entries in the [VIRTUAL_GUEST_STATUS] section. In addition, you can even configure more
measures and functions for the report, by simply appending/inserting a line in the above-mentioned format
in the [VIRTUAL_GUEST_STATUS] section.
For instance, to ensure that the report supports the Added guests measure returned by the LDomsGuestsStatus
test, and applies both the average and max functions on the measure, your specification should be:
LdomsStatusTest:Added_guests#Added guests=Avg,Max
Finally, save the file.
9.9 The Virtual Machines – VM Capacity Planning Report
In large virtualized farms with tons of VMs, identifying resource intensive VMs is a huge task for the administrators. It
is also difficult to understand the reason behind the abnormal/excessive resource usage of the VMs – is it due to the
resource hungry processes of the VMs or due to the poor resource allocation of the VMs?
302
Virtualization Reports
The Virtual Machines – VM Capacity Planning report is ideal for such environments as it enables the administrators to
figure out the following:
At a single glance, you can analyze whether the VMs are impacting the physical resources of the host;
Identify the hosts to which the resource intensive VMs can be migrated; and
Check whether additional resources can be allocated to the VMs.
To generate the Virtual Machines – Capacity Planning report, do the following:
1.
Follow the menu sequence: REPORTS BY FUNCTION -> Virtualization -> Virtual Machines -> VM Capacity
Planning in the eG Reporter interface.
2.
In Figure 9.48 that appears, select a criterion for analysis from the Analyze by list box. Using this report, you
can analyze the capacity of the hosts and virtual machines hosted on independent virtual servers or those that
are part of a segment, service, or a zone. The options provided by the Analyze by list box are discussed
hereunder:
o
Component: Select this option to choose the component(s) from across all the managed virtualized
components in the environment. For instance, for a report on the capacity of VMs on all the managed
vSphere/ESX hosts in the environment, select VMware vSphere ESX from the Component Type list, select
Component from the Analyze by list, and then select all the virtual hosts listed in the Component list of
Figure 9.48. If the Component list consists of too many components, then viewing all the components and
selecting the ones you need for report generation could require endless scrolling. To avoid this, you can
click the
button next to the Component list. The COMPONENTS pop up window will then appear using
which you can view almost all the components in a single interface and select the ones for which the report
is to be generated.
o
Service: Select this option to generate the report for all virtual servers that are involved in the delivery of a
business service. Then, select a Service.
o
Segment: Choose this option if the virtual servers to be evaluated are configured on the virtual hosts that
are part of a segment. Then, pick a Segment for analysis.
o
Zone: Pick this option for a report on the status of virtual servers managed on all virtual hosts that are
included in a zone. Then, choose a Zone. Also, indicate whether the virtual servers present within the subzones of the chosen zone are also to be considered for report generation, by selecting an option from the
Include Subzone list.
Figure 9.48: Selecting the criteria for the Virtual Capacity report
3.
Next, from the Component Type list, pick the virtualized component-type for which the report is to be
generated. By default, all managed virtualization platforms will be listed here.
4.
Next, using the Timeline option, specify the period to which this report should pertain.
303
Virtualization Reports
For every user registered with the eG Enterprise system, the administrator can indicate the
maximum timeline for which that user can generate a report. Once the maximum timeline is
set for a user, then, whenever that user logs into eG Reporter and attempts to generate a
report, the Timeline list box in the report page will display options according to the maximum
timeline setting of that user. For instance, if a user can generate a report for a maximum
period of 3 days only, then 3 days will be the highest option displayed in the Timeline list i.e., 3 days will be the last option in the fixed Timeline list. Similarly, if the user chooses the
Any option from the Timeline list and proceeds to provide a start date and end date for
report generation using the From and To specifications, eG Enterprise will first check if the
user's Timeline specification conforms to his/her maximum timeline setting. If not, report
generation will fail. For instance, for a user who is allowed to generate reports spanning over
a maximum period of 3 days only, the difference between the From and To dates
should never be over 3 days. If it is, then, upon clicking the Run Report button a
message box will appear, prompting the user to change the From and To
specification.
5.
Based on the criterion chosen from the Analyze by list, the Component list will be populated. Select one/more of
the listed components to generate a report. If the Component list consists of too many components, then
viewing all the components and selecting the ones you need for report generation could require endless
scrolling. To avoid this, you can click the
button next to the Component list. The COMPONENTS pop up
window will then appear using which you can view almost all the components in a single interface and select
the ones for which the report is to be generated.
6.
In addition to the settings discussed above, this report comes with a set of default specifications. These settings
are hidden by default. If you do not want to disturb these default settings, then you can proceed to generate
the report by clicking the Run Report button soon after you pick an option from the Component list. However, if
you want to view and then alter these settings (if required), click on the
icon. The default settings will then
appear in the MORE OPTIONS drop down window (see Figure 9.49). The steps below discuss each of these
settings and how they can be customized.
304
Virtualization Reports
Figure 9.49: The default settings for generating the Virtual Machines – Capacity Planning report
7.
Pick an option from the Show VMs list box to view the current capacity of the hosts and individual VMs that are
hosted in the virtualized environment. By default, the VMs option will appear in this list box indicating that the
capacity of the VMs in the virtual environment can be viewed at a single glance. In order to view the current
capacity of the hosts, select the Hosts option from this list. Choose the Hosts & VMs option to clearly
understand the current capacity of the hosts and the corresponding VMs at a single glance.
8.
eG Enterprise System offers the flexibility of allowing the administrators to view the VMs/Hosts that consume
high/low resources from the generated report at a single glance. This can be achieved by providing the
lower/higher threshold limits of your choice i.e., providing the Minor/Major/Critical values in the appropriate
colored text boxes against the Low Utilization Limit and High Utilization Limit options. Doing so, whenever the
VMs/Hosts violate the specified threshold values, the current capacity of that particular VM/Host will be
highlighted with the corresponding color of the specified text box in the generated report. This way, you can
easily identify the VMs/Hosts that consume high/low resources in your environment. By default, the values
specified against the Minor/Major/Critical text boxes of the Low Utilization Limit and High Utilization Limit
options will be 5/10/15 and 85/90/95 respectively.
9.
Choose an option from the Apply Limits list box so that the values that fall in the range mentioned in the Low
Utilization Limit and High Utilization Limit options will be highlighted in the generated report. By default, all the
three options (CPU/Memory/Disk) will be selected indicating that the administrators can view the resource
intensive/resource hungry VMs/Hosts based on their CPU/Disk/Memory utilization.
10.
Next, indicate the report Time period.
11.
In large environments, reports generated using months of data can take a long time to complete.
Administrators now have the option of generating reports on-line or in the background. When a report is
scheduled for background generation, administrators can proceed with their other monitoring, diagnosis, and
reporting tasks, while the eG manager is processing the report. This saves the administrator valuable time. To
schedule background processing of a report, select the Background Save - PDF option from the Report
Generation list. In this case, a Report Name text box will appear, where you would have to provide the name
with which the report is to be saved in the background. To process reports in the foreground, select the
Foreground Generation - HTML option from this list.
305
Virtualization Reports
12.
The Report Generation list will appear only if the EnableBackgroundReport flag in
the [BACKGROUND_PROCESS] section of the eg_report.ini file (in the
{EG_INSTALL_DIR}\manager\config directory) is set to Yes.
The default selection in the Report Generation list will change according to the
Timeline specified for the report. If the Timeline set is greater than or equal to the
number of days specified against the MinDurationForReport parameter in the
[BACKGROUND_PROCESS] section of the eg_report.ini file, then the default selection
in the Report Generation list will be Background. On the other hand, if the Timeline
set for the report is lesser than the value of the MinDurationForReport parameter,
then the default selection in the Report Generation list will be Foreground. This is
because, the MinDurationForReport setting governs when reports are to be
processed in the background. By default, this parameter is set to 2 weeks - this
indicates that by default, reports with a timeline of 2 weeks and above will be
processed in the background.
Finally, click the RUN REPORT button. Figure 9.50 will appear.
306
Virtualization Reports
Figure 9.50: The Virtual Machines - Capacity Planning Report
13.
Figure 9.50 shows the Virtual Machines - Capacity Planning Report that is generated when the VMs option is
chosen from the Show VMs list box. Using this report, you can easily figure out the actual resource usage of the
VMS and identify which VMs are actually resource-intensive. The generated report will list the CPU, Memory and
disk usage of the host. From the generated report, you can easily identify the following:
The allocated virtual CPU and the CPU that is currently utilized by the VMs. The actual value in Megahertz
and the percentage of CPU utilized will be indicated in separate columns. (see Figure 9.50).
The actual memory allocated to the VM and the memory that is currently utilized by the VM. The memory
that is currently in use by the VM and the percentage of memory utilized will be represented in separate
columns.
307
Virtualization Reports
14.
In addition you can view the virtual disk space that is currently allocated to each VM, the actual disk space
that is utilized (in GB) and the percentage of disk space utilization.
If you have selected the Hosts option from the Show VMs list box, then the report (see Figure 9.51) will be
generated for all the virtual hosts of the target environment. The generated report will comprise the memory,
CPU and the disk utilization of the hosts in detail as elaborated in step 15. By default, the Hosts column will be
sorted in ascending order. If you wish to sort the hosts in the descending order, then click on the down arrow
adjacent to the Host in the generated report. Likewise, you can sort the report based on any column. To do so,
just click on the measurement units displayed in each column of the report. The column will now be sorted in
descending order.
Figure 9.51: The Virtual Machines - Capacity Planning report when the Hosts option is selected
15.
If the Hosts & VMs option is chosen from the Show VMs list box, then the report will be generated as in Figure
9.52. The generated report will be a combination of the report that is generated when the Hosts and the VMs
option are selected individually. In this report, you will be able to view the capacity of each individual host and
the VMs that are hosted through that host. 0.
308
Virtualization Reports
Figure 9.52: The Virtual machines - Capacity Planning report when the Hosts and VMs option is selected
9.10 The User VMs Report
Like components, segments, zones, and services, virtual machines can also be assigned to specific users. This feature
is particularly useful for cloud service providers, who often need to provision a VM on-demand for any customer who
requests for it. These cloud consumers (i.e., customers) are only concerned with the availability and internal health
of those VMs that the service provider has provisioned for them, as typically, they will have no knowledge of the
virtual servers on which the VMs operate. This means that these customers may not require monitoring access to the
whole virtual server as such. By configuring user-VM mappings using the eG administrative interface, the cloud
service providers will not only be able to track who is using which VM, but will also be able to provide a customer
with the ability to view in real-time the status, overall performance, and problems related to only the VMs (and not
the virtual servers) that were specifically launched on the cloud for him/her. To know how to associate VMs to users,
refer to the eG User Manual.
If a user who has been assigned VMs logs into the eG Reporter console, then a special User VMs report option will
309
Virtualization Reports
appear under the Virtualization menu of eG Reporter (see Figure 9.53).
Figure 9.53: Navigating to the User VMs report from the eG Reporter interface
If the current user to the eG Reporter console has the right to monitor only VMs and not any
other infrastructure element, then, for such a user, only the Operations, Virtualization, and
Options menus will be available in eG Reporter. Also, the Virtualization menu in this case will
include only the User VMs option.
With the help of the User VMs report, the user can zoom into one of the VMs assigned to him/her and analyze how
well that VM is using the resources allocated to it. Sporadic/consistent spikes in resource usage and root-cause for
such abnormal usage patterns can thus be deduced.
To generate the User VMs report, do the following:
1.
Upon selecting the User VMs option from Figure 9.53, Figure 9.54 will appear. The Virtual Machine list in Figure
9.54 will list all the VMs that have been explicitly assigned to the user who has logged in. Select a VM from this
list.
Figure 9.54: Generating the User VMs report
2.
Next, select Graph from the Report Type field to generate a graphical report. For a data report, select the Data
option.
3.
eG Enterprise collects a wide range of virtual resource usage metrics - i.e., ‘inside view’ metrics - from a VM.
Using the User VMs report, you can focus on how a chosen VM utilizes a specific resource - say CPU, memory,
disk space, etc. For this purpose, by default, eG Enterprise groups the virtual resource usage metrics of a VM
into six different ‘resource groups’, based on the ‘resource type’. These groups are, namely: Memory usage,
CPU usage, Disk usage, Network usage, TCP Connection, and Uptime Status. For instance, all key metrics
related to memory usage – e.g., allocated memory size, Memory max limited, Target memory, etc. - are by
310
Virtualization Reports
default included in the Memory usage group. Also, to provide administrators with a clearer view of a VM’s
resource usage, eG Enterprise, by default, computes the Avg and Max values of every metric in a group, and
displays these values in the report. To know how the chosen VM has used a particular resource across the
selected Components, pick one of the above-mentioned resource groups from the Measure Group list. On the
other hand, if you want to generate a report that brings out the overall resource usage of a VM across the
chosen Components, then select All from the Measure Group list.
The default resource groups Memory usage, CPU usage , Disk usage , Network usage, TcpIp
usage , and Time in usage - are hard-coded in the eG Enterprise system. The names of these
groups cannot be changed, and no new resource groups can be introduced. However, if need
be, additional metrics can be included in the default groups, and additional functions can be
applied to any of grouped metrics. For instance to add the Run queue in VM metric to the
CPU usage group, do the following:
Edit the eg_report.ini file in the <EG_INSTALL_DIR>\manager\config directory.
In the [VIRTUAL_MEASURE_GROUP] section of the file, insert a line for the new
metric, in the following format:
Cpu_usage:<InternalTestName>:<InternalMeasureName>=<Comma-separated list of
functions>
For the Run queue in VM measure therefore, your specification should be:
Cpu_usage:VmgSystemTest:Run_ueue_length=Avg,Max
To know the <InternalTestName> and <InternalMeasureName>, refer to the
procedure discussed in Page 212 of this document.
Finally, save the file.
Similarly, new metrics/functions can be added to the Memory_usage, Disk_usage,
Network_usage, Timein_usage , TcpIp_usage groups.
4.
In addition to the settings discussed above, this report comes with a set of default specifications. These settings
are hidden by default. If you do not want to disturb these default settings, then you can proceed to generate
the report by clicking the Run Report button soon after you pick an option from the Component list. However, if
you want to view and then alter these settings (if required), click on the
icon. The default settings will then
appear in the MORE OPTIONS drop down window (see Figure 9.55). The steps below discuss each of these
settings and how they can be customized.
311
Virtualization Reports
Figure 9.55: The default settings for generating the User VMs report
5.
The speed with which a report is generated depends primarily on the report Timeline. While a Timeline that
varies between a couple of days to a week enables the eG Enterprise system to quickly retrieve the required
data, timelines that span multiple weeks/months could slow-down the data retrieval and report generation
process to a considerable extent, owing to the volume of data involved. In order to ensure quick and easy
access to reports, eG Enterprise provides you the option of enabling data retrieval from the Trend information in
the database, instead of the Detailed test information that is used by default for report generation. The Detailed
test information based comprises of multiple measurement records for a test - one or more each for every test
execution. Whereas, the Trend information includes only hourly, daily, and monthly summary computations for
a test performed on a continuous basis. For instance, during a period of 1 hour, a test that runs every 5
minutes inserts atleast 12 records into the Detailed test information base. On the other hand, the Trend
information base would consist of only 1 record for the same 1 hour period. Fewer the number of records,
query execution becomes much quicker, and data retrieval faster. To use the trend data for report generation,
you will have to select the Trend option from the Show Data field in Figure 9.55. By default, the Detailed option
is selected in Figure 9.55 indicating that the report data is retrieved from the detailed test information in the
database. If need be, you can also ensure that all reports always use the Detailed test tables alone by hiding
the Show Data field from the reporter interface. To achieve this, do the following:
Login to the eG administrative interface as 'admin'.
Select the Manager option from the Settings tile that appears when the
clicked.
From the GENERAL SETTINGS page that then appears, if you set the Compute average/sum of metrics
while trending flag to No, then the Show Data field will not appear in the reporter interface; this denies
users access to the Trend option, and thus ensures that reports are always generated using the Detailed
tables.
312
button against the Admin tab is
Virtualization Reports
6.
A Trend report will not include the data for the current day since trend data is only
computed at the end of the day.
If the Trend option is chosen, the time period of the report should be greater than
1 day.
The usage of Detailed test tables for generating reports, especially those that span
weeks, increases the stress on the eG database, thus resulting in undue delays in
report generation. In order to ensure that the database is not choked by such
voluminous data requests, you can configure eG Enterprise to automatically "force"
the use of the Trend option if the Timeline of a report exceeds a pre-configured
duration. To specify this time boundary, do the following:
Edit the eg_report.ini file in the <EG_INSTALL_DIR>\manager\config directory.
In the [MISC] section of the file, you will find a DetailedTime parameter.
Specify the duration (in days) beyond which Detailed reports cannot be generated,
against the DetailedTime parameter, and save the eg_report.ini file.
For instance, to make sure that Detailed reports are disallowed for a Timeline of
over 2 weeks, set the DetailedTime parameter to 14 and save the file.
Say, subsequently, you attempt to generate a Detailed report for a Fixed Timeline
of 3 weeks (which is greater than the 14-day limit set in our example). The instant
you select the 3 weeks option from the Fixed list box, the Detailed option gets
automatically disabled, and the Trend option gets enabled. Similarly, if you specify
an Any Timeline that runs over 14 days, then, upon clicking the RUN REPORT
BUTTON to generate the report, a message box appears (see Figure 5.7) informing
you that only the Trend option is permitted.
To proceed with the Trend report generation, click the OK button in the message
box. To terminate Trend report generation, click the CANCEL button.
If the timeline specified for the report needs to exclude the data collected during the Weekends, then set
Exclude weekends to Yes. If not, select No.
313
Virtualization Reports
By default, the weekend constitutes Saturday and Sunday. To override this default setting,
do the following:
Edit the eg_report.ini file in the <EG_INSTALL_DIR>\manager\config directory.
In the [VIRTUAL_MEASURE_GROUP] section of the file, the EXCLUDE_WEEKEND
parameter is set to Saturday,Sunday by default. You can modify this by setting the
EXCLUDE_WEEKEND parameter to a comma-separated list of other days of the week
- say Friday,Saturday.
Save the file after making the required changes.
7.
Next, indicate the report Timeperiod.
8.
Then, specify the Timeline for the graph. You can either provide a fixed time line such as 1 hour, 2 days, etc.,
or select the Any option from the list to provide a From and To date/time for report generation.
For every user registered with the eG Enterprise system, the administrator can indicate the
maximum timeline for which that user can generate a report. Once the maximum timeline is
set for a user, then, whenever that user logs into eG Reporter and attempts to generate a
report, the Timeline list box in the report page will display options according to the maximum
timeline setting of that user. For instance, if a user can generate a report for a maximum
period of 3 days only, then 3 days will be the highest option displayed in the Timeline list i.e., 3 days will be the last option in the fixed Timeline list. Similarly, if the user chooses the
Any option from the Timeline list and proceeds to provide a start date and end date for
report generation using the From and To specifications, eG Enterprise will first check if the
user's Timeline specification conforms to his/her maximum timeline setting. If not, report
generation will fail. For instance, for a user who is allowed to generate reports spanning over
a maximum period of 3 days only, the difference between the From and To dates should
never be over 3 days. If it is, then, upon clicking the Run Report button a message box will
appear, prompting the user to change the From and To specification.
9.
In large environments, reports generated using months of data can take a long time to complete.
Administrators now have the option of generating reports on-line or in the background. When a report is
scheduled for background generation, administrators can proceed with their other monitoring, diagnosis, and
reporting tasks, while the eG manager is processing the report. This saves the administrator valuable time. To
schedule background processing of a report, select the Background Save - PDF option from the Report
Generation list. In this case, a Report Name text box will appear, where you would have to provide the name
with which the report is to be saved in the background. To process reports in the foreground, select the
Foreground Generation - HTML option from this list.
314
Virtualization Reports
10.
The Report Generation list will appear only if the EnableBackgroundReport flag in
the [BACKGROUND_PROCESS] section of the eg_report.ini file (in the
{EG_INSTALL_DIR}\manager\config directory) is set to Yes.
The default selection in the Report Generation list will change according to the
Timeline specified for the report. If the Timeline set is greater than or equal to the
number of days specified against the MinDurationForReport parameter in the
[BACKGROUND_PROCESS] section of the eg_report.ini file, then the default selection
in the Report Generation list will be Background. On the other hand, if the Timeline
set for the report is lesser than the value of the MinDurationForReport parameter,
then the default selection in the Report Generation list will be Foreground. This is
because, the MinDurationForReport setting governs when reports are to be
processed in the background. By default, this parameter is set to 2 weeks - this
indicates that by default, reports with a timeline of 2 weeks and above will be
processed in the background.
Finally, click the RUN REPORT button. If the Report Type is Graph and the option chosen from the Report
Generation list is Foreground Generation - HTML, then clicking on the RUN REPORT BUTTON invokes Figure 9.56.
The Graph report applies the first of the configured functions (i.e., Avg by default) on every metric in the
chosen group, and generates time-of-day graphs revealing the variations in the computed values in the chosen
VM during the specified period. These graphs help determine whether applications executing on the VM are
consuming the resources allocated to the VM excessively, or whether the VMs are inadequately sized.
315
Virtualization Reports
Figure 9.56: A graphical User VMs report
11.
Each graph in Figure 9.56 comes with a
clicking the
12.
and a
icons. You can view the data plotted in a graph by
icon and can save the data in a CSV file by clicking on the
icon.
If the Report Type were Data, then you would not be required to choose a Measure Group. The Data report
applies all the configured functions (i.e., both Avg and Max by default) on every metric in every measure group,
and displays all the computed values in a tabular format, once the Run Report button is clicked (see Figure
9.57). Under the individual measure groups, details of the resource usage of the chosen VM will be available.
316
Virtualization Reports
Figure 9.57: The User VMs Data Report
13.
On the other hand, if the Background Save - PDF option is chosen from the Report Generation list, then clicking
on the RUN REPORT BUTTON will not generate the report and display it in this page for your benefit. Instead, a
message indicating that the report is being processed in the background will appear. This will be accompanied
by a link that will lead you to the page that lists all the reports that are being processed in the background, and
their current status. If background report generation fails for a report, you can regenerate that report using this
page, or can even delete that report if need be. On the other hand, if background processing successfully
completes for your report, then, you can view a PDF of the report by clicking on the
icon in that page.
9.11 Virtual Machines - Right Sizing Report
In large virtualized environments where the role of each individual VM plays a major role, it is essential to provision
the VMs with appropriate sizing. This way, you can maintain the load on the VM. Using this report, you can - identify
317
Virtualization Reports
the VMs that are highly in need of CPU resources and those that are possessing CPU resources that are utilized in
sparse; and helps you in resizing the VMs according to the vCPU utilization.
To generate the Virtual Machines - Right Sizing report, do the following:
1.
Follow the menu sequence: REPORTS BY FUNCTION -> Virtualization -> Virtual Machines -> VM Right Sizing in
the eG Reporter interface.
2.
Figure 9.58 will then appear. Pick a criterion for analysis from the Analyze by list. Using this report, you can
analyze the size of the VMs available in the servers that are part of a segment, service, or a zone. The options
provided by the Analyze by list box are discussed hereunder:
o
Component: Select this option to choose the component(s) from across all the managed components in the
environment.
o
Service: Select this option if the components for which a report is to be generated are involved in the
delivery of a business service. Then, select a Service.
o
Segment: Choose this option if the components for which this report is to be generated are part of a
segment. Then, pick a Segment for analysis.
o
Zone: Pick this option if the components chosen are part of a zone. Then, choose a Zone. Also, indicate
whether the components within the sub-zones of the chosen zone are also to be considered for report
generation, by selecting an option from the Include Subzone list.
Figure 9.58: Selecting the criteria for the VM Right Sizing report
3.
Select the Component Type for which you wish to analyze the sizing of the VMs.
4.
The Components list will then be populated with the servers that match the Analyze By criteria specified earlier.
From this list, select the components for which the report is to be generated. If the Components list consists of
too many components, then viewing all the components and selecting the ones you need for report generation
could require endless scrolling. To avoid this, you can click the
button next to the Components list. The
COMPONENTS pop up window will then appear using which you can view almost all the components in a single
interface and select the ones for which the report is to be generated.
5.
Pick an option from the Criterion list box using which you could generate a report based on the size
(oversize/undersize) of the VMs. By default, the Oversized VMs by CPU Usage option is selected from this list. If
the Undersized VMs by CPU Usage option is chosen from this list, then the report will be generated for all the
VMs that are undersized i.e., the VM performs most of the operations with lesser number of vCPUs.
6.
If you wish to view only the oversized/undersized VMs for the chosen server in the target environment, set the
Show Matching VMs Only flag to Yes. By default, this flag is set to No.
7.
In addition to the settings discussed above, this report comes with a set of default specifications. These settings
are hidden by default. If you do not want to disturb these default settings, then you can proceed to generate
the report by clicking the RUN REPORT BUTTON soon after you pick a Component. However, if you want to view
and then alter these settings (if required), click on the
318
button. The default settings will then appear in the
Virtualization Reports
MORE OPTIONS drop down window (see Figure 9.59). The steps below discuss each of these settings and how
they can be customized.
Figure 9.59: The default settings for generating the Virtual Machines – Right Sizing report
8.
Next, indicate the report Timeperiod.
9.
Then, specify the Timeline for which the report is to be generated. You can either provide a fixed time line such
as 1 hour, 2 days, etc., or select the Any option from the list to provide a From and To date/time for report
generation.
For every user registered with the eG Enterprise system, the administrator can indicate the
maximum timeline for which that user can generate a report. Once the maximum timeline is
set for a user, then, whenever that user logs into eG Reporter and attempts to generate a
report, the Timeline list box in the report page will display options according to the maximum
timeline setting of that user. For instance, if a user can generate a report for a maximum
period of 3 days only, then 3 days will be the highest option displayed in the Timeline list i.e., 3 days will be the last option in the fixed Timeline list. Similarly, if the user chooses the
Any option from the Timeline list and proceeds to provide a start date and end date for
report generation using the From and To specifications, eG Enterprise will first check if the
user's Timeline specification conforms to his/her maximum timeline setting. If not, report
generation will fail. For instance, for a user who is allowed to generate reports spanning over
a maximum period of 3 days only, the difference between the From and To dates should
never be over 3 days. If it is, then, upon clicking the Run Report button a message box will
appear, prompting the user to change the From and To specification.
10.
eG Enterprise allows users to generate desired reports for a specific time period. In large environments, while
generating reports for long time periods, say a few weeks to months, report generation was found to slow
down, owing to the large volume of data being processed. If users needed to generate many such reports
quickly, the slowdown compelled them to generate these reports one after another, thus affecting the speed of
their operations, and consequently, their productivity. eG Enterprise now includes a background processing
feature that will enable users to process multiple reports, spanning long time periods in the background, while
allowing them the bandwidth to generate short-term reports in the foreground. This way, users can generate
multiple reports with little-to-no loss of time. To schedule background processing of a report, select the
Background Save - PDF option from the Report Generation list. In this case, a Report Name text box will appear,
where you would have to provide the name with which the report is to be saved in the background. To process
reports in the foreground, select the Foreground Generation - HTML option from this list.
319
Virtualization Reports
11.
The Report Generation list will appear only if the EnableBackgroundReport flag in
the [BACKGROUND_PROCESS] section of the eg_report.ini file (in the
{EG_INSTALL_DIR}\manager\config directory) is set to Yes.
The default selection in the Report Generation list will change according to the
Timeline specified for the report. If the Timeline set is greater than or equal to the
number of days specified against the MinDurationForReport parameter in the
[BACKGROUND_PROCESS] section of the eg_report.ini file, then the default selection
in the Report Generation list will be Background. On the other hand, if the Timeline
set for the report is lesser than the value of the MinDurationForReport parameter,
then the default selection in the Report Generation list will be Foreground. This is
because, the MinDurationForReport setting governs when reports are to be
processed in the background. By default, this parameter is set to 2 weeks - this
indicates that by default, reports with a timeline of 2 weeks and above will be
processed in the background.
Finally, click the Run Report button.
Figure 9.60: The Virtual Machines - Right Sizing Report
12.
The Virtual Machines - Right Sizing report (see Figure 9.60) then appears. For each VM hosted for the chosen
component, this report lists the percentage of vCPU that is utilized, the number of vCPUs and an indication of
whether the VM is oversized/undersized. If a particular VM is oversized, then the value Yes encoded with Red
color is specified in the Is VM Oversized column against that VM. The value No encoded with Green color in this
column specifies that the VM is adequately sized. Likewise, if the VM is oversized, then a message will appear in
the Remarks column suggesting you to reduce the exact number of vCPUs so that the VM can be optimally
sized. The same procedure is followed to indicate the VMs that are undersized. In this case, the Is VM
Undersized column is used to indicate the VMs that are undersized. Based on the Number of vCPUs and the
vCPU Usage (see Figure 9.60) of the individual VM, you can conclude whether the VM is adequately sized or is
currently oversized/undersized. Let us take the example of the VM CBR-ESX-VPX from Figure 9.60 which is
currently indicated as oversized in this report. The Maximum vCPU Usage of this VM is just 0.42% and the
320
Virtualization Reports
number of vCPUs allocated to this VM is 2. This indicates that the VM is utilized sparsely and the vCPU
resources allocated for this VM is more than enough and is not completely utilized. Therefore we can consider
reducing the number of vCPUs for this VM so that the VM can be optimally sized and the vCPU resource be
effectively utilized by the VMs that require the most. The eG Enterprise system, using its internal calculation,
intelligently arrives on the exact number of vCPUs that need to be reduced for optimally sizing the VM. This
exact number will be displayed in the Remarks column.
6. By default, the Host column of this report will be sorted in ascending order which is indicated by an Up arrow.
You can sort this report based on any column by just clicking on the column name – say for example, if you
wish to sort the report based on the Number of vCPUs column, then simply clicking on the column will sort the
report in descending order. Likewise you can sort the report based on any column.
13.
If the Criterion chosen is Oversized VMs by CPU usage and the Show Matching VMs Only flag is set to Yes, then
this report will list only the VMs that are currently oversized (see Figure 9.61).
Figure 9.61: The Virtual Machines Right Sizing Report showing the VMs that are currently oversized
14.
For generating a report on the VMs that are undersized, pick the Undersized VMs by CPU Usage option from the
Criterion drop down list. Figure 9.62 shows a generated report for the VMs that are under utilized.
Figure 9.62: The Vitual Machines - Right Sizing Report showing the VMs that are currently undersized
15.
If the Average vCPU utilization of a VM is considerably high and a fewer number of vCPUs are allocated for that
VM, then we can conclude that the VM is currently undersized. The Remarks column of that VM will suggest you
to increase the number of vCPUs allocated to the VM.
321
Virtualization Reports
9.12 The Virtualization Manager Report
The Virtualization Manager report tracks the performance history of vCenter installations in the target environment,
so that administrators are able to perform the following effectively:
Determine how healthy the vCenter server as a whole has been over a broad period of time;
Take a closer look at the overall performance of the critical components of vCenter - i.e., clusters and
individual physical servers managed by vCenter - over time;
Detect peculiar problem patterns, and analyze the root-cause of recurring performance issues.
Using the pointers provided by the report, administrators can answer the following questions quickly and precisely:
Has the vCenter server been sized adequately, or did the server experience frequent resource
inadequacies?
How often during the designated period could a connection to vCenter not be established? What were the
common reasons for this failure?
On an average, how many physical servers were managed by a vCenter installation over time? Was any
vCenter instance overloaded?
Were any physical servers not responding to vCenter for a long period of time?
Were any physical servers disconnected from vCenter during the given period?
Were sufficient CPU and memory resources allocated to the physical server clusters configured on vCenter?
Did the clusters experience any resource shortage at any point of time during the given period?
Did the clusters use the allocated resources optimally, or were the clusters resource-intensive? To which
vCenter/XenCenter server were resource-intensive clusters affiliated?
What about the physical servers managed by vCenter? Were these servers sized properly?
Did the physical servers consume the physical resources available to them excessively over time? Which
vCenter instance was managing the resource-hungry physical servers?
Did the network traffic to and from the physical servers increase/decrease with time?
How many powered-on guests were on the physical servers during the stated period? Did this count
change too frequently?
During what times did vCenter Vmotion guests to a physical server, and when did it remove guests from a
server? How did this movement impact server performance?
While this report is typically generated for pre-configured metrics, users can modify the configuration (if need be) by
adding more metrics, removing one/more of the existing metrics, or by applying additional functions to the metrics.
To generate the Virtualization Manager report, do the following:
1.
Select the Virtualization Manager option from the vCenter Reports node of the REPORTS BY FUNCTION tree in
the eG Reporter interface.
322
Virtualization Reports
Figure 9.63: Selecting the criteria for the Virtualization Manager report
2.
When Figure 9.63 appears, first, indicate the type of report to be generated by selecting an option from the
Report Type field. To generate a graphical report, select the Graph option. To generate a report that displays
desired metrics in a tabular format, select the Data option.
3.
Next, indicate which vCenter component the report is meant for - currently, reports can be generated for
VMware vCenter only. Therefore, this option is chosen by default from the Report for list.
4.
If the vCenter(s) for which the report is to be generated is part of a zone, then select the Zone option from the
Analyze by list, and then pick the Zone to which the vCenter server has been added. By default, the Zone list
will include only the parent zones that contain vCenters. If you want to generate this report for vCenters that
are included in sub-zones, then set the Include subzone flag to Yes. On the other hand, to generate this report
for one/more independent VCenters, just select Component from the Analyze by list.
5.
The Components list will then be populated with the vCenters that match the Analyze by criteria specified
earlier. From this list, select the vCenter server(s) for which the report is to be generated. If the Components
list consists of too many components, then viewing all the components and selecting the ones you need for
report generation could require endless scrolling. To avoid this, you can click the
button next to the
Components list. The COMPONENTS pop up window will then appear using which you can view almost all the
components in a single interface and select the ones for which the report is to be generated.
6.
Using this report, you can analyze the performance of any of the following:
The chosen vCenter server;
The clusters configured on the chosen vCenter
The physical servers managed by the selected vCenter server.
Accordingly, you can select the Virtual Center, Virtual Center Cluster, or Physical Servers option from the Show
Stats for list.
7.
The Measures list will be available only for a Graph report and not the Data report. Based on the option chosen
from the Show Stats for list, the elements of the Measures list will change. For instance:
If the option selected from the Show Stats for list is Virtual Center, then the Measures list will be populated
with a default set of test/measure pairs that reveal the resource usage by the chosen vCenters,
availability of the vCenters over the network, and the health of the interactions between the vCenter and
the physical servers it manages;
If the option selected from the Show Stats for list is Virtual Center Cluster, then the Measures list will be
populated with a default set of test/measure pairs that reveal the resource allocations and resource usage
by the clusters configured on the chosen vCenters;
If the option selected from the Show Stats for list is Physical Servers, then the Measures list will be
populated with a default set of test/measure pairs that reveal the health of the physical servers managed
by the chosen vCenters;
323
Virtualization Reports
All the above default settings can be overridden by the user using the eg_report.ini file (in the
<eg_install_dir>\manager\config directory), where he/she can add more metrics for use in the report, remove a
few of the existing metrics, or simply apply additional functions (Avg, Max, etc.) on the metrics, so that users
can more effectively analyze performance over time;
8.
Pick any test/measure combination from the Measures list to generate a report.
9.
Then, specify the Timeline for the graph. You can either provide a fixed time line such as 1 hour, 2 days, etc.,
or select the Any option from the list to provide a From and To date/time for report generation.
For every user registered with the eG Enterprise system, the administrator can indicate the
maximum timeline for which that user can generate a report. Once the maximum timeline is
set for a user, then, whenever that user logs into eG Reporter and attempts to generate a
report, the Timeline list box in the report page will display options according to the maximum
timeline setting of that user. For instance, if a user can generate a report for a maximum
period of 3 days only, then 3 days will be the highest option displayed in the Timeline list i.e., 3 days will be the last option in the fixed Timeline list. Similarly, if the user chooses the
Any option from the Timeline list and proceeds to provide a start date and end date for
report generation using the From and To specifications, eG Enterprise will first check if the
user's Timeline specification conforms to his/her maximum timeline setting. If not, report
generation will fail. For instance, for a user who is allowed to generate reports spanning over
a maximum period of 3 days only, the difference between the From and To dates should
never be over 3 days. If it is, then, upon clicking the Run Report button a message box will
appear, prompting the user to change the From and To specification.
10.
In addition to the settings discussed above, this report comes with a set of default specifications. These settings
are hidden by default. If you do not want to disturb these default settings, then you can proceed to generate
the report by clicking the RUN REPORT BUTTON soon after you pick a Measure. However, if you want to view and
then alter these settings (if required), click on the
icon. The default settings will then appear in the MORE
OPTIONS drop down window (see Figure 9.64). The steps below discuss each of these settings and how they
can be customized.
Figure 9.64: The default settings for generating the Virtualization Manager report
324
Virtualization Reports
11.
The speed with which a report is generated depends primarily on the report Timeline. While a Timeline that
varies between a couple of days to a week enables the eG Enterprise system to quickly retrieve the required
data, timelines that span multiple weeks/months could slow-down the data retrieval and report generation
process to a considerable extent, owing to the volume of data involved. In order to ensure quick and easy
access to reports, eG Enterprise provides you the option of enabling data retrieval from the Trend information in
the database, instead of the Detailed test information that is used by default for report generation. The Detailed
test information based comprises of multiple measurement records for a test - one or more each for every test
execution. Whereas, the Trend information includes only hourly, daily, and monthly summary computations for
a test performed on a continuous basis. For instance, during a period of 1 hour, a test that runs every 5
minutes inserts atleast 12 records into the Detailed test information base. On the other hand, the Trend
information base would consist of only 1 record for the same 1 hour period. Fewer the number of records,
query execution becomes much quicker, and data retrieval faster. To use the trend data for report generation,
you will have to select the Trend option from the Show Data field in Figure 9.64. By default, the Detailed option
is selected in Figure 9.64 indicating that the report data is retrieved from the detailed test information in the
database. If need be, you can also ensure that all reports always use the Detailed test tables alone by hiding
the Show Data field from the reporter interface. To achieve this, do the following:
Login to the eG administrative interface as 'admin'.
Select the Manager option from the Settings tile that appears when the
clicked.
From the GENERAL SETTINGS page that then appears, if you set the Compute average/sum of metrics
while trending flag to No, then the Show Data field will not appear in the reporter interface; this denies
users access to the Trend option, and thus ensures that reports are always generated using the Detailed
tables.
325
button against the Admin tab is
Virtualization Reports
12.
A Trend report will not include the data for the current day since trend data is only
computed at the end of the day.
If the Trend option is chosen, the time period of the report should be greater than 1
day.
The usage of Detailed test tables for generating reports, especially those that span
weeks, increases the stress on the eG database, thus resulting in undue delays in report
generation. In order to ensure that the database is not choked by such voluminous data
requests, you can configure eG Enterprise to automatically "force" the use of the Trend
option if the Timeline of a report exceeds a pre-configured duration. To specify this time
boundary, do the following:
Edit the eg_report.ini file in the <EG_INSTALL_DIR>\manager\config directory.
In the [MISC] section of the file, you will find a DetailedTime parameter.
Specify the duration (in days) beyond which Detailed reports cannot be generated,
against the DetailedTime parameter, and save the eg_report.ini file.
For instance, to make sure that Detailed reports are disallowed for a Timeline of
over 2 weeks, set the DetailedTime parameter to 14 and save the file.
Say, subsequently, you attempt to generate a Detailed report for a Fixed Timeline
of 3 weeks (which is greater than the 14-day limit set in our example). The instant
you select the 3 weeks option from the Fixed list box, the Detailed option gets
automatically disabled, and the Trend option gets enabled. Similarly, if you specify
an Any Timeline that runs over 14 days, then, upon clicking the RUN REPORT
BUTTON to generate the report, a message box appears (see Figure 5.7) informing
you that only the Trend option is permitted.
To proceed with the Trend report generation, click the OK button in the message
box. To terminate Trend report generation, click the CANCEL button.
If the timeline specified for the report needs to exclude the data collected during the Weekends, then set
Exclude weekends to Yes. If not, select No.
326
Virtualization Reports
By default, the weekend constitutes Saturday and Sunday. To override this default setting,
do the following:
Edit the eg_report.ini file in the <EG_INSTALL_DIR>\manager\config directory.
In the [VIRTUAL_CENTER] section of the file, the EXCLUDE_WEEKEND parameter is
set to Saturday,Sunday by default. You can modify this by setting the
EXCLUDE_WEEKEND parameter to a comma-separated list of other days of the week
- say Friday,Saturday.
Save the file after making the required changes.
13.
Next, indicate the report Time period.
14.
eG Enterprise allows users to generate desired reports for a specific time period. In large environments, while
generating reports for long time periods, say a few weeks to months, report generation was found to slow
down, owing to the large volume of data being processed. If users needed to generate many such reports
quickly, the slowdown compelled them to generate these reports one after another, thus affecting the speed of
their operations, and consequently, their productivity. eG Enterprise now includes a background processing
feature that will enable users to process multiple reports, spanning long time periods in the background, while
allowing them the bandwidth to generate short-term reports in the foreground. This way, users can generate
multiple reports with little-to-no loss of time. To schedule background processing of a report, select the
Background Save - PDF option from the Report Generation list. In this case, a Report Name text box will appear,
where you would have to provide the name with which the report is to be saved in the background. To process
reports in the foreground, select the Foreground Generation - HTML option from this list.
15.
The Report Generation list will appear only if the EnableBackgroundReport flag in
the [BACKGROUND_PROCESS] section of the eg_report.ini file (in the
{EG_INSTALL_DIR}\manager\config directory) is set to Yes.
The default selection in the Report Generation list will change according to the
Timeline specified for the report. If the Timeline set is greater than or equal to the
number of days specified against the MinDurationForReport parameter in the
[BACKGROUND_PROCESS] section of the eg_report.ini file, then the default selection
in the Report Generation list will be Background. On the other hand, if the Timeline
set for the report is lesser than the value of the MinDurationForReport parameter,
then the default selection in the Report Generation list will be Foreground. This is
because, the MinDurationForReport setting governs when reports are to be
processed in the background. By default, this parameter is set to 2 weeks - this
indicates that by default, reports with a timeline of 2 weeks and above will be
processed in the background.
Finally, click the Run Report button.
327
Virtualization Reports
Figure 9.65: The graphical Virtualization Manager report
16.
If the Report Type is Graph and the option chosen from the Report Generation list is Foreground Generation HTML, then, clicking on the Run Report button will invoke Figure 9.65 will appear comprising of the following:
A distribution pie chart that reveals the number of vCenters in different distribution ranges (see Figure
9.65). The distribution ranges are obtained by applying the first of the configured functions on the chosen
Measure. For instance, assume that CPU Utilization is the chosen Measure. Say that you have configured
to display the Avg and Max of this measure in a Data report. Typically, both these configured values will
appear only in the Data report. In the case of a Graph report however, the first of the two functions - i.e.,
Avg of CPU Utilization - alone is calculated for every vCenter chosen from the Components list. The
resulting pie chart enables administrators to deduce, at a glance, the number of components where the
chosen performance metric has fared well and/or badly. Clicking on a particular slice in the pie chart lists
the vCenter servers that fall within the value range represented by that slice (see Figure 9.66). Against
every vCenter name, the actual values for each of the configured functions (both Avg and Max, in our
example) will be displayed. A zone/component-type-level Summary of the chosen Measure will also be
available.
328
Virtualization Reports
Figure 9.66: A list of vCenters and the CPU Utilization of each Virtual Center
By default, the chart type for distribution is a pie chart. However, you can have a bar
graph depict the same data instead of a pie chart, by following the steps given below:
Edit the eg_report.ini file in the <EG_INSTALL_DIR>\manager\config directory.
Change the value of the chartTypeForDist parameter in the [VIRTUAL_CENTER]
section of this file from the default Pie, to Bar.
Save the eg_report.ini file.
By default, the number of value ranges that need to be configured for the
distribution chart is 10. To override this default setting, do the following:
Edit the eg_report.ini file in the <EG_INSTALL_DIR>\manager\config directory.
Specify a number of your choice against the nofRangeForDist parameter in the
[VIRTUAL_CENTER] section of this file. By default, this parameter will hold the value
10.
Save the eg_report.ini file.
Adjacent to the pie chart, you will find a bar chart that indicates the vCenters that have topped/failed in a
selected performance realm (i.e., the Measure) during the specified Timeline. For example, for the CPU
Utilization measure, this bar chart reveals the vCenters that are consuming too much of CPU resources.
Like the pie chart, the values for the bar chart are also calculated by applying the first of the configured
functions on the chosen Measure.
329
Virtualization Reports
You can configure the colors to be used in the distribution chart and the Top <N> Components bar chart
in the zone report, by editing the eg_report.ini file in the <EG_INSTALL_DIR>\manager\config directory.
The [VIRTUAL_CENTER] section of the file defines the 20 default colors of the distribution and bar charts:
[VIRTUAL _GUEST]
ChartColor=#8399b0,#ffd95a,#a4ac91,#98d980,#d5b996,#f48848,#8b8cc2,
#eb4052,#c4b3d0,#b18651,#ebb7ce,#028768,#f5c372,#887c65,#e4c536,
#b5582c,#f94989,#770d72,#97a067,#89aeb7
distColor=#115fa6,#f25454,#60bd68,#b276b2,#81bef7,#a61120,#ffd13e,
#770d72,#887c65,#a4ac91
You override the default color settings of the distribution chart by modifying the color-codes specifying
against distColor. For changing the colors used by the Top <N> Components chart, alter the codes listed
against the ChartColor parameter.
The number of components to be displayed in the Top <N> Components bar chart
is configurable. To specify the number, do the following:
Edit the eg_report.ini file in the <EG_INSTALL_DIR>\manager\config directory.
Specify a number of your choice against the NoOfServersforChart parameter in the
[VIRTUAL_CENTER] section of the file. By default, the value displayed here is 10,
indicating that, by default, the bar chart will be for the Top 10 Components. For
example, if you change this value to 5, then a bar chart displaying the Top 5
Components will appear.
Finally, save the eg_report.ini file.
17.
Unlike a Graph report, a Data report does not graphically represent the measure data. Instead, the configured
details are presented in a tabular format in the report.
18.
If the Report Type is Data, then the report can be configured to include data pertaining to vCenters, VM
Clusters, and/or Physical Servers. You can indicate your choice by selecting one/more check boxes against the
Include Stats for field.
330
Virtualization Reports
Figure 9.67: Specifying the criteria for a VCenters Data report
19.
Also, if the VM Clusters check box is selected, you would be allowed to select a report column name from the
Sort by list. This is the column by which the report data will be sorted.
20.
Once the Run Report button is clicked, the Data report will appear displaying multiple values for a chosen
measure depending upon the number and type of functions that have been configured for the measure.
Moreover, to enable you to understand and analyze the metrics better, eG Enterprise groups the metrics under
various heads, and dedicates a section each in the report for every metric group. The sections that are
displayed in the report vary according to the check boxes selected against Include Stats for.
For instance, if the vCenters option is chosen from Include Stats for, the resulting report will include two
sections - namely, the System Report section and the Application Report section. Typically, the System Report
section groups all host-level metrics pertaining to the chosen vCenter servers - in other words, it reveals the
health of the operating system on which each vCenter server functions. The Application Report section on the
other hand delves deep into the performance of the vCenter application as such, and reveals those metrics that
shed light on the health of key functions of the vCenter, such as, how well the vCenter manages physical
servers, how quickly can the vCenter be accessed, the availability of vCenter, etc. In addition to vCenter-wise
performance information, these sections also provide a Summary of the operating system and application health
(as the case may be) across the chosen Components.
331
Virtualization Reports
Figure 9.68: A Virtualization Manager Data Report if the ‘Include Stats for’ flag is set to ‘vCenters’
To instantly determine the overall health of the vCenter application over time, just take a look at the values
displayed in the Health % column of Figure 9.68. Clicking on this value for any vCenter will lead you to an
Executive Report that will enable you to decipher the reasons for the ill-health of a vCenter (see Figure 9.69).
332
Virtualization Reports
Figure 9.69: The Executive Report of a vCenter server
21.
Clicking on a particular vCenter link in Figure 9.68 reveals the clusters managed by that vCenter server and the
memory and CPU usage metrics related to each cluster (see Figure 9.70.
Figure 9.70: The Cluster Details report of the vCenter clicked on
333
Virtualization Reports
22.
If the VM Clusters option is chosen from the Include Stats for field, then, a Cluster Report section alone will
appear that lists the user-configured cluster-related metrics pertaining to each of the chosen vCenter servers.
Here again, a Summary of cluster performance across the chosen components will be available.
Figure 9.71: A vCenters Data report if the ‘Include Stats for’ flag is set to ‘VM Clusters’
23.
While clicking on a vCenter server in Figure 9.71 leads you to the Cluster Details report of that vCenter server,
clicking on a cluster link in Figure 9.71 leads you to the Cluster Details report of that cluster, which lists the
resource pools within the cluster, and the resource usage of each pool (see Figure 9.72).
Figure 9.72: The Cluster Details report of a cluster clicked on
24.
Similarly, if the Physical Servers option is chosen, then, a Physical Server Report alone will be available, which
displays the historical performance data related to the physical servers managed by each of the chosen vCenter
servers. This section again will provide a Summary of the resource usage by physical servers managed across
the chosen vCenter components.
334
Virtualization Reports
Figure 9.73: A vCenters Data report if the ‘Include Stats for’ flag is set to ‘Physical Servers’
25.
Click on a Physical Server link in Figure 9.73 to view a Server Report of that ESX server, using which the overall
health of the server can be determined (see Figure 9.74).
Figure 9.74: The Server Report of the ESX server clicked on in the vCenter Data Report
335
Virtualization Reports
The metrics displayed under every section of the Data report and the functions to be applied
on every measure are pre-configured. The same configuration applies to the Measures list in
the case of a Graph report. To override this default configuration, do the following:
Edit the eg_report.ini file in the <EG_INSTALL_DIR>\manager\config directory.
In the [VIRTUAL_CENTER] section of the file, you can add/remove metrics and
functions to every section in the data report. For instance, to add a measure to the
System Report section of the data report, insert a line in the following format:
Virtual_center:System:<InternalTestName>:<InternalMeasureName>#
<MeasureDisplayName>=<Comma-separated list of functions>
For instance, to add the Run queue length measure to the System Report section, do the
following:
Virtual_center:System:SystemTest:Run_queue_length#Run queue=Avg,Max
Similarly, to display an additional measure and related functions in the Application
Report section of the data report, your entry should be:
Virtual_center:Default:<InternalTestName>:<InternalMeasureName>#
<MeasureDisplayName>=<Comma-separated list of functions>
All the metrics configured for the ‘System’ group and ‘Application’ group will be listed in
the ‘Measures’ list of the Graph report, if the option chosen from the ‘Show Stats for’ list
is ‘VCenters’.
Likewise, you can add a metric to the Cluster Report section of the data report:
Virtual_center:Cluster:<InternalTestName>:<InternalMeasureName>#
<MeasureDisplayName>=<Comma-separated list of functions>
All the metrics configured for the ‘Cluster’ group will be listed in the ‘Measures’ list of the
Graph report, if the option chosen from the ‘Show Stats for’ list is ‘VCenter Clusters’.
However, to add a measure to the Physical Servers section of the data report, you will
have to move to the [VIRTUAL_HOST] section of the eg_report.ini file, and insert a line of
the following format:
<InternalTestName>:<InternalMeasureName>#<MeasureDisplayName>=<Commaseparated list of functions>
For instance, to add the Registered guests measure to the Physical Servers section,
your specification should be:
EsxGuestStatusTest:Registered_guests#Registered guests=Avg,Max
All the metrics configured under the [VIRTUAL_HOST] section will be listed in the
‘Measures’ list of the Graph report, if the option chosen from the ‘Show Stats for’ list is
‘Physical Servers’.
Finally, save the file.
336
Virtualization Reports
9.13 Cluster Details Report
In large virtualized environments characterized by tens of physical servers and hundreds of VMs, manageability is a
persistent issue. To ease the pain involved in managing such unwieldy environments, vCenter installations often
group physical servers into clusters, and allocate resources to the cluster, instead of to the individual servers. The
challenge here for the administrator is to continuously monitor the resource usage by clusters, and accordingly finetune allocations. The Cluster Details report that the eG Reporter offers provides this much-needed ‘cluster-focus’.
The report provides you with historical insights into how well a chosen cluster / all clusters on a vCenter are utilizing
the available resources. This way, resource-intensive clusters can be accurately identified. Also, by allowing
administrators the flexibility to include the performance information related to the physical servers in the cluster, and
the virtual machines executing on these physical servers, eG Enterprise enables administrators to zoom into the
physical server / virtual machine that could be the root-cause of any resource contention at the cluster-level.
In short, the Cluster Details report, reveals the following:
How many clusters have been configured on the vCenter? Which ones have been consistently consuming
excessive resources?
Which resource in particular is on demand at the cluster-level?
Have adequate resources been allocated to the clusters in the first place?
How many physical servers are included in the cluster? Which ones are they?
How healthy have the physical servers been over time? Are there frequent complaints of resource
shortages with the physical servers? Is this affecting cluster performance?
While this report is typically generated for pre-configured metrics, users can modify the configuration (if need be) by
adding more metrics, removing one/more of the existing metrics, or by applying additional functions to the metrics.
To generate the report, do the following:
1.
Select the Cluster Details option from the vCenter Reports node of the REPORTS BY FUNCTION tree.
Figure 9.75: Selecting the criteria for the Cluster Details report
2.
When Figure 9.75 appears, first, indicate the Report Type. For a graphical representation of cluster
performance, select the Graph option; for tabulated performance results, select the Data option. By default, the
Graph option is chosen.
3.
From the Report for list, VMware vCenter is chosen by default, indicating that the resulting report focuses on the
performance of the clusters managed by vCenter.
4.
Then, select a criterion for analysis from the Analyze by list box. Using this report, you can analyze the status of
clusters managed by independent vCenter servers or those that are part of a segment, service, or a zone. The
options provided by the Analyze by list box are discussed hereunder:
337
Virtualization Reports
o
Component: Select this option to choose the vCenter servers of interest to you from across all the
managed vCenter servers in the environment. All managed vCenter servers will then populate the
Component list. From this list, pick the vCenter servers for which the report is to be generated. If the
Component list consists of too many components, then viewing all the components and selecting the ones
you need for report generation could require endless scrolling. To avoid this, you can click the
button
next to the Component list. The COMPONENTS pop up window will then appear using which you can view
almost all the components in a single interface and Select the ones for which the report is to be generated.
o
Service: Select this option to generate this report for all vCenter servers that are involved in the delivery of
a business service. Then, select a Service.
o
Segment: Choose this option if the clusters to be evaluated are configured on vCenter servers that are part
of a segment. Then, pick a Segment for analysis.
o
Zone: Pick this option for a report on the status of clusters managed on all vCenter servers that are
included in a zone. Then, choose a Zone. Also, indicate whether the vCenter servers present within the
sub-zones of the chosen zone are also to be to be considered for report generation, by selecting an option
from the Include subzone list.
5.
Then, from the Measures list pick the measure for which the report is to be generated.
6.
Then, specify the Timeline for the graph. You can either provide a fixed time line such as 1 hour, 2 days, etc.,
or select the Any option from the list to provide a From and To date/time for report generation.
For every user registered with the eG Enterprise system, the administrator can indicate the
maximum timeline for which that user can generate a report. Once the maximum timeline is
set for a user, then, whenever that user logs into eG Reporter and attempts to generate a
report, the Timeline list box in the report page will display options according to the maximum
timeline setting of that user. For instance, if a user can generate a report for a maximum
period of 3 days only, then 3 days will be the highest option displayed in the Timeline list i.e., 3 days will be the last option in the fixed Timeline list. Similarly, if the user chooses the
Any option from the Timeline list and proceeds to provide a start date and end date for
report generation using the From and To specifications, eG Enterprise will first check if the
user's Timeline specification conforms to his/her maximum timeline setting. If not, report
generation will fail. For instance, for a user who is allowed to generate reports spanning over
a maximum period of 3 days only, the difference between the From and To dates
should never be over 3 days. If it is, then, upon clicking the Run Report button a
message box will appear, prompting the user to change the From and To
specification.
7.
In addition to the settings discussed above, this report comes with a set of default specifications. These settings
are hidden by default. If you do not want to disturb these default settings, then you can proceed to generate
the report by clicking the Run Report button soon after you pick a Measure. However, if you want to view and
then alter these settings (if required), click on the
button. The default settings will then appear in the MORE
OPTIONS drop down window (see Figure 9.76). The steps below discuss each of these settings and how they
can be customized.
338
Virtualization Reports
Figure 9.76: The default settings for generating a Cluster Details report
8.
The speed with which a report is generated depends primarily on the report Timeline. While a Timeline that
varies between a couple of days to a week enables the eG Enterprise system to quickly retrieve the required
data, timelines that span multiple weeks/months could slow-down the data retrieval and report generation
process to a considerable extent, owing to the volume of data involved. In order to ensure quick and easy
access to reports, eG Enterprise provides you the option of enabling data retrieval from the Trend information in
the database, instead of the Detailed test information that is used by default for report generation. The Detailed
test information based comprises of multiple measurement records for a test - one or more each for every test
execution. Whereas, the Trend information includes only hourly, daily, and monthly summary computations for
a test performed on a continuous basis. For instance, during a period of 1 hour, a test that runs every 5
minutes inserts atleast 12 records into the Detailed test information base. On the other hand, the Trend
information base would consist of only 1 record for the same 1 hour period. Fewer the number of records,
query execution becomes much quicker, and data retrieval faster. To use the trend data for report generation,
you will have to select the Trend option from the Show Data field in Figure 9.76. By default, the Detailed option
is selected in Figure 9.76 indicating that the report data is retrieved from the detailed test information in the
database. If need be, you can also ensure that all reports always use the Detailed test tables alone by hiding
the Show Data field from the reporter interface. To achieve this, do the following:
Login to the eG administrative interface as 'admin'.
Select the Manager option from the Settings tile that appears when the
clicked.
From the GENERAL SETTINGS page that then appears, if you set the Compute average/sum of metrics
while trending flag to No, then the Show Data field will not appear in the reporter interface; this denies
users access to the Trend option, and thus ensures that reports are always generated using the Detailed
tables.
339
button against the Admin tab is
Virtualization Reports
9.
A Trend report will not include the data for the current day since trend data is only
computed at the end of the day.
If the Trend option is chosen, the time period of the report should be greater than
1 day.
The usage of Detailed test tables for generating reports, especially those that span
weeks, increases the stress on the eG database, thus resulting in undue delays in
report generation. In order to ensure that the database is not choked by such
voluminous data requests, you can configure eG Enterprise to automatically "force"
the use of the Trend option if the Timeline of a report exceeds a pre-configured
duration. To specify this time boundary, do the following:
Edit the eg_report.ini file in the <EG_INSTALL_DIR>\manager\config directory.
In the [MISC] section of the file, you will find a DetailedTime parameter.
Specify the duration (in days) beyond which Detailed reports cannot be generated,
against the DetailedTime parameter, and save the eg_report.ini file.
For instance, to make sure that Detailed reports are disallowed for a Timeline of
over 2 weeks, set the DetailedTime parameter to 14 and save the file.
Say, subsequently, you attempt to generate a Detailed report for a Fixed Timeline
of 3 weeks (which is greater than the 14-day limit set in our example). The instant
you select the 3 weeks option from the Fixed list box, the Detailed option gets
automatically disabled, and the Trend option gets enabled. Similarly, if you specify
an Any Timeline that runs over 14 days, then, upon clicking the RUN REPORT
BUTTON to generate the report, a message box appears (see Figure 5.7) informing
you that only the Trend option is permitted.
To proceed with the Trend report generation, click the OK button in the message
box. To terminate Trend report generation, click the CANCEL button.
If the timeline specified for the report needs to exclude the data collected during the Weekends, then set
Exclude weekends to Yes. If not, select No.
By default, the weekend constitutes Saturday and Sunday. To override this default setting,
do the following:
Edit the eg_report.ini file in the <EG_INSTALL_DIR>\manager\config directory.
In the [VIRTUAL_CLUSTER] section of the file, the EXCLUDE_WEEKEND parameter is
set to Saturday,Sunday by default. You can modify this by setting the
EXCLUDE_WEEKEND parameter to a comma-separated list of other days of the week
- say Friday,Saturday.
Save the file after making the required changes.
340
Virtualization Reports
10.
Next, indicate the report Timeperiod.
11.
In large environments, reports generated using months of data can take a long time to complete.
Administrators now have the option of generating reports on-line or in the background. When a report is
scheduled for background generation, administrators can proceed with their other monitoring, diagnosis, and
reporting tasks, while the eG manager is processing the report. This saves the administrator valuable time. To
schedule background processing of a report, select the Background Save - PDF option from the Report
Generation list. In this case, a Report Name text box will appear, where you would have to provide the name
with which the report is to be saved in the background. To process reports in the foreground, select the
Foreground Generation - HTML option from this list.
12.
The Report Generation list will appear only if the EnableBackgroundReport flag in
the [BACKGROUND_PROCESS] section of the eg_report.ini file (in the
{EG_INSTALL_DIR}\manager\config directory) is set to Yes.
The default selection in the Report Generation list will change according to the
Timeline specified for the report. If the Timeline set is greater than or equal to the
number of days specified against the MinDurationForReport parameter in the
[BACKGROUND_PROCESS] section of the eg_report.ini file, then the default selection
in the Report Generation list will be Background. On the other hand, if the Timeline
set for the report is lesser than the value of the MinDurationForReport parameter,
then the default selection in the Report Generation list will be Foreground. This is
because, the MinDurationForReport setting governs when reports are to be
processed in the background. By default, this parameter is set to 2 weeks - this
indicates that by default, reports with a timeline of 2 weeks and above will be
processed in the background.
Finally, click the Run Report button.
341
Virtualization Reports
Figure 9.77: A graphical Cluster Details Report
13.
If the Report Type is Graph and the option chosen from the Report Generation list is Foreground Generation HTML, then, clicking on the Run Report button will invoke Figure 9.77, which will reveal the following:
A distribution pie chart that reveals the number of clusters in different distribution ranges (see Figure
9.77). The distribution ranges are obtained by applying the first of the configured functions on the chosen
Measure. For instance, assume that Physical CPU available to cluster is the chosen Measure. Say that you
have configured to display the Avg and Max of this measure in a Data report. Typically, both these
configured values will appear only in the Data report. In the case of a Graph report however, the first of
the two functions - i.e., Avg of Physical CPU available to cluster - alone is calculated for every vC cluster
managed by each vCenter chosen from the Components list. The resulting pie chart enables
administrators to deduce, at a glance, whether the clusters managed by chosen vCenter servers are
adequately sized or not. Clicking on a particular slice in the pie chart lists the clusters that fall within the
value range represented by that slice (see Figure 9.78). Against every cluster, the actual values for each
of the configured functions (both Avg and Max, in our example) will be displayed. A zone/componenttype-level Summary of the chosen Measure will also be available.
Figure 9.78: A list of vCenters and the number of ESX servers each one manages
342
Virtualization Reports
By default, the chart type for distribution is a pie chart. However, you can have a bar
graph depict the same data instead of a pie chart, by following the steps given below:
Edit the eg_report.ini file in the <EG_INSTALL_DIR>\manager\config directory.
Change the value of the chartTypeForDist parameter in the [VIRTUAL_CENTER]
section of this file from the default Pie, to Bar.
Save the eg_report.ini file.
By default, the number of value ranges that need to be configured for the distribution
chart is 10. To override this default setting, do the following:
Edit the eg_report.ini file in the <EG_INSTALL_DIR>\manager\config directory.
Specify a number of your choice against the nofRangeForDist parameter in the
[VIRTUAL_CENTER] section of this file. By default, this parameter will hold the value
10.
Save the eg_report.ini file.
Adjacent to the pie chart, you will find a bar chart that indicates the clusters that have topped/failed in a
selected performance realm (i.e., the Measure) during the specified timeline. For example, for the Physical
CPU available to cluster measure, this bar chart will help you quickly isolate those clusters that are and are
not adequately sized in terms of CPU resources. Like the pie chart, the values for the bar chart are also
calculated by applying the first of the configured functions on the chosen Measure.
You can configure the colors to be used in the distribution chart and the Top <N> Components
bar chart in the zone report, by editing the eg_report.ini file in the
<EG_INSTALL_DIR>\manager\config directory. The [VIRTUAL_CENTER] section of the file defines the
20 default colors of the distribution and bar charts:
[VIRTUAL_GUEST]
ChartColor=#8399b0,#ffd95a,#a4ac91,#98d980,#d5b996,#f48848,#8b8cc2,
#eb4052,#c4b3d0,#b18651,#ebb7ce,#028768,#f5c372,#887c65,#e4c536,
#b5582c,#f94989,#770d72,#97a067,#89aeb7
distColor=#115fa6,#f25454,#60bd68,#b276b2,#81bef7,#a61120,#ffd13e,
#770d72,#887c65,#a4ac91
You override the default color settings of the distribution chart by modifying the color-codes
specifying against distColor. For changing the colors used by the Top <N> Components chart,
alter the codes listed against the ChartColor parameter.
343
Virtualization Reports
14.
The number of components to be displayed in the Top <N> Components bar chart
is configurable. To specify the number, do the following:
Edit the eg_report.ini file in the <EG_INSTALL_DIR>\manager\config directory.
Specify a number of your choice against the NoOfServersforChart parameter in the
[VIRTUAL_CENTER] section of the file. By default, the value displayed here is 10,
indicating that, by default, the bar chart will be for the Top 10 Components. For
example, if you change this value to 5, then a bar chart displaying the Top 5
Components will appear.
Finally, save the eg_report.ini file.
If Data is chosen as the Report Type, then, an Include Stats for section will additionally appear, from which you
can pick what you want to view in your Data report. To perform a quick comparison of the resource availability
and usage across clusters managed by the chosen vCenter servers, click on the VMClusters check box.
Assuming that Foreground Generation - HTML is still the option chosen from the Report Generation list, clicking
on the Run Report button will invoke Figure 9.79.
Figure 9.79: The Data report comparing the resource usage across clusters
15.
For every cluster managed by each chosen vCenter server, the report will display a set of pre-configured
resource availability and resource usage metrics, with the help of which you can quickly isolate resourceintensive clusters. Clicking on a cluster, say the most CPU-intensive cluster, here will lead you to Figure 9.80
that will allow you to zoom into the performance of the resource pools in that cluster, so that you can analyze
whether the excessive resource usage by one or more resource pools contributed to the resource contention at
the cluster-level.
344
Virtualization Reports
Figure 9.80: The Resource Pools report that appears when a cluster is clicked on
16.
On the other hand, if you choose the Physical Servers option from the Include Stats for section, then, clicking
on the Run Report button will invoke Figure 9.81.
Figure 9.81: The Physical Servers report that appears when the 'Physical Servers' option is chosen from 'Include
Stats for'
17.
Using the report in Figure 9.81, you can precisely point your finger at that physical server in a cluster that is
responsible for draining the physical resources available to the cluster. Clicking on a physical server here will
lead you to Figure 9.82.
345
Virtualization Reports
Figure 9.82: The server report that appears when the Physical Server in a Physical Servers report is clicked
18.
On the other hand, if the Background Save - PDF option is chosen from the Report Generation list, then clicking
on the Run Report button will not generate the report and display it in this page for your benefit. Instead, a
message indicating that the report is being processed in the background will appear. This will be accompanied
by a link that will lead you to the page that lists all the reports that are being processed in the background, and
their current status. If background report generation fails for a report, you can regenerate that report using this
page, or can even delete that report if need be. On the other hand, if background processing successfully
completes for your report, then, you can view a PDF of the report by clicking on the
icon in that page.
9.14 Cluster - Resource Pools Report
As resource-intensive VM resource pools configured on one/more vSphere/ESX servers in a cluster can drain the
physical resources of the corresponding virtual hosts, and consequently affect the aggregated resource base of the
cluster, it is imperative that you monitor the current and historical performance of the cluster resource pools, so that
resource contentions can be captured early and resolved quickly. The Cluster - Resource Pools report enables you to
perform just that. Besides helping you identify resource-hungry resource pools in a cluster, this report also enables
you to isolate the VM in the pool that is responsible for the abnormal behavior of the pool (if any), and the physical
servers on which these VMs operate.
To generate this report, do the following:
1.
Select the Resource Pools option from the vCenter Reports node of the REPORTS BY FUNCTION tree.
2.
Figure 9.83 will then appear.
Figure 9.83: Providing the specifications of the Cluster - Resource Pools report
346
Virtualization Reports
3.
First, pick a Report Type. For a graphical representation of physical server performance, pick the Graph option.
To view the metrics related to the resource usage of the physical servers in a cluster in a tabulated form, pick
the Data option.
4.
If the Report Type is Graph, then the View by list will offer 2 options - Timeline and Distribution. While the
Timeline option will provide a time-of-day measure graph depicting resource pool performance, the Distribution
option will result in distribution pie charts and bar graphs being displayed. The default selection is however
Timeline.
5.
By default, the Report for list will display VMware vCenter as its selection.
6.
From the vCenter Server list, pick the vCenter server for which the report is to be generated.
7.
Upon selecting the vCenter Server, the Cluster list will get automatically populated with those clusters that are
being managed by the chosen vCenter Server. Pick a cluster for which this report is to be generated.
8.
Then, pick an option from the Report by list. By default, the Resource Pools option will be chosen here.
9.
Next, pick a measure for which a graph is to be generated, from the Measure list.
10.
Then, specify the Timeline for the graph. You can either provide a fixed time line such as 1 hour, 2 days, etc.,
or select the Any option from the list to provide a From and To date/time for report generation.
For every user registered with the eG Enterprise system, the administrator can indicate the
maximum timeline for which that user can generate a report. Once the maximum timeline is
set for a user, then, whenever that user logs into eG Reporter and attempts to generate a
report, the Timeline list box in the report page will display options according to the maximum
timeline setting of that user. For instance, if a user can generate a report for a maximum
period of 3 days only, then 3 days will be the highest option displayed in the Timeline list i.e., 3 days will be the last option in the fixed Timeline list. Similarly, if the user chooses the
Any option from the Timeline list and proceeds to provide a start date and end date for
report generation using the From and To specifications, eG Enterprise will first check if the
user's Timeline specification conforms to his/her maximum timeline setting. If not, report
generation will fail. For instance, for a user who is allowed to generate reports spanning over
a maximum period of 3 days only, the difference between the From and To dates should
never be over 3 days. If it is, then, upon clicking the Run Report button a message box will
appear, prompting the user to change the From and To specification.
11.
In addition to the settings discussed above, this report comes with a set of default specifications. These settings
are hidden by default. If you do not want to disturb these default settings, then you can proceed to generate
the report by clicking the Run Report button soon after you pick a Measure. However, if you want to view and
then alter these settings (if required), click on the
button. The default settings will then appear in the MORE
OPTIONS drop down window (see Figure 9.84). The steps below discuss each of these settings and how they
can be customized.
347
Virtualization Reports
Figure 9.84: The default settings for generating the Cluster – Resource Pools report
12.
The speed with which a report is generated depends primarily on the report Timeline. While a Timeline that
varies between a couple of days to a week enables the eG Enterprise system to quickly retrieve the required
data, timelines that span multiple weeks/months could slow-down the data retrieval and report generation
process to a considerable extent, owing to the volume of data involved. In order to ensure quick and easy
access to reports, eG Enterprise provides you the option of enabling data retrieval from the Trend information in
the database, instead of the Detailed test information that is used by default for report generation. The Detailed
test information based comprises of multiple measurement records for a test - one or more each for every test
execution. Whereas, the Trend information includes only hourly, daily, and monthly summary computations for
a test performed on a continuous basis. For instance, during a period of 1 hour, a test that runs every 5
minutes inserts atleast 12 records into the Detailed test information base. On the other hand, the Trend
information base would consist of only 1 record for the same 1 hour period. Fewer the number of records,
query execution becomes much quicker, and data retrieval faster. To use the trend data for report generation,
you will have to select the Trend option from the Show Data field in Figure 9.84. By default, the Detailed option
is selected in Figure 9.84 indicating that the report data is retrieved from the detailed test information in the
database. If need be, you can also ensure that all reports always use the Detailed test tables alone by hiding
the Show Data field from the reporter interface. To achieve this, do the following:
Login to the eG administrative interface as 'admin'.
Select the Manager option from the Settings tile that appears when the
clicked.
From the GENERAL SETTINGS page that then appears, if you set the Compute average/sum of metrics
while trending flag to No, then the Show Data field will not appear in the reporter interface; this denies
users access to the Trend option, and thus ensures that reports are always generated using the Detailed
tables.
348
button against the Admin tab is
Virtualization Reports
13.
A Trend report will not include the data for the current day since trend data is only
computed at the end of the day.
If the Trend option is chosen, the time period of the report should be greater than
1 day.
The usage of Detailed test tables for generating reports, especially those that span
weeks, increases the stress on the eG database, thus resulting in undue delays in
report generation. In order to ensure that the database is not choked by such
voluminous data requests, you can configure eG Enterprise to automatically "force"
the use of the Trend option if the Timeline of a report exceeds a pre-configured
duration. To specify this time boundary, do the following:
Edit the eg_report.ini file in the <EG_INSTALL_DIR>\manager\config directory.
In the [MISC] section of the file, you will find a DetailedTime parameter.
Specify the duration (in days) beyond which Detailed reports cannot be generated,
against the DetailedTime parameter, and save the eg_report.ini file.
For instance, to make sure that Detailed reports are disallowed for a Timeline of
over 2 weeks, set the DetailedTime parameter to 14 and save the file.
Say, subsequently, you attempt to generate a Detailed report for a Fixed Timeline
of 3 weeks (which is greater than the 14-day limit set in our example). The instant
you select the 3 weeks option from the Fixed list box, the Detailed option gets
automatically disabled, and the Trend option gets enabled. Similarly, if you specify
an Any Timeline that runs over 14 days, then, upon clicking the RUN REPORT
BUTTON to generate the report, a message box appears (see Figure 5.8) informing
you that only the Trend option is permitted.
To proceed with the Trend report generation, click the OK button in the message
box. To terminate Trend report generation, click the CANCEL button.
If the timeline specified for the report needs to exclude the data collected during the Weekends, then set
Exclude weekends to Yes. If not, select No.
349
Virtualization Reports
By default, the weekend constitutes Saturday and Sunday. To override this default setting,
do the following:
Edit the eg_report.ini file in the <EG_INSTALL_DIR>\manager\config directory.
In the [VIRTUAL_CLUSTER] section of the file, the EXCLUDE_WEEKEND parameter is
set to Saturday,Sunday by default. You can modify this by setting the
EXCLUDE_WEEKEND parameter to a comma-separated list of other days of the week
- say Friday,Saturday.
Save the file after making the required changes.
14.
Next, indicate the report Timeperiod.
15.
You can further filter the resultset of your report picking one of the following options from the Filter by list:
Top -N - Select this option and pick a number from the drop-down list adjacent to it to ensure that the
resulting graph only plots the values of the specified number of top players in the chosen performance
arena.
Range - Pick this option and provide a value range in the From and To text boxes that appear alongside.
Greaterthan - Pick this option and provide a value in the text box that appears alongside to view the details
of only those resource pools which have registered a value greater than the value specified in that box for
the chosen Measure.
Lessthan - Pick this option and provide a value in the text box that appears alongside to view the details of
only those resource pools which have registered a value lesser than the value specified in that box for the
chosen Measure.
16.
In large environments, reports generated using months of data can take a long time to complete.
Administrators now have the option of generating reports on-line or in the background. When a report is
scheduled for background generation, administrators can proceed with their other monitoring, diagnosis, and
reporting tasks, while the eG manager is processing the report. This saves the administrator valuable time. To
schedule background processing of a report, select the Background Save - PDF option from the Report
Generation list. In this case, a Report Name text box will appear, where you would have to provide the name
with which the report is to be saved in the background. To process reports in the foreground, select the
Foreground Generation - HTML option from this list.
350
Virtualization Reports
The Report Generation list will appear only if the EnableBackgroundReport flag in
the [BACKGROUND_PROCESS] section of the eg_report.ini file (in the
{EG_INSTALL_DIR}\manager\config directory) is set to Yes.
The default selection in the Report Generation list will change according to the
Timeline specified for the report. If the Timeline set is greater than or equal to the
number of days specified against the MinDurationForReport parameter in the
[BACKGROUND_PROCESS] section of the eg_report.ini file, then the default selection
in the Report Generation list will be Background. On the other hand, if the Timeline
set for the report is lesser than the value of the MinDurationForReport parameter,
then the default selection in the Report Generation list will be Foreground. This is
because, the MinDurationForReport setting governs when reports are to be
processed in the background. By default, this parameter is set to 2 weeks - this
indicates that by default, reports with a timeline of 2 weeks and above will be
processed in the background.
17.
Finally, click the Run Report button.
18.
If the Report Type is Graph, the View by selection is Timeline, the Report by option is Resource pools, and the
option chosen from the Report Generation list is Foreground Generation - HTML, then, clicking the RUN REPORT
BUTTON will invoke Figure 9.85.
351
Virtualization Reports
Figure 9.85: A Cluster - Resource Pools report if the 'View by' option chosen is 'Timeline' and 'Report by' option is
'Resource pools'
19.
Figure 9.85, as you can see, displays a time-of-day graph - this graph compares the behavior of the chosen
performance measure a crisis all the resource pools within the selected cluster during the specified timeline. For
instance, if CPU usage is the Measure chosen, then this graph will compare the CPU usage of the resource pools
in the cluster, thus visually enabling you to identify which resource pool is utilizing CPU excessively.
20.
If the Report Type is Graph, the View by selection is Timeline, the Report for option is Physical Servers, and the
option chosen from the Report Generation list is Foreground Generation - HTML, then, clicking the RUN REPORT
BUTTON will invoke Figure 9.86. The graph displayed in Figure 9.86 will enable you to quickly compare the
chosen performance metric across all the physical servers in the selected cluster so that, resource-intensive
servers in the cluster can be isolated.
352
Virtualization Reports
Figure 9.86: A Cluster - Resource pools report that appears when the 'View by' option is 'Timeline' and the 'Report by'
option is 'Physical servers'
21.
If the Report Type is Graph, the View by selection is Timeline, the Report for option is Virtual Machines, and the
option chosen from the Report Generation list is Foreground Generation - HTML, then, clicking the RUN REPORT
BUTTON will invoke Figure 9.87. The graph displayed in Figure 9.87 will enable you to quickly compare the
values of the chosen performance metric across all the virtual machines in the selected cluster so that,
resource-intensive VMs in the cluster can be isolated.
353
Virtualization Reports
Figure 9.87: The Cluster -Resource pools report if the 'View by' selection is 'Timeline' and the 'Report by' selection is
'Virtual machines'
22.
Now, if the Report Type is Graph, the View by selection is Distribution, the Report by option is Resource Pools,
and the option chosen from the Report Generation list is Foreground Generation - HTML, then, clicking the RUN
REPORT BUTTON will invoke Figure 9.88.
Figure 9.88: The Cluster - Resource Pools report where the 'View by' selection is 'Distribution' and the 'Report by'
option is 'Resource Pools'
23.
Figure 9.88 comprises of the following:
A distribution pie chart that depicts the number of resource pools that are in different distribution ranges.
The distribution ranges are obtained by applying the first of the configured functions on the chosen
Measure. For instance, assume that Direct VMs in pool is the chosen Measure. Say that you have
configured to display the Avg and Max of this measure in a Data report. Typically, both these configured
354
Virtualization Reports
values will appear only in the Data report. In the case of a Graph report however, the first of the two
functions - i.e., Avg of Direct VMs in pool - alone is calculated for every resource pool in the chosen
Cluster. The resulting pie chart enables administrators to deduce, at a glance, the number of resource
pools where the chosen performance metric has fared well and/or badly. Clicking on a particular slice in the
pie chart lists the resource pools that fall within the value range represented by that slice (see Figure 9.89).
Against every pool, the actual values for each of the configured functions (both Avg and Max, in our
example) will be displayed. A cluster-level Summary of the chosen Measure will also be available.
By default, the chart type for distribution is a pie chart. However, you can have a
bar graph depict the same data instead of a pie chart, by following the steps given
below:
Edit the eg_report.ini file in the <EG_INSTALL_DIR>\manager\config directory.
Change the value of the chartTypeForDist parameter in the [VIRTUAL_CENTER]
section of this file from the default Pie, to Bar.
Save the eg_report.ini file.
By default, the number of value ranges that need to be configured for the
distribution chart is 10. To override this default setting, do the following:
Edit the eg_report.ini file in the <EG_INSTALL_DIR>\manager\config directory.
Specify a number of your choice against the nofRangeForDist parameter in the
[VIRTUAL_CLUSTER] section of this file. By default, this parameter will hold the value
10.
Save the eg_report.ini file.
Figure 9.89: The physical servers that fall within the usage range clicked on
24.
Adjacent to the pie chart, you will find a bar chart that indicates the resource pools that have topped/failed in a
selected performance realm (i.e., the Measure) during the specified Timeline. For example, for the Direct VMs in
Pool measure, this bar chart reveals the resource pools in the cluster with the maximum direct VMs. Like the pie
chart, the values for the bar chart are also calculated by applying the first of the configured functions on the
chosen Measure.
355
Virtualization Reports
You can configure the colors to be used in the distribution chart and the Top <N> Components bar
chart in the zone report, by editing the eg_report.ini file in the <EG_INSTALL_DIR>\manager\config
directory. The [VIRTUAL_CLUSTER] section of the file defines the 20 default colors of the distribution and
bar charts:
[VIRTUAL_CLUSTER]
ChartColor=#8399b0,#ffd95a,#a4ac91,#98d980,#d5b996,#f48848,#8b8cc2,
#eb4052,#c4b3d0,#b18651,#ebb7ce,#028768,#f5c372,#887c65,#e4c536,
#b5582c,#f94989,#770d72,#97a067,#89aeb7
distColor=#115fa6,#f25454,#60bd68,#b276b2,#81bef7,#a61120,#ffd13e,
#770d72,#887c65,#a4ac91
You override the default color settings of the distribution chart by modifying the color-codes specifying
against distColor. For changing the colors used by the Top <N> Components chart, alter the codes
listed against the ChartColor parameter.
The number of components to be displayed in the Top <N> Components bar chart is
configurable. To specify the number, select Top-N from the Filter by list in Figure 9.84, and
pick an option from the adjacent drop-down list.
25.
On the other hand, if the Report Type is Graph, the View by selection is Distribution, the Report by option is
Physical Servers, and the option chosen from the Report Generation list is Foreground Generation - HTML, then,
clicking the Run Report button will invoke Figure 9.90.
356
Virtualization Reports
Figure 9.90: The Cluster - Resource pools report where the 'View by' selection is 'Distribution' and the 'Report by'
selection is 'Physical Servers'
26.
Figure 9.90 comprises of the following:
A distribution pie chart that depicts the number of physical servers that are in different distribution ranges.
The distribution ranges are obtained by applying the first of the configured functions on the chosen
Measure. For instance, assume that Registered guests is the chosen Measure. Say that you have
configured to display the Avg and Max of this measure in a Data report. Typically, both these configured
values will appear only in the Data report. In the case of a Graph report however, the first of the two
functions - i.e., Avg of Registered guests - alone is calculated for every physical server in the chosen
Cluster. The resulting pie chart enables administrators to deduce, at a glance, the number of physical
servers where the chosen performance metric has fared well and/or badly. Clicking on a particular slice in
the pie chart lists the physical servers that fall within the value range represented by that slice (see Figure
9.91). Against every server, the actual values for each of the configured functions (both Avg and Max, in
our example) will be displayed. A cluster-level Summary of the chosen Measure will also be available.
357
Virtualization Reports
By default, the chart type for distribution is a pie chart. However, you can have a bar
graph depict the same data instead of a pie chart, by following the steps given below:
Edit the eg_report.ini file in the <EG_INSTALL_DIR>\manager\config directory.
Change the value of the chartTypeForDist parameter in the [VIRTUAL_CENTER]
section of this file from the default Pie, to Bar.
Save the eg_report.ini file.
By default, the number of value ranges that need to be configured for the distribution
chart is 10. To override this default setting, do the following:
Edit the eg_report.ini file in the <EG_INSTALL_DIR>\manager\config directory.
Specify a number of your choice against the nofRangeForDist parameter in the
[VIRTUAL_CLUSTER] section of this file. By default, this parameter will hold the value
10.
Save the eg_report.ini file.
Figure 9.91: The physical servers that fall within the usage range clicked on
27.
Adjacent to the pie chart, you will find a bar chart that indicates the physical servers that have topped/failed in
a selected performance realm (i.e., the Measure) during the specified Timeline. For example, for the Registered
guests measure, this bar chart reveals the physical servers in the cluster with which the maximum number of
guests have registered. Like the pie chart, the values for the bar chart are also calculated by applying the first
of the configured functions on the chosen Measure.
358
Virtualization Reports
You can configure the colors to be used in the distribution chart and the Top <N> Components bar chart
in the zone report, by editing the eg_report.ini file in the <EG_INSTALL_DIR>\manager\config directory. The
[VIRTUAL_CLUSTER] section of the file defines the 20 default colors of the distribution and bar charts:
[VIRTUAL_CLUSTER]
ChartColor=#8399b0,#ffd95a,#a4ac91,#98d980,#d5b996,#f48848,#8b8cc2,
#eb4052,#c4b3d0,#b18651,#ebb7ce,#028768,#f5c372,#887c65,#e4c536,
#b5582c,#f94989,#770d72,#97a067,#89aeb7
distColor=#115fa6,#f25454,#60bd68,#b276b2,#81bef7,#a61120,#ffd13e,
#770d72,#887c65,#a4ac91
You override the default color settings of the distribution chart by modifying the color-codes specifying
against distColor. For changing the colors used by the Top <N> Components chart, alter the codes listed
against the ChartColor parameter.
The number of components to be displayed in the Top <N> Components bar chart is
configurable. To specify the number, select Top-N from the Filter by list in Figure 9.84, and
pick an option from the adjacent drop-down list.
28.
Likewise, if the Report Type is Graph, the View by selection is Distribution, and the Report for option is Virtual
Machines, then picking the Foreground Generation - HTML option from the Report Generation list and clicking
the Run Report button will invoke Figure 9.92.
359
Virtualization Reports
Figure 9.92: A Cluster - Resource pools report that appears when the 'View by' option is 'Distribution' and 'Report by'
option is 'Virtual Machines'
29.
Figure 9.92 reveals the following:
A distribution pie chart that depicts the number of virtual machines that are in different distribution ranges.
The distribution ranges are obtained by applying the first of the configured functions on the chosen
Measure. For instance, assume that Physical CPU utilization is the chosen Measure. Say that you have
configured to display the Avg and Max of this measure in a Data report. Typically, both these configured
values will appear only in the Data report. In the case of a Graph report however, the first of the two
functions - i.e., Avg of Physical CPU utilization - alone is calculated for every virtual machine configured
on each physical server in the chosen Cluster. The resulting pie chart enables administrators to deduce, at
a glance, the number of virtual machines where the chosen performance metric has fared well and/or
badly. Clicking on a particular slice in the pie chart lists the VMs that fall within the value range
represented by that slice (see Figure 9.93). Against every server, the actual values for each of the
configured functions (both Avg and Max, in our example) will be displayed. A cluster-level Summary of the
chosen Measure will also be available.
360
Virtualization Reports
By default, the chart type for distribution is a pie chart. However, you can have a
bar graph depict the same data instead of a pie chart, by following the steps given
below:
Edit the eg_report.ini file in the <EG_INSTALL_DIR>\manager\config directory.
Change the value of the chartTypeForDist parameter in the [VIRTUAL_CENTER]
section of this file from the default Pie, to Bar.
Save the eg_report.ini file.
By default, the number of value ranges that need to be configured for the
distribution chart is 10. To override this default setting, do the following:
Edit the eg_report.ini file in the <EG_INSTALL_DIR>\manager\config directory.
Specify a number of your choice against the nofRangeForDist parameter in the
[VIRTUAL_CLUSTER] section of this file. By default, this parameter will hold the value
10.
Save the eg_report.ini file.
Figure 9.93: The virtual machines that fall within the usage range clicked on
30.
Adjcacent to the pie chart, you will find a bar chart that indicates the VMs that have topped/failed in a selected
performance realm (i.e., the Measure) during the specified Timeline. For example, for the Physical CPU
utilization measure, this bar chart reveals the VMs in the cluster that are using CPU excessively. Like the pie
chart, the values for the bar chart are also calculated by applying the first of the configured functions on the
chosen Measure.
361
Virtualization Reports
You can configure the colors to be used in the distribution chart and the Top <N> Components bar chart
in the zone report, by editing the eg_report.ini file in the <EG_INSTALL_DIR>\manager\config directory. The
[VIRTUAL_CLUSTER] section of the file defines the 20 default colors of the distribution and bar charts:
[VIRTUAL_CLUSTER]
ChartColor=#8399b0,#ffd95a,#a4ac91,#98d980,#d5b996,#f48848,#8b8cc2,
#eb4052,#c4b3d0,#b18651,#ebb7ce,#028768,#f5c372,#887c65,#e4c536,
#b5582c,#f94989,#770d72,#97a067,#89aeb7
distColor=#115fa6,#f25454,#60bd68,#b276b2,#81bef7,#a61120,#ffd13e,
#770d72,#887c65,#a4ac91
You override the default color settings of the distribution chart by modifying the color-codes specifying
against distColor. For changing the colors used by the Top <N> Components chart, alter the codes listed
against the ChartColor parameter.
The number of components to be displayed in the Top <N> Components bar chart is
configurable. To specify the number, select Top-N from the Filter by list in Figure 9.84, and
pick an option from the adjacent drop-down list.
31.
If the Report Type is Data, then the View by list will no longer appear. Also, the Report by section will now allow
you to choose between the Physical Servers and the Virtual Machines options. Moreover, besides enabling you
to view the data pertaining to all/specific clusters managed by a chosen vCenter server, the Data report will also
enable you to view the data pertaining to all/specific Resource Pools.
32.
If the Report Type is Data and neither the Physical Servers nor the Virtual Machines check box is selected from
Report by, then, clicking the Run Report button will reveal Figure 9.94.
362
Virtualization Reports
Figure 9.94: The Cluster Details Data Report
33.
For a particular cluster, Figure 9.94 provides separate sections displaying the user-configured metrics related to
the CPU and memory usage of the chosen/all resource pools (depending upon the option chosen from the
Resource pool list) in that cluster. This way, you can analyze cluster performance over time, and identify the
resource-intensive pools in the cluster that are adversely impacting the overall cluster health.
34.
Besides metrics, users can also configure the functions that they want applied on the metrics, so that they
receive the true picture of the performance of the cluster. The number of values displayed per measure in the
report will depend upon the number of functions that the user has configured for the measure.
35.
If the Physical Servers check box alone is selected from Report by, then, Figure 9.95 will appear upon clicking
the Run Report button. As you can see, in addition to the default sections focusing on CPU and memory usage,
Figure 9.95 provides a Physical Server Report Details section that provides an overview of the performance of
all ESX servers that are part of the chosen cluster. Using this information, you can figure out whether any of the
ESX servers have contributed to any deterioration in the performance of the cluster.
363
Virtualization Reports
Figure 9.95: A Cluster Details Report providing Physical Server information additionally
36.
Clicking on a Physical Server link in this section will lead you to a Server Report that zooms into the
performance of the physical server that was clicked.
37.
This Physical Server Report section of Figure 9.95 will also provide you with a quick Summary of the
performance of the cluster across its physical servers.
38.
The Health % that corresponds to every physical server included in a cluster is a good indicator of how problemprone that physical server was during the given period. Clicking on this percentage leads you to an Executive
Report of that physical server, using which you can determine the type of problems that were encountered by
that server during the said period, which layers were frequently affected and on what days (see Figure 9.96).
39.
The Heath % for the Summary row on the other hand signifies the overall health of the cluster.
364
Virtualization Reports
Figure 9.96: An Executive Report of the physical server
40.
If the Virtual Machines check box alone is selected from Report by, then, Figure 9.97 will appear upon clicking
the RUN REPORT BUTTON. As you can see, in addition to the default sections focusing on CPU and memory
usage, Figure 9.97 provides a Virtual Machines section that indicates how resource-intensive each VM in the
cluster is. Using this information, you can figure out whether any of the VMs have contributed to any
deterioration in the performance of the cluster.
365
Virtualization Reports
Figure 9.97: A Cluster Details Report additionally providing virtual machine information
41.
Clicking on a VM in this section will lead you to the Virtual Machine Details report of that VM.
42.
If the All option had been chosen from the Cluster list in Figure 9.98, the resulting report will display CPU and
memory usage metrics related to every cluster configured on the chosen vCenter Server (see Figure 9.98). If
366
Virtualization Reports
both the Physical Servers and Virtual Machines check boxes are selected, then the report will also explore the
resource usage of the ESX servers and VMs in all the clusters managed by the chosen vCenter Server (see
Figure 9.98).
367
Virtualization Reports
Figure 9.98: The Cluster Details report revealing the CPU and memory usage of every cluster on a vCenter
368
Virtualization Reports
43.
To zoom into the performance of a particular cluster, just click on it. Figure 9.99 will then appear.
Figure 9.99: A report displaying the details of a particular cluster
44.
On the other hand, if the Background Save - PDF option is chosen from the Report Generation list, then clicking
on the RUN REPORT BUTTON will not generate the report and display it in this page for your benefit. Instead, a
message indicating that the report is being processed in the background will appear. This will be accompanied
by a link that will lead you to the page that lists all the reports that are being processed in the background, and
their current status. If background report generation fails for a report, you can regenerate that report using this
page, or can even delete that report if need be. On the other hand, if background processing successfully
completes for your report, then, you can view a PDF of the report by clicking on the
icon in that page.
9.15 Cluster - Physical Servers Report
While the Cluster - Details report enables you to identify resource-intensive clusters configured on a vCenter server,
using the Cluster - Physical Servers report you can figure out which VM on which physical server in the cluster is
responsible for the resource drain and why. In short, you can have the following questions answered with the help of
this report:
Which physical servers are part of a cluster, and how have they been using the resources available to the
cluster? Is any physical server using up excessive resources?
Are any VMs on the problem physical server consuming the allocated resources excessively?
To generate this report, do the following:
1.
Select the Physical Servers option from the vCenter Reports node of the REPORTS BY FUNCTION tree.
2.
Figure 9.100 will then appear.
369
Virtualization Reports
Figure 9.100: Providing the specifications of the Cluster - Physical Servers report
3.
First, pick a Report Type. For a graphical representation of physical server performance, pick the Graph option.
To view the metrics related to the resource usage of the physical servers in a cluster in a tabulated form, pick
the Data option.
4.
If the Report Type is Graph, then the View by list will offer 2 options - Measures and Distribution. While the
Measures option will provide time-of-day measure graphs depicting physical server performance, the
Distribution option will result in distribution pie charts and bar graphs being displayed.
5.
By default, the Report for list will display VMware vCenter as its selection.
6.
From the vCenter Server list, pick the vCenter server for which the report is to be generated.
7.
Upon selecting the vCenter Server, the Cluster list will get automatically populated with those clusters that are
being managed by the chosen vCenter Server. Pick a cluster for which this report is to be generated.
8.
All the Physical Servers grouped under the chosen cluster will then be displayed in the Physical Servers list.
From this list, choose the physical servers for which the report is to be generated. If this list consists of too
many physical servers, then viewing all the servers and selecting the ones you need for report generation could
require endless scrolling. To avoid this, you can click the
button next to the Physical Servers list. The
PHYSICAL SERVERS pop up window will then appear using which you can view almost all the components in a
single interface and select the ones for which the report is to be generated.
9.
Then, specify the Timeline for the graph. You can either provide a fixed time line such as 1 hour, 2 days, etc.,
or select the Any option from the list to provide a From and To date/time for report generation.
370
Virtualization Reports
For every user registered with the eG Enterprise system, the administrator can indicate the
maximum timeline for which that user can generate a report. Once the maximum timeline is
set for a user, then, whenever that user logs into eG Reporter and attempts to generate a
report, the Timeline list box in the report page will display options according to the maximum
timeline setting of that user. For instance, if a user can generate a report for a maximum
period of 3 days only, then 3 days will be the highest option displayed in the Timeline list i.e., 3 days will be the last option in the fixed Timeline list. Similarly, if the user chooses the
Any option from the Timeline list and proceeds to provide a start date and end date for
report generation using the From and To specifications, eG Enterprise will first check if the
user's Timeline specification conforms to his/her maximum timeline setting. If not, report
generation will fail. For instance, for a user who is allowed to generate reports spanning over
a maximum period of 3 days only, the difference between the From and To dates
should never be over 3 days. If it is, then, upon clicking the Run Report button a
message box will appear, prompting the user to change the From and To
specification.
10.
In addition to the settings discussed above, this report comes with a set of default specifications. These settings
are hidden by default. If you do not want to disturb these default settings, then you can proceed to generate
the report by clicking the RUN REPORT BUTTON soon after you pick one/more Physical Servers. However, if you
want to view and then alter these settings (if required), click on the
button. The default settings will then
appear in the MORE OPTIONS drop down window (see Figure 9.101). The steps below discuss each of these
settings and how they can be customized.
Figure 9.101: The default settings for generating the Cluster – Physical Servers report
11.
The speed with which a report is generated depends primarily on the report Timeline. While a Timeline that
varies between a couple of days to a week enables the eG Enterprise system to quickly retrieve the required
data, timelines that span multiple weeks/months could slow-down the data retrieval and report generation
process to a considerable extent, owing to the volume of data involved. In order to ensure quick and easy
access to reports, eG Enterprise provides you the option of enabling data retrieval from the Trend information in
the database, instead of the Detailed test information that is used by default for report generation. The Detailed
test information based comprises of multiple measurement records for a test - one or more each for every test
execution. Whereas, the Trend information includes only hourly, daily, and monthly summary computations for
a test performed on a continuous basis. For instance, during a period of 1 hour, a test that runs every 5
minutes inserts atleast 12 records into the Detailed test information base. On the other hand, the Trend
371
Virtualization Reports
information base would consist of only 1 record for the same 1 hour period. Fewer the number of records,
query execution becomes much quicker, and data retrieval faster. To use the trend data for report generation,
you will have to select the Trend option from the Show Data field in Figure 9.100. By default, the Detailed option
is selected in Figure 9.100 indicating that the report data is retrieved from the detailed test information in the
database. If need be, you can also ensure that all reports always use the Detailed test tables alone by hiding
the Show Data field from the reporter interface. To achieve this, do the following:
12.
Login to the eG administrative interface as 'admin'.
Select the Manager option from the Settings tile that appears when the
clicked.
From the GENERAL SETTINGS page that then appears, if you set the Compute average/sum of metrics
while trending flag to No, then the Show Data field will not appear in the reporter interface; this denies
users access to the Trend option, and thus ensures that reports are always generated using the Detailed
tables.
button against the Admin tab is
A Trend report will not include the data for the current day since trend data is only
computed at the end of the day.
If the Trend option is chosen, the time period of the report should be greater than
1 day.
The usage of Detailed test tables for generating reports, especially those that span
weeks, increases the stress on the eG database, thus resulting in undue delays in
report generation. In order to ensure that the database is not choked by such
voluminous data requests, you can configure eG Enterprise to automatically "force"
the use of the Trend option if the Timeline of a report exceeds a pre-configured
duration. To specify this time boundary, do the following:
Edit the eg_report.ini file in the <EG_INSTALL_DIR>\manager\config directory.
In the [MISC] section of the file, you will find a DetailedTime parameter.
Specify the duration (in days) beyond which Detailed reports cannot be generated,
against the DetailedTime parameter, and save the eg_report.ini file.
For instance, to make sure that Detailed reports are disallowed for a Timeline of
over 2 weeks, set the DetailedTime parameter to 14 and save the file.
Say, subsequently, you attempt to generate a Detailed report for a Fixed Timeline
of 3 weeks (which is greater than the 14-day limit set in our example). The instant
you select the 3 weeks option from the Fixed list box, the Detailed option gets
automatically disabled, and the Trend option gets enabled. Similarly, if you specify
an Any Timeline that runs over 14 days, then, upon clicking the RUN REPORT
BUTTON to generate the report, a message box appears (see Figure 5.7) informing
you that only the Trend option is permitted.
To proceed with the Trend report generation, click the OK button in the message
box. To terminate Trend report generation, click the CANCEL button.
If the timeline specified for the report needs to exclude the data collected during the Weekends, then set
372
Virtualization Reports
Exclude weekends to Yes. If not, select No.
By default, the weekend constitutes Saturday and Sunday. To override this default setting,
do the following:
Edit the eg_report.ini file in the <EG_INSTALL_DIR>\manager\config directory.
In the [VIRTUAL_CLUSTER] section of the file, the EXCLUDE_WEEKEND parameter is
set to Saturday,Sunday by default. You can modify this by setting the
EXCLUDE_WEEKEND parameter to a comma-separated list of other days of the week
- say Friday,Saturday.
Save the file after making the required changes.
13.
Next, indicate the report Timeperiod.
14.
In large environments, reports generated using months of data can take a long time to complete.
Administrators now have the option of generating reports on-line or in the background. When a report is
scheduled for background generation, administrators can proceed with their other monitoring, diagnosis, and
reporting tasks, while the eG manager is processing the report. This saves the administrator valuable time. To
schedule background processing of a report, select the Background Save - PDF option from the Report
Generation list. In this case, a Report Name text box will appear, where you would have to provide the name
with which the report is to be saved in the background. To process reports in the foreground, select the
Foreground Generation - HTML option from this list.
15.
The Report Generation list will appear only if the EnableBackgroundReport flag in
the [BACKGROUND_PROCESS] section of the eg_report.ini file (in the
{EG_INSTALL_DIR}\manager\config directory) is set to Yes.
The default selection in the Report Generation list will change according to the
Timeline specified for the report. If the Timeline set is greater than or equal to the
number of days specified against the MinDurationForReport parameter in the
[BACKGROUND_PROCESS] section of the eg_report.ini file, then the default selection
in the Report Generation list will be Background. On the other hand, if the Timeline
set for the report is lesser than the value of the MinDurationForReport parameter,
then the default selection in the Report Generation list will be Foreground. This is
because, the MinDurationForReport setting governs when reports are to be
processed in the background. By default, this parameter is set to 2 weeks - this
indicates that by default, reports with a timeline of 2 weeks and above will be
processed in the background.
Finally, click the Run Report button.
373
Virtualization Reports
16.
If the Report Type is Graph, the View by selection is Measures, and the option chosen from the Report
Generation list is Foreground Generation - HTML, then, clicking the RUN REPORT BUTTON will invoke Figure
9.102.
Figure 9.102: A Cluster - Physical Servers report if the 'View by' option chosen is 'Measures'
17.
Figure 9.102, as you can see, displays a wide variety of time-of-day graphs, each of which plot the historical
values of a pre-configured resource usage metric related to the chosen Physical Servers in a cluster. In the
374
Virtualization Reports
event of excessive resource usage by a server, you can use this report to cross-correlate and time-correlate
across the metrics to figure out when exactly and why the problem occurred.
18.
If the Report Type is Graph and the View by selection is Distribution, and the Report for option is Physical
Servers, you will be required to pick the Measure for which the distribution graphs are to be drawn. Once this is
done, then picking the Foreground Generation - HTMLoption from the Report Generation list and clicking the
RUN REPORT BUTTON will invoke Figure 9.103.
Figure 9.103: A Cluster - Physical Servers report that appears when the 'View by' option is 'Distribution'
19.
Figure 9.103 comprises of the following:
A distribution pie chart that depicts the number of physical servers that are in different distribution ranges.
The distribution ranges are obtained by applying the first of the configured functions on the chosen
Measure. For instance, assume that Physical CPU utilization is the chosen Measure. Say that you have
configured to display the Avg and Max of this measure in a Data report. Typically, both these configured
values will appear only in the Data report. In the case of a Graph report however, the first of the two
functions - i.e., Avg of Physical CPU utilization - alone is calculated for every physical server in the chosen
Cluster. The resulting pie chart enables administrators to deduce, at a glance, the number of physical
servers where the chosen performance metric has fared well and/or badly. Clicking on a particular slice in
the pie chart lists the physical servers that fall within the value range represented by that slice (see Figure
9.104). Against every server, the actual values for each of the configured functions (both Avg and Max, in
our example) will be displayed. A cluster-level Summary of the chosen Measure will also be available.
375
Virtualization Reports
By default, the chart type for distribution is a pie chart. However, you can have a
bar graph depict the same data instead of a pie chart, by following the steps given
below:
Edit the eg_report.ini file in the <eg_install_dir>\manager\config directory.
Change the value of the chartTypeForDist parameter in the [virtual_CENTER]
section of this file from the default Pie, to Bar.
Save the eg_report.ini file.
By default, the number of value ranges that need to be configured for the
distribution chart is 10. To override this default setting, do the following:
Edit the eg_report.ini file in the <eg_install_dir>\manager\config directory.
Specify a number of your choice against the nofRangeForDist parameter in the
[virtual_cluster] section of this file. By default, this parameter will hold the value
10.
Save the eg_report.ini file.
Figure 9.104: The physical servers that fall within the usage range clicked on
20.
Adjacent to the pie chart, you will find a bar chart that indicates the physical servers that have topped/failed in
a selected performance realm (i.e., the Measure) during the specified Timeline. For example, for the Physical
CPU utilization measure, this bar chart reveals the physical servers in the cluster that are using CPU excessively.
Like the pie chart, the values for the bar chart are also calculated by applying the first of the configured
functions on the chosen Measure.
376
Virtualization Reports
You can configure the colors to be used in the distribution chart and the Top <N> Components bar chart
in the zone report, by editing the eg_report.ini file in the <EG_INSTALL_DIR>\manager\config directory. The
[VIRTUAL_CLUSTER] section of the file defines the 20 default colors of the distribution and bar charts:
[VIRTUAL_CLUSTER]
ChartColor=#8399b0,#ffd95a,#a4ac91,#98d980,#d5b996,#f48848,#8b8cc2,
#eb4052,#c4b3d0,#b18651,#ebb7ce,#028768,#f5c372,#887c65,#e4c536,
#b5582c,#f94989,#770d72,#97a067,#89aeb7
distColor=#115fa6,#f25454,#60bd68,#b276b2,#81bef7,#a61120,#ffd13e,
#770d72,#887c65,#a4ac91
You override the default color settings of the distribution chart by modifying the color-codes specifying
against distColor. For changing the colors used by the Top <N> Components chart, alter the codes listed
against the ChartColor parameter.
The number of components to be displayed in the Top <N> Components bar chart is
configurable. To specify the number, select Top-N from the Filter by list in Figure 9.101,
and pick an option from the adjacent drop-down list.
21.
Likewise, if the Report Type is Graph, the View by selection is Distribution, and the Report for option is Virtual
Machines, you will be required to pick the Measure for which the distribution graphs are to be drawn. Once this
is done, then picking the Foreground Generation - HTML option from the Report Generation list and clicking the
Run Report button will invoke Figure 9.105.
377
Virtualization Reports
Figure 9.105: A Cluster - Physical Servers Report that appears when the 'View by' option is 'Distribution' and 'Report
for' option is 'Virtual Machines'
22.
Figure 9.105 reveals the following:
A distribution pie chart that depicts the number of virtual machines that are in different distribution ranges.
The distribution ranges are obtained by applying the first of the configured functions on the chosen
Measure. For instance, assume that Physical CPU utilization is the chosen Measure. Say that you have
configured to display the Avg and Max of this measure in a Data report. Typically, both these configured
values will appear only in the Data report. In the case of a Graph report however, the first of the two
378
Virtualization Reports
functions - i.e., Avg of Physical CPU utilization - alone is calculated for every virtual machine configured
on each physical server in the chosen Cluster. The resulting pie chart enables administrators to deduce, at
a glance, the number of virtual machines where the chosen performance metric has fared well and/or
badly. Clicking on a particular slice in the pie chart lists the VMs that fall within the value range
represented by that slice (see Figure 9.106). Against every server, the actual values for each of the
configured functions (both Avg and Max, in our example) will be displayed. A cluster-level Summary of the
chosen Measure will also be available.
By default, the chart type for distribution is a pie chart. However, you can have a
bar graph depict the same data instead of a pie chart, by following the steps given
below:
Edit the eg_report.ini file in the <EG_INSTALL_DIR>\manager\config directory.
Change the value of the chartTypeForDist parameter in the [VIRTUAL_CENTER]
section of this file from the default Pie, to Bar.
Save the eg_report.ini file.
By default, the number of value ranges that need to be configured for the
distribution chart is 10. To override this default setting, do the following:
Edit the eg_report.ini file in the <EG_INSTALL_DIR>\manager\config directory.
Specify a number of your choice against the nofRangeForDist parameter in the
[VIRTUAL_CLUSTER] section of this file. By default, this parameter will hold the value
10.
Save the eg_report.ini file.
Figure 9.106: The physical servers that fall within the usage range clicked on
23.
Adjacent to the pie chart, you will find a bar chart that indicates the VMs that have topped/failed in a selected
performance realm (i.e., the Measure) during the specified Timeline. For example, for the Physical CPU
utilization measure, this bar chart reveals the VMs in the cluster that are using CPU excessively. Like the pie
chart, the values for the bar chart are also calculated by applying the first of the configured functions on the
379
Virtualization Reports
chosen Measure.
You can configure the colors to be used in the distribution chart and the Top <N> Components bar chart
in the zone report, by editing the eg_report.ini file in the <EG_INSTALL_DIR>\manager\config directory. The
[VIRTUAL_CLUSTER] section of the file defines the 20 default colors of the distribution and bar charts:
[VIRTUAL_CLUSTER]
ChartColor=#8399b0,#ffd95a,#a4ac91,#98d980,#d5b996,#f48848,#8b8cc2,
#eb4052,#c4b3d0,#b18651,#ebb7ce,#028768,#f5c372,#887c65,#e4c536,
#b5582c,#f94989,#770d72,#97a067,#89aeb7
distColor=#115fa6,#f25454,#60bd68,#b276b2,#81bef7,#a61120,#ffd13e,
#770d72,#887c65,#a4ac91
You override the default color settings of the distribution chart by modifying the color-codes specifying
against distColor. For changing the colors used by the Top <N> Components chart, alter the codes listed
against the ChartColor parameter.
The number of components to be displayed in the Top <N> Components bar chart is
configurable. To specify the number, select Top-N from the Filter by list in Figure 9.101, and
pick an option from the adjacent drop-down list.
24.
If the Report Type is Data, then the View by list will no longer appear. Also, the Report by section will now allow
you to choose between the Physical Servers and the Virtual Machines options. Moreover, besides enabling you
to view the data pertaining to all/specific clusters managed by a chosen vCenter server, the Data report will also
enable you to view the data pertaining to all/specific Resource Pools.
25.
If the Report Type is Data and neither the Physical Servers nor the Virtual Machines check box is selected from
Report by, then, clicking the Run Report button will reveal Figure 9.107.
380
Virtualization Reports
Figure 9.107: The Cluster Details Data Report
26.
For a particular cluster, Figure 9.107 provides separate sections displaying the user-configured metrics related
to the CPU and memory usage of the chosen/all resource pools (depending upon the option chosen from the
Resource pool list) in that cluster. This way, you can analyze cluster performance over time, and identify the
resource-intensive pools in the cluster that are adversely impacting the overall cluster health.
27.
Besides metrics, users can also configure the functions that they want applied on the metrics, so that they
receive the true picture of the performance of the cluster. The number of values displayed per measure in the
report will depend upon the number of functions that the user has configured for the measure.
28.
If the Physical Servers check box alone is selected from Report by, then, Figure 9.108 will appear upon clicking
the Run Report button. As you can see, in addition to the default sections focusing on CPU and memory usage,
Figure 9.108 provides a Physical Server Report Details section that provides an overview of the performance of
all ESX servers that are part of the chosen cluster. Using this information, you can figure out whether any of the
ESX servers have contributed to any deterioration in the performance of the cluster.
381
Virtualization Reports
Figure 9.108: A Cluster Details Report providing Physical Server information additionally
29.
Clicking on a Physical Server link in this section will lead you to a Server Report that zooms into the
performance of the physical server that was clicked.
30.
This Physical Server Report section of Figure 9.108 will also provide you with a quick Summary of the
performance of the cluster across its physical servers.
31.
The Health % that corresponds to every physical server included in a cluster is a good indicator of how problemprone that physical server was during the given period. Clicking on this percentage leads you to an Executive
Report of that physical server, using which you can determine the type of problems that were encountered by
that server during the said period, which layers were frequently affected and on what days (see Figure 9.109).
32.
The Heath % for the Summary row on the other hand signifies the overall health of the cluster.
382
Virtualization Reports
Figure 9.109: An Executive Report of the physical server
33.
If the Virtual Machines check box alone is selected from Report by, then, Figure 9.110 will appear upon clicking
the RUN REPORT BUTTON. As you can see, in addition to the default sections focusing on CPU and memory
usage, Figure 9.110 provides a Virtual Machines section that indicates how resource-intensive each VM in the
cluster is. Using this information, you can figure out whether any of the VMs have contributed to any
deterioration in the performance of the cluster.
383
Virtualization Reports
Figure 9.110: A Cluster Details Report additionally providing virtual machine information
34.
Clicking on a VM in this section will lead you to the Virtual Machine Details report of that VM.
35.
If the All option had been chosen from the Cluster list in Figure 9.111, the resulting report will display CPU and
memory usage metrics related to every cluster configured on the chosen vCenter Server (see Figure 9.111). If
both the Physical Servers and Virtual Machines check boxes are selected, then the report will also explore the
resource usage of the ESX servers and VMs in all the clusters managed by the chosen vCenter Server (see
Figure 9.111).
384
Virtualization Reports
Figure 9.111: The Cluster - Physical servers report revealing the CPU and memory usage of every cluster on a
vCenter
36.
To zoom into the performance of a particular cluster, just click on it. Figure 9.112 will then appear.
385
Virtualization Reports
Figure 9.112: A report displaying the details of a particular cluster
37.
On the other hand, if the Background Save - PDF option is chosen from the Report Generation list, then clicking
on the RUN REPORT BUTTON will not generate the report and display it in this page for your benefit. Instead, a
message indicating that the report is being processed in the background will appear. This will be accompanied
by a link that will lead you to the page that lists all the reports that are being processed in the background, and
their current status. If background report generation fails for a report, you can regenerate that report using this
page, or can even delete that report if need be. On the other hand, if background processing successfully
completes for your report, then, you can view a PDF of the report by clicking on the
icon in that page.
9.16 Cluster - Virtual Machines Report
A resource-intensive VM running on a host operating system can create a severe dent in not only the resources of
the host, but also the consolidated resources of the cluster to which the host belongs. It is imperative that you
monitor the current and historical performance of the VMs in a cluster, so that resource contentions can be captured
early and resolved quickly. The Cluster - Virtual Machines report provides you with historical insights into the
performance of VMs with a cluster, thereby turning the spotlight on potential resource contentions.
To generate this report, do the following:
1.
Select the Virtual Machines option from the vCenter Reports node of the REPORTS BY FUNCTION tree.
2.
Figure 9.113 will then appear.
386
Virtualization Reports
Figure 9.113: Providing the specifications of the Cluster - Virtual Machines report
3.
First, pick a Report Type. For a graphical representation of the VM performance, pick the Graph option. To view
the metrics related to the resource usage of the VMs in a cluster in a tabulated form, pick the Data option.
4.
If the Report Type is Graph, then the View by list will offer 2 options - Timeline and Distribution. While the
Timeline option will provide a time-of-day measure graph depicting resource pool performance, the Distribution
option will result in distribution pie charts and bar graphs being displayed. The default selection is however
Timeline.
5.
By default, the Report for list will display VMware vCenter as its selection.
6.
From the vCenter Server list, pick the vCenter server for which the report is to be generated.
7.
Upon selecting the vCenter Server, the Cluster list will get automatically populated with those clusters that are
being managed by the chosen vCenter Server. Pick a cluster for which this report is to be generated.
8.
Then, pick an option from the Report by list. By default, the Virtual Machines option will be chosen here.
9.
Next, pick a measure for which a graph is to be generated, from the Measure list.
10.
Then, specify the Timeline for the graph. You can either provide a fixed time line such as 1 hour, 2 days, etc.,
or select the Any option from the list to provide a From and To date/time for report generation.
For every user registered with the eG Enterprise system, the administrator can indicate the
maximum timeline for which that user can generate a report. Once the maximum timeline is
set for a user, then, whenever that user logs into eG Reporter and attempts to generate a
report, the Timeline list box in the report page will display options according to the maximum
timeline setting of that user. For instance, if a user can generate a report for a maximum
period of 3 days only, then 3 days will be the highest option displayed in the Timeline list i.e., 3 days will be the last option in the fixed Timeline list. Similarly, if the user chooses the
Any option from the Timeline list and proceeds to provide a start date and end date for
report generation using the From and To specifications, eG Enterprise will first check if the
user's Timeline specification conforms to his/her maximum timeline setting. If not, report
generation will fail. For instance, for a user who is allowed to generate reports spanning over
a maximum period of 3 days only, the difference between the From and To dates should
never be over 3 days. If it is, then, upon clicking the Run Report button a message box will
appear, prompting the user to change the From and To specification.
11.
In addition to the settings discussed above, this report comes with a set of default specifications. These settings
are hidden by default. If you do not want to disturb these default settings, then you can proceed to generate
387
Virtualization Reports
the report by clicking the RUN REPORT BUTTON soon after you pick a Measure. However, if you want to view and
then alter these settings (if required), click on the
button. The default settings will then appear in the MORE
OPTIONS drop down window (see Figure 9.114). The steps below discuss each of these settings and how they
can be customized.
Figure 9.114: The default settings for generating the Cluster Virtual Machines report
12.
The speed with which a report is generated depends primarily on the report Timeline. While a Timeline that
varies between a couple of days to a week enables the eG Enterprise system to quickly retrieve the required
data, timelines that span multiple weeks/months could slow-down the data retrieval and report generation
process to a considerable extent, owing to the volume of data involved. In order to ensure quick and easy
access to reports, eG Enterprise provides you the option of enabling data retrieval from the Trend information in
the database, instead of the Detailed test information that is used by default for report generation. The Detailed
test information based comprises of multiple measurement records for a test - one or more each for every test
execution. Whereas, the Trend information includes only hourly, daily, and monthly summary computations for
a test performed on a continuous basis. For instance, during a period of 1 hour, a test that runs every 5
minutes inserts atleast 12 records into the Detailed test information base. On the other hand, the Trend
information base would consist of only 1 record for the same 1 hour period. Fewer the number of records,
query execution becomes much quicker, and data retrieval faster. To use the trend data for report generation,
you will have to select the Trend option from the Show Data field in Figure 9.113. By default, the Detailed option
is selected in Figure 9.113 indicating that the report data is retrieved from the detailed test information in the
database. If need be, you can also ensure that all reports always use the Detailed test tables alone by hiding
the Show Data field from the reporter interface. To achieve this, do the following:
Login to the eG administrative interface as 'admin'.
Select the Manager option from the Settings tile that appears when the
clicked.
From the GENERAL SETTINGS page that then appears, if you set the Compute average/sum of metrics
while trending flag to No, then the Show Data field will not appear in the reporter interface; this denies
users access to the Trend option, and thus ensures that reports are always generated using the Detailed
tables.
388
button against the Admin tab is
Virtualization Reports
13.
A Trend report will not include the data for the current day since trend data is only
computed at the end of the day.
If the Trend option is chosen, the time period of the report should be greater than
1 day.
The usage of Detailed test tables for generating reports, especially those that span
weeks, increases the stress on the eG database, thus resulting in undue delays in
report generation. In order to ensure that the database is not choked by such
voluminous data requests, you can configure eG Enterprise to automatically "force"
the use of the Trend option if the Timeline of a report exceeds a pre-configured
duration. To specify this time boundary, do the following:
Edit the eg_report.ini file in the <EG_INSTALL_DIR>\manager\config directory.
In the [MISC] section of the file, you will find a DetailedTime parameter.
Specify the duration (in days) beyond which Detailed reports cannot be generated,
against the DetailedTime parameter, and save the eg_report.ini file.
For instance, to make sure that Detailed reports are disallowed for a Timeline of
over 2 weeks, set the DetailedTime parameter to 14 and save the file.
Say, subsequently, you attempt to generate a Detailed report for a Fixed Timeline
of 3 weeks (which is greater than the 14-day limit set in our example). The instant
you select the 3 weeks option from the Fixed list box, the Detailed option gets
automatically disabled, and the Trend option gets enabled. Similarly, if you specify
an Any Timeline that runs over 14 days, then, upon clicking the RUN REPORT
BUTTON to generate the report, a message box appears (see Figure 5.7) informing
you that only the Trend option is permitted.
To proceed with the Trend report generation, click the OK button in the message
box. To terminate Trend report generation, click the CANCEL button.
If the timeline specified for the report needs to exclude the data collected during the Weekends, then set
Exclude weekends to Yes. If not, select No.
389
Virtualization Reports
By default, the weekend constitutes Saturday and Sunday. To override this default setting,
do the following:
Edit the eg_report.ini file in the <EG_INSTALL_DIR>\manager\config directory.
In the [VIRTUAL_CLUSTER] section of the file, the EXCLUDE_WEEKEND parameter is
set to Saturday,Sunday by default. You can modify this by setting the
EXCLUDE_WEEKEND parameter to a comma-separated list of other days of the week
- say Friday,Saturday.
Save the file after making the required changes.
14.
Next, indicate the report Time period.
15.
You can further filter the resultset of your report picking one of the following options from the Filter by list:
TOP-N - Select this option and pick a TOP-N or a LAST-N option from the drop-down list adjacent to it to
ensure that the resulting graph only plots the values of the specified number of TOP / LAST players in the
chosen performance arena.
Range - Pick this option and provide a value range in the From and To text boxes that appear alongside.
Greaterthan - Pick this option and provide a value in the text box that appears alongside to view the details
of only those resource pools which have registered a value greater than the value specified in that box for
the chosen Measure.
Lessthan - Pick this option and provide a value in the text box that appears alongside to view the details of
only those resource pools which have registered a value lesser than the value specified in that box for the
chosen Measure.
16.
In large environments, reports generated using months of data can take a long time to complete.
Administrators now have the option of generating reports on-line or in the background. When a report is
scheduled for background generation, administrators can proceed with their other monitoring, diagnosis, and
reporting tasks, while the eG manager is processing the report. This saves the administrator valuable time. To
schedule background processing of a report, select the Background Save - PDF option from the Report
Generation list. In this case, a Report Name text box will appear, where you would have to provide the name
with which the report is to be saved in the background. To process reports in the foreground, select the
Foreground Generation - HTML option from this list.
390
Virtualization Reports
The Report Generation list will appear only if the EnableBackgroundReport flag in
the [BACKGROUND_PROCESS] section of the eg_report.ini file (in the
{EG_INSTALL_DIR}\manager\config directory) is set to Yes.
The default selection in the Report Generation list will change according to the
Timeline specified for the report. If the Timeline set is greater than or equal to the
number of days specified against the MinDurationForReport parameter in the
[BACKGROUND_PROCESS] section of the eg_report.ini file, then the default selection
in the Report Generation list will be Background. On the other hand, if the Timeline
set for the report is lesser than the value of the MinDurationForReport parameter,
then the default selection in the Report Generation list will be Foreground. This is
because, the MinDurationForReport setting governs when reports are to be
processed in the background. By default, this parameter is set to 2 weeks - this
indicates that by default, reports with a timeline of 2 weeks and above will be
processed in the background.
17.
Finally, click the Run Report button.
18.
If the Report Type is Graph, the View by selection is Timeline, the Report by option is Resource Pools, and the
option chosen from the Report Generation list is Foreground Generation - HTML, then, clicking the Run Report
button will invoke Figure 9.115.
Figure 9.115: A Cluster - Resource Pools report if the 'View by' option chosen is 'Timeline' and 'Report by' option is
'Resource pools'
19.
Figure 9.115, as you can see, displays a time-of-day graph - this graph compares the behavior of the chosen
performance measure acriss all the resource pools within the selected cluster during the specified timeline. For
instance, if CPU usage is the Measure chosen, then this graph will compare the CPU usage of the resource pools
in the cluster, thus visually enabling you toidentify which resource pool is utilizing CPU excessively.
391
Virtualization Reports
20.
If the Report Type is Graph, the View by selection is Timeline, the Report for option is Physical Servers, and the
option chosen from the Report Generation list is Foreground Generation - HTML, then, clicking the RUN REPORT
BUTTON will invoke Figure 9.116. The graph displayed in Figure 9.116 will enable you to quickly compare the
chosen performance metric across all the physical servers in the selected cluster so that, resource-intensive
servers in the cluster can be isolated.
Figure 9.116: The Cluster -Virtual Machines report if the 'View by' selection is 'Timeline' and the 'Report by' selection
is 'Virtual machines'
21.
Now, if the Report Type is Graph, the View by selection is Distribution, the Report by option is Virtual Machines,
and the option chosen from the Report Generation list is Foreground Generation - HTML, then, clicking the RUN
REPORT BUTTON will invoke Figure 9.117.
392
Virtualization Reports
Figure 9.117: A Cluster - Resource pools report that appears when the 'View by' option is 'Distribution' and 'Report by'
option is 'Virtual Machines'
22.
Figure 9.117 reveals the following:
A distribution pie chart that depicts the number of virtual machines that are in different distribution ranges.
The distribution ranges are obtained by applying the first of the configured functions on the chosen
Measure. For instance, assume that Physical CPU utilization is the chosen Measure. Say that you have
configured to display the Avg and Max of this measure in a Data report. Typically, both these configured
values will appear only in the Data report. In the case of a Graph report however, the first of the two
functions - i.e., Avg of Physical CPU utilization - alone is calculated for every virtual machine configured
on each physical server in the chosen Cluster. The resulting pie chart enables administrators to deduce, at
a glance, the number of virtual machines where the chosen performance metric has fared well and/or
badly. Clicking on a particular slice in the pie chart lists the VMs that fall within the value range
represented by that slice (see Figure 9.118). Against every server, the actual values for each of the
configured functions (both Avg and Max, in our example) will be displayed. A cluster-level Summary of the
chosen Measure will also be available.
393
Virtualization Reports
By default, the chart type for distribution is a pie chart. However, you can have a bar
graph depict the same data instead of a pie chart, by following the steps given below:
Edit the eg_report.ini file in the <EG_INSTALL_DIR>\manager\config directory.
Change the value of the chartTypeForDist parameter in the [VIRTUAL_CENTER]
section of this file from the default Pie, to Bar.
Save the eg_report.ini file.
By default, the number of value ranges that need to be configured for the distribution
chart is 10. To override this default setting, do the following:
Edit the eg_report.ini file in the <EG_INSTALL_DIR>\manager\config directory.
Specify a number of your choice against the nofRangeForDist parameter in the
[VIRTUAL_CLUSTER] section of this file. By default, this parameter will hold the value
10.
Save the eg_report.ini file.
Figure 9.118: The virtual machines that fall within the usage range clicked on
23.
Adjacent to the pie chart, you will find a bar chart that indicates the VMs that have topped/failed in a selected
performance realm (i.e., the Measure) during the specified Timeline. For example, for the Physical CPU
utilization measure, this bar chart reveals the VMs in the cluster that are using CPU excessively. Like the pie
chart, the values for the bar chart are also calculated by applying the first of the configured functions on the
chosen Measure.
394
Virtualization Reports
You can configure the colors to be used in the distribution chart and the Top <N> Components bar chart
in the zone report, by editing the eg_report.ini file in the <EG_INSTALL_DIR>\manager\config directory. The
[VIRTUAL_CLUSTER] section of the file defines the 20 default colors of the distribution and bar charts:
[VIRTUAL_CLUSTER]
ChartColor=#8399b0,#ffd95a,#a4ac91,#98d980,#d5b996,#f48848,#8b8cc2,
#eb4052,#c4b3d0,#b18651,#ebb7ce,#028768,#f5c372,#887c65,#e4c536,
#b5582c,#f94989,#770d72,#97a067,#89aeb7
distColor=#115fa6,#f25454,#60bd68,#b276b2,#81bef7,#a61120,#ffd13e,
#770d72,#887c65,#a4ac91
You override the default color settings of the distribution chart by modifying the color-codes specifying
against distColor. For changing the colors used by the Top <N> Components chart, alter the codes listed
against the ChartColor parameter.
The number of components to be displayed in the Top <N> Components bar chart is
configurable. To specify the number, select Top-N from the Filter by list in Figure 9.114 and
pick an option from the adjacent drop-down list.
24.
If the Report Type is Data, then the View by list will no longer appear. Also, the Report by section will now allow
you to choose between the Physical Servers and the Virtual Machines options - here again, the Virtual Machines
option will be chosen by default. Moreover, besides enabling you to view the data pertaining to all/specific
clusters managed by a chosen vCenter server, the Data report will also enable you to view the data pertaining
to all/specific Resource Pools.
25.
If the Virtual Machines check box alone is selected from Report by, then, Figure 9.119 will appear upon clicking
the RUN REPORT BUTTON. As you can see, in addition to the default sections focusing on CPU and memory
usage, Figure 9.119 provides a Virtual Machines section that indicates how resource-intensive each VM in the
cluster is. Using this information, you can figure out whether any of the VMs have contributed to any
deterioration in the performance of the cluster.
395
Virtualization Reports
Figure 9.119: A Cluster Details Report additionally providing virtual machine information
26.
Clicking on a VM in this section will lead you to the Virtual Machine Details report of that VM.
27.
If the All option had been chosen from the Cluster list in Figure 9.113, the resulting report will display CPU and
memory usage metrics related to every cluster configured on the chosen vCenter Server (see Figure 9.120). If
both the Physical Servers and Virtual Machines check boxes are selected, then the report will also explore the
resource usage of the ESX servers and VMs in all the clusters managed by the chosen vCenter Server (see
Figure 9.120).
396
Virtualization Reports
Figure 9.120: The Cluster Details report revealing the CPU and memory usage of every cluster on a vCenter
397
Virtualization Reports
28.
To zoom into the performance of a particular cluster, just click on it. Figure 9.121 will then appear.
Figure 9.121: A report displaying the details of a particular cluster
29.
On the other hand, if the Background Save - PDF option is chosen from the Report Generation list, then clicking
on the RUN REPORT BUTTON will not generate the report and display it in this page for your benefit. Instead, a
message indicating that the report is being processed in the background will appear. This will be accompanied
by a link that will lead you to the page that lists all the reports that are being processed in the background, and
their current status. If background report generation fails for a report, you can regenerate that report using this
page, or can even delete that report if need be. On the other hand, if background processing successfully
completes for your report, then, you can view a PDF of the report by clicking on the
icon in that page.
By default, the metrics displayed in the Cluster - Physical Servers, Cluster - Virtual Machines, Cluster - Resource
Pools, and Cluster - Details report and the functions applied on them are pre-configured in two groups - namely,
Cpu_usage and Memory_usage - in the [VIRTUAL_CLUSTER] section in the eg_report.ini file in the
<EG_INSTALL_DIR>\manager\config directory. The names of these default groups cannot be changed, but you can
modify the eg_report.ini file to include more metrics to the groups and apply additional functions to them. Typically,
all CPU-related metrics will be added to the Cpu_usage group, and the memory-related metrics to the Memory_usage
group. To add a new measure to say, the Cpu_usage group, you will have to insert a line in the following format in
the [VIRTUAL_CLUSTER] section of the eg_report.ini file:
Cpu_usage:<InternalTestName>:<InternalMeasureName>=<Comma-separated list of functions>
For instance, to add the Physical CPU used measure to the Cpu_usage group, insert the following line:
Cpu_usage:ClusterResPoolTest:Physical_cpu_used=Avg,Max
Similarly, to add the Memory used measure to the Memory_usage group, insert the following line:
398
Virtualization Reports
Memory_usage: ClusterResPoolTest:Memory_used=Avg,Max
The default measure configurations for the Physical Servers Report section will be available in the [VIRTUAL_HOST]
section of the file. You can override this default setting by adding more physical server-related tests or removing
some existing tests. To add a new measure to this section, add an entry of the following format:
<InternalTestName>:<InternalMeasureName>#<MeasureDisplayName>=<Comma-separated list of functions>
For instance, to add the Registered guests measure to the Physical Servers section, your specification should be:
EsxGuestStatusTest:Registered_guests#Registered guests=Avg,Max
The default measure configurations for the Virtual Machines section on the other hand will be available in the
[VIRTUAL_GUEST] section of the file. You can override this default setting by adding more VM-related tests or
removing some existing tests. To add a new measure to this section, add an entry of the following format:
<InternalTestName>:<InternalMeasureName>#<MeasureDisplayName>=<Comma-separated list of functions>
For example, to add the Physical CPU used measure to the Virtual Machines section, your specification should be:
EsxGuestTest:Cpu_used#CPU Used=Avg,Max
To know the internal names of tests and measures, follow the steps discussed in Page 212 of this manual.
9.17 Cluster VM Sprawl Report
Large virtualized environments are typically characterized by a multitude of virtual hosts, each hosting tens of virtual
machines. Administrators need to periodically review the usage of these VMs in order to identify those VMs that have
been utilized optimally and those that have been under-utilized. Since each VM, regardless of its powered-on state
and user activity, consumes disk space and memory, the knowledge of unused/under-used VMs will enable
administrators to decide whether/not to pull down such VMs in an effort to conserve valuable physical resources. The
resources thus released may be used to support critical operations performed by other VMs or to avert
slowdowns/performance degradations experienced by mission-critical applications executing on these VMs.
To provide administrators with insights into the state and usage of VMs across their virtualized environment, and to
enable them to instantly identify unused VMs, eG Enterprise offers the Cluster VM Sprawl report. Using this report,
administrators can figure out the following:
How many VMs across the environment are in a powered-off state? Which ones are they?
What percentage of time has a VM been in a powered-off state?
Are there any powered-on VMs to which users have not logged in for a long time? If so, which ones are
they?
How much memory and disk space has each unused VM been configured with? Can the removal of these
unused VMs improve the performance of other VMs and applications executing on them?
To generate this report, do the following:
1.
Select VM Sprawl option from the vCenter Reports node of the REPORTS BY FUNCTION tree. Figure 9.122 then
appears.
399
Virtualization Reports
Figure 9.122: Providing the specifications for the Cluster VM SPRAWL report
2.
As shown in Figure 9.122, for a graphical report, select Graph as the Report Type. For a tabular report, select
Data.
3.
Then, select a criterion for analysis from the Analyze by list box. Using this report, you can analyze the
performance of one/more vCenter components, or those that are part of a Zone. The options provided by the
Analyze by list box are discussed hereunder:
o
Component: Select this option to choose the vCenter component(s) from across all the components that
are available in the cluster environment. For instance, for a report on the powered-on state of VMs
executing within the clusters managed by an independent vCenter server in the environment, select
Component from the Analyze by list, select VMware vCenter from the Component Type list, and then select
the VMware vCenter host listed in the Component list.
o
Zone: Pick this option for a report on the performance of vCenter components that are included in a zone.
Then, choose a Zone. When a zone is picked, the Include Subzone flag is set to "Yes" by default, indicating
that the vCenter components within the subzones of the chosen zone will also be considered for report
generation. To exclude subzones from the scope of your report, set this flag to "No". If the chosen zone (or
its subzones) includes one/more components of vCenter type, then the Component Type list will include the
VMware vCenter option. Selecting this type will populate the Components list with all components of that
type, which are present in the selected zone. Select a vCenter component from this list.
4.
Select a cluster managed by the VMware vCenter Component from the Cluster drop-down list.
5.
Then, select a physical server type that is included in the cluster from the Server Type drop-down list. The
servers of the chosen type will then be listed in the Server list box. Pick one/more servers from this list. If the
Server list consists of too many servers, then viewing all the servers and selecting the ones you need for report
generation could require endless scrolling. To avoid this, you can click the
icon next to the Server list. The
SERVERS pop up window will then appear using which you can view almost all the servers in a single interface
and select the ones for which the report is to be generated.
6.
Then, specify the Timeline for the graph. You can either provide a fixed time line such as 1 hour, 2 days, etc.,
or select the Any option from the list to provide a From and To date/time for report generation.
400
Virtualization Reports
For every user registered with the eG Enterprise system, the administrator can indicate the
maximum timeline for which that user can generate a report. Once the maximum timeline is
set for a user, then, whenever that user logs into eG Reporter and attempts to generate a
report, the Timeline list box in the report page will display options according to the maximum
timeline setting of that user. For instance, if a user can generate a report for a maximum
period of 3 days only, then 3 days will be the highest option displayed in the Timeline list i.e., 3 days will be the last option in the fixed Timeline list. Similarly, if the user chooses the
Any option from the Timeline list and proceeds to provide a start date and end date for
report generation using the From and To specifications, eG Enterprise will first check if the
user's Timeline specification conforms to his/her maximum timeline setting. If not, report
generation will fail. For instance, for a user who is allowed to generate reports spanning over
a maximum period of 3 days only, the difference between the From and To dates should
never be over 3 days. If it is, then, upon clicking the Run Report button a message box will
appear, prompting the user to change the From and To specification.
7.
In addition to the settings discussed above, this report comes with a set of default specifications. These settings
are hidden by default. If you do not want to disturb these default settings, then you can proceed to generate
the report by clicking the Run Report button soon after you pick one/more Servers. However, if you want to
view and then alter these settings (if required), click on the
button. The default settings will then appear in
the MORE OPTIONS drop down window (see Figure 9.123). The steps below discuss each of these settings and
how they can be customized.
Figure 9.123: The default settings for generating the Cluster VM Sprawl reportk
8.
9.
Select any one of the following options from the Metric list:
For ESX hosts in the environment, the default selection from the Metric drop-down is Powered On.
For VDI environments, the Metric drop-down will provide an additional Powered On With User option.
Then, select a convenient show option from the Show drop list.
401
Virtualization Reports
The Show drop down list appears only when a graphical report is to be generated. The
selection from this list governs the maximum number of VMs to be displayed in the bar
graph. The default options of the Show list are: Top-25, Top-50, All, Last-25, Last-50. This
default setting is governed by the ShowTop parameter in the [VM_SPRAWL] section of the
eg_report.ini file (in the {EG_INSTALL_DIR}\manager\config directory). By default, this
ShowTop parameter is set to 50. To view bar graphs for a more or less number of VMs, you
may want to change this value. For example, if you set ShowTop to 100, then, the Show
drop-down list in the report page will provide administrators with the following options: Top100, Top-50, All, Last-100, and Last-50.
10.
11.
eG Enterprise allows users to generate desired reports for a specific time period. In large environments, while
generating reports for long time periods, say a few weeks to months, report generation was found to slow
down, owing to the large volume of data being processed. If users needed to generate many such reports
quickly, the slowdown compelled them to generate these reports one after another, thus affecting the speed of
their operations, and consequently, their productivity. eG Enterprise now includes a background processing
feature that will enable users to process multiple reports, spanning long time periods in the background, while
allowing them the bandwidth to generate short-term reports in the foreground. This way, users can generate
multiple reports with little-to-no loss of time. To schedule background processing of a report, select the
Background Save - PDF option from the Report Generation list. In this case, a Report Name text box will appear,
where you would have to provide the name with which the report is to be saved in the background. To process
reports in the foreground, select the Foreground Generation - HTML option from this list.
The Report Generation list will appear only if the EnableBackgroundReport flag in
the [BACKGROUND_PROCESS] section of the eg_report.ini file (in the
{EG_INSTALL_DIR}\manager\config directory) is set to Yes.
The default selection in the Report Generation list will change according to the
Timeline specified for the report. If the Timeline set is greater than or equal to the
number of days specified against the MinDurationForReport parameter in the
[BACKGROUND_PROCESS] section of the eg_report.ini file, then the default
selection in the Report Generation list will be Background. On the other hand, if the
Timeline set for the report is lesser than the value of the MinDurationForReport
parameter, then the default selection in the Report Generation list will be
Foreground. This is because; the MinDurationForReport setting governs, when
reports are to be processed in the background. By default, this parameter is set to
2 weeks - this indicates that by default, reports with a timeline of 2 weeks and
above will be processed in the background.
Finally, click the Run Report button to generate the report.
402
Virtualization Reports
Figure 9.124: Graph showing the Powered On state of the VMs
12.
For ESX virtual hosts environment, if the Report Type is Graph, you will view a report comprising a bar chart
that reveals the VMs that have been configured on all the chosen virtual hosts, and the percentage of time
(during the chosen Timeline) for which each VM has been in a powered-on state. Using this graph, you can
instantly identify VMs that have remained in a powered-off state for a considerably long time; this way, VMs
that have been unnecessarily eroding the allocated resources can be identified. Figure 9.124 shows the bar
graph of this report.
13.
For VDI environments, if the Display option chosen is Powered On With User, then, the resulting bar chart will
reveal the percentage of time each VM in the environment has been in the powered on state with a user logged
in. Using this graph, you can not only identify VMs that have been powered-off for a long time, but also
powered-on VMs that have remained idle for a long time.
You can configure the bar colors of the bar chart in the report, by editing the eg_report.ini
file in the {EG_INSTALL_DIR}\manager\config directory. The FusionColorForPowerOnPercent
parameter in the [VM_SPRAWL] section of the file defines the default colors of the bars in
your graph. You can change any of the color codes to change the color of a bar.
14.
Unlike a Graph report, a Data report does not graphically represent the measure data. Instead, the configured
details are presented in a tabular format in the report.
15.
If the Report Type is Data, clicking on the Run Report button will lead you to Figure 9.125.
16.
For each VM configured on the chosen vCenter components, the data report will display the percentage of time
403
Virtualization Reports
for which that VM was in a powered-on state during the stated timeline (Refer Figure 9.125). In addition, the
Last Powered On time of a VM is also revealed - this is nothing but the last time the eG agent checked the
status of the VM and found that it was powered-on. Using this information, you can determine whether the VM
was powered-on or off during the last measurement period. Also the measures such as Memory and Disk
Capacity can also be viewed per VM, thus enabling you to assess how removal of unused VMs will impact the
resource availability on the host.
Figure 9.125: Data report of the VMs in VDI environments
17.
18.
In case of VDI environments, the data report will additionally reveal the percentage of time for which each VM
was powered-on with an active user session; this way, you can quickly identify powered-on VMs that have been
idle for long time periods. Also, a Last User Access Time will be available for each VM, which will reveal the last
time a user had logged into that VM - this is nothing but the last time the eG agent checked the state of the VM
and found that it was powered on with a user session active on it.
Before emailing reports, ensure that the SMTP mail host and eG Admdinistrator ID
are properly configured in the eG administrative interface (using the Alerts -> Mail
Settings -> Server Settings option).
When reports are sent by email, the body of the email will contain the reports so
sent in HTML format. You can, if you so desire, send the report as an attachment
by setting the SendMailAsAttachment flag to Yes (or True). This flag is available in
the
[MISC_ARGS]
section
of
the
eg_services.ini
file
(in
the
{EG_INSTALL_DIR}\manager\config directory).
If the Background Save - PDF option is chosen from the Report Generation list, then clicking on the Run Report
button will not generate the report and display it in this page for your benefit. Instead, a message indicating
that the report is being processed in the background will appear. This will be accompanied by a link, which will
lead you to the page that lists all the reports that are being processed in the background, and their current
status. If background report generation fails for a report, you can regenerate that report using this page, or can
404
Virtualization Reports
even delete that report if need be. On the other hand, if background processing successfully completes for your
report, then, you can view a PDF of the report by clicking on the
icon in that page.
9.18 Cluster Capacity Planning Report
While planning the capacity of their virtual clusters, administrators often need to ascertain how many VMs are
operating on their critical clusters, assess how these VMs are using the CPU and memory resources allocated to
them, and determine whether sufficient resources are free in the cluster to support future operations. The findings
from such an analysis will provide pointers to how the cluster capacity can be enhanced - can the cluster
accommodate more VMs without requiring additional resources? or should the cluster be resized before adding more
VMs to it?
The Cluster Capacity Planning report automates this analysis and makes prudent sizing recommendations with the
help of which administrators can take accurate capacity decisions. On the basis of the historical CPU and memory
usage of the VMs allocated to the cluster, the report reveals deficits in cluster sizing (if any). Also, on the basis of the
free CPU and memory resources (if any) in the cluster, the report automatically computes how many more VMs the
cluster can handle. In the process, the report turns the spotlight on that resource (CPU or memory) which serves as
a serious constraint to expanding the VM capacity of the cluster.
To generate this report, do the following:
1.
Select the Capacity Planning option from the vCenter Reports node of the REPORTS BY FUNCTION tree.
2.
When Figure 9.126 appears, first select the Report Type. For a graphical report, choose the Graph option.
Figure 9.126: Generating a VM Capacity Planning report
3.
Then, select the VMware vCenter server for which the report is to be generated.
4.
From the list of Clusters managed by the chosen vCenter, select the cluster for which the report is to be
generated. For a report on all clusters, choose the All option.
5.
Then, specify the Timeline for the graph. You can either provide a fixed time line such as 1 hour, 2 days, etc.,
or select the Any option from the list to provide a From and To date/time for report generation.
405
Virtualization Reports
For every user registered with the eG Enterprise system, the administrator can indicate the
maximum timeline for which that user can generate a report. Once the maximum timeline is
set for a user, then, whenever that user logs into eG Reporter and attempts to generate a
report, the Timeline list box in the report page will display options according to the maximum
timeline setting of that user. For instance, if a user can generate a report for a maximum
period of 3 days only, then 3 days will be the highest option displayed in the Timeline list i.e., 3 days will be the last option in the fixed Timeline list. Similarly, if the user chooses the
Any option from the Timeline list and proceeds to provide a start date and end date for
report generation using the From and To specifications, eG Enterprise will first check if the
user's Timeline specification conforms to his/her maximum timeline setting. If not, report
generation will fail. For instance, for a user who is allowed to generate reports spanning over
a maximum period of 3 days only, the difference between the From and To dates should
never be over 3 days. If it is, then, upon clicking the Run Report button a message box will
appear, prompting the user to change the From and To specification.
6.
In addition to the settings discussed above, this report comes with a set of default specifications. These settings
are hidden by default. If you do not want to disturb these default settings, then you can proceed to generate
the report by clicking the Run Report button soon after you pick a Cluster. However, if you want to view and
then alter these settings (if required), click on the
button. The default settings will then appear in the MORE
OPTIONS drop don window (see Figure 9.127). The steps below discuss each of these settings and how they
can be customized.
Figure 9.127: The default settings for generating the Cluster Capacity Planning report
7.
If the timeline specified for the report needs to exclude the data collected during the Weekends, then set
Exclude weekends to Yes. If not, select No.
406
Virtualization Reports
By default, the weekend constitutes Saturday and Sunday. To override this default setting,
do the following:
Edit the eg_report.ini file in the <EG_INSTALL_DIR>\manager\config directory.
In the [VIRTUAL_CLUSTER] section of the file, the EXCLUDE_WEEKEND parameter is
set to Saturday,Sunday by default. You can modify this by setting the
EXCLUDE_WEEKEND parameter to a comma-separated list of other days of the week
- say Friday,Saturday.
Save the file after making the required changes.
8.
Next, indicate the report Time period.
9.
In large environments, reports generated using months of data can take a long time to complete.
Administrators now have the option of generating reports on-line or in the background. When a report is
scheduled for background generation, administrators can proceed with their other monitoring, diagnosis, and
reporting tasks, while the eG manager is processing the report. This saves the administrator valuable time. To
schedule background processing of a report, select the Background Save - PDF option from the Report
Generation list. In this case, a Report Name text box will appear, where you would have to provide the name
with which the report is to be saved in the background. To process reports in the foreground, select the
Foreground Generation - HTML option from this list.
10.
The Report Generation list will appear only if the EnableBackgroundReport flag in
the [BACKGROUND_PROCESS] section of the eg_report.ini file (in the
{EG_INSTALL_DIR}\manager\config directory) is set to Yes.
The default selection in the Report Generation list will change according to the
Timeline specified for the report. If the Timeline set is greater than or equal to the
number of days specified against the MinDurationForReport parameter in the
[BACKGROUND_PROCESS] section of the eg_report.ini file, then the default selection
in the Report Generation list will be Background. On the other hand, if the Timeline
set for the report is lesser than the value of the MinDurationForReport parameter,
then the default selection in the Report Generation list will be Foreground. This is
because, the MinDurationForReport setting governs when reports are to be
processed in the background. By default, this parameter is set to 2 weeks - this
indicates that by default, reports with a timeline of 2 weeks and above will be
processed in the background.
Finally, click the Run Report button. If the Report Type is Graph, then clicking the Run Report button will open
Figure 9.128.
407
Virtualization Reports
Figure 9.128: A Graphical VM Capacity Planning Report
11.
On the other hand, if the Report Type chosen is Data, then Figure 9.129 will appear when the Run Report
button is clicked.
Figure 9.129: A VM Capacity Planning Report of type Data
12.
From the reports of Figure 9.128 and Figure 9.129, you can instantly figure out how many VMs are operating
408
Virtualization Reports
on the chosen cluster, how many are powered-on currently, how the cluster utilized the CPU and memory
resources allocated to it during the given timeline, and how much CPU and memory is still available for use in
the cluster. In addition, the report automatically computes how many more VMs can be supported by the free
CPU resources on the cluster, and represents the same graphically. Likewise, it auto-computes the additional
VMs that the free memory resources of the cluster can handle, and represents the same graphically. The report
also clearly states its observations and its inferences at the bottom, and also indicates which resource is limiting
the cluster's VM capacity - is it CPU or memory?
9.19 Datacenters Report
A vCenter server typically manages individual ESX servers, clusters, resource pools, and VMs as Datacenters. A
datacenter is the primary container of inventory objects such as hosts and virtual machines. From the datacenter,
you can add and organize inventory objects.
The Datacenters report provides an overview of the performance of a chosen datacenter over time, besides allowing
users the flexibility to focus on the overall performance of the clusters, physical servers, VMs, and datastores
contained in a datacenter. From the report, administrators can understand the composition of the selected
datacenter, and also analyze the overall availability and resource-effectiveness of the elements (physical
servers/VMs/clusters/datastores) included in the datacenter.
To generate the report, do the following:
1.
Select Datacenters option from the Virtualization node of the REPORTS BY FUNCTION tree.
Figure 9.130: Selecting the criteria for the Datacenters report
2.
When Figure 9.130 appears, first, indicate the Report Type. For a graphical representation of cluster
performance, select the Graph option; for tabulated performance results, select the Data option. By default, the
Graph option is chosen.
3.
If the Report Type is Graph, you would have to select an option from the View by list to indicate the graph type
to be used for plotting performance data - select the Timeline option, so that the values reported by the chosen
Measure are plotted in time-of-day line graphs; select the Distribution option, so that the report represents
performance data in distribution pie charts and bar graphs. The default selection is Timeline.
4.
Next, specify which vCenter component the report is meant for - currently, reports can be generated for
VMware vCenter only. Therefore, this option is chosen by default in the Report for list.
5.
From the vCenter Server list, select the vCenter server for which the report is to be generated.
6.
All the datacenters managed by the chosen vCenter Server will be then available for selection in the Datacenters
list. Select the datacenter for which the report is to be generated.
7.
Next, from the Report by list, select the datacenter element for which the report is to be generated. If the
report is to focus on the performance of the datastores within the datacenter, select the Datastores option. If
the report should reveal how well the ESX servers included in the datacenter are performing, then, select the
Physical Servers option. To ensure that the report indicates the service levels achieved by the VMs executing on
409
Virtualization Reports
the ESX servers within the datacenter, select the Virtual Machines option. For cluster-related performance
information, select the Virtual Clusters option.
8.
Then, pick the Measure for which the report is to be generated. Note that the options in the Measure list will
change according to the Report by selection.
9.
Then, specify the Timeline for the graph. You can either provide a fixed time line such as 1 hour, 2 days, etc.,
or select the Any option from the list to provide a From and To date/time for report generation.
For every user registered with the eG Enterprise system, the administrator can indicate the
maximum timeline for which that user can generate a report. Once the maximum timeline is
set for a user, then, whenever that user logs into eG Reporter and attempts to generate a
report, the Timeline list box in the report page will display options according to the maximum
timeline setting of that user. For instance, if a user can generate a report for a maximum
period of 3 days only, then 3 days will be the highest option displayed in the Timeline list i.e., 3 days will be the last option in the fixed Timeline list. Similarly, if the user chooses the
Any option from the Timeline list and proceeds to provide a start date and end date for
report generation using the From and To specifications, eG Enterprise will first check if the
user's Timeline specification conforms to his/her maximum timeline setting. If not, report
generation will fail. For instance, for a user who is allowed to generate reports spanning over
a maximum period of 3 days only, the difference between the From and To dates should
never be over 3 days. If it is, then, upon clicking the Run Report button a message box will
appear, prompting the user to change the From and To specification.
10.
In addition to the settings discussed above, this report comes with a set of default specifications. These settings
are hidden by default. If you do not want to disturb these default settings, then you can proceed to generate
the report by clicking the Run Report button soon after you pick a Measure. However, if you want to view and
then alter these settings (if required), click on the
button. The default settings will then appear in the MORE
OPTIONS drop down window (see Figure 9.131). The steps below discuss each of these settings and how they
can be customized.
410
Virtualization Reports
Figure 9.131: The default settings for generating the Datacenters report
11.
The speed with which a report is generated depends primarily on the report Timeline. While a Timeline that
varies between a couple of days to a week enables the eG Enterprise system to quickly retrieve the required
data, timelines that span multiple weeks/months could slow-down the data retrieval and report generation
process to a considerable extent, owing to the volume of data involved. In order to ensure quick and easy
access to reports, eG Enterprise provides you the option of enabling data retrieval from the Trend information in
the database, instead of the Detailed test information that is used by default for report generation. The Detailed
test information based comprises of multiple measurement records for a test - one or more each for every test
execution. Whereas, the Trend information includes only hourly, daily, and monthly summary computations for
a test performed on a continuous basis. For instance, during a period of 1 hour, a test that runs every 5
minutes inserts atleast 12 records into the Detailed test information base. On the other hand, the Trend
information base would consist of only 1 record for the same 1 hour period. Fewer the number of records,
query execution becomes much quicker, and data retrieval faster. To use the trend data for report generation,
you will have to select the Trend option from the Show Data field in Figure 9.131. By default, the Detailed option
is selected in Figure 9.131 indicating that the report data is retrieved from the detailed test information in the
database. If need be, you can also ensure that all reports always use the Detailed test tables alone by hiding
the Show Data field from the reporter interface. To achieve this, do the following:
Login to the eG administrative interface as 'admin'.
Select the Manager option from the Settings tile that appears when the
clicked.
From the GENERAL SETTINGS page that then appears, if you set the Compute average/sum of metrics
while trending flag to No, then the Show Data field will not appear in the reporter interface; this denies
users access to the Trend option, and thus ensures that reports are always generated using the Detailed
tables.
411
button against the Admin tab is
Virtualization Reports
12.
A Trend report will not include the data for the current day since trend data is only
computed at the end of the day.
If the Trend option is chosen, the time period of the report should be greater than
1 day.
The usage of Detailed test tables for generating reports, especially those that span
weeks, increases the stress on the eG database, thus resulting in undue delays in
report generation. In order to ensure that the database is not choked by such
voluminous data requests, you can configure eG Enterprise to automatically "force"
the use of the Trend option if the Timeline of a report exceeds a pre-configured
duration. To specify this time boundary, do the following:
Edit the eg_report.ini file in the <EG_INSTALL_DIR>\manager\config directory.
In the [MISC] section of the file, you will find a DetailedTime parameter.
Specify the duration (in days) beyond which Detailed reports cannot be generated,
against the DetailedTime parameter, and save the eg_report.ini file.
For instance, to make sure that Detailed reports are disallowed for a Timeline of
over 2 weeks, set the DetailedTime parameter to 14 and save the file.
Say, subsequently, you attempt to generate a Detailed report for a Fixed Timeline
of 3 weeks (which is greater than the 14-day limit set in our example). The instant
you select the 3 weeks option from the Fixed list box, the Detailed option gets
automatically disabled, and the Trend option gets enabled. Similarly, if you specify
an Any Timeline that runs over 14 days, then, upon clicking the RUN REPORT
BUTTON to generate the report, a message box appears (see Figure 5.8) informing
you that only the Trend option is permitted.
To proceed with the Trend report generation, click the OK button in the message
box. To terminate Trend report generation, click the CANCEL button.
If the timeline specified for the report needs to exclude the data collected during the Weekends, then set
Exclude weekends to Yes. If not, select No.
412
Virtualization Reports
By default, the weekend constitutes Saturday and Sunday. To override this default setting,
do the following:
Edit the eg_report.ini file in the <EG_INSTALL_DIR>\manager\config directory.
In the [VIRTUAL_CENTER] section of the file, the EXCLUDE_WEEKEND parameter is
set to Saturday,Sunday by default. You can modify this by setting the
EXCLUDE_WEEKEND parameter to a comma-separated list of other days of the week
- say Friday,Saturday.
Save the file after making the required changes.
13.
Next, indicate the report Time period.
14.
You can further filter the resultset of your report picking one of the following options from the Filter by list:
TOP-N - Select this option and pick a TOP-N or a LAST-N option from the drop-down list adjacent to it to
ensure that the resulting graph only plots the values of the specified number of TOP / LAST players in the
chosen performance arena.
Range - Pick this option and provide a value range in the From and To text boxes that appear alongside.
Greaterthan - Pick this option and provide a value in the text box that appears alongside to view the details
of only those resource pools which have registered a value greater than the value specified in that box for
the chosen Measure.
Lessthan - Pick this option and provide a value in the text box that appears alongside to view the details of
only those resource pools which have registered a value lesser than the value specified in that box for the
chosen Measure.
15.
In large environments, reports generated using months of data can take a long time to complete.
Administrators now have the option of generating reports on-line or in the background. When a report is
scheduled for background generation, administrators can proceed with their other monitoring, diagnosis, and
reporting tasks, while the eG manager is processing the report. This saves the administrator valuable time. To
schedule background processing of a report, select the Background Save - PDF option from the Report
Generation list. In this case, a Report Name text box will appear, where you would have to provide the name
with which the report is to be saved in the background. To process reports in the foreground, select the
Foreground Generation - HTML option from this list.
413
Virtualization Reports
16.
The Report Generation list will appear only if the EnableBackgroundReport flag in
the [BACKGROUND_PROCESS] section of the eg_report.ini file (in the
{EG_INSTALL_DIR}\manager\config directory) is set to Yes.
The default selection in the Report Generation list will change according to the
Timeline specified for the report. If the Timeline set is greater than or equal to the
number of days specified against the MinDurationForReport parameter in the
[BACKGROUND_PROCESS] section of the eg_report.ini file, then the default selection
in the Report Generation list will be Background. On the other hand, if the Timeline
set for the report is lesser than the value of the MinDurationForReport parameter,
then the default selection in the Report Generation list will be Foreground. This is
because, the MinDurationForReport setting governs when reports are to be
processed in the background. By default, this parameter is set to 2 weeks - this
indicates that by default, reports with a timeline of 2 weeks and above will be
processed in the background.
If the Report Type is Graph, then, you can ensure that the resulting graphical report is not crowded with the
performance data pertaining to too many datacenter elements (depending upon the option chosen from the
Report by list) in the cluster. You can therefore restrict the number of elements to be represented in the graph
by selecting an option from the Filter by list. If the Top-N option is chosen, then you can select an option from
the adjacent list to indicate the number of top components in the chosen performance arena (i.e., Measure) for
which performance data needs to be plotted in the Graph report. If the Range option is chosen, then you would
have to indicate a value range using the From and To text boxes; the report will include only those elements in
the cluster for which the chosen Measure reports values in the specified range. If the Greater than option is
chosen from the Filter by list, then, in the adjacent text box, you will have to specify a valid number; in this
case, the report will include only those elements for which the chosen Measure has reported a value greater
than the specified number. Similarly, if the Less than option is chosen from the Filter by list, then, in the
adjacent text box, you will have to specify a valid number; in this case, the report will include only those
elements for which the chosen Measure has reported a value lesser than the specified number.
The Filter by list will include only the Top-N option if View by is set to Distribution. However,
for a Timeline report (i.e., if View by is set to Timeline), the Filter by list provides the Top-N,
Range, Greater than and Less than options.
17.
Finally, click the Run Report button.
18.
If the Report Type is Graph, the View by selection is Timeline, the Report by selection is Virtual Clusters, and the
Report Generation mode is Foreground Generation - HTML, then clicking the Run Report button will reveal Figure
9.132, using which you can compare the performance of the chosen Measure across the clusters configured
within the chosen datacenter during the specified Timeline; the time-of-day variations in the resource usage by
the clusters can thus be analyzed, the times when usage peaked can be detected, and resource-intensive
clusters can be accurately identified.
414
Virtualization Reports
Figure 9.132: A Timeline graph of a Datacenters report focusing on cluster performance
19.
If the Report Type is Graph, the View by selection is Timeline, the Report by selection is Physical servers, and
the Report Generation mode is Foreground Generation - HTML, then clicking the Run Report button will reveal
Figure 9.133, using which you can compare the performance of the chosen Measure across the ESX servers
included in the datacenter; the time-of-day variations in the resource usage by the ESX servers can thus be
analyzed, sudden spikes in usage and the time of occurrence can be isolated, and resource-intensive servers
can be accurately identified.
Figure 9.133: A Timeline graph of a Datacenters report focusing on Physical Server performance
20.
If the Report Type is Graph, the View by selection is Timeline, the Report by selection is Virtual Machines, and
the Report Generation mode is Foreground Generation - HTML, then clicking the Run Report button will reveal
Figure 9.134, using which you can compare the performance of the chosen Measure across the virtual machines
415
Virtualization Reports
executing on all ESX servers included in the datacenter; the time-of-day variations in the resource usage by the
VMs can be analyzed, sudden spikes in usage and the time of occurrence can be isolated, and resourceintensive VMs can be accurately identified.
Figure 9.134: A Timeline graph of a Datacenters report focusing on the performance of VMs
21.
If the Report Type is Graph, the View by selection is Timeline, the Report by selection is Datastores, and the
Report Generation mode is Foreground Generation - HTML, then clicking the RUN REPORT BUTTON will reveal
Figure 9.135, using which you can compare the performance of the chosen Measure across all datastores in the
datacenter; the time-of-day variations in the availability/space usage by the datastores can be analyzed, sudden
spikes in usage and the time of occurrence can be isolated, and datastores that are running out of space can be
accurately identified.
416
Virtualization Reports
Figure 9.135: A Timeline graph of a Datacenters report focusing on the performance of datastores
22.
On the other hand, if the Report Type is Graph, the View by selection is Distribution, the Report by selection is
Virtual Clusters, and the Report Generation mode is Foreground Generation - HTML, then clicking the RUN
REPORT BUTTON will reveal Figure 9.136. Figure 9.136 reveals a distribution pie chart that depicts the number of
clusters in the datacenter that are in different distribution ranges. The distribution ranges are obtained by
applying the first of the configured functions on the chosen Measure. For instance, assume that Physical Cpu
available to cluster is the chosen Measure. Say that you have configured to display the Avg and Max of this
measure in a Data report. Typically, both these configured values will appear only in the Data report. In the
case of a Graph report however, the first of the two functions - i.e., Avg of Physical Cpu available to cluster alone is calculated for every cluster in the chosen datacenter. The resulting pie chart enables administrators to
deduce, at a glance, the number of clusters where the chosen performance metric has fared well and/or badly.
Clicking on a particular slice in the pie chart lists the clusters that fall within the value range represented by that
slice (see Figure 9.137). Against every cluster, the actual values for each of the configured functions (both Avg
and Max, in our example) will be displayed. A vCenter-level Summary of the chosen Measure will also be
available.
417
Virtualization Reports
By default, the chart type for distribution is a pie chart. However, you can have a
bar graph depict the same data instead of a pie chart, by following the steps given
below:
Edit the eg_report.ini file in the <EG_INSTALL_DIR>\manager\config directory.
Change the value of the chartTypeForDist parameter in the [VIRTUAL_CENTER]
section of this file from the default Pie, to Bar.
Save the eg_report.ini file.
By default, the number of value ranges that need to be configured for the
distribution chart is 10. To override this default setting, do the following:
Edit the eg_report.ini file in the <EG_INSTALL_DIR>\manager\config directory.
Specify a number of your choice against the nofRangeForDist parameter in the
[VIRTUAL_CENTER] section of this file. By default, this parameter will hold the value
10.
Save the eg_report.ini file.
418
Virtualization Reports
Figure 9.136: A distribution graph in the Datacenters report focusing on cluster performance
Figure 9.137: The clusters that fall within the usage range clicked on
23.
Below the pie chart, you will find a bar chart that indicates the clusters that have topped/failed in a selected
performance realm (i.e., the Measure) during the specified Timeline. For example, for the Physical CPU available
to cluster measure, this bar chart reveals the clusters to which maximum physical CPU is available for use. Like
the pie chart, the values for the bar chart are also calculated by applying the first of the configured functions on
the chosen Measure.
419
Virtualization Reports
You can configure the colors to be used in the distribution chart and the Top <N> Components bar chart
in the zone report, by editing the eg_report.ini file in the <EG_INSTALL_DIR>\manager\config directory. The
[VIRTUAL_CLUSTER] section of the file defines the 20 default colors of the distribution and bar charts:
[VIRTUAL_CLUSTER]
ChartColor=#8399b0,#ffd95a,#a4ac91,#98d980,#d5b996,#f48848,#8b8cc2,
#eb4052,#c4b3d0,#b18651,#ebb7ce,#028768,#f5c372,#887c65,#e4c536,
#b5582c,#f94989,#770d72,#97a067,#89aeb7
distColor=#115fa6,#f25454,#60bd68,#b276b2,#81bef7,#a61120,#ffd13e,
#770d72,#887c65,#a4ac91
You override the default color settings of the distribution chart by modifying the color-codes specifying
against distColor. For changing the colors used by the Top <N> Components chart, alter the codes listed
against the ChartColor parameter.
The number of components to be displayed in the Top <N> Components bar chart is
configurable. To specify the number, select Top-N from the Filter by list in Figure 9.131, and
pick an option from the adjacent drop-down list.
24.
Similarly, if the Report Type is Graph, the View by selection is Distribution, the Report by selection is Physical
Servers, and the Report Generation mode is Foreground Generation - HTML, then, clicking the RUN REPORT
BUTTON will reveal Figure 9.138. Figure 9.138 reveals a distribution pie chart that depicts the number of ESX
servers in the datacenter that are in different distribution ranges. The distribution ranges are obtained by
applying the first of the configured functions on the chosen Measure. For instance, assume that Physical CPU
utilization is the chosen Measure. Say that you have configured to display the Avg and Max of this measure in a
Data report. Typically, both these configured values will appear only in the Data report. In the case of a Graph
report however, the first of the two functions - i.e., Avg of Physical CPU utilization - alone is calculated for every
ESX server in the chosen Datacenter. The resulting pie chart enables administrators to deduce, at a glance, the
number of ESX servers where the chosen performance metric has fared well and/or badly. Clicking on a
particular slice in the pie chart lists the ESX servers that fall within the value range represented by that slice
(see Figure 9.139). Against every ESX server, the actual values for each of the configured functions (both Avg
and Max, in our example) will be displayed. A vCenter-level Summary of the chosen Measure will also be
available.
420
Virtualization Reports
Figure 9.138: A distribution graph in the Datacenters report focusing on physical server performance
Figure 9.139: The physical servers that fall within the usage range clicked on
25.
Adjacent to the pie chart, you will find a bar chart that indicates the ESX servers that have topped/failed in a
selected performance realm (i.e., the Measure) during the specified Timeline. For example, for the Physical CPU
utilization measure, this bar chart reveals the ESX servers in the datacenter that have the maximum free
memory. Like the pie chart, the values for the bar chart are also calculated by applying the first of the
configured functions on the chosen Measure.
26.
Likewise, if the Report Type is Graph, the View by selection is Distribution, the Report by selection is Virtual
Machines, and the Report Generation mode is Foreground Generation - HTML, then clicking the Run Report
421
Virtualization Reports
button will reveal Figure 9.140. Figure 9.140 reveals a distribution pie chart that depicts the number of VMs in
the cluster that are in different distribution ranges. The distribution ranges are obtained by applying the first of
the configured functions on the chosen Measure. For instance, assume that Physical CPU utilization is the
chosen Measure. Say that you have configured to display the Avg and Max of this measure in a Data report.
Typically, both these configured values will appear only in the Data report. In the case of a Graph report
however, the first of the two functions - i.e., Avg of Physical CPU utilization - alone is calculated for every VM in
the chosen Cluster. The resulting pie chart enables administrators to deduce, at a glance, the number of VMs
where the chosen performance metric has fared well and/or badly. Clicking on a particular slice in the pie chart
lists the VMs that fall within the value range represented by that slice (see Figure 9.141). Against every VM
name, the actual values for each of the configured functions (both Avg and Max, in our example) will be
displayed. A vCenter-level Summary of the chosen Measure will also be available.
422
Virtualization Reports
Figure 9.140: A distribution graph in the Datacenters report focusing on virtual machine performance
423
Virtualization Reports
Figure 9.141: The virtual machines that fall within the usage range clicked on
27.
Adjacent to the pie chart, you will find a bar chart that indicates the VMs that have topped/failed in a selected
performance realm (i.e., the Measure) during the specified Timeline. For example, for the Physical CPU
utilization measure, this bar chart reveals the VMs in the datacenter that have consumed the physical CPU
excessively. Like the pie chart, the values for the bar chart are also calculated by applying the first of the
configured functions on the chosen Measure.
28.
If Data is chosen as the Report Type, then, the View by list will no longer appear. Instead, just proceed to select
the vCenter Server for which the report is to be generated and the Datacenter to which the report should
pertain. Finally, provide a Time period and Timeline for the report, set the Report Generation mode to
Foreground Generation - HTML, and click the Run Report button.
424
Virtualization Reports
Figure 9.142: The Datacenters Report of type Data
29.
For a particular datacenter, Figure 9.142 provides a Datacenter Report section that displays a default set of
metrics revealing the general composition of the datacenter. Below this section, a Cluster Details section exists,
that helps analyze user-configured metrics related to the resource usage of individual clusters in the datacenter.
Under this section is the Datastore Details section, using which the availability and space usage of each
datastore in the datacenter can be analyzed. In addition to providing an overview of datacenter health, these
sections also help identify the resource-intensive clusters and datastores in the datacenter, which might be
adversely impacting the performance of the datacenter as a whole.
30.
On the other hand, if the Background Save - PDF option is chosen from the Report Generation list, then clicking
on the RUN REPORT BUTTON will not generate the report and display it in this page for your benefit. Instead, a
message indicating that the report is being processed in the background will appear. This will be accompanied
by a link that will lead you to the page that lists all the reports that are being processed in the background, and
their current status. If background report generation fails for a report, you can regenerate that report using this
page, or can even delete that report if need be. On the other hand, if background processing successfully
completes for your report, then, you can view a PDF of the report by clicking on the
icon in that page.
As stated earlier, the Datacenter Details section of the Data report displays a default set of metrics; this default
setting cannot be modified - i.e., additional metrics cannot be added or existing metrics cannot be removed from this
section. However, the metrics displayed in the Cluster Details and Datastore Details section are configurable.
To add new metrics to the Cluster Details section, do the following:
1.
Edit the eg_report.ini file in the <EG_INSTALL_DIR>\manager\config directory.
425
Virtualization Reports
2.
In the [VIRTUAL_CENTER] section of the file, you will find entries of the following format for every measure that
appears by default in the Cluster Details section:
Virtual_center:Virtual_cluster:VCClusterTest:<InternalMeasureName>#<DisplayName>=<Comma-separated
list of functions>
To add a new measure, append an entry of the above format to the same section. For instance, if the Physical
CPU available to cluster measure is to be added to the Cluster Details section, then, your specification should
be:
Virtual_center:Virtual_cluster:VCClusterTest:Tot_phy_cpu_available#Physical CPU=Avg,Max
3.
Similarly, multiple measures can be added. To know the internal names of tests and measures, follow the steps
discussed in Page 212 of this document.
4.
Finally, save the file.
To add new metrics to the Datastore Details section, do the following:
1.
Edit the eg_report.ini file in the <EG_INSTALL_DIR>\manager\config directory.
2.
In the [VIRTUAL_CENTER] section of the file, you will find entries of the following format for every measure that
appears by default in the Datastore Details section:
Virtual_center:Data_store:VCDatastoreTest:<InternalMeasureName>#<DisplayName>=<Comma-separated list
of functions>
To add a new measure, append an entry of the above format to the same section. For instance, if the Percent
usage measure is to be added to the Datastore Details section, then, your specification should be:
Virtual_center:Data_store:VCDatastoreTest:Percent_usage#Percent spcac usage=Avg,Max
3.
Similarly, multiple measures can be added. To know the internal names of tests and measures, follow the steps
discussed in Page 212 of this document.
4.
Finally, save the file.
9.20 VMotion Report
VMware VMotion® technology, unique to VMware, leverages the complete virtualization of servers, storage and
networking to migrate an entire running virtual machine instantaneously from a failing/underperforming server to a
healthy one, to ensure high availability of the virtual machine.
In large, mission-critical virtualized environments with hundreds of hosts and VMs, the vCenter may migrate VMs
frequently and in large numbers, so as to avoid service outages and performance degradations. Administrators of
such environments might therefore find it difficult to manually track the movement of the virtual machines; as a
consequence, they might not be able to determine the type/status of the migration activities, or accurately identify
the current location of a VM. The absence of a specialized migration monitoring mechanism also renders these
administrators unable to isolate resource-hungry VMs and resource-deficient hosts in the target environment.
To address these concerns, eG Reporter allows the generation of a specialized VMotion Report. Using the
graphical/tabulated results provided by this report, administrators can perform the following:
Easily observe and effectively analyze the migration activity over time, and understand the types of
migration that were performed during the stated time;
Detect failed migrations, identify the user(s) responsible for the same, and diagnose the reasons for the
failure;
426
Virtualization Reports
Track the movement of specific VMs and accurately identify their current destination;
Instantly identify under-performing hosts and/or resource-intensive guests in the target environment, on
the basis of the migration activity;
In order to enable the administrator to accomplish the above, the VMotion Report page allows you to generate three
different types of reports, namely - the VMotion Summary & Top N (Graph), VMotion Summary & Top N (Data), and
VMotion Details report.
The sections that follow will discuss each of these report types in detail.
VMotion Summary & Top N (Graph) Report and VMotion Summary & Top
N (Data) Report
These two reports enable you to take stock of the extent, nature, and status of the migration activity across the
environment during a given period of time. While the VMotion Summary & Top N (Graph) report graphically
represents the migration details, the VMotion Summary & Top N (Data) report tabulates the same results.
Besides revealing the total number, type, and status of migrations that have taken place in the environment during
the given period, these reports help determine the following:
Which VM was migrated the maximum number of times?
What type of migration was most common in the environment during the designated period?
On which days was the migration activity very high?
From which ESX host/cluster were the maximum number of migrations performed?
To which ESX host/cluster were the maximum number of VMs migrated?
Which VM migration failed the maximum number of times?
From which ESX host/cluster were the maximum number of failed migrations attempted?
The migrations to which ESX host/cluster failed often?
By periodically reviewing these results, you can identify those VMs that were migrated often, and also those ESX
hosts/clusters from which VMs have been frequently moved out - since VM migration is typically driven by the
resource availability with a host and the resource usage by a VM, you can accurately isolate resource-intensive VMs
and unhealthy hosts/clusters with the help of this report.
To generate these reports, follow the steps given below:
1.
Select VMotion from the Virtualization node of the REPORTS BY FUNCTION tree in the eG Reporter.
Figure 9.143: Specifying the criteria for generating a VMotions Summary Report
427
Virtualization Reports
2.
When Figure 9.143 appears, first, indicate the Report Type. Set VMotion Summary & Top N (Graph) or VMotion
Summary & Top N (Data) as the Report type.
3.
Next, from the VMware vCenter list, select the vCenter server(s) for which the migration report is to be
generated. By default, all the managed vCenter servers in your environment will be listed here. This is because,
the default selection from the Analyze by list is Component. You can however narrow your search by opting to
view only those vCenter servers that are part of a service/segment/zone in the VMware vCenter list. For this,
select the Zone, Service, or Segment, option from the Analyze by field:
Selecting the Zone option will allow you to select the desired zone from the Zone list box. To include the
vCenter servers within a specific subzone also in the VMware vCenter list, set the Include subzone flag to
Yes.
In the same way, to make the vCenter servers that are part of a particular segment or service available for
selection in the VMware vCenter list, select Service or Segment from the Analyze By list box. Then, select
the desired service or segment from the Service or Segment list.
4.
If the VMware vCenter list consists of too many vCenter servers, then viewing all the components and selecting
the ones you need for report generation could require endless scrolling. To avoid this, you can click the
button next to the VMware vCenter list. The VMWARE VCENTER pop up window will then appear using which
you can view almost all the vCenter servers in a single interface and Select the ones for which the report is to
be generated.
5.
Then, specify the Timeline for the graph. You can either provide a fixed time line such as 1 hour, 2 days, etc.,
or select the Any option from the list to provide a From and To date/time for report generation. By default, 1
day will be selected from the Timeline list box.
For every user registered with the eG Enterprise system, the administrator can indicate the
maximum timeline for which that user can generate a report. Once the maximum timeline is
set for a user, then, whenever that user logs into eG Reporter and attempts to generate a
report, the Timeline list box in the report page will display options according to the maximum
timeline setting of that user. For instance, if a user can generate a report for a maximum
period of 3 days only, then 3 days will be the highest option displayed in the Timeline list i.e., 3 days will be the last option in the fixed Timeline list. Similarly, if the user chooses the
Any option from the Timeline list and proceeds to provide a start date and end date for
report generation using the From and To specifications, eG Enterprise will first check if the
user's Timeline specification conforms to his/her maximum timeline setting. If not, report
generation will fail. For instance, for a user who is allowed to generate reports spanning over
a maximum period of 3 days only, the difference between the From and To dates should
never be over 3 days. If it is, then, upon clicking the Run Report button a message box will
appear, prompting the user to change the From and To specification.
6.
In addition to the settings discussed above, this report comes with a set of default specifications. These settings
are hidden by default. If you do not want to disturb these default settings, then you can proceed to generate
the report by clicking the Run Report button soon after you pick one/more VMware vCenter servers. However, if
you want to view and then alter these settings (if required), click on the
icon. The default settings will then
appear in the MORE OPTIONS drop down window (see Figure 9.144). The steps below discuss each of these
settings and how they can be customized.
428
Virtualization Reports
Figure 9.144: The default settings for generating the VMotion report
7.
Next, indicate the report Time period. By default 00 Hr and 24 Min, 24 Hr and 00 Min will be selected in the
From and To fields.
8.
If the timeline specified for the report needs to exclude the data collected during the Weekends, then set
Exclude weekends to Yes. If not, select No.
By default, the weekend constitutes Saturday and Sunday. To override this
default setting, do the following:
Edit the eg_report.ini file in the <EG_INSTALL_DIR>\manager\config directory.
In the [VIRTUAL_CENTER] section of the file, the EXCLUDE_WEEKEND parameter is
set to Saturday,Sunday by default. You can modify this by setting the
EXCLUDE_WEEKEND parameter to a comma-separated list of other days of the week
- say Friday,Saturday.
Save the file after making the required changes.
9.
By default, this report provides a quick summary of the migrations related to all the VMs managed by the
chosen vCenter servers. Accordingly, the All option is chosen by default in the Virtual Machine list. To view a
report pertaining to a particular VM instead, select a specific VM from the Virtual Machine list.
10.
To view a report on migrations that were initiated by a specific user, select the user name from the User list
box. The default report however pertains to all users; accordingly, the All option is chosen by default from the
User list.
11.
If you want to view a report on VMs that were migrated from a particular ESX server, then select the server
from the ESX Source list. By default, this report provides the details of migrations from all ESX servers managed
by the chosen vCenter server. Accordingly, the All option is chosen by default from the ESX Source list.
12.
For a report on VMs that were moved to a particular ESX server, select the destination server from the ESX
Target list. By default however, this report focuses on VM migrations to all the ESX servers managed by the
429
Virtualization Reports
selected vCenter servers. Accordingly, the All option is chosen by default from the ESX Target list.
13.
If you want to view a report on VMs that were migrated from a particular cluster, then select the cluster from
the Cluster Source list. By default, this report provides the details of migrations from all clusters managed by
the chosen vCenter server. Accordingly, the All option is chosen by default from the Cluster Source list.
14.
For a report on VMs that were moved to a particular cluster, select the destination cluster from the Cluster
Target list. By default however, this report focuses on VM migrations to all the clusters managed by the selected
vCenter servers. Accordingly, the All option is chosen by default from the Cluster Target list.
15.
By default, this report provides a summary of all migrations that occurred in an environment, regardless of their
status. This explains why the default option chosen from the Status list is All. However, to view a report on the
migrations of a particular state, select Success or Failure from the Status list.
16.
Similarly, you can configure the report to provide the summary of migrations of a particular type, by selecting
one of the following types from the Migration Type list:
o
DRS: Refers to DRS-recommended migrations
o
Hot: Refers to powered-on virtual machines moved from one server to another
o
Manual: Refers to powered-off or suspended virtual machines moved from one server to another
By default however, this report provides migration summaries for all types of migrations; accordingly, the
All option is chosen by default from the Migration Type list.
17.
By default, every VMotion Summary report (be it Graph or Data) generated using this page includes a VMotion
Migration Summary Details section that provides an environment-wide overview of the migration activity during
the specified Timeline. You can however, optionally configure this report to include a few/more additional
summary sections that focus on a particular aspect of migration, namely - the VM, the source ESX host, the
target ESX host, the source cluster, and the target cluster. By choosing an option from the Summary list box,
you can indicate what additional summaries the report should include:
VM : If the All option is chosen from the Virtual Machine list and the Show Details flag is set to Yes, then,
selecting the VM option from the Summary list ensures that the report includes additional sections that
provide a VM-level migration summary - these sections indicate the VMs that have been migrated the
maximum number of times, and the VMs with the highest number of migration failures.
Source ESX : If the All option is chosen from the ESX Source list and the Show Details flag is set to Yes,
then, selecting the Source ESX option from the Summary list results in a report that includes additional
sections that provide a source-level migration summary - these sections indicate the ESX servers that have
been the source of the maximum number of successful migrations and failed migrations.
Target ESX : If the All option is chosen from the ESX Target list and the Show Details flag is set to Yes,
then, selecting the Source ESX option from the Summary list results in a report that includes additional
sections that provide a migration summary with a destination-focus - these sections indicate the target ESX
servers to which the highest number of VMs have been migrated and the target ESX servers with the
maximum failed migrations.
Source Cluster : If the All option is chosen from the Cluster Source list and the Show Details flag is set to
Yes, then, selecting the Source Cluster option from the Summary list results in a report that includes
additional sections that provide a cluster-level migration summary - these sections indicate the clusters that
have been the source of the maximum number of successful migrations and failed migrations.
Target Cluster : If the All option is chosen from the Cluster Target list and the Show Details flag is set to
Yes, then, selecting the Target Cluster option from the Summary list results in a report that includes
additional sections that indicate the target clusters to which the highest number of VMs have been
migrated and the target clusters with the maximum failed migrations.
430
Virtualization Reports
18.
All : By default, this option is chosen from the Summary list. In this case, if the Show Details flag is set to
Yes, then, the additional sections that the report embeds will provide all the above-mentioned information.
By default, this report only provides an environment-wide migration summary displaying the total number of
migrations that have occurred across all the chosen vCenter servers during the designated period, and the typewise break-up of migrations. Accordingly, the Show Details flag is set to No by default. If this flag is set to Yes
instead, then additional sections will be displayed according to the option chosen from the Summary list.
By default, this report provides all the filter options discussed in step 11 to step 20 above, so
that you an customize the summary report to suit your needs. If need be, you can hide the
filter options and thus make sure that the report displays a summary of all the migrations
that occurred in the environment during the specified Timeline. To achieve this, do the
following:
Edit the eg_report.ini file in the <EG_INSTALL_DIR>\manager\config directory.
In the VIRTUAL_CENTER_VMOTION section of the file, set the ShowFilters flag to
false. By default, this flag is set to true.
Finally, save the file.
Once this is done, all the filter options starting from the Virtual Machine list box to the
Summary list box will no longer appear in the report page. This implies that after specifying
the report Timeline, you will have to switch to step 20 of this procedure to proceed with the
report generation.
19.
To view the report for top N items or last N items alone, select the required option from the Show list box. For
instance, to view only the top-2 VMs that have registered the highest number of migrations during the stated
period, select the TOP-2 option from the Show list. By default, the TOP - 10 option will be selected.
20.
In large environments, reports generated using months of data can take a long time to complete.
Administrators now have the option of generating reports on-line or in the background. When a report is
scheduled for background generation, administrators can proceed with their other monitoring, diagnosis, and
reporting tasks, while the eG manager is processing the report. This saves the administrator valuable time. To
schedule background processing of a report, select the Background Save - PDF option from the Report
Generation list. In this case, a Report Name text box will appear, where you would have to provide the name
with which the report is to be saved in the background. To process reports in the foreground, select the
Foreground Generation - HTML option from this list.
431
Virtualization Reports
The Report Generation list will appear only if the EnableBackgroundReport flag in
the [BACKGROUND_PROCESS] section of the eg_report.ini file (in the
{EG_INSTALL_DIR}\manager\config directory) is set to Yes.
The default selection in the Report Generation list will change according to the
Timeline specified for the report. If the Timeline set is greater than or equal to the
number of days specified against the MinDurationForReport parameter in the
[BACKGROUND_PROCESS] section of the eg_report.ini file, then the default selection
in the Report Generation list will be Background. On the other hand, if the Timeline
set for the report is lesser than the value of the MinDurationForReport parameter,
then the default selection in the Report Generation list will be Foreground. This is
because, the MinDurationForReport setting governs when reports are to be
processed in the background. By default, this parameter is set to 2 weeks - this
indicates that by default, reports with a timeline of 2 weeks and above will be
processed in the background.
21.
Finally, click on the Run Report button.
22.
If the Report Type chosen is VMotion Summary & Top N (Graph) and the Show Details flag is set to No, then, the
resulting report (see Figure 9.145) will display a Virtual Machines Migration Summary, which enables you to
quickly receive a fair understanding of the volume of the migration activity in your environment during the
specified Timeline. The total migrations, the number of migrations per type, and the number of failed
migrations are available here.
432
Virtualization Reports
Figure 9.145: The default VMotion Summary & Top N (Graph) report
23.
Clicking on the Total migrations value in the Virtual Machines Migrations Summary table leads you to the
VMOTION DETAILS report that provides complete details of all the migrations that occurred in the environment
during the specified Timeline. Similarly, you can click on the number of DRS migrations, Hot migrations, Manual
migrations, or Failed migrations in the table to view the details of migrations of that type.
433
Virtualization Reports
Figure 9.146: A VMotions Details report that provides details of all migrations that occurred in the specified Timeline
24.
Below the Virtual Machines Migration Summary table of Figure 9.145, you will find a Virtual Machines Migration
Chart that enables you to figure out how many migrations occurred every day during the specified Timeline,
how many of them failed, and also the migration types. Using this chart, you can instantly identify those days
on which the migration activity peaked, and the exact day on which they failed.
25.
To view the complete details of the migrations of a particular type on a specific day, click on the corresponding
division in the bar chart of Figure 9.146. This will invoke Figure 9.147, where you can view more details about
that migration type.
Figure 9.147: The VMotion Details report that appears upon clicking a division in the bar chart
26.
On the other hand, if the Report Type for the summary report is set to VMotion Summary & Top N (Data) and the
Show Details flag is set to No, then, the resulting report will only display the Virtual Machines Migration
434
Virtualization Reports
Summary table.
Figure 9.148: The default VMotion Summary & Top N (Data) report
27.
Now, if the Show Details flag is set to Yes, and the VM option is chosen from the Summary list, then, the
VMotion Summary & Top N (Graph) report will additionally display 3 bar charts, and the VMotion Summary & Top
N (Data) report will display 3 additional tables. Each of these bar charts/tables will indicate the following:
The VMs with the highest number of migrations;
The VMs with the highest number of successful migrations;
The VMs with the highest number of failed migrations;
From this information, you can easily isolate resource-intensive VMs, and also instantly spot failed migration
attempts.
In case of the VMotion Summary & Top N (Graph) report, clicking on any division in any bar graph will allow you
to zoom into the details of the migrations of that type for that VM.
In case of the VMotion Summary & Top N (Data) report, clicking on any Virtual Machine name in the VM-related
sections will take you to a VMotion Details report that provides the complete details of all the times that VM was
migrated.
435
Virtualization Reports
Figure 9.149: The VMotion Summary Graph report if the VM option is chosen from the Summary list
436
Virtualization Reports
Figure 9.150: The VMotion Data Report if the VM option is chosen from the Summary list
28.
Similarly, if the Show Details flag is set to Yes, and the Source ESX option is chosen from the Summary list,
then, the VMotion Summary & Top N (Graph) report will additionally display 3 bar charts, and the VMotion
Summary & Top N (Data) report will display 3 additional tables. Each of these bar charts/tables will indicate the
following:
The ESX servers from which the highest number of migrations have been performed;
The ESX servers from which the highest number of successful migrations have been performed;
The ESX servers with the highest number of failed migrations;
From this information, you can easily isolate hosts that are experiencing a contention for resources.
In case of the VMotion Summary & Top N (Graph) report, clicking on any division in any bar graph will allow you
to zoom into the details of the migrations of that type for that ESX server.
In case of the VMotion Sumary & Top N (Data) report , clicking on a Host in the source-related tables will lead
you to a VMotion Details report pertaining to that host.
437
Virtualization Reports
Figure 9.151: The VMotion Summary Graph report if the Source ESX option is chosen from the Summary list
438
Virtualization Reports
Figure 9.152: The VMotion Data Report if the Source ESX option is chosen from the Summary list
29.
With the Show Details flag set to Yes, if you pick the Target ESX option from the Summary list, then, the
VMotion Summary & Top N (Graph) report will additionally display 3 bar charts, and the VMotion Summary & Top
N (Data) report will display 3 additional tables. Each of these bar charts/tables will indicate the following:
The ESX servers to which VMs have been migrated the maximum number of times;
The ESX servers to which the highest number of successful migrations have been performed;
The ESX servers to which the largest number of migrations failed;
Besides detecting failed migration attempts, this information enables you to identify ESX hosts that are healthy.
In case of the VMotion Summary & Top N (Graph) report, clicking on any division in any bar graph will allow you
to zoom into the details of the migrations of that type for that ESX server.
In case of the VMotion Summary & Top N (Data) report, clicking on any target Host in the target-related sections
will allow you to view the complete details of all the migrations for which that host was the target.
439
Virtualization Reports
Figure 9.153: The VMotion Summary Graph report if the Target ESX option is chosen from the Summary list
440
Virtualization Reports
Figure 9.154: The VMotion Data Report if the Target ESX option is chosen from the Summary list
30.
With the Show Details flag set to Yes, if you pick the Source Cluster option from the Summary list, then, the
VMotion Summary & Top N (Graph) report will additionally display 3 bar charts, and the VMotion Summary & Top
N (Data) report will display 3 additional tables. Each of these bar charts/tables will indicate the following:
The clusters from which VMs have been migrated the maximum number of times;
The clusters from which the highest number of successful migrations have been performed;
The clusters to which the largest number of migrations failed;
Besides detecting failed migration attempts, this information enables you to identify unhealthy clusters.
In case of the VMotion Summary & Top N (Graph) report, clicking on any division in any bar graph will allow you
to zoom into the details of the migrations of that type for that cluster.
In case of the VMotion Summary & Top N (Data) report, clicking on a Source Cluster in the source-related
sections will enable you to view a VMotion Details report pertaining to that cluster.
441
Virtualization Reports
Figure 9.155: The VMotion Summary Graph report if the Source Cluster option is chosen from the Summary list
442
Virtualization Reports
Figure 9.156: The VMotion Data Report if the Source Cluster option is chosen from the Summary list
31.
If you select the Target Cluster option from the Summary list, and set the Show Details flag to Yes, then, the
VMotion Summary & Top N (Graph) report will additionally display 3 bar charts, and the VMotion Summary & Top
N (Data) report will display 3 additional tables. Each of these bar charts/tables will indicate the following:
The clusters to which VMs have been migrated the maximum number of times;
The clusters to which the highest number of successful migrations have been performed;
The clusters to which the largest number of migrations failed;
Besides detecting failed migration attempts, this information enables you to identify clusters that are healthy.
In case of the VMotion Summary & Top N (Graph) report, clicking on any division in any bar graph will allow you
to zoom into the details of the migrations of that type for that cluster.
443
Virtualization Reports
In case of the VMotion Summary & Top N (Data) report, clicking on any a target Cluster in the target-related
sections will allow you to view the VMotion Details report revealing the details of all migrations made to that
cluster.
Figure 9.157: The VMotion Summary Graph report if the Target ESX option is chosen from the Summary list
444
Virtualization Reports
Figure 9.158: The VMotion Data Report if the Target ESX option is chosen from the Summary list
VMotion Details Report
In addition to providing a macro view of the migration activity performed by chosen vCenter servers,
the VMotion Details report provides detailed information pertaining to every migration, thus shedding light on the
following:
Which ESX servers and/or clusters has a VM ‘visited’ during the given period?
When did every migration occur?
Where is the VM currently located?
Which migration attempt failed and why?
To generate this report, do the following:
1.
Select VMotion from the Virtualization node of the REPORTS BY FUNCTION tree in the eG Reporter.
445
Virtualization Reports
Figure 9.159: Generating the VMotion Details report
2.
When Figure 9.159 page appears, first, indicate the Report Type. Set VMotion Details as the Report Type.
3.
Next, from the VMware vCenter list, select the vCenter server(s) for which the migration report is to be
generated. By default, all the managed vCenter servers in your environment will be listed here. This is because,
the default selection from the Analyze by list is Component. You can however narrow your search by opting to
view only those vCenter servers that are part of a service/segment/zone in the VMware vCenter list. For this,
select the Zone, Service, or Segment, option from the Analyze by field:
Selecting the Zone option will allow you to select the desired zone from the Zone list box. To include the
vCenter servers within a specific subzone also in the VMware vCenter list, set the Include subzone flag to
Yes.
In the same way, to make the vCenter servers that are part of a particular segment or service available for
selection in the VMware vCenter list, select Service or Segment from the Analysis By list box. Then, select
the desired service or segment from the Service or Segment list.
4.
If the VMware vCenter list consists of too many vCenter servers, then viewing all the components and selecting
the ones you need for report generation could require endless scrolling. To avoid this, you can click the
button next to the VMware vCenter list. The VMWARE VCENTER pop up window will then appear using which
you can view almost all the vCenter servers in a single interface and select the ones for which the report is to
be generated.
5.
Then, specify the Timeline for the graph. You can either provide a fixed time line such as 1 hour, 2 days, etc.,
or select the Any option from the list to provide a From and To date/time for report generation. By default, 1
day will be selected from the Timeline list box.
446
Virtualization Reports
For every user registered with the eG Enterprise system, the administrator can indicate the
maximum timeline for which that user can generate a report. Once the maximum timeline is
set for a user, then, whenever that user logs into eG Reporter and attempts to generate a
report, the Timeline list box in the report page will display options according to the maximum
timeline setting of that user. For instance, if a user can generate a report for a maximum
period of 3 days only, then 3 days will be the highest option displayed in the Timeline list i.e., 3 days will be the last option in the fixed Timeline list. Similarly, if the user chooses the
Any option from the Timeline list and proceeds to provide a start date and end date for
report generation using the From and To specifications, eG Enterprise will first check if the
user's Timeline specification conforms to his/her maximum timeline setting. If not, report
generation will fail. For instance, for a user who is allowed to generate reports spanning over
a maximum period of 3 days only, the difference between the From and To dates should
never be over 3 days. If it is, then, upon clicking the Run Report button a message box will
appear, prompting the user to change the From and To specification.
6.
In addition to the settings discussed above, this report comes with a set of default specifications. These settings
are hidden by default. If you do not want to disturb these default settings, then you can proceed to generate
the report by clicking the Run Report button soon after you pick one/more VMware vCenter servers. However, if
you want to view and then alter these settings (if required), click on the
button. The default settings will
then appear in the MORE OPTIONS drop down window (see Figure 9.160). The steps below discuss each of
these settings and how they can be customized.
Figure 9.160: The default settings for generating the VMotion Details report
7.
Next, indicate the report Time period. By default 00 Hr and 24 Min, 24 Hr and 00 Min will be selected in the
From and To fields.
8.
If the timeline specified for the report needs to exclude the data collected during the Weekends, then set
Exclude weekends to Yes. If not, select No.
447
Virtualization Reports
By default, the weekend constitutes Saturday and Sunday. To override this default setting,
do the following:
Edit the eg_report.ini file in the <EG_INSTALL_DIR>\manager\config directory.
In the [VIRTUAL_CENTER] section of the file, the EXCLUDE_WEEKEND parameter is
set to Saturday,Sunday by default. You can modify this by setting the
EXCLUDE_WEEKEND parameter to a comma-separated list of other days of the week
- say Friday,Saturday.
Save the file after making the required changes.
9.
By default, this report provides details of the migrations related to all the VMs managed by the chosen vCenter
servers. Accordingly, the All option is chosen by default in the Virtual Machine list. To view a report pertaining to
a particular VM instead, select a specific VM from the Virtual Machine list.
10.
To view a report on migrations that were initiated by a pecific user, select the user name from the User list box.
The default report however pertains to all users; accordingly, the All option is chosen by default from the User
list.
11.
If you want to view a report on VMs that were migrated from a particular ESX server, then select the server
from the ESX Source list. By default, this report provides the details of migrations from all ESX servers managed
by the chosen vCenter server. Accordingly, the All option is chosen by default from the ESX Source list.
12.
For a report on VMs that were moved to a particular ESX server, select the destination server from the ESX
Target list. By default however, this report focuses on VM migrations to all the ESX servers managed by the
selected vCenter servers. Accordingly, the All option is chosen by default from the ESX Target list.
13.
If you want to view a report on VMs that were migrated from a particular cluster, then select the cluster from
the Cluster Source list. By default, this report provides the details of migrations from all clusters managed by
the chosen vCenter server. Accordingly, the All option is chosen by default from the Cluster Source list.
14.
For a report on VMs that were moved to a particular cluster, select the destination cluster from the Cluster
Target list. By default however, this report focuses on VM migrations to all the clusters managed by the selected
vCenter servers. Accordingly, the All option is chosen by default from the Cluster Target list.
15.
By default, this report provides a summary of all migrations that occurred in an environment, regardless of their
status. This explains why the default option chosen from the Status list is All. However, to view a report on the
migrations of a particular state, select Success or Failure from the Status list.
16.
Similarly, you can configure the report to provide the details of migrations of a particular type, by selecting one
of the following types from the Migration Type list:
DRS: Refers to DRS-recommended migrations
Hot: Refers to powered-on virtual machines moved from one server to another
Manual: Refers to powered-off or suspended virtual machines moved from one server to another
By default however, this report provides details of all types of migrations; accordingly, the All option is chosen
by default from the Migration Type list.
17.
By default, this report displays only 10 records per page. To view a more or a less number of records in every
page, select a different number from the Records Per Page list box.
448
Virtualization Reports
18.
By default, this report is sorted in the descending order of the date and time at which each migration occurred.
Accordingly, the Event Time option is chosen by default from the Sort By list. To change the sort order, pick a
different option from the Sort By list.
19.
By default, this report displays only the details of the top-10 migrations, based on the chosen sort order.
Accordingly, the Show list is set to TOP-10 by default. To change the ‘N’ in ‘Top-N’ or ‘Last-N’, pick a different
‘Top’ or ‘Last’ option from the Show list.
20.
For instance, if the Show option is TOP-10 and the Sort By option is Event Time, then this report will display only
the top-10 most recent migration events. Similarly, if the Show option is TOP-10 and the Sort By option chosen
is Virtual Center, Virtual Machine, VM Source, VM Target, Cluster Source, or Cluster Target, then, the report first
sorts the migration records in the alphabetical order of the Virtual Center names, VM names, ESX server names,
or cluster names (as the case may be), and then displays only the top-10 records of the sorted list.
21.
On the other hand, if the Show list is set to TOP-10 and the Sort By option chosen is Success, then the report
first arranges all successful migration events in the ascending order of their migration types (DRS, Hot,
Manual), and then displays only the top-10 records of the sorted list. Likewise, if the Sort By option chosen is
Failure, then the report first arranges all the failed migration events in the descending order of their migration
types (Manual, Hot, DRS), and then, displays only the top-10 records of this list.
22.
In large environments, reports generated using months of data can take a long time to complete.
Administrators now have the option of generating reports on-line or in the background. When a report is
scheduled for background generation, administrators can proceed with their other monitoring, diagnosis, and
reporting tasks, while the eG manager is processing the report. This saves the administrator valuable time. To
schedule background processing of a report, select the Background Save - PDF option from the Report
Generation list. In this case, a Report Name text box will appear, where you would have to provide the name
with which the report is to be saved in the background. To process reports in the foreground, select the
Foreground Generation - HTML option from this list.
The Report Generation list will appear only if the EnableBackgroundReport flag in
the [BACKGROUND_PROCESS] section of the eg_report.ini file (in the
{EG_INSTALL_DIR}\manager\config directory) is set to Yes.
The default selection in the Report Generation list will change according to the
Timeline specified for the report. If the Timeline set is greater than or equal to the
number of days specified against the MinDurationForReport parameter in the
[BACKGROUND_PROCESS] section of the eg_report.ini file, then the default selection
in the Report Generation list will be Background. On the other hand, if the Timeline
set for the report is lesser than the value of the MinDurationForReport parameter,
then the default selection in the Report Generation list will be Foreground. This is
because, the MinDurationForReport setting governs when reports are to be
processed in the background. By default, this parameter is set to 2 weeks - this
indicates that by default, reports with a timeline of 2 weeks and above will be
processed in the background.
23.
Finally, click on the Run Report button.
24.
If the Report Generation mode is Foreground Generation - HTML, then, clicking the Run Report button will
display a Virtual Machine Migration Summary that provides an overview of the migration activity that occurred
449
Virtualization Reports
during the specified Timeline. Below this table you will find a Virtual Machines Migration Details section that
provides elaborate details of every VM migration that took place in the environment during the given period.
These details include the following:
The Virtual Center that manages the VM that was migrated;
The Event Time - i.e., the date and time at which the migration event took place;
The Virtual Machine that was migrated;
The Source ESX server from which the VM was migrated;
The Target ESX server to which the VM was moved;
The User who initiated the migration;
The Datacenter involved in the migration;
The Source Cluster from which the VM was migrated;
The Target Cluster to which the VM was migrated;
Whether the migration was a Success or not - displays Y if the migration was successful, and N if it failed;
The Migration Type - D for DRS migrations, H for Hot migrations, and M for Manual migrations;
A brief Description of the status of the migration activity - in case of a failed migration, this Description will
indicate the reasons for the failure;
450
Virtualization Reports
Figure 9.161: The VMotion Details report
25.
On the other hand, if the Background Save - PDF option is chosen from the Report Generation list, then clicking
on the RUN REPORT BUTTON will not generate the report and display it in this page for your benefit. Instead, a
message indicating that the report is being processed in the background will appear. This will be accompanied
by a link that will lead you to the page that lists all the reports that are being processed in the background, and
their current status. If background report generation fails for a report, you can regenerate that report using this
page, or can even delete that report if need be. On the other hand, if background processing successfully
completes for your report, then, you can view a PDF of the report by clicking on the
icon in that page.
9.21 Datastores Report
One of the key challenges faced by administrators of virtualized environments is making sure that the datastores do
not run out of space at any point in time. This is because, if a datastore experiences a severe space crunch, the VMs
associated with that datastore may fail to operate, and this would render the VMs inaccessible to users.
To provide these administrators with historical insights into datastore usage so that they can capture potential space
contentions, remove them, and ensure that business is transacted as usual in the virtualized environment at all
times, eG Reporter offers Datastore Reports. This report category provides two types of reports - the Datastore
451
Virtualization Reports
Overview report and the Datastore VM Details report. The sections that follow will discuss both these reports in
details.
Datastore Overview Report
Using this report, the following can be ascertained:
Are any datastores running out of space? If so, which ones are they?
Which VMs will be impacted by a space crunch in the datastore?
To generate this report, do the following:
1.
Select the Datastore Overview option by following the menu sequence: REPORTS BY FUNCTION ->
Virtualization -> Datastores.
Figure 9.162: Generating the Datastore Overview report
2.
When Figure 9.162 appears, first, indicate the Report Type. For a graphical representation of datastore
performance, select the Graph option; for tabulated performance results, select the Data option. By default, the
Graph option is chosen.
3.
Next, select the component type for which the report should be generated from the Component Type list box.
To view the report for all the component types, select the All ComponentTypes option from the Component
Type list box. The All ComponentTypes option will be available if Data option is chosen from the Report Type.
4.
Using this report, you can engage in a time-based performance analysis of those datastores that are used by
specific ESX servers, the datastores that are managed by one/more vCenter servers, or those datastores that
are associated with all the ESX servers/vCenter servers within a particular zone/segment/service. Indicate your
choice by picking the one of the following options from the Analyze by list.
Component: If the Component option is chosen from the Analyze by list, then all components of the chosen
Component Type will be listed in the Component list box. From this list box, select the components for
which the report is to be generated. If the Component list consists of too many components, then viewing
all the components and selecting the ones you need for report generation could require endless scrolling.
To avoid this, you can click the
button next to the Component list. The COMPONENTS pop up window
will then appear using which you can view almost all the components in a single interface and select the
ones for which the report is to be generated.
Zone: If the Zone option is chosen from the Analysis by list, then you would be required to select the Zone
for which the report is to be generated. In addition, you will also have to indicate whether the report needs
to include even those datastores that are associated with the ESX servers/vCenter servers that are included
in the sub-zones of the chosen zone. If this is the case, you will have to set the Include sub-zones flag to
Yes.
Service: Select this option if the components for which a report is to be generated are involved in the
delivery of a business service. Then, select a Service.
452
Virtualization Reports
5.
Segment: Choose this option if the virtual hosts to be evaluated are part of a segment. Then, pick a
Segment for analysis.
The speed with which a report is generated depends primarily on the report Timeline. While a Timeline that
varies between a couple of days to a week enables the eG Enterprise system to quickly retrieve the required
data, timelines that span multiple weeks/months could slow-down the data retrieval and report generation
process to a considerable extent, owing to the volume of data involved. In order to ensure quick and easy
access to reports, eG Enterprise provides you the option of enabling data retrieval from the Trend information in
the database, instead of the Detailed test information that is used by default for report generation. The Detailed
test information based comprises of multiple measurement records for a test - one or more each for every test
execution. Whereas, the Trend information includes only hourly, daily, and monthly summary computations for
a test performed on a continuous basis. For instance, during a period of 1 hour, a test that runs every 5
minutes inserts atleast 12 records into the Detailed test information base. On the other hand, the Trend
information base would consist of only 1 record for the same 1 hour period. Fewer the number of records,
query execution becomes much quicker, and data retrieval faster. To use the trend data for report generation,
you will have to select the Trend option from the Show Data field in Figure 9.162. By default, the Detailed option
is selected in Figure 9.162 indicating that the report data is retrieved from the detailed test information in the
database. If need be, you can also ensure that all reports always use the Detailed test tables alone by hiding
the Show Data field from the reporter interface. To achieve this, do the following:
Login to the eG administrative interface as 'admin'.
Select the Manager option from the Settings tile that appears when the
clicked.
From the GENERAL SETTINGS page that then appears, if you set the Compute average/sum of metrics
while trending flag to No, then the Show Data field will not appear in the reporter interface; this denies
users access to the Trend option, and thus ensures that reports are always generated using the Detailed
tables.
453
button against the Admin tab is
Virtualization Reports
A Trend report will not include the data for the current day since trend data is only
computed at the end of the day.
If the Trend option is chosen, the time period of the report should be greater than
1 day.
The usage of Detailed test tables for generating reports, especially those that span
weeks, increases the stress on the eG database, thus resulting in undue delays in
report generation. In order to ensure that the database is not choked by such
voluminous data requests, you can configure eG Enterprise to automatically "force"
the use of the Trend option if the Timeline of a report exceeds a pre-configured
duration. To specify this time boundary, do the following:
Edit the eg_report.ini file in the <EG_INSTALL_DIR>\manager\config directory.
In the [MISC] section of the file, you will find a DetailedTime parameter.
Specify the duration (in days) beyond which Detailed reports cannot be generated,
against the DetailedTime parameter, and save the eg_report.ini file.
For instance, to make sure that Detailed reports are disallowed for a Timeline of
over 2 weeks, set the DetailedTime parameter to 14 and save the file.
Say, subsequently, you attempt to generate a Detailed report for a Fixed Timeline
of 3 weeks (which is greater than the 14-day limit set in our example). The instant
you select the 3 weeks option from the Fixed list box, the Detailed option gets
automatically disabled, and the Trend option gets enabled. Similarly, if you specify
an Any Timeline that runs over 14 days, then, upon clicking the RUN REPORT
BUTTON to generate the report, a message box appears (see Figure 5.8) informing
you that only the Trend option is permitted.
To proceed with the Trend report generation, click the OK button in the message
box. To terminate Trend report generation, click the CANCEL button.
6.
Next, pick the Measure for which the Graph report is to be generated.
7.
Then, specify the Timeline for the graph. You can either provide a fixed time line such as 1 hour, 2 days, etc.,
or select the Any option from the list to provide a From and To date/time for report generation.
454
Virtualization Reports
For every user registered with the eG Enterprise system, the administrator can indicate the
maximum timeline for which that user can generate a report. Once the maximum timeline is
set for a user, then, whenever that user logs into eG Reporter and attempts to generate a
report, the Timeline list box in the report page will display options according to the maximum
timeline setting of that user. For instance, if a user can generate a report for a maximum
period of 3 days only, then 3 days will be the highest option displayed in the Timeline list i.e., 3 days will be the last option in the fixed Timeline list. Similarly, if the user chooses the
Any option from the Timeline list and proceeds to provide a start date and end date for
report generation using the From and To specifications, eG Enterprise will first check if the
user's Timeline specification conforms to his/her maximum timeline setting. If not, report
generation will fail. For instance, for a user who is allowed to generate reports spanning over
a maximum period of 3 days only, the difference between the From and To dates should
never be over 3 days. If it is, then, upon clicking the Run Report button a message box will
appear, prompting the user to change the From and To specification.
8.
In addition to the settings discussed above, this report comes with a set of default specifications. These settings
are hidden by default. If you do not want to disturb these default settings, then you can proceed to generate
the report by clicking the Run Report button soon after you pick a Component. However, if you want to view
and then alter these settings (if required), click on the
button. The default settings will then appear in the
MORE OPTIONS drop down window (see Figure 9.164). The steps below discuss each of these settings and how
they can be customized.
Figure 9.163: The default settings for generating the Datastore Overview report
9.
If the timeline specified for the report needs to exclude the data collected during the Weekends, then set
Exclude weekends to Yes. If not, select No.
455
Virtualization Reports
By default, the weekend constitutes Saturday and Sunday. To override this default setting,
do the following:
Edit the eg_report.ini file in the <EG_INSTALL_DIR>\manager\config directory.
In the [VIRTUAL_DATASTORE] section of the file, the EXCLUDE_WEEKEND parameter
is set to Saturday,Sunday by default. You can modify this by setting the
EXCLUDE_WEEKEND parameter to a comma-separated list of other days of the week
- say Friday,Saturday.
Save the file after making the required changes.
10.
By default, the Graph report computes the Avg value of the chosen Measure, and graphically represents the
TOP-N datastores with a high Avg value. Accordingly, the Avg option is chosen by default from the Show list,
and a TOP-N option is chosen by default from the Limit list. To arrange datastores based on the Current values
reported for the chosen measure, pick Current as the option from the Show list.
11.
Next, indicate the report Time period.
12.
In large environments, reports generated using months of data can take a long time to complete.
Administrators now have the option of generating reports on-line or in the background. When a report is
scheduled for background generation, administrators can proceed with their other monitoring, diagnosis, and
reporting tasks, while the eG manager is processing the report. This saves the administrator valuable time. To
schedule background processing of a report, select the Background Save - PDF option from the Report
Generation list. In this case, a Report Name text box will appear, where you would have to provide the name
with which the report is to be saved in the background. To process reports in the foreground, select the
Foreground Generation - HTML option from this list.
13.
The Report Generation list will appear only if the EnableBackgroundReport flag in
the [BACKGROUND_PROCESS] section of the eg_report.ini file (in the
{EG_INSTALL_DIR}\manager\config directory) is set to Yes.
The default selection in the Report Generation list will change according to the
Timeline specified for the report. If the Timeline set is greater than or equal to the
number of days specified against the MinDurationForReport parameter in the
[BACKGROUND_PROCESS] section of the eg_report.ini file, then the default selection
in the Report Generation list will be Background. On the other hand, if the Timeline
set for the report is lesser than the value of the MinDurationForReport parameter,
then the default selection in the Report Generation list will be Foreground. This is
because, the MinDurationForReport setting governs when reports are to be
processed in the background. By default, this parameter is set to 2 weeks - this
indicates that by default, reports with a timeline of 2 weeks and above will be
processed in the background.
Finally, click the Run Report button.
456
Virtualization Reports
14.
If the Report Type is Graph and the Report Generation mode is Foreground Generation - HTML, then, clicking on
the Run Report button will reveal Figure 9.164.
Figure 9.164: A Graphical DataStore Overview Report
15.
Figure 9.164 comprises of the following:
A distribution pie chart that depicts the number of datastores associated with the chosen component-type
that are in different distribution ranges. The distribution ranges are obtained by applying the first of the
configured functions on the chosen Measure. For instance, assume that Physical disk space usage is the
chosen Measure. Say that you have configured to display the Avg and Max of this measure in a Data
report. Typically, both these configured values will appear only in the Data report. In the case of a Graph
report however, the first of the two functions - i.e., Avg of Physical disk space usage - alone is calculated
for every datastore mapped to the chosen component-type. The resulting pie chart enables administrators
to deduce, at a glance, the number of datastores where the chosen performance metric has fared well
and/or badly. Clicking on a particular slice in the pie chart lists the datastores that fall within the value
range represented by that slice (see Figure 9.165). Against every datastore, the actual values for each of
the configured functions (both Avg and Max, in our example) will be displayed. A vCenter-level Summary of
the chosen Measure will also be available.
457
Virtualization Reports
Figure 9.165: The physical servers that fall within the usage range clicked on
16.
Adjacent to the pie chart, you will find a bar chart that indicates the datastores that have topped/failed in a
selected performance realm (i.e., the Measure) during the specified Timeline. For example, for the Physical
disk space usage measure, this bar chart reveals the datastores that are using the maximum disk space.
Unlike the pie chart, the bar chart plots the Avg values of the chosen measure over a period of time, or the
Current values of the measure, based on the option chosen from the Show list; the number of datastores
displayed in the bar chart also depends upon the TOP-N or LAST-N option chosen from the Limit list.
If the Report Type is Data, then the resulting report will include a table listing all the datastores that were used
during the specified Timeline, the number of VMs using each datastore, followed by a wide range of preconfigured and user-configured metrics revealing how effectively each datastore was utilized during the given
period. If multiple functions (e.g., Avg, Current, Percent, etc.) have been configured to be applied on a
measure, then the report will include a column for every configured function. With the help of this data, you
can accurately identify datastores that were down during the stated period, datastores that ran / were running
out of space, and the vCenters/ESX servers/VMs that were affected by such anomalies. You can zoom into the
performance of a particular component by clicking on the corresponding link in the report - this will invoke a
Server Report of that component, which reveals the overall health of the component. In addition, the
Datastorage Report embeds a Percent change column, which indicates whether the overall datastore usage was
optimal or erratic during the designated period. Sudden and significant spikes in datastore usage could cause
the Percent change to increase.
Figure 9.166: The Data report for Data Storage
458
Virtualization Reports
Figure 9.167: Clicking on a 'Server' in the Data Storage Report
17.
On the other hand, if the Background Save - PDF option is chosen from the Report Generation list, then clicking
on the RUN REPORT BUTTON will not generate the report and display it in this page for your benefit. Instead, a
message indicating that the report is being processed in the background will appear. This will be accompanied
by a link that will lead you to the page that lists all the reports that are being processed in the background, and
their current status. If background report generation fails for a report, you can regenerate that report using this
page, or can even delete that report if need be. On the other hand, if background processing successfully
completes for your report, then, you can view a PDF of the report by clicking on the
icon in that page.
A default set of measures are pre-configured for the Overview report in the [VIRTUAL_DATASTORE] section of
the eg_report.ini file (in the <eg_install_dir>\manager\config directory); these default measures are Server,
Datastore, Datastore availability, Total capacity, Used space, Free space, Percent usage, Percent Change. You
can, if you so desire, add more default measures to the [VIRTUAL_DATASTORE] section in the format:
Default:<InternalTest>:<InternalMeasure>#<DisplayName>=<Comma-separated list of functions>.
DataStores VM Details Report
In a virtualized environment, a VM's operations may stall due to the unavailability, high latency, or abnormal usage of
the datastore/virtual disks assigned to that VM. Since a datastore and/or a virtual disk can be shared by multiple VMs
on a host, whenever users complaint of slowdowns while accessing their virtual applications, it would help to know
which datastore/virtual disk has been assigned to the VMs running those virtual applications and how the
datastore/virtual disk has been utilized by each VM. This knowledge will enable you to isolate over-utilized storage
(i.e., datastore and virtual disks), the VMs responsible for their excessive usage, and the VMs affected by the same.
The Datastores Details report provides you with this information.
Upon selection of one/all VMs on a virtual host, this report indicates which virtual disk and datastore has been
459
Virtualization Reports
assigned to the VMs, and how the VMs utilized the virtual disk and the datastore in the given timeline. This enables
administrators to do the following:
Quickly point to over-utilized or slow storage;
Identify the VMs on a host that are using the storage excessively;
Understand how this excessive usage impacts the performance of other VMs on the host that are sharing
the same storage
To generate this report, do the following:
1.
Select the DataStores VM Details option by following the menu sequence: REPORTS BY FUNCTION ->
Virtualization -> DataStores.
2.
Figure 9.168 will then appear.
Figure 9.168: Generating the DataStores VM Details report
3.
Select VMware vCenter from the Report for list, and then pick the vCenter Server for which the report is to be
generated.
4.
All clusters managed by the chosen vCenter will then populate the Cluster list. If the vSphere ESX server for
which the report is to be generated is part of a particular cluster, select that cluster from this list. If you do not
know which cluster the vSphere server belongs to, then, select the All option and proceed.
5.
If a particular Cluster is chosen, then the Physical Server list will include all vSphere ESX servers that are part of
that cluster. On the other hand, if All is chosen from the Cluster list, then all the vSphere servers across clusters
will be available for selection in the Physical Server list. Pick the server for which the report is to be generated.
6.
Next, from the list of Virtual Machines on the chosen Physical Server, select the VM for which the report is to be
generated. To view the datastore details of all VMs on the chosen Physical Server, select the All option.
7.
Then, specify the Timeline for the graph. You can either provide a fixed time line such as 1 hour, 2 days, etc.,
or select the Any option from the list to provide a From and To date/time for report generation.
460
Virtualization Reports
For every user registered with the eG Enterprise system, the administrator can indicate the
maximum timeline for which that user can generate a report. Once the maximum timeline is
set for a user, then, whenever that user logs into eG Reporter and attempts to generate a
report, the Timeline list box in the report page will display options according to the maximum
timeline setting of that user. For instance, if a user can generate a report for a maximum
period of 3 days only, then 3 days will be the highest option displayed in the Timeline list i.e., 3 days will be the last option in the fixed Timeline list. Similarly, if the user chooses the
Any option from the Timeline list and proceeds to provide a start date and end date for
report generation using the From and To specifications, eG Enterprise will first check if the
user's Timeline specification conforms to his/her maximum timeline setting. If not, report
generation will fail. For instance, for a user who is allowed to generate reports spanning over
a maximum period of 3 days only, the difference between the From and To dates should
never be over 3 days. If it is, then, upon clicking the Run Report button a message box will
appear, prompting the user to change the From and To specification.
8.
In addition to the settings discussed above, this report comes with a set of default specifications. These settings
are hidden by default. If you do not want to disturb these default settings, then you can proceed to generate
the report by clicking the Run Report button soon after you pick a Virtual Machine. However, if you want to
view and then alter these settings (if required), click on the
button. The default settings will then appear in
the MORE OPTIONS drop down window (see Figure 9.169). The steps below discuss each of these settings and
how they can be customized.
Figure 9.169: The default settings for generating the DataStores VM Details report
9.
The speed with which a report is generated depends primarily on the report Timeline. While a Timeline that
varies between a couple of days to a week enables the eG Enterprise system to quickly retrieve the required
data, timelines that span multiple weeks/months could slow-down the data retrieval and report generation
process to a considerable extent, owing to the volume of data involved. In order to ensure quick and easy
access to reports, eG Enterprise provides you the option of enabling data retrieval from the Trend information in
the database, instead of the Detailed test information that is used by default for report generation. The Detailed
test information based comprises of multiple measurement records for a test - one or more each for every test
execution. Whereas, the Trend information includes only hourly, daily, and monthly summary computations for
a test performed on a continuous basis. For instance, during a period of 1 hour, a test that runs every 5
minutes inserts atleast 12 records into the Detailed test information base. On the other hand, the Trend
461
Virtualization Reports
information base would consist of only 1 record for the same 1 hour period. Fewer the number of records,
query execution becomes much quicker, and data retrieval faster. To use the trend data for report generation,
you will have to select the Trend option from the Show Data field in Figure 9.168. By default, the Detailed option
is selected in Figure 9.168 indicating that the report data is retrieved from the detailed test information in the
database. If need be, you can also ensure that all reports always use the Detailed test tables alone by hiding
the Show Data field from the reporter interface. To achieve this, do the following:
10.
Login to the eG administrative interface as 'admin'.
Follow the menu sequence, Configure -> Settings. In the SETTINGS page that appears, select the General
node under the Manager Settings node of the Settings tree.
From the MANAGER SETTINGS page that then appears, if you set the Compute average/sum of metrics
while trending flag to No, then the Show Data field will not appear in the reporter interface; this denies
users access to the Trend option, and thus ensures that reports are always generated using the Detailed
tables.
A Trend report will not include the data for the current day since trend data is only
computed at the end of the day.
If the Trend option is chosen, the time period of the report should be greater than
1 day.
The usage of Detailed test tables for generating reports, especially those that span
weeks, increases the stress on the eG database, thus resulting in undue delays in
report generation. In order to ensure that the database is not choked by such
voluminous data requests, you can configure eG Enterprise to automatically "force"
the use of the Trend option if the Timeline of a report exceeds a pre-configured
duration. To specify this time boundary, do the following:
Edit the eg_report.ini file in the <EG_INSTALL_DIR>\manager\config directory.
In the [MISC] section of the file, you will find a DetailedTime parameter.
Specify the duration (in days) beyond which Detailed reports cannot be generated,
against the DetailedTime parameter, and save the eg_report.ini file.
For instance, to make sure that Detailed reports are disallowed for a Timeline of
over 2 weeks, set the DetailedTime parameter to 14 and save the file.
Say, subsequently, you attempt to generate a Detailed report for a Fixed Timeline
of 3 weeks (which is greater than the 14-day limit set in our example). The instant
you select the 3 weeks option from the Fixed list box, the Detailed option gets
automatically disabled, and the Trend option gets enabled. Similarly, if you specify
an Any Timeline that runs over 14 days, then, upon clicking the RUN REPORT
BUTTON to generate the report, a message box appears (see Figure 5.8) informing
you that only the Trend option is permitted.
To proceed with the Trend report generation, click the OK button in the message
box. To terminate Trend report generation, click the CANCEL button.
If the timeline specified for the report needs to exclude the data collected during the Weekends, then set
462
Virtualization Reports
Exclude weekends to Yes. If not, select No.
By default, the weekend constitutes Saturday and Sunday. To override this default setting,
do the following:
Edit the eg_report.ini file in the <EG_INSTALL_DIR>\manager\config directory.
In the [VIRTUAL_DATASTORE] section of the file, the EXCLUDE_WEEKEND parameter
is set to Saturday,Sunday by default. You can modify this by setting the
EXCLUDE_WEEKEND parameter to a comma-separated list of other days of the week
- say Friday,Saturday.
Save the file after making the required changes.
11.
Next, indicate the report Timeperiod.
12.
In large environments, reports generated using months of data can take a long time to complete.
Administrators now have the option of generating reports on-line or in the background. When a report is
scheduled for background generation, administrators can proceed with their other monitoring, diagnosis, and
reporting tasks, while the eG manager is processing the report. This saves the administrator valuable time. To
schedule background processing of a report, select the Background Save - PDF option from the Report
Generation list. In this case, a Report Name text box will appear, where you would have to provide the name
with which the report is to be saved in the background. To process reports in the foreground, select the
Foreground Generation - HTML option from this list.
13.
The Report Generation list will appear only if the EnableBackgroundReport flag in
the [BACKGROUND_PROCESS] section of the eg_report.ini file (in the
{EG_INSTALL_DIR}\manager\config directory) is set to Yes.
The default selection in the Report Generation list will change according to the
Timeline specified for the report. If the Timeline set is greater than or equal to the
number of days specified against the MinDurationForReport parameter in the
[BACKGROUND_PROCESS] section of the eg_report.ini file, then the default selection
in the Report Generation list will be Background. On the other hand, if the Timeline
set for the report is lesser than the value of the MinDurationForReport parameter,
then the default selection in the Report Generation list will be Foreground. This is
because, the MinDurationForReport setting governs when reports are to be
processed in the background. By default, this parameter is set to 2 weeks - this
indicates that by default, reports with a timeline of 2 weeks and above will be
processed in the background.
Finally, click the Run Report button. Figure 9.170 will then appear.
463
Virtualization Reports
Figure 9.170: The DataStores VM Details Report
14.
If the All option had been chosen from the Virtual Machine list, Figure 9.170 will list all the VMs on the selected
Physical Server. For each VM, the report will reveal the name of the virtual disk and physical datastore that has
been assigned to that VM. The space usage, I/O activity, and read/write latency experienced by that virtual disk
and physical datastore will also be displayed in the report. With the help of this report, you can determine the
following:
Which virtual disks and physical datastores have been utilized excessively?
Which virtual disks and physical datastores have been utilizing high latencies?
Which VMs on the host are using these problematic virtual disks and phystical datastores?
Which VMs are responsible for the abnormal space usage on a virtual disk?
Which VMs are affected by the abnormal space usage on an assigned virtual disk/physical datastore?
15.
Clicking on any measure value in this report will lead you to a measure graph revealing the variations in that
measure during the last hour.
9.22 Uptime Reports
Uptime is a key measure of the general health and availability of the critical virtual hosts and VMs in a virtualized
infrastructure. Periodic uptime values that the eG agent reports for target hosts/VMs can alert you to unscheduled
reboots that occurred recently; however, to effectively assess host/VM availability over time, accurately determine
unexpected and prolonged breaks in availability, and accordingly ascertain service level achievements/slippages, a
look at the total uptime of a virtual host/VMs and the total number of reboots it experienced over a period of time is
necessary. To enable such an analysis for one/more critical components of a virtualized infrastructure, eG Enterprise
provides Uptime Reports.
Using the Uptime Reports, you can figure out the following:
Which virtual hosts/VMs are the healthiest, in terms of availability?
Which hosts/VMs have been down for the longest period of time? How long was each server unavailable
during the specified timeline?
464
Virtualization Reports
How many times during the designated period did a host/VM reboot? How many of these were scheduled
reboots? How long was the host/VM down before every reboot?
To generate an uptime report, do the following:
1.
Select the Uptime option from the Virtualization node of the REPORTS BY FUNCTION tree.
2.
When Figure 9.171 appears, first indicate the Report Type to be generated. For viewing the uptime details of
components in a table, choose the Data option. For graphically representing the uptime/downtime of chosen
components, select the Graph option.
Figure 9.171: Specifying the criteria for Uptime reports
3.
Next, pick an option from the Uptime for list and indicate whether the report to be generated is for Physical
Servers or Virtual Machines.
4.
If the Physical Servers option is chosen, then the following steps apply:
By default, selecting the Physical Servers option from the Uptime for list will populate the Physical Servers
list box in the Uptime Report page with all the managed virtual hosts in the target environment. You would
then have to pick and choose the physical servers for which the report is to be generated from the Physical
Servers list box.
This implies that in the case of large virtualized infrastructures characterized by hundreds of physical
servers, a large number of virtual hosts will be made available for selection in the Physical Servers list
box; selecting the desired elements from this 'endless' list will hence become a painful exercise. To ease
the pain involved in choosing the elements for report generation, eG Enterprise provides an Analyze by
list; by selecting an option from this list, you can quickly condense the Physical Servers list and then
swiftly identify the elements of interest to you. By default, the Component option is chosen from the
Analyze by list - this indicates that by default, the Physical Servers list will display all the the managed
virtual hosts in the target environment. The other options in the list include:
Zone: To generate an uptime report for one/more physical servers that are included in a zone, pick
the Zone option. A Zone drop-down list will then appear, from which you would have to select the
zone to which the physical servers of interest to you belong. An Include Subzone flag also appears.
Indicate whether the virtual hosts present within the sub-zones of the chosen zone are also to be
considered for report generation, by setting the Include Subzone flag to Yes.
Segment: If you want to generate an uptime report for one/more physical servers that belong to a
segment, select the Segment option from Analyze by and then pick the Segment option from the
drop-down list that appears.
Service: If you want to generate an uptime report for one/more physical servers involved in the
delivery of a service, select the Service option from Analyze by and then pick the required Service
from the drop-down list that appears.
Then, to further filter the components listed in the Physical Servers list box, pick a Component Type - this
way, only those virtual hosts that are of the chosen type will be available for selection in the Physical
465
Virtualization Reports
Servers list. By default, the All option is chosen here indicating that all managed physical servers in the
target environment will be displayed in the Physical Servers list box, by default.
Select the physical servers for which uptime reports are to be generated from the Physical Servers list box.
If this list consists of too many Physical Servers, then viewing all the servers and selecting the ones you
need for report generation could require endless scrolling. To avoid this, you can click the
icon next to
the Physical Servers list. The PHYSICAL SERVERS pop up window will then appear using which so that you
can view almost all the servers in a single interface and Select the ones for which the report is to be
generated.
5.
On the other hand, if the Virtual Machines option is chosen from the Uptime for list, then the following steps
apply:
By default, selecting the Virtual Machines option from the Uptime for list will populate the Virtual Machines
list box that will appear in this case, with all the guest operating systems executing on all the managed
physical servers in the environment. You would then have to pick and choose the physical servers for which
the report is to be generated from the Physical Servers list box.
This implies that in the case of large virtualized infrastructures characterized by hundreds of physical
servers, each hosting tens of guest operating systems, a large number of virtual machines will be made
available for selection in the Virtual Machines list box; selecting the desired elements from this 'endless' list
will hence become a painful exercise. To ease the pain involved in choosing the elements for report
generation, eG Enterprise provides an Analyze by list; by selecting an option from this list, you can quickly
condense the Virtual Machines list and then swiftly identify the elements of interest to you. By default, the
Component option is chosen from the Analyze by list - this indicates that by default, the Virtual Machines
list will display the complete set of VMs that are executing on all the managed virtual hosts in the target
environment. The other options in the list include:
Zone: To generate an uptime report for one/more VMs that have been configured on physical
servers that are included in a zone, pick the Zone option. A Zone drop-down list will then appear,
from which you would have to select the zone to which the physical servers of interest to you
belong. An Include Subzone flag also appears. Indicate whether the virtual hosts present within the
sub-zones of the chosen zone are also to be considered for report generation, by setting the
Include Subzone flag to Yes.
6.
Segment: If you want to generate an uptime report for those VMs that are executing on virtual
hosts that belong to a segment, select the Segment option from Analyze by and then pick the
Segment from the drop-down list that appears.
Service: If you want to generate an uptime report for those VMs that are being hosted by the
physical servers engaged in service delivery, select the Service option from Analyze by and then
pick the required Service from the drop-down list that appears.
Then, to further filter the components listed in the Virtual Machines list box, pick a Component Type - this
way, only those VMs that are executing on the virtual hosts of the chosen type will be available for
selection in the Virtual Machines list. By default, the All option is chosen here indicating that VMs operating
on all managed physical servers in the target environment will be displayed in the Virtual Machines list box,
by default.
Select the VMs for which uptime reports are to be generated from the Virtual Machines list box. If this list
consists of too many VMs, then viewing all the VMs and selecting the ones you need for report generation
could require endless scrolling. To avoid this, you can click the
button next to the Virtual Machines list.
The VIRTUAL MACHINES pop up window will then appear using which you can view almost all the VMs in a
single interface and select the ones for which the report is to be generated.
Then, specify the Timeline for the graph. You can either provide a fixed time line such as 1 hour, 2 days, etc.,
466
Virtualization Reports
or select the Any option from the list to provide a From and To date/time for report generation.
For every user registered with the eG Enterprise system, the administrator can indicate the
maximum timeline for which that user can generate a report. Once the maximum timeline is
set for a user, then, whenever that user logs into eG Reporter and attempts to generate a
report, the Timeline list box in the report page will display options according to the maximum
timeline setting of that user. For instance, if a user can generate a report for a maximum
period of 3 days only, then 3 days will be the highest option displayed in the Timeline list i.e., 3 days will be the last option in the fixed Timeline list. Similarly, if the user chooses the
Any option from the Timeline list and proceeds to provide a start date and end date for
report generation using the From and To specifications, eG Enterprise will first check if the
user's Timeline specification conforms to his/her maximum timeline setting. If not, report
generation will fail. For instance, for a user who is allowed to generate reports spanning over
a maximum period of 3 days only, the difference between the From and To dates
should never be over 3 days. If it is, then, upon clicking the Run Report button a
message box will appear, prompting the user to change the From and To
specification.
7.
In addition to the settings discussed above, this report comes with a set of default specifications. These settings
are hidden by default. If you do not want to disturb these default settings, then you can proceed to generate
the report by clicking the Run Report button soon after you pick one/more Physical Servers or Virtual Machines
(as the case may be). However, if you want to view and then alter these settings (if required), click on the
button. The default settings will then appear in the MORE OPTIONS drop down window (see Figure 9.172). The
steps below discuss each of these settings and how they can be customized.
Figure 9.172: The default settings for generating the Uptime Reports
8.
By default, the Uptime report ignores all reboots that occur when a 'maintenance policy configuration' is active
on a physical server/VM - in other words, such reboots are by default excluded from the count of reboots
467
Virtualization Reports
displayed by the report. This default behavior is governed by the Include Maintenance flag, which is set to No by
default. You can however, optionally configure the Uptime report to include reboots that occur during
maintenance periods in its count of reboots. For this, set the Include Maintenance flag to Yes.
9.
If the timeline specified for the report needs to exclude the data collected during the Weekends, then set
Exclude weekends to Yes. If not, select No.
10.
If the Report Type is Data, then, a Show Details flag will appear set to No by default. This indicates that, by
default, the resulting Data report will not provide reboot details. To view reboot details along with the uptime
details, set the Show Details flag to Yes.
You can configure the days of the week that need to be considered as a ‘weekend’ using the
Days parameter in the [EXCLUDE_WEEKEND] section in the eg_report.ini file (in the
<EG_INSTALL_DIR>\manager\config directory). The Days parameter is set to Saturday,Sunday
by default. To change this weekend specification, enter two other days of the week against
the Days parameter.
11.
If the Report Type you have chosen is Graph, then a Chart drop-down list will appear from which you can select
how uptime/downtime should be represented in the graph - as a percentage? or in hours?. If the
%Uptime/%Downtime option is chosen, then the resulting graph will plot the percentage of time for which the
selected components have been up/down. On the other hand, if the Uptime/Downtime option is selected, then
the graph will plot the total number of hours for which the chosen components have been up/down.
12.
Next, select the data on the basis of which the report should be sorted. By default, the Downtime option is
chosen from the Sort by list.
13.
Since the default Sort by option is Downtime, by default, the report provides the details of only the top-10
components with the maximum downtime. If a different Sort by option, say Reboots, is chosen, then the report,
by default, will only pertain to the top-10 components in the environment, on the basis of the number of
reboots. You can choose a different top-n / last-n option from the Show list, if need be.
By default, the values displayed in the Show list range from TOP-10 to LAST-10. This is
because, the Showtop parameter in the [INFOS] section of the eg_report.ini file (in the
<EG_INSTALL_DIR>\manager\config directory) is set to 10, by default. You can, if required,
configure the Show list to display a different range of options. For this, specify a different
number against the Showtop parameter, and save the eg_report.ini file.
14.
Next, indicate the report Timeperiod.
468
Virtualization Reports
By default, the Timeperiod is set to 24 hours. Accordingly, the From and To parameters in
the [TIMEFRAME] section of the eg_report.ini file (in the <EG_INSTALL_DIR>\manager\config
directory) are set to 00:00 and 24:00 respectively. If need be, you can override this default
setting by configuring a different timeframe against the From and/or To parameters.
15.
In large environments, reports generated using months of data can take a long time to complete.
Administrators now have the option of generating reports on-line or in the background. When a report is
scheduled for background generation, administrators can proceed with their other monitoring, diagnosis, and
reporting tasks, while the eG manager is processing the report. This saves the administrator valuable time. To
schedule background processing of a report, select the Background Save - PDF option from the Report
Generation list. In this case, a Report Name text box will appear, where you would have to provide the name
with which the report is to be saved in the background. To process reports in the foreground, select the
Foreground Generation - HTML option from this list.
The Report Generation list will appear only if the EnableBackgroundReport flag in
the [BACKGROUND_PROCESS] section of the eg_report.ini file (in the
{EG_INSTALL_DIR}\manager\config directory) is set to Yes.
The default selection in the Report Generation list will change according to the
Timeline specified for the report. If the Timeline set is greater than or equal to the
number of days specified against the MinDurationForReport parameter in the
[BACKGROUND_PROCESS] section of the eg_report.ini file, then the default selection
in the Report Generation list will be Background. On the other hand, if the Timeline
set for the report is lesser than the value of the MinDurationForReport parameter,
then the default selection in the Report Generation list will be Foreground. This is
because, the MinDurationForReport setting governs when reports are to be
processed in the background. By default, this parameter is set to 2 weeks - this
indicates that by default, reports with a timeline of 2 weeks and above will be
processed in the background.
16.
Finally, click the Run Report button.
17.
If the Report Type is Graph and the Report Generation mode is Foreground Generation - HTML, then clicking the
Run Report button will reveal a bar graph depicting the uptime and downtime of the chosen components. From
this graph, you can easily identify the components that have been unavailable during the specified Timeline,
and the duration of the unavailability.
469
Virtualization Reports
Figure 9.173: The Graphical Uptime report
18.
Clicking on the bar corresponding to any of the components displayed in Physical servers Uptime Chart page
will invoke Uptime Details page which will allow you to zoom into the uptime details of that particular
component. Besides providing a pie chart that depicts the percentage uptime and downtime of the chosen
component, Uptime Details page also provides the following useful information:
The total duration for which the chosen component was up and running during the specified Timeline;
The percentage uptime of the component;
The total duration for which the chosen component was down during the specified Timeline;
The percentage downtime of the component;
The total number of reboots that the component experienced during the specified Timeline;
A Reboot Details section that indicates the following for every reboot:
When the component was shutdown
When the reboot occurred
The duration for which the component remained shutdown before being rebooted;
470
Virtualization Reports
Figure 9.174: Clicking on a bar in the Uptime report
19.
Using the Uptime Details page, you can figure out how often a component was rebooted, and thus determine
whether such reboots were scheduled or unexpected.
20.
If the Report Type is Data and the Report Generation mode is set to Foreground Generation - HTML, then clicking
on the Run Report button will reveal Uptime data report. For every component chosen, the Data report reveals
the total uptime, total downtime, percentage uptime, percentage downtime, and number of reboots.
Components with high uptime/downtime and those that rebooted frequently can be instantly isolated using this
report. Since the Show details flag is set to No by default for the Data report, Uptime data report will not
include a separate section providing reboot information. To view the reboot details of a component therefore,
you will have to click on the icon under the Details column corresponding to that component.
21.
A page will then appear providing the reboot information. You can save these details to a PDF file, print the
details, or save them as a CSV file using the icons present at the right, top corner of Reboot Details page.
Figure 9.175: Reboot details
22.
If the Show Details flag had been set to Yes instead, then the reboot details available in Reporter Data page be
provided as part of the original report itself.
23.
On the other hand, if the Background Save - PDF option is chosen from the Report Generation list, then clicking
on the RUN REPORT BUTTON will not generate the report and display it in this page for your benefit. Instead, a
471
Virtualization Reports
message indicating that the report is being processed in the background will appear. This will be accompanied
by a link that will lead you to the page that lists all the reports that are being processed in the background, and
their current status. If background report generation fails for a report, you can regenerate that report using this
page, or can even delete that report if need be. On the other hand, if background processing successfully
completes for your report, then, you can view a PDF of the report by clicking on the
472
icon in that page.
Citrix / VDI Reports
Citrix / VDI Reports
In thin client environments typically, a central server hosts all critical applications, and clients (called 'thin' clients due
to their limited memory, CPU, and disk space requirement) are used just to access the applications on the server.
Owing to the low licensing cost of applications, lower resource consumption by clients, centralized control, and easy
access to applications, thin client or server-based computing has gained in significance. With an increase in
popularity and size of deployment, the complexity of such infrastructures and consequently, their monitoring
challenges have increased.
The eG Enterprise suite includes customized monitoring and reporting for Citrix, Terminal servers, and virtual desktop
environments. The Citrix /VDI Reports category in the eG Reporter addresses the unique monitoring requirements of
these thin client environments. This category provides valuable insights into different aspects of a thin client
infrastructure’s performance. This includes:
Zone reports that provide a comprehensive overview of the health of the server farms;
User reports that allow administrators to focus on specific users, their activity on the server farms, the
applications they often access, and the resources they consume;
Session reports that highlight session distribution across a farm and access patterns of users;
Application reports that report on the most popular applications in the farm as well as the most resource
intensive applications.
The sections that follow will discuss each of these report options in great detail.
In order to enable administrators to monitor a server farm as a whole, eG Enterprise allows
administrators to group all the Citrix/Terminal/VMware VDI servers in a farm to a particular
zone, and generate reports pertaining to the zone. If zones are not defined, all the servers in
a user’s view are considered to be part of the Default zone for that user, and a zone report
can be obtained for this zone.
10.1 Zone Performance Report
A Zone Performance report provides a comprehensive overview of the performance of a thin-client farm. Metrics of
interest (pre-specified by the administrator) are aggregated across all the Citrix/Microsoft RDS/VMware VDI servers in
the farm, and a summary describing the performance of a farm is provided as part of the Zone Performance report.
Additionally, for each of the servers, critical metrics are reported for the timeline chosen by the user. These metrics
provide key insights into how the server farm is performing and where the bottlenecks may be.
473
Citrix / VDI Reports
To view the Zone Performance report, do the following:
1.
Select the Zone Performance option from the Citrix / VDI Reports node of the REPORTS BY FUNCTION tree.
2.
Figure 10.1 will then appear. To monitor the servers that form part of a specific farm, select the Zone to which
the servers in the farm have been added. By default, the Zone list displays only those zones that contain
components belonging to any/all of the following types: Citrix, Citrix MF, Citrix MF XP, Citrix Sec gwy, Citrix STA,
Citrix ZDC, Microsoft RDS, Hyper – V VDI, VMware vSphere VDI, Citrix XenApp, Citrix XenApp4/5/6.x, Citrix
XenDesktop Broker v5.
Figure 10.1: Generating a Thin Client Zone Report
3.
Once the Zone is chosen, eG searches the zone for component-types that match one/more types listed above.
The matching component types alone populate the Component Type list. To receive an overview of the
performance of all servers of a particular type across a chosen zone, select a Component type from this list.
If no zones are currently configured, then you can use the Default zone to generate the Zone
Performance report.
4.
Next, choose a Report Type (Graph or Data). The default Report Type is Graph. To closely observe and clearly
understand the behavior of a single performance parameter across a component-type, you can plot a single
measure's data alone in a Graph report (see Figure 10.1).
5.
When the Report Type is Graph, a Measure list box will appear, containing the complete list of measures that
you have configured for the report. From this list, pick the Measure for which a graph is to be generated (see
Figure 10.1).
6.
You can either provide a fixed Timeline such as 1 hour, 2 days, etc., or select the Any option from the list to
provide a From and To date/time for report generation.
474
Citrix / VDI Reports
The default Timeline can be set using the CONSOLIDATED REPORTS page in the eG
administrative interface; to access this page, follow the menu sequence: Settings ->
Reporter -> Consolidated Reports. For more details regarding this page, refer to
Section 3.4 of this manual.
Shorter the Timeline for a report, lighter would be the query that is executed on the
database, and faster the report generation. Report Timelines that run across many
weeks therefore, cause excessive strain on the database, thus slowing-down report
generation. To save the eG backend from injury, eG Enterprise automatically restricts
the maximum Timeline for which a thin client report can be generated to the lower of
the following values:
the value of the Citrix Login Test parameter in the [DDD_CLEANUP] section of the
eg_format.ini file (in the <EG_INSTALL_DIR>\manager\config directory)
the value of the MaxTimeline parameter in the [MISC] section of the eg_report.ini file (in
the <EG_INSTALL_DIR>\manager\config directory).
The maximum timeline for which the current user to eG Reporter is permitted to
generate reports;
The [DDD_CLEANUP] section is where you define the interval (in days) at which the detailed
diagnosis of specific tests is to be purged from the database. For the Citrix Login Test, the
default interval is set to 32 days (i.e., just over a month), indicating that, by default, the
detailed diagnosis of the Citrix Login Test is cleared from the database at the end of every
month. Since critical thin client reports are generated based on the detailed diagnosis
information, a Timeline that exceeds the duration set against Citrix Login Test would result
in a report that displays invalid/no data. This duration however, is configurable. Similarly,
you can also configure a MaxTimeline in the [MISC] section of the eg_report.ini file. By
default, this parameter is set to 168 (hours), indicating that the maximum Timeline for a
thin client report is 1 week (i.e., 24 * 7 = 168 hours). Also, while creating user profiles
using the eG administrative interface, an administrator can indicate the maximum timeline
for which that user can generate reports, so as to avoid long running reports.
Now, assume that you have set the Citrix Login Test parameter to 21 days (i.e., 3 weeks)
and the MaxTimeline parameter to 336 hours (i.e., 2 weeks). Also, say that user john with
access rights to eG Reporter has been configured to generate reports for a maximum
timeline of 1 week. Therefore, whenever user john logs into eG Reporter and attempts to
generate a thin client report, eG Enterprise compares the three values, picks the lowest of
the three, and sets that value as the maximum Timeline for thin client reports. In our
example, the maximum timeline settings of user john (i.e., 1 week) is the lowest
Therefore, the maximum value that will be available for selection from the Fixed Timeline
list box in the thin client report page will be 1 week.
Note that this timeline restriction does not apply to fixed timeline settings alone. If a user
chooses the Any option from the Timeline list and proceeds to provide a start date and
end date for report generation using the From and To specifications, eG Enterprise will first
check if the user's Timeline specification is equal to or below the lowest of the three values
discussed above. If not, report generation will fail. For instance, for a user who is allowed
to generate reports spanning over a maximum period of 3 days only, the difference
between the From and To dates should never be over 3 days. If it is, then, upon clicking
the Run Report button a message box will appear, prompting the user to change the From
and To specification.
475
Citrix / VDI Reports
7.
In addition to the settings discussed above, this report comes with a set of default specifications. These settings
are hidden by default. If you do not want to disturb these default settings, then you can proceed to generate
the report by clicking the Run Report button soon after you pick a Measure. However, if you want to view and
then alter these settings (if required), click on the
icon. The default settings will then appear in the MORE
OPTIONS drop down window (see Figure 10.2). The steps below discuss each of these settings and how they
can be customized.
Figure 10.2: The default settings for generating a thin client Zone Performance reprot
8.
The speed with which a report is generated depends primarily on the report Timeline. While a Timeline that
varies between a couple of days to a week enables the eG Enterprise system to quickly retrieve the required
data, timelines that span multiple weeks/months could slow-down the data retrieval and report generation
process to a considerable extent, owing to the volume of data involved. In order to ensure quick and easy
access to reports, eG Enterprise provides you the option of enabling data retrieval from the Trend information in
the database, instead of the Detailed test information that is used by default for report generation. The Detailed
test information base comprises of multiple measurement records for a test - one or more each for every test
execution. Whereas, the Trend information includes only hourly, daily, and monthly summary computations for
a test performed on a continuous basis. For instance, during a period of 1 hour, a test that runs every 5
minutes inserts atleast 12 records into the Detailed test information base. On the other hand, the Trend
information base would consist of only 1 record for the same 1 hour period. Fewer the number of records,
query execution becomes much quicker, and data retrieval faster. To use the trend data for report generation,
you will have to select the Trend option from the Show Data field in Figure 10.2. By default, the Detailed option
is selected in Figure 10.2 indicating that the report data is retrieved from the detailed test information in the
database. If need be, you can also ensure that all reports always use the Detailed test tables alone by hiding
the Show Data field from the reporter interface. To achieve this, do the following:
Login to the eG administrative interface as 'admin'.
Select the Manager option from the Settings tile that appears when the
clicked.
From the GENERAL SETTINGS page that then appears, if you set the Compute average/sum of metrics
while trending flag to No, then the Show Data field will not appear in the reporter interface; this denies
users access to the Trend option, and thus ensures that reports are always generated using the Detailed
tables.
476
button against the Admin tab is
Citrix / VDI Reports
9.
A Trend report will not include the data for the current day since trend data is only
computed at the end of the day.
If the Trend option is chosen, the time period of the report should be greater than
1 day.
The usage of Detailed test tables for generating reports, especially those that span
weeks, increases the stress on the eG database, thus resulting in undue delays in
report generation. In order to ensure that the database is not choked by such
voluminous data requests, you can configure eG Enterprise to automatically "force"
the use of the Trend option if the Timeline of a report exceeds a pre-configured
duration. To specify this time boundary, do the following:
Edit the eg_report.ini file in the <EG_INSTALL_DIR>\manager\config directory.
In the [MISC] section of the file, you will find a DetailedTime parameter.
Specify the duration (in days) beyond which Detailed reports cannot be generated,
against the DetailedTime parameter, and save the eg_report.ini file.
For instance, to make sure that Detailed reports are disallowed for a Timeline of
over 2 weeks, set the DetailedTime parameter to 14 and save the file.
Say, subsequently, you attempt to generate a Detailed report for a Fixed Timeline
of 3 weeks (which is greater than the 14-day limit set in our example). The instant
you select the 3 weeks option from the Fixed list box, the Detailed option gets
automatically disabled, and the Trend option gets enabled. Similarly, if you specify
an Any Timeline that runs over 14 days, then, upon clicking the RUN REPORT
BUTTON to generate the report, a message box appears (see Figure 5.7) informing
you that only the Trend option is permitted.
To proceed with the Trend report generation, click the OK button in the message
box. To terminate Trend report generation, click the CANCEL button.
Next, specify the start time and end time for report generation against the Time period field.
The default Time period to be displayed here can be configured using the CONSOLIDATED
REPORTS page in the eG administrative interface; to access this page, follow the menu
sequence: Configure -> Reports -> Consolidated. For more details regarding this page, refer
to Section 3.4 of this manual.
10.
If the timeline specified for the report needs to exclude the data collected during the Weekends, then set
Exclude weekends to Yes. If not, select No.
477
Citrix / VDI Reports
You can configure the days of the week that need to be considered as a ‘weekend’ using the
CONSOLIDATED REPORTS page in the eG administrative interface; to access this page, follow
the menu sequence: Configure -> Reports -> Consolidated. For more details regarding this
page, refer to Section 3.4 of this manual.
11.
Besides a pie chart, the report of type Graph will also invoke a comparative bar graph. This bar graph will, by
default, reveal the top - 10 components (of a particular type or across all types) in the selected Zone in terms of
the Measure chosen. This is why, the Show list is set to Top-10 by default. You can however view any number
of top/bottom players in a particular performance area by picking any TOP or LAST option from the Show list.
By default, the values displayed in the Show list range from TOP-10 to LAST-10. This is
because, the Showtop parameter in the [INFOS] section of the eg_report.ini file (in the
<EG_INSTALL_DIR>\manager\config directory) is set to 10, by default. You can, if required,
configure the Show list to display a different range of options. For this, specify a different
number against the Showtop parameter, and save the eg_report.ini file.
12.
In large environments, reports generated using months of data can take a long time to complete.
Administrators now have the option of generating reports on-line or in the background. When a report is
scheduled for background generation, administrators can proceed with their other monitoring, diagnosis, and
reporting tasks, while the eG manager is processing the report. This saves the administrator valuable time. To
schedule background processing of a report, select the Background Save - PDF option from the Report
Generation list. In this case, a Report Name text box will appear, where you would have to provide the name
with which the report is to be saved in the background. To process reports in the foreground, select the
Foreground Generation - HTML option from this list.
478
Citrix / VDI Reports
The Report Generation list will appear only if the EnableBackgroundReport flag in the
[BACKGROUND_PROCESS]
section
of
the
eg_report.ini
file
(in
the
{EG_INSTALL_DIR}\manager\config directory) is set to Yes.
The default selection in the Report Generation list will change according to the Timeline
specified for the report. If the Timeline set is greater than or equal to the number of
days
specified
against
the
MinDurationForReport
parameter
in
the
[BACKGROUND_PROCESS] section of the eg_report.ini file, then the default selection in
the Report Generation list will be Background. On the other hand, if the Timeline set for
the report is lesser than the value of the MinDurationForReport parameter, then the
default selection in the Report Generation list will be Foreground. This is because, the
MinDurationForReport setting governs when reports are to be processed in the
background. By default, this parameter is set to 2 weeks - this indicates that by default,
reports with a timeline of 2 weeks and above will be processed in the background.
13.
Finally, click the Run Report button to generate the report.
14.
If the Report Type is Graph and the option chosen from the Report Generation list is Foreground Generation HTML, then, clicking on the Run Report button will invoke Figure 10.3, which will comprise of the following:
A distribution pie chart that reveals the number of components in different distribution ranges (see Figure
10.3). The distribution ranges are obtained based on the first of the configured functions for the chosen
Measure. For instance, assume that CPU utiization is the chosen Measure. Say that you have configured to
display the Avg and Max of CPU utilization in the zone report. Typically, both these configured values will
appear only in a Data report. In the case of a Graph report however, the first of the two functions - i.e.,
Avg of CPU utilization - alone is calculated for every component of the chosen component-type. The
resulting pie chart enables administrators to deduce, at a glance, the number of components where the
chosen performance metric has fared well and/or badly. Clicking on a particular slice in the pie chart lists
the components that fall within the value range represented by that slice (see Figure 10.4). Against every
component name, the actual values for each of the configured functions (both Avg and Max, in our
example), and also the Health % of each of the components will be displayed. A zone-level Summary of the
chosen Measure and the Normal % will also be available.
479
Citrix / VDI Reports
Figure 10.3: A graphical Zone report
Figure 10.4: A list of components with CPU utilization in a given range
480
Citrix / VDI Reports
By default, the chart type for distribution is a pie chart. However, you can have a
bar graph depict the same data instead of a pie chart, by following the steps given
below:
Edit the eg_report.ini file in the <EG_INSTALL_DIR>\manager\config directory.
Change the value of the chartTypeForDist parameter in the [ZONE_REPORT] section
of this file from the default Pie, to Bar.
Save the eg_report.ini file.
By default, the number of value ranges that need to be configured for the
distribution chart is 10. To override this default setting, do the following:
Edit the eg_report.ini file in the <EG_INSTALL_DIR>\manager\config directory.
Specify a number of your choice against the nofRangeForDist parameter in the
[ZONE_REPORT] section of this file. By default, this parameter will hold the value 10.
Save the eg_report.ini file.
Adjacent to the pie chart, you will find a bar chart that indicates the components that have topped/failed in
a selected performance realm (i.e., the Measure) during the specified Timeline. For example, for the CPU
utilization measure, this bar chart reveals the components that are the top CPU-consumers. Like the pie
chart, the values for the bar chart are also calculated by applying the first of the configured functions on
the chosen Measure. Clicking on the bar corresponding to a server name results in a Server Report (see
Figure 10.5) that enables you to focus on the performance of that server.
Figure 10.5: The server report that appears upon clicking on a bar chart
481
Citrix / VDI Reports
The number of components to be displayed in the Top <N> Components bar chart
is configurable. To specify the number, do the following:
Edit the eg_report.ini file in the <EG_INSTALL_DIR>\manager\config directory.
Specify a number of your choice against the NoOfServersforChart parameter in
the [ZONE_REPORT] section of the file. By default, the value displayed here is
10, indicating that, by default, the bar chart will be for the Top 10
Components. For example, if you change this value to 5, then a bar chart
displaying the Top 5 Components will appear.
Finally, save the eg_report.ini file.
Similarly, you can configure the depth of the bars in the bar chart by specifying a
numeric value against the 3DDepthforChart parameter in the [ZONE_REPORT]
section of the eg_report.ini file (in the {EG_INSTALL_DIR}\manager\config
directory).
By default, 10 bars will be visible in a single glance in the bar chart. If there are
more bars, you will have to scroll down to view them. This default setting can be
overridden
by
editing
the
eg_report.ini
file
(in
the
{EG_INSTALL_DIR}\manager\config directory). The [ZONE_REPORT] section of this
file contains a VisibleSamples parameter that holds the default value 10. You can
change this value.
You can configure the colors to be used in the distribution chart and the Top <N> Components bar chart
in the zone report, by editing the eg_report.ini file in the <EG_INSTALL_DIR>\manager\config directory. The
[ZONE_REPORT] section of the file defines the 20 default colors of the distribution and bar charts:
[ZONE_REPORT]
ChartColor=#8399b0,#ffd95a,#a4ac91,#98d980,#d5b996,#f48848,#8b8cc2,
#eb4052,#c4b3d0,#b18651,#ebb7ce,#028768,#f5c372,#887c65,#e4c536,
#b5582c,#f94989,#770d72,#97a067,#89aeb7
distColor=#115fa6,#f25454,#60bd68,#b276b2,#81bef7,#a61120,#ffd13e,
#770d72,#887c65,#a4ac91
You override the default color settings of the distribution chart by modifying the color-codes specifying
against distColor. For changing the colors used by the Top <N> Components chart, alter the codes listed
against the ChartColor parameter.
15.
Unlike a Graph report, a Data report does not graphically represent the measure data. Instead, the configured
details are presented in a tabular format in the report.
482
Citrix / VDI Reports
16.
If the Report Type is Data , then, like in the case of a Graph report, specify a Time period, indicate whether to
Exclude weekends or not, indicate whether report is to be generated using Detailed data or Trend data, and
then provide a report Timeline.
17.
Finally, click the Run Report button.
18.
The Data report will display two tables providing the user-configured details (see Figure 10.6) for the chosen
component-type. By default, the Summary section of the report will display the average values of each of the
configured measures across the farm. In the section providing per-server information though, eG Enterprise will
display multiple values for a measure depending upon the number and type of functions that have been
configured for the measure. For example, in Figure 10.6, note that the second section displays both the Avg
and Max values for the Cpu util measure, but only the Avg value for the Network Availability measure.
483
Citrix / VDI Reports
Figure 10.6: The Zone Data Report
19.
Besides the above-mentioned details, the second section of the Data report also contains a Health % column.
This column indicates the percentage of time a particular server has been in the Normal state during the chosen
timeline. If a server has remained the constant victim of problems during the specified time period, then this
percentage will obviously be low. To drill down to the root-cause of the issues affecting the server, click on the
corresponding Health % value. This will lead you to the Executive report of the problem server, which will reveal
484
Citrix / VDI Reports
when and what type of problems were encountered by the server.
20.
Also, to focus on the health of a particular server displayed in the zone Data report, click on the corresponding
Server name in Figure 10.6. The Server Report will then appear (see Figure 10.7).
Figure 10.7: The Server report of the problem server in the farm report
As stated earlier, you can configure the information that needs to appear in the zone report, by editing the
eg_report.ini file in the <EG_INSTALL_DIR>\manager\config directory. For example, to generate the report depicted by
Figure 10.6, specify the following in the [ZONE_REPORT] section of the eg_report.ini file:
[ZONE_REPORT]
Citrix_MF_XP:SystemTest:Cpu_util#Cpu util=Avg,Max
Citrix_MF_XP:SystemTest:Free_memory#Free Memory (MB)=Avg,Max
Citrix_MF_XP:DiskActivityTest:Percent_busy#Disk busy=Avg
Citrix_MF_XP:NetworkTest:Availability#Network Availability %=Avg
Citrix_MF_XP:TcpTest:Current_connections#Tcp conns=Avg
Citrix_MF_XP:NetworkTrafficTest:Bandwidth_usage#Network bandwidth usage %=Avg,Max
Citrix_MF_XP:CtxConnectionTest:Availability#Citrix availability %=Avg,Max
Citrix_MF_XP:CtxConnectionTest:Pkt_loss_pct#Citrix pkt loss %=Avg,Max
Citrix_MF_XP:CtxDisconnectsTest:Total_disconnects#Total disconnects=Avg,Max
Typically, measure configurations in the [ZONE_REPORT] section of the eg_report.ini file should be of the following
format:
<InternalComponenttype>:<InternalTest>:<InternalMeasure>#<Display name of measure>=<Comma-separated
list of functions>
Before proceeding with the configuring, determine the internal component type, test, and measure names, using the
procedure discussed in Page 212 of this manual.
Accordingly, in the first line of the example above:
Citrix_MF_XP is the <InternalComponenttype>
SystemTest is the <InternalTest> that reports the measure of interest to us
485
Citrix / VDI Reports
Cpu_util is the <InternalMeasure> that is to be displayed in the report page
The display name of the measure is Cpu util, and finally,
Avg and Max are the functions that are to be executed on the value of the Cpu_util measure
The other measures that have been configured are: Free_memory, Percent_busy, Availability (network),
Current_connections, Bandwdith_usage, Availability (Citrix), Pkt_loss_pct, Total_disconnects.
This indicates that for the Citrix servers in a zone, the Summary section of the report will display the average values
of each of the configured measures. However, for each of the Citrix servers in the zone, the following values will be
displayed in the second section of the report:
The average (Avg) of CPU utilization
The Max of CPU utilization
The average (Avg) of Free memory
The Max of Free memory
The average (Avg) of Percent_busy
The average (Avg) of network Availability
The average (Avg) of Current_connections
The average (Avg) of Bandwidth_usage
The average and maximum (Max) of Bandwidth_usage
The average (Avg) of connection Availability
The maximum (Max) of connection Availability
The average (Avg) Packet loss
The maximum (Max) Packet loss
The average (Avg) of Total disconnects
The maximum (Max) of Total disconnects
If functions such as Avg, Max, etc., are not explicitly configured in the
[ZONE_REPORT] section in the manner discussed above, then the second section of
the farm report will, by default, display the average (Avg) values for the configured
measures.
If a display name is not provided for a measure, then the actual measure name will
automatically become the display name.
486
Citrix / VDI Reports
10.2 User Session Details Report
The key challenge in monitoring large thin client farms or virtual desktop environments is to keep track of the user
activity on the servers in the farm. Using the User Session Details Report provided by eG Enterprise, administrators
can figure out at what times the specified user logged in, which server the user accessed, how much CPU/memory
was utilized by the user, and the applications/VMs used by the user. Like the other Citrix / VDI reports, the User
Session Details Report too permits administrators to customize the view by specifying the measures to be displayed
in the report and computations to be performed on the measures (such as Avg, Max, Min etc.). Additionally, you can
generate a report for all the users who are part of the active directory groups in a domain.
To view the User session details report, do the following:
1.
From the eG Reporter interface, select the User Session Details option from the Citrix / VDI Reports node of the
REPORTS BY FUNCTION tree.
2.
Figure 10.8 will then appear. To monitor the servers pertaining to a particular farm, select the Zone to which
the servers in the farm have been added.
Figure 10.8: Generating a User Session Details Report
3.
The Component Type list is then populated with the Citrix XenApp, Citrix XenApp 4/5/6.x, VMware vSphere VDI,
Hyper-V VDI, and Microsoft RDS server types, based on the type of components present in the chosen Zone.
Select a server-type from this list (see Figure 10.8).
4.
If Citrix XenApp is chosen from the Component Type list, then a Worker Group list box will appear. Worker
groups are collections of XenApp servers, residing in the same farm, that are managed as a single unit. You can
publish applications to a worker group. Select a Worker Group from this list if you wish to view the usage of a
User belonging to that particular worker group. By default, Any option is selected from this list.
The Worker Group list box will appear only if the SHOW WORKER GROUPS flag is set to Yes
while configuring the Citrix Users test.
5.
Next, choose the User whose usage needs to be tracked. For a report on all users to the chosen Zone, select All
from User.
487
Citrix / VDI Reports
If the number of users to the zone exceeds the value configured for the MoreUsers
parameter
of
the
[CITRIX_USER_REPORT]
section
(in
the
{EG_INSTALL_DIR}\manager\config\eg_report.ini file), then a text box will be displayed
instead of the list box for the User field. In the case of the text box, you will have to
specify (and not choose) the name of the user for whom the report is to be generated.
To generate a report for all available users, specify '*'.
6.
The Organize By list box appears only when All option is selected from the User list. To generate this report for
a particular thin client user, select the Users option from this list. To generate a thin client report for all users
who belong to active directory groups, pick the Active Directory Group option from this list (see Figure 10.9).
Figure 10.9: Selecting the Active Directory Group option
The Organize By list box will appear only if the Report by security group flag in the SETTINGS
FOR AD USERS REPORT (see Figure 3.43) is set to Yes. Selecting the Active Directory Group
option from this list box alone will not ensure you of generating an active directory group-wise
user report. To generate the active directory group-wise user report, you need to discover the
domains of the active directory groups in the first place. To know how to discover the domains
and configure the Active Directory Groups for which this report is to be generated, refer Section
3.8.
7.
Then, specify the Timeline for the graph. You can either provide a fixed time line such as 1 hour, 2 days, etc.,
or select the Any option from the list to provide a From and To date/time for report generation.
488
Citrix / VDI Reports
The default Timeline can be set using the CONSOLIDATED REPORTS page in the eG
administrative interface; to access this page, follow the menu sequence: Configure ->
Reports -> Consolidated. For more details regarding this page, refer to Section 3.4 of
this manual.
Shorter the Timeline for a report, lighter would be the query that is executed on the
database, and faster the report generation. Report Timelines that run across many
weeks therefore, cause excessive strain on the database, thus slowing-down report
generation. To save the eG backend from injury, eG Enterprise automatically restricts
the maximum Timeline for which a thin client report can be generated to the lower of
the following values:
the value of the CtxLoginTest parameter in the [DDD_CLEANUP] section of the
eg_format.ini file (in the <EG_INSTALL_DIR>\manager\config directory)
the value of the MaxTimeline parameter in the [MISC] section of the eg_report.ini file (in
the <EG_INSTALL_DIR>\manager\config directory).
The maximum timeline for which the current user to eG Reporter is permitted to
generate reports;
The [DDD_CLEANUP] section is where you define the interval (in days) at which the detailed
diagnosis of specific tests is to be purged from the database. For the CtxLoginTest, the
default interval is set to 32 days (i.e., just over a month), indicating that, by default, the
detailed diagnosis of the CtxLoginTest is cleared from the database at the end of every
month. Since critical thin client reports are generated based on the detailed diagnosis
information, a Timeline that exceeds the duration set against CtxLoginTest would result in a
report that displays invalid/no data. This duration however, is configurable. Similarly, you can
also configure a MaxTimeline in the [MISC] section of the eg_report.ini file. By default, this
parameter is set to 168 (hours), indicating that the maximum Timeline for a thin client report
is 1 week (i.e., 24 * 7 = 168 hours). Also, while creating user profiles using the eG
administrative interface, an administrator can indicate the maximum timeline for which that
user can generate reports, so as to avoid long running reports.
Now, assume that you have set the CtxLoginTest parameter to 21 days (i.e., 3 weeks) and
the MaxTimeline parameter to 336 hours (i.e., 2 weeks). Also, say that user john with access
rights to eG Reporter has been configured to generate reports for a maximum timeline of 1
week. Therefore, whenever user john logs into eG Reporter and attempts to generate a thin
client report, eG Enterprise compares the three values, picks the lowest of the three, and sets
that value as the maximum Timeline for thin client reports. In our example, the maximum
timeline settings of user john (i.e., 1 week) is the lowest Therefore, the maximum value that
will be available for selection from the Fixed Timeline list box in the thin client report page will
be 1 week.
Note that this timeline restriction does not apply to fixed timeline settings alone. If a user
chooses the Any option from the Timeline list and proceeds to provide a start date and end
date for report generation using the From and To specifications, eG Enterprise will first check
if the user's Timeline specification is equal to or below the lowest of the three values
discussed above. If not, report generation will fail. For instance, for a user who is allowed to
generate reports spanning over a maximum period of 3 days only, the difference between the
From and To dates should never be over 3 days. If it is, then, upon clicking the Run Report
button a message box will appear, prompting the user to change the From and To
specification.
489
Citrix / VDI Reports
8.
In addition to the settings discussed above, this report comes with a set of default specifications. These settings
are hidden by default. If you do not want to disturb these default settings, then you can proceed to generate
the report by clicking the Run Report button soon after you pick a User. However, if you want to view and then
alter these settings (if required), click on the
icon. The default settings will then appear in the MORE
OPTIONS drop down window (see Figure 10.10). The steps below discuss each of these settings and how they
can be customized.
Figure 10.10: The default settings for generating the User Session Details report
9.
Specify the start time and end time for report generation against the Time period field (see Figure 10.10).
The default Time period to be displayed here can be configured using the CONSOLIDATED
REPORTS page in the eG administrative interface; to access this page, follow the menu
sequence: Settings -> Reporter -> Consolidated Reports. For more details regarding this
page, refer to Section 3.4 of this manual.
10.
If the timeline specified for the report needs to exclude the data collected during the Weekends, then set
Exclude weekends to Yes. If not, select No.
You can configure the days of the week that need to be considered as a ‘weekend’ using the
CONSOLIDATED REPORTS page in the eG administrative interface; to access this page, follow
the menu sequence: Settings -> Reporter -> Consolidated Reports. For more details
regarding this page, refer to Section 3.4 of this manual.
11.
In large environments, reports generated using months of data can take a long time to complete.
Administrators now have the option of generating reports on-line or in the background. When a report is
scheduled for background generation, administrators can proceed with their other monitoring, diagnosis, and
reporting tasks, while the eG manager is processing the report. This saves the administrator valuable time. To
490
Citrix / VDI Reports
schedule background processing of a report, select the Background Save - PDF option from the Report
Generation list. In this case, a Report Name text box will appear, where you would have to provide the name
with which the report is to be saved in the background. To process reports in the foreground, select the
Foreground Generation - HTML option from this list.
The Report Generation list will appear only if the EnableBackgroundReport flag in
the [BACKGROUND_PROCESS] section of the eg_report.ini file (in the
{EG_INSTALL_DIR}\manager\config directory) is set to Yes.
The default selection in the Report Generation list will change according to the
Timeline specified for the report. If the Timeline set is greater than or equal to the
number of days specified against the MinDurationForReport parameter in the
[BACKGROUND_PROCESS] section of the eg_report.ini file, then the default selection
in the Report Generation list will be Background. On the other hand, if the Timeline
set for the report is lesser than the value of the MinDurationForReport parameter,
then the default selection in the Report Generation list will be Foreground. This is
because, the MinDurationForReport setting governs when reports are to be
processed in the background. By default, this parameter is set to 2 weeks - this
indicates that by default, reports with a timeline of 2 weeks and above will be
processed in the background.
12.
Finally, click the Run Report button to generate the report.
13.
If a specific user is chosen from the User list and the option chosen from the Report Generation list is
Foreground Generation - HTML, then, a report depicted by Figure 10.11 will appear upon clicking the RUN
REPORT BUTTON.
Figure 10.11: The User Session Details report
14.
The report consists of a SUMMARY section that displays the average and maximum duration for which the
specified user accessed the servers in the farm, and the values of the user-configured measures aggregated at
491
Citrix / VDI Reports
the farm-level. The SESSION DETAILS section of the report displays the user-configured measures along with
when and to which Citrix/Terminal/VDI/Hyper-V server the chosen user logged in and the duration of every
access. For Citrix and Terminal servers alone, the SESSION DETAILS section is followed by another section that
provides details of the disconnected sessions (if any) of the chosen user during the specified timeline. These
details include the exact time at which the eG agent reported the disconnect, the session ID corresponding to
the disconnected session, and the client type. Typically, when a user disconnects, the applications started by
the user will keep running on the server consuming resources. By providing the complete details of
disconnected sessions pertaining to a user, the User report enables administrators to identify times when the
resources available to the server were unnecessarily locked owing to disconnects, investigate the reasons
behind the disconnects, and endeavour to minimize these occurrences.
15.
From the User Report for a Citrix XenApp/MF XP server in particular, you can determine which applications in
the entire farm were excessively utilized by the given user, and which Citrix servers these applications are
executing on. To do so, click on the arrow against the Applications Accessed link in the SUMMARY section.
Figure 10.12 will then appear.
492
Citrix / VDI Reports
Figure 10.12: The top applications used by the chosen user
16.
The first section of Figure 10.12 provides a farm-level summary of the utilization of the applications. The second
section lists the servers in the farm, the applications executing on each of the servers, and the percentage of
time every application on that server was utilized.
17.
To return to the User Report click on the BACK button in Figure 10.12.
18.
Now, to receive a quick update on the health of any of the servers in the chosen Zone, simply click on the
493
Citrix / VDI Reports
corresponding Server hyperlink in the SESSION DETAILS section of the User Report. A Server Report will then
appear.
19.
Also, if the user report pertains to a Citrix/Microsoft RDS user (i.e., if the Component Type chosen for the report
is Citrix XenApp, Citrix MF XP, or Microsoft RDS), then, the Session Details section of the User Report will
include an Applications column. If you click on the
icon in the Applications column corresponding to a
Server in the Session Details section, you will view the detailed diagnosis of the resource (CPU and memory)
utilization of the individual applications (see Figure 10.13) on the Citrix/Terminal server.
Figure 10.13: Detailed diagnosis of the resource utilization of applications
20.
In addition to the above, the User Report also enables you to figure out how the user-configured measures
displayed in the SESSION DETAILS section performed during the period for which the user was accessing the
server. To achieve this, just click on the value of the measure against a Server in the SESSION DETAILS section.
A graph depicted by Figure 10.14 will then appear.
494
Citrix / VDI Reports
Figure 10.14: The graph of a user-configured measure
21.
Using the graph of Figure 10.14, administrators can determine whether the server has experienced any spikes
in resource usage during the user access. If so, then, this could indicate that the user was performing resourceintensive activities on the server, and could warrant a thorough investigation.
22.
If you have chosen All from the User list, the Active Directory Group is chosen from the Organize By list box
and the option chosen from the Report Generation list is Foreground Generation - HTML, then, a report depicted
by Figure 10.15 will appear upon clicking the Run Report button.
23.
The SESSION DETAILS section of the report displays the user-configured measures along with when and to which
Citrix/Terminal/VDI server the users of an Active Directory group logged in, the duration of their access and the
time. If the users are not part of any of the active directory groups, then the session details of such users will
be listed under the AD_NULL section.
495
Citrix / VDI Reports
Figure 10.15: The Active Directory group wise Thin client User report
24.
On the other hand, if the Background Save - PDF option is chosen from the Report Generation list, then clicking
on the Run Report button will not generate the report and display it in this page for your benefit. Instead, a
message indicating that the report is being processed in the background will appear. This will be accompanied
by a link that will lead you to the page that lists all the reports that are being processed in the background, and
their current status. If background report generation fails for a report, you can regenerate that report using this
page, or can even delete that report if need be. On the other hand, if background processing successfully
completes for your report, then, you can view a PDF of the report by clicking on the
icon in that page.
To configure the details that need to appear in the SUMMARY and SESSION DETAILS section of the report, edit the
[CITRIX_USER_REPORT] section of the eg_report.ini file in the <EG_INSTALL_DIR>\manager\config directory. For
example, you can specify the following in the above-mentioned section:
[CITRIX_USER_REPORT]
Citrix_MF_XP:CtxXpUserTest:Cpu_util#Cpu utilization=Avg,Max
Citrix_MF_XP:CtxXpUserTest:Mem_util#Mem util=Avg,Max
Citrix_MF_XP:CtxXpUserTest:Latency_avg=Avg,Max
From the above example, the following format can be inferred for the measure specification.
<InternalComponenttype>:<InternalTest>:<InternalMeasure>#<Display name of Measure>=<Comma-separated
list of functions>
Before proceeding with the configuration, determine the internal component-type, test, and measure names that you
intend using in your measure specification, using the procedure discussed in Page 212 of this manual.
496
Citrix / VDI Reports
Accordingly, in the first line of the example above:
Citrix_MF_XP is the <InternalComponenttype>
CtxXpUserTest is the <InternalTest>
Cpu_util is the <InternalMeasure>
Cpu utilization is the <Display name of Cpu_util>
If a display name is not provided for a measure, then the actual measure name will
automatically become the display name.
Avg and Max the functions that will be executed on the value of the Cpu_util measure.
By default, the Summary section will display only the average (Avg) values of the configured
measures. However, if specific function names are provided in the [CITRIX USER_REPORT]
section in the format discussed above, then such a specification will override the default
setting.
10.3 User Activity Report
In large thin client farms or virtual desktop environments, keeping track of the user activity on the servers of the
farm is a difficult task. Moreover it becomes too tedious to figure out which user is continuously engaged in the
maximum utilization of the resources. The USER ACTIVITY provides a solution for this. Using this report, you can
easily figure out the users who are consuming more resources on the server.
To generate the USER ACTIVITY report, do the following:
1.
Select the User Activity option from the Citrix / VDI Reports option of the REPORTS BY FUNCTION tree.
2.
Figure 10.16 will then appear. To monitor the servers in a farm, select the Zone to which the servers in the
farm have been added.
Figure 10.16: Selecting the criteria for the Thin Client - User Activity report
3.
Then, for generating the report on users associated with a particular component type, select a Component
497
Citrix / VDI Reports
Type.
4.
Select the components for which the report is to be generated from the Components list box. By default, all
components of the chosen Component Type will be selected from the Components list. If there are still too
many components in the list to choose from, you can narrow your search further by using the Search text box.
Specify the whole/part of the component name to search for in this text box, and click the
icon next to it.
The Components list will then be populated with all component names that embed the specified search string.
Select the component of your choice from this list.
5.
If the Components list consists of too many components, then viewing all the components and selecting the
ones you need for report generation could require endless scrolling. To avoid this, you can click the
button
next to the Components list. A COMPONENTS pop up window will then appear using which you can view almost
all the components in a single interface and Select the ones to be included in the top-n analysis easily.
6.
Next, select Graph from the Report Type field to generate a graphical report. For a data report, select the Data
option. If Graph option is selected, then an additional Graph Type list box will appear. By default, Distribution
option will be chosen from this list box.
7.
If Graph option is chosen as the Report Type and the Distribution option is chosen from the Graph Type text
box, then an additional Measure list box will appear in the report configuration section. This implies that across
all the servers of the chosen Component Type, the distribution of users will be represented graphically for the
chosen Measure. Likewise, if Data option is chosen as the Report Type, then a Based On Measure option will
appear which implies that the generated report will be sorted in descending order by default, based on the
chosen option.
8.
Specify the name of the user whose activity is to be monitored in the User text box. In large thin client
environments where hundreds of users are prevalent, the administrators do not prefer to generate a report on
the activity of a single user. In such a case, to generate a comprehensive report on the activity of all the users
of the thin client farm, specify * in this text box.
9.
By default, the report provides the details of only the Top-10 users’ activity in the chosen Component. You can
choose a different top-n / last-n option from the Show Top list, if need be.
By default, the values displayed in the Show list range from TOP-10 to LAST-10. This is
because, the Showtop parameter in the [INFOS] section of the eg_report.ini file (in the
<EG_INSTALL_DIR>\manager\config directory) is set to 10, by default. You can, if required,
configure the Show list to display a different range of options. For this, specify a different
number against the Showtop parameter, and save the eg_report.ini file.
10.
Specify the report Timeline. You can either provide a fixed time line such as 1 hour, 2 days, etc., or select the
Any option from the list to provide a From and To date/time for report generation.
498
Citrix / VDI Reports
For every user registered with the eG Enterprise system, the administrator can indicate the
maximum timeline for which that user can generate a report. Once the maximum timeline is
set for a user, then, whenever that user logs into eG Reporter and attempts to generate a
report, the Timeline list box in the report page will display options according to the maximum
timeline setting of that user. For instance, if a user can generate a report for a maximum
period of 3 days only, then 3 days will be the highest option displayed in the Timeline list i.e., 3 days will be the last option in the fixed Timeline list. Similarly, if the user chooses the
Any option from the Timeline list and proceeds to provide a start date and end date for
report generation using the From and To specifications, eG Enterprise will first check if the
user's Timeline specification conforms to his/her maximum timeline setting. If not, report
generation will fail. For instance, for a user who is allowed to generate reports spanning over
a maximum period of 3 days only, the difference between the From and To dates should
never be over 3 days. If it is, then, upon clicking the Run Report button a message box will
appear, prompting the user to change the From and To specification.
11.
In addition to the settings discussed above, this report comes with a set of default specifications. These settings
are hidden by default. If you do not want to disturb these default settings, then you can proceed to generate
the report by clicking the Run Report button soon after you pick an option from the Components list. However,
if you want to view and then alter these settings (if required), click on the
button. The default settings will
then appear in the MORE OPTIONS drop down window (see Figure 10.17). The steps below discuss each of
these settings and how they can be customized.
Figure 10.17: The default settings for generating the User Activity report
12.
Specify the start time and end time for report generation against the Time period field (see Figure 10.17).
13.
If the timeline specified for the report needs to exclude the data collected during the Weekends, then set
Exclude weekends to Yes. If not, select No.
499
Citrix / VDI Reports
By default, the weekend constitutes Saturday and Sunday. To override this default setting,
do the following:
Edit the eg_report.ini file in the <EG_INSTALL_DIR>\manager\config directory.
In the [MEASURE_GROUP] section of the file, the EXCLUDE_WEEKEND parameter is
set to Saturday,Sunday by default. You can modify this by setting the
EXCLUDE_WEEKEND parameter to a comma-separated list of other days of the week
- say Friday,Saturday.
Save the file after making the required changes.
14.
Using the Weighted Average flag, you can indicate how the Avg value is to be computed for a chosen measure
for the purpose of this report. The status of the Weighted Average flag is relevant only if the Test chosen is a
descriptor-based test, and the descriptors are dynamic in nature. For instance, the Citrix Users test in our
example auto-discovers the users who are currently active on a Citrix XenApp farm. For each user who has
logged into the Citrix XenApp, the test reports a variety of statistics. Unlike descriptors such as disk partitions or
processors that rarely change, the users are dynamic descriptors, which may change often; in other words, a
user who is logged in currently, may opt to log out and may not login at all during the next measurement
period. The Citrix Users test will neither report metrics for the inactive descriptors nor display it in the eG
monitoring console. This is why, users in the Citrix Users test are considered ‘dynamic descriptors’.
15.
By default, this report compares the Avg value of the chosen measure across all selected descriptors. Since the
Weighted Average flag is set to No by default, this Avg is computed as the ratio of the sum total of the measure
values reported by a descriptor during the given timeline and the total number of times the test is executed
during the same timeline. In case of dynamic descriptors however, the Avg values so computed may not reveal
the ‘true picture of performance’. This is because, the test may not discover or report metrics for dynamic
descriptors throughout a given timeline. For example, take the case of the Citrix Users test. Say, two users namely, ‘A’ and ‘B’ have logged into the Citrix XenApp server. During its first measurement period; the CPU
Utilization for a user session is registered as 2% and 8% respectively. Assume that the second time the Citrix
Users test ran, it captured 5% as the CPU Utilization of user ‘A’. User ‘B’ however was inactive during the
second measurement period, and hence, was not discovered at all. If the Weighted Average flag is set to No by
default, then, this report will plot the Avg value of 4% (3+5=8/2=4) for user ‘A’ and 4% (8/2=4) again for user
‘B’. If you notice, unlike user ‘A’, where 8% of CPU was utilized over a period of time, in case of user ‘B’, 8% of
CPU was utilized at one shot! Logically therefore, user ‘B’ has to be ranked above user ‘A’ in terms of CPU
utilization. However, since the default Avg value computation does not clearly bring out this difference, both
user ‘A’ and ‘B’ are treated at par in this report! This is why, in case of dynamic descriptors, you may want to
set the Weighted Average flag to Yes. In this case, the eG Enterprise system expresses Avg as the ratio of the
sum total of the measure values reported by a descriptor during a given timeline and the ‘total number of times
that descriptor was active’ during the same timeline. This implies that if the Weighted Average flag is set to Yes
in the