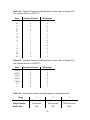
1
Polyimide-Organosilicate Hybrid Materials Part I: Effects of Annealing on Gas Transport Properties Part II: Effects of CO2 Plasticization Christopher L. Hibshman Department of Chemical Engineering Virginia Polytechnic Institute and State University Blacksburg, VA 24060-0211 A Thesis submitted to the faculty of Virginia Polytechnic Institute and State University in partial fulfillment of the requirements for the degree of Master of Science In Chemical Engineering APPROVED: Dr. Eva Marand, Chair Dr. Richey Davis Dr. Ravi Saraf May 3, 2002 Blacksburg, VA 24060 Keywords: Gas Separations, Inorganic Membranes, Composite Membranes, Organosilicate, Polyimide 2002 Christopher Hibshman Abstract The objective of this study was to examine the effects of annealing polyimide-organosilicate hybrid membranes on gas transport. In addition, the effects of carbon dioxide pressure on the gas transport of unannealed polyimideorganosilicate hybrid membranes were evaluated. The membranes in both studies consisted of sol-gel derived organosilicate domains covalently bonded to a 6FDA-6FpDA-DABA polyimide using partially hydrolyzed tetramethoxysilane (TMOS), methyltrimethoxysilane (MTMOS) or phenyltrimethoxysilane (PTMOS). The first study subjected the hybrid membranes to a 400°C annealing process to enhance gas separation performance by altering the organosilicate structures. The hybrid membranes were evaluated before and after annealing using pure gases (He, O2, N2, CH4, CO2) at 35°C and a feed pressure of 4 atm. The permeability for most of the membranes increased 200-500% after the annealing process while the permselectivity dropped anywhere from 0 to 50%. The exceptions were the 6FDA-6FpDA-DABA-25 22.5 wt% TMOS and MTMOS hybrid membranes, both of which exhibited increases in the CO2 permeability and CO2-CH4 permselectivity. The increase in permeation was attributed to increases in the free volume and enhanced segmental mobility of the chain ends resulting from the removal of sol-gel condensation and polymer degradation byproducts. ii For the second study, the transport properties of four membranes, 6FDA6FpDA polyimide, 6FDA-6FpDA-DABA polyimide, MTMOS and PTMOS-based hybrid materials, were characterized as a function of feed pressure to evaluate how the hybrid materials reacted to CO2 plasticization. Steady-state gas permeation experiments were performed at 35°C using pure CO2 and CH4 gases at feed pressures ranging from 4 to 30 atm. All four materials exhibited dual mode sorption up to feed pressures of 17 atm, at which point the effects of CO2 plasticization were observed. iii Format of Thesis The format of Chapters 3 and 4 is in the form of two separate technical papers. Both chapters focus on characterizing the polyimide-organosilicate hybrid materials synthesized by Dr. Chris J. Cornelius.1-4 Chapter 3 corresponds to the effects of annealing a series of polyimide-organosilicate hybrid membranes on gas transport properties. Chapter 4 studies the effects of feed pressure on gas transport properties of unannealed hybrid membranes. These particular hybrid systems were chosen due to their optimum gas transport properties based on previous characterization.1-4 iv Acknowledgements This project would not have been feasible without the loving support of my wife, Michelle. She always seemed to know the right advice and words of encouragement at the right time and was always there when I need her most. I am especially grateful for the patience, understanding, and extensive efforts of my advisor, Dr. Eva Marand. She always seemed to offer me assistance when I needed it most. Without her encouragement and support, I would not have gotten my Master’s degree from Virginia Tech. I also want to express thanks to Chris Cornelius for his patience in answering my many questions. Thanks also to Todd Pechar for being a sounding board and helpful labmate. I would also like to thank the North American Membrane Society for financial support via an undergraduate research fellowship. I am also deeply indebted to Steve McCartney for his assistance with the TEM images. In addition, many thanks are extended to David Williamson and Koji Yamauchi from the Department of Chemistry at Virginia Tech for assistance with the TGA-MS. v Table of Contents Abstract............................................................................................................... ii Format of Thesis ............................................................................................... iv Acknowledgements............................................................................................ v List of Figures.................................................................................................. viii List of Tables ..................................................................................................... xi Chapter 1 Literature Review ......................................................................... 1 1.1 Introduction ............................................................................................ 1 1.2 Gas Transport through Polymeric Membranes ..................................... 2 1.3 Solution-Diffusion Model ....................................................................... 3 1.4 Time Lag Method .................................................................................. 4 1.5 Dual Mode Sorption Theory .................................................................. 9 1.6 Gas Transport through Hybrid Membranes......................................... 12 1.7 CO2 Plasticization Theory ................................................................... 14 1.8 Organic-Inorganic Membranes using Sol-Gel Chemistry .................... 18 1.9 Polymer-Organosilicate Hybrid Materials ............................................ 21 1.10 Annealing Polyimide-Organosilicate Hybrid Membranes .................... 24 Chapter 2 Experimental .............................................................................. 26 2.1 Membrane Materials ........................................................................... 26 2.2 Annealing Procedure .......................................................................... 29 2.3 Gas Permeation – General Information .............................................. 29 2.4 Gas Permeation - Equipment.............................................................. 30 2.5 Gas Permeation - Cell......................................................................... 32 2.6 Gas Permeation - Volume of permeate side ....................................... 34 2.7 FTIR-ATR............................................................................................ 36 2.8 Thermogravimetric Analysis – Mass Spectrometry ............................. 36 2.9 Density Measurements ....................................................................... 36 vi Chapter 3 Annealing Polyimide-Organosilicate Hybrid Membranes ....... 38 3.1 Abstract............................................................................................... 38 3.2 Visual Observations ............................................................................ 39 3.3 TGA-MS .............................................................................................. 39 3.4 FTIR-ATR............................................................................................ 43 3.5 Swelling Studies.................................................................................. 48 3.6 TEM Studies ....................................................................................... 50 3.7 Gas Transport ..................................................................................... 51 3.8 Gas Transport – Pure Polyimide ......................................................... 59 3.9 Gas Transport – Hybrid Materials ....................................................... 60 3.10 Effects of Annealing ............................................................................ 65 Chapter 4 Effects of Feed Pressure on Gas Transport ............................. 71 4.1 Abstract............................................................................................... 71 4.2 Results and Discussion....................................................................... 72 Chapter 5 Recommendations..................................................................... 81 5.1 Future Work ........................................................................................ 81 5.2 References.......................................................................................... 83 Appendix LABTECH NOTEBOOK Software .............................................. 89 A.1 General Information ............................................................................ 89 A.2 Systems .............................................................................................. 89 A.3 Computer Architecture ........................................................................ 90 A.4 bld_nb.exe Program............................................................................ 91 A.5 Main Menu .......................................................................................... 91 A.6 Description of Buttons – Left Side....................................................... 93 A.7 Description of Blocks – Bottom of Screen ........................................... 94 A.8 batchrun.exe Program (Batchrun)..................................................... 103 A.9 Main Menu ........................................................................................ 103 A.10 Buttons .......................................................................................... 103 A.11 Testing Consecutive Gases........................................................... 104 Vitae................................................................................................................. 106 vii List of Figures Figure 1.1. Sample results from a gas permeation test using the Time Lag Method. ................................................................................................................ 6 Figure 1.2. A plot illustrating the permeability as a function of pressure for a material that has been plasticized (adapted from Sanders et al.28). For comparison, typical results from the Dual Mode Sorption Theory are shown. The pressure at which the upswing occurs varies widely from polymer to polymer... 17 Figure 2.1. Chemical structures of TMOS, MTMOS, and PTMOS.................... 27 Figure 2.2. Chemical structure of the 6FDA-6FpDA-DABA polyimide functionalized with APTEOS (blue). The DABA group is highlighted in red. The 6FDA-6FpDA repeat unit is highlighted in green. ............................................... 28 Figure 2.3. Schematic diagram of the permeation system. All valves and pressure transmitters are interfaced with a computer......................................... 31 Figure 2.4. Cross-sectional schematic diagram of gas permeation cell............ 33 Figure 2.5. Schmeatic diagram of measuring permeate volume using an ideal gas. .................................................................................................................... 35 Figure 3.1. TGA-MS spectra for 6FDA-6FpDA-DABA-25 pure polyimide degradation. Intensity units are arbitrary. .......................................................... 41 Figure 3.2. TGA-MS spectra for 6FDA-6FpDA-DABA-25 22.5wt% PTMOS hybrid material. Intensity units are arbitrary....................................................... 41 Figure 3.3. FTIR-ATR spectra of 6FDA-6FpDA-DABA-25 pure polyimide. Shading highlights areas of change after the annealing process. ...................... 44 Figure 3.4. FTIR-ATR spectra of 6FDA-6FpDA-DABA-25 - 22.5% MTMOSbased hybrid. Shading highlights areas of change after the annealing process. 44 Figure 3.5. FTIR-ATR spectra of 6FDA-6FpDA-DABA-25 22.5% TMOS-based hybrid. Shading highlights areas of change after the annealing process............ 45 Figure 3.6. FTIR-ATR spectra of the 6FDA-6FpDA-DABA-25 22.5% PTMOS. Shading highlights areas of change after the annealing process. ...................... 45 Figure 3.7. Thermal/hydrolytic degradation of anhydrides.48 ............................ 46 Figure 3.8. TEM images of 22.5% MTMOS-based hybrid material before and after the 400°C anneal for 30 minutes................................................................ 50 Figure 3.9. Boundary diagrams of 6FDA-6FpDA-DABA-25 pure polyimide and hybrid materials for He-O2. The line represents Robeson’s 1991 “Upper Bound”.7 The blue symbols represent unannealed membranes and red symbols represent annealed membranes......................................................................................... 54 Figure 3.10. Boundary diagrams of 6FDA-6FpDA-DABA-25 pure polyimide and hybrid materials for He-N2. The line represents Robeson’s 1991 “Upper Bound”.7 The blue symbols represent unannealed membranes and red symbols represent annealed membranes......................................................................................... 54 Figure 3.11. Boundary diagrams of 6FDA-6FpDA-DABA-25 pure polyimide and hybrid materials for He-CH4. The line represents Robeson’s 1991 “Upper Bound”.7 The blue symbols represent unannealed membranes and red symbols represent annealed membranes. ....................................................................... 55 viii Figure 3.12. Boundary diagrams of 6FDA-6FpDA-DABA-25 pure polyimide and hybrid materials for O2-N2. The line represents Robeson’s 1991 “Upper Bound”.7 The blue symbols represent unannealed membranes and red symbols represent annealed membranes......................................................................................... 55 Figure 3.13. Boundary diagrams of 6FDA-6FpDA-DABA-25 pure polyimide and hybrid materials for CO2-CH4. The line represents Robeson’s 1991 “Upper Bound”.7 The blue symbols represent unannealed membranes and red symbols represent annealed membranes. ....................................................................... 56 Figure 3.14. Boundary diagrams of 6FDA-6FpDA-DABA-12 pure polyimide and hybrid materials for He-O2. The line represents Robeson’s 1991 “Upper Bound”.7 The blue symbols represent unannealed membranes and red symbols represent annealed membranes......................................................................................... 56 Figure 3.15. Boundary diagrams of 6FDA-6FpDA-DABA-12 pure polyimide and hybrid materials for He-N2. The line represents Robeson’s 1991 “Upper Bound”.7 The blue symbols represent unannealed membranes and red symbols represent annealed membranes......................................................................................... 57 Figure 3.16. Boundary diagrams of 6FDA-6FpDA-DABA-12 pure polyimide and hybrid materials for He-CH4. The line represents Robeson’s 1991 “Upper Bound”. 7 The blue symbols represent unannealed membranes and red symbols represent annealed membranes. ....................................................................... 57 Figure 3.17. Boundary diagrams of 6FDA-6FpDA-DABA-12 pure polyimide and hybrid materials for O2-N2. The line represents Robeson’s 1991 “Upper Bound”. 7 The blue symbols represent unannealed membranes and red symbols represent annealed membranes......................................................................................... 58 Figure 3.18. Boundary diagrams of 6FDA-6FpDA-DABA-12 pure polyimide and hybrid materials for CO2-CH4. The line represents Robeson’s 1991 “Upper Bound”.7 The blue symbols represent unannealed membranes and red symbols represent annealed membranes. ....................................................................... 58 Figure 3.19. Normalized permeability as a function of molecule size for the 6FDA-6FpDA-DABA-25 polyimide based membranes. Pure polymer refers to pure 6FDA-6FpDA-DABA-25 polyimide. Panneal is the measurement of an annealed membranes. Po is the measurement of an unannealed membrane. .. 67 Figure 3.20. Normalized permeability as a function of molecule size for the 6FDA-6FpDA-DABA-12 polyimide based membranes. Pure polymer refers to pure 6FDA-6FpDA-DABA-12 polyimide. Panneal is the measurement of an annealed membranes. Po is the measurement of an unannealed membrane. .. 67 Figure 3.21. Normalized ideal selectivity as a function of molecule size difference for the 6FDA-6FpDA-DABA-25 polyimide based membranes............................ 68 Figure 3.22. Normalized ideal selectivity as a function of molecule size difference for the 6FDA-6FpDA-DABA-12 polyimide based membranes. (P1/P2)anneal is the measurement for annealed membranes. (P1/P2)o is the measurement for unannealed membranes. Subscripts 1 and 2 refer to different gases. The molecule size difference is measured as the difference in kinetic diameters for the selected gas pair. The dashed line represents no change with annealing. . 68 Figure 4.1. Chemical structure of 6FDA-6FpDA and 6FDA-6FpDA-DABA polyimides. ......................................................................................................... 72 ix Figure 4.2. Plot of pure CH4 permeability as a function of feed pressure for various polyimide and hybrid systems at 35°C. The permeabilities were calculated using the appropriate feed pressure. Error = ±2%............................ 73 Figure 4.3. Plot of pure CO2 permeability as a function of feed pressure for various polyimide and hybrid systems at 35°C. The permeabilities were calculated using the appropriate fugacity. Error = ±2%. .................................... 73 Figure 4.4. CO2/CH4 ideal selectivity plotted as a function of feed pressure for various polyimide and hybrid systems at 35°C. Error = ±4%............................. 74 Figure 4.5. Plot of pure CH4 diffusivity as a function of feed pressure for various polyimide and hybrid systems at 35°C. The values were calculated using the appropriate feed pressure. ................................................................................. 78 Figure 4.6. Plot of pure CO2 diffusivity as a function of feed pressure for various polyimide and hybrid systems at 35°C. The values were calculated using the appropriate fugacity............................................................................................ 78 Figure 4.7. Plot of pure CH4 solubility as a function of feed pressure for various polyimide and hybrid systems at 35°C. The values were calculated using the appropriate feed pressure. ................................................................................. 79 Figure 4.8. Plot of pure CO2 solubility as a function of feed pressure for various polyimide and hybrid systems at 35°C. The values were calculated using the appropriate fugacity............................................................................................ 79 x List of Tables Table 3.1 Summary of Tg and 5% weight loss temperatures for 6FDA-6FpDADABA-25 pure polyimide and hybrid materials. .................................................. 40 Table 3.2. Summary swelling measurements in NMP for 6FDA-6FpDA-DABA-25 and 6FDA-6FpDA-DABA-12.5 hybrid materials. Surface area to volume ratio is ~128. Amount of NMP is 200 grams for every gram of sample. Error ~10%.... 49 Table 3.3. Summary of Permeability, Diffusivity and Solubility coefficients for 6FDA-6FpDA-DABA-25 hybrid materials. Evaluated at 35°C and 4 atm (absolute). Overall error ~5% for permeability................................................... 52 Table 3.4. Summary of Permeability, Diffusivity and Solubility coefficients for 6FDA-6FpDA-DABA-12.5 hybrid materials. Evaluated at 35°C and 4 atm (absolute). Overall error ~5% for permeability................................................... 53 Table 3.5. Summary of density measurements before and after annealing. All measurements were evaluated at 25°C. Relative error ~1.0%.......................... 63 Table 4.1. Swelling data for the polyimides and polyimide-organosilicate hybrid materials. Both hybrid materials consist of an organosilicate covalently bonded to a 6FDA-6FpDA-D7ABA polyimide matrix. With the exception of the MTMOSbased hybrid, all materials swelled to such a degree that measurements were not possible. ............................................................................................................. 74 xi Chapter 1 1.1 Literature Review Introduction During the past two decades, gas separations using polymeric membranes have gained ground in the chemical process industry. Separations employing membranes include natural gas sweetening, oxygen enrichment and hydrogen recovery from ammonia purge gases.5-6 Typically, smaller gas molecules will diffuse through a polymer membrane, selectively leaving the larger molecules behind. Polymeric membranes are favored over inorganic membranes due to relative ease and low cost of processing. In addition, polymers can be spun into hollow fibers, which maximize the surface area to volume ratio. On the down side, polymers exhibit a trade-off between permeability and selectivity.7 They also loose their performance at high temperatures, high pressures and harsh chemical environments. In constrast, inorganic membranes, such as zeolites or molecular sieves, have excellent gas separation properties and durability. However, manufacturing these materials into high-surface area membranes is very difficult and expensive. 1 Recently, several groups have combined inorganic domains into a polymer matrix to form hybrid materials in attempts to combine the excellent gas separation properties of the inorganic materials with the processing properties of the polymeric materials.8-11 C. J. Cornelius et al. recently synthesized and characterized a series of fluorinated polyimide-organosilicate hybrid membranes.1-4 This project uses those same materials, but focuses on annealing the hybrid materials at 400°C to enhance the gas transport properties of the organosilicate domains, which need to be calcined at very high temperatures to maximize their performance. In addition, the effects of CO2 plasticization on these hybrid materials are unknown and need to be investigated. 1.2 Gas Transport through Polymeric Membranes The Solution-Diffusion Model is the principal model for describing gas diffusion through polymeric materials.5-6 The Time-Lag Method can be used to calculate the permeability, diffusivity and solubility coefficients through rubbery polymers.12 For glassy polymers, describing the diffusion of gas is more complex because the molecule chains are not at a state of equilibrium. Some common models for diffusion in glassy polymers include Dual Mode Sorption Theory and Free Volume Theory. All of these models will be discussed in this review. 2 1.3 Solution-Diffusion Model The Solution-Diffusion Model is a widely accepted concept used to calculate the flux through a membrane.5-6 This model recognizes three stages to the diffusion of gas molecules. First, the penetrant molecule dissolves in the polymer on the upstream side, then it diffuses across the membrane via a concentration gradient and finally it desorbs from the downstream side.5-6 Dialysis, reverse osmosis, pervaporation, and gas permeation can all be explained by this model. The Solution-Diffusion Model is expressed in terms of the chemical potential gradient, which can be thermodynamically related to temperature, pressure, and concentration. For the case of gas permeation, the chemical potential is related to the gas concentration gradient within the membrane. Transient diffusion through a uniform slab can be described using Fick’s First Law ∂C J = -D(C) , ∂x (1.1) where J is the flux (cm3 @STP / cm2 s), D is the diffusion coefficient (cm2 /s), C is the concentration of the gas in the polymer (cm3 @STP / cm3), and x is the thickness of the membrane (cm). Diffusion is only in the x-direction, assuming the concentration gradients in the other directions are negligible. Assuming D is independent of temperature and that the concentration obeys Henry’s Law, Equation 1.1 simplifies to ∂p J = -DS , ∂x (1.2) 3 where S is the solubility coefficient. At steady-state, Equation 1.2 simplifies can be written as p − pp , J s = D × S f l (1.3) where Js is the flux at steady-state, pf is the feed pressure, pp is the permeate (downstream) pressure, and l is the thickness of the membrane. Thus the permeability, P, defined as the product D and S,5,13 can be substituted into Equation 1.3, resulting in f − fp pf − pp . =P f J s = P l l (1.4) To model real gases, the fugacity of the gas, f, may replace the pressures as shown in Equation 1.4. This would be particularly important at pressures approaching non-ideal conditions. 1.4 Time Lag Method The Time Lag Method allows one to determine the permeability (P), solubility (S), and diffusivity (D) coefficients.12 The time lag is simply the amount of time required for a gas to permeate through a membrane. The integral technique was used in this research, which measures the accumulation of the permeate gas (pressure) as a function of time. Typical results for this method are illustrated in Figure 1.1. The data is separated into two sections, the first region representing transient diffusion and the second steady-state diffusion. 4 The time lag is defined as the extrapolation of the steady-state region to the x-intercept, as indicated by the θ in Figure 1.1. The flux can be written in terms of the slope of the steady-state region, which is represented in Equation 1.5. Js = Slope V × RT A 22414 cm 3(STP) , mol (1.5) R is the gas constant, T is the temperature, V is the permeate volume, and A is the active area of diffusion.12 Equations 1.4 and 1.5 can be combined to express P as a function of the slope of steady-state diffusion, as shown in Equation 1.6. Notice that P is normalized to the differential pressure and membrane thickness. P = Slope V × RT A 22414 cm 3(STP) l . × p f − pp mol (1.6) One assumption for this method is that the permeate pressure, pp, remains negligible throughout the entire permeation process. If permeate pressure is not negligible, the flux will begin to level off as a function of time and a different boundary condition will need to be specified, resulting in a complex relationship.14 Typical units to represent the permeability coefficient are barrers, which are defined in Equation 1.7. 1 barrer = 10 −10 cm 3 (STP) ⋅ cm cm 2 ⋅ s ⋅ cmHg (1.7) 5 2.5 Pressure (cmHg) 2 1.5 Unsteady-state 1 Steady-state θ 0.5 0 0 2000 4000 6000 8000 Time (seconds) Figure 1.1. Sample results from a gas permeation test using the Time Lag Method. 6 The diffusion coefficient can be calculated from the time lag using a derivation of Fick’s Second Law, which is shown in Equation 1.8. ∂C ∂ 2C = D 2 ∂t ∂x (1.8) The following boundary condition are imposed to solve Equation 1.8: t<0 0≤x≤l t≥0 x=0 Cf = Spf = constant t≥0 x=l C=0 C=0 Applying these boundary conditions results in Equation 1.9, where Q is the total amount of gas permeating through the membrane, Cf is the concentration at the feed side and t is time. This equation models one-dimensional flow through a membrane assuming that D is independent of temperature and concentration. Dn 2ð 2 t Q Dt 2 ∞ ( − 1 ) n = 2 − 2 Ó exp − 2 l C2 l ð n =1 n 2 l (1.9) When t is allowed to go to infinity, thereby representing steady-state diffusion, the summation in Equation 1.9 approaches 1/6 and is simplified to Q Dt 1 = 2 − . l C2 6 l (1.10) Rearrangement of Equation 1.10 results in Q= DC 2 l l 2 DC 2 t − = (t −è ) l 6D 7 (1.11) where θ = l2/6D. This provides a direct route for calculating the diffusion coefficient. Knowing P and D, and that P = D × S, the solubility coefficient (S) can be calculated using Equation 1.12 P D S = (1.12) However, due to the nonequilibrium properties associated with all glassy polymers and heterogeneous systems, it is necessary to designate these transport properties as effective properties. In summary, Slope V × RT A P = D eff = S eff = 22414 cm 3(STP) l (1.13) × mol p f − pp l2 6è (1.14) P Deff (1.15) In addition, for pure gas permeation experiments, ideal selectivity is defined as α *= PA . PB (1.16) Perry et al. have explored the theoretical effects of incorporating nonpermeable inclusions into a polyimide matrix on the diffusive time lag by incorporating mica flakes into a polycarbonate film.15 They demonstrated that the mica flakes must be oriented perpendicular to the gas flow in order to create a tortuous path for the diffusion of the gas penetrants. In addition, they presented a theoretical model relating the mica loading and size of flakes to increases in diffusion time lag, which correlated well with experimental data. The model is shown in Equation 1.17. 8 θ (with flakes ) = θ (without flakes) × (α )2 × (φ ) 2 (1.17) θ is the time lag, α is the aspect ratio of the flakes, and φ is the volume % of flakes in the polymer. For example, using Equation 1.17 with a mica loading of 30% and size aspect ratio of 20, the diffusion time lag can be increased nearly 36 times. These results were attributed mainly to increasing the tortuousity of the path of diffusion and illustrate that the diffusion time lag can be altered by the presence of inclusions in the polymer. These particular results are promising for improving barrier membranes. In a separate study, Paul and Kemp examined the effects of adsorptive but non-permeable zeolites in a silicone rubber.16 The diffusion time lag increased with increasing zeolite concentration, as expected. These observations were mainly attributed to the adsorptive capabilities of the zeolite filler materials, which correlated well with theoretical estimates. More importantly, the filler materials had only minor effects on the steady-state permeability measurements. To date, no theoretical models have been developed for predicting the time-lag in heterogeneous systems consisting of permeable filler materials in a permeable matrix. 1.5 Dual Mode Sorption Theory The equations presented so far are based on the assumption that concentration is independent of temperature and pressure. If this were true, a 9 plot of permeability versus feed pressure should be constant. However, experimental observations have shown that permeability decreases with increasing feed pressure for most glassy polymers. Although no theoretical model has been developed to fully explain this behavior, an empirical model, known as Dual Mode Sorption Theory was developed to fit the data.16-19 Dual Mode Sorption Theory describes the heterogeneity of glassy polymers by accounting for two contributions of sorption in a membrane. One contribution follows Henry’s Law, which accounts for the mobile gas molecules “dissolved” into the amorphous polymer matrix. The other contribution is associated with the Langmuir isotherm, which accounts for the gas molecules adsorbing into free volume “holes”, where the gas penetrants are assumed immobilized. These two contributions can be added to form equation 1.18, C = CD + CH = k D p + (C' H bp) , (1 + bp) (1.18) where kD is Henry’s law constant, b is the hole affinity constant, C’H is the concentration in the holes at saturation and p is the partial pressure of penetrant in the gas phase. These constants are determined empirically to represent data collected from sorption isotherms. To employ the Dual Mode Sorption Theory experimentally, the parameters C’H and b are calculated using equilibrium sorption isotherms for a specific glassy polymer. Using equation 1.18, the solubility coefficient, S=kD, can be determined. The permeability coefficient, P, is determined via a steady-state permeation test (see Solution-Diffusion Model) and the diffusivity coefficient is defined as D = P / S (see Equation 1.12). This model has been fairly effective at 10 describing the transport of gases through glassy polymers. However, this model does have its limitations. In particular, real polymer systems are dynamic, which leads to variations that cannot be explained with the Dual Mode Sorption Theory. One of these variations is the partial or incomplete immobilization of gas penetrant molecules. D. R. Paul et al. investigated the validity of assuming that the gas penetrant molecules are immobilized in the “holes” of a glassy polymer.16,19-20 They predicted that if total immobilization occured, the permeability would be constant with increasing pressure. If the gas penetrant molecules were not completely immobilized, the permeability would decrease with pressure increases.20 Another deviation stems from the assumption of equilibrium testing using glassy polymers that are inherently in a state of nonequilibrium. The Free Volume Theory has been employed to predict the diffusion coefficient of polymers. Pace and Datyner developed a simple model using four parallel chains to form a cage around a gas molecule.21 The gas molecule will “jump” from cage to cage provided a sufficient activation energy is available to make this diffusive jump. The theoretical relationship for this model is shown in Equation 1.20, where ED is the activation energy required for the diffusive jump, σ is the diameter of the gas molecule and CED is the cohesive energy density of the polymer. λ is the jump length, which needs to be estimated since there is no empirical methods for determining its magnitude. λπσ 2 ED = CED 4 (1.20) 11 The limitation of this model is the parameters are difficult to determine experimentally and do not apply to heterogeneous hybrid systems. Other models, such as Non-Equilibrium Lattice Theory, and Activated Complex Theory, attempt to describe gas transport through glassy polymers using statistical mechanics, non-equilibrium thermodynamics, and structural arguments.22 These models each have their advantages but are difficult to apply to heterogeneous systems, such as the hybrid materials used for this study. 1.6 Gas Transport through Hybrid Membranes For our hybrid materials, we have inherent heterogeneity in the glassy polyimide in addition to the heterogeneity due to the organosilicate networks. Needless to say, both the Time-Lag Method and the Dual Mode Sorption Theory have to be applied with caution when describing the gas transport through these hybrid membranes. For example, the Time-Lag Method was originally developed for rubbery polymers. Dual Mode Sorption Theory describes glassy polymers based on only two methods of sorption, whereas I have identified at least four methods of sorption for these hybrid systems: i) gas molecules “dissolved” into the amorphous polymer matrix (Henry’s Law) ii) gas molecules adsorbing in to “holes” in the glassy polymer (Langmuir) iii) gas molecules adsorbing in to “holes” in the organosilicate network and iv) and gas molecules adsorbing in to “holes” at the polyimide- organosilicate interface. With so many unknown variables, sorption isotherms will provide little information pertaining to the mode of 12 transport in these membranes. Therefore, we have focused on transient permeation testing whose analysis assumes that sorption simply follows Henry’s Law with a solubility coefficient averaged over the matrix and the organosilicate network. The Time Lag Method was chosen to for this project based upon its sound fundamental basis and ease of data collection. I believe that the values of permeability are accurate for these hybrid membranes, although the diffusivity and solubility coefficients are not exact in absolute terms. This assumption stems from a study done by Paul and Kemp, who concluded that increasing filler content will cause very large increases in the time lag but will exhibit only minor effects on the steady-state permeability for a rubbery polymer containing adsorptive filler materials.16 In a separate study, Zimmerman et al. compared the diffusion coefficients determined by various experimental techniques and concluded that the Time Lag Method did not accurately represent the true diffusion coefficient.23 However, the ratios giving diffusivity selectivity were comparable with those measured by other methods. I believe that the solubility and diffusion coefficients from permeability measurements are useful for making qualitative comparisons between the materials before and after the annealing process. To compare the performance of these materials, the permeability and selectivity will be plotted on a boundary diagram, as founded by L.M. Robeson.7 In 1991, Robeson conducted an extensive literature search and plotted the tradeoff between ideal gas selectivity and gas permeability of polymers for 13 several gas pairs (He, H2, O2, N2, CH4, CO2).7 He concluded there was an empirical “upper bound” to the trade-off and that most commercially viable membranes need to surpass this bound in performance. In 1998, B. Freeman substantiated Robeson’s upper bound with a theoretical explanation relating the slope of the line to molecular parameters, such as molecule size, interchain spacing and polymer backbone stiffness.24 The theoretical model was not a perfect fit with the empirical upper bound, but the fundamental and simple theory did merit an upper bound for simple gas pairs. 1.7 CO2 Plasticization Theory The concept of CO2 plasticization is widely used to explain experimental observations of CO2 transport through polymeric membranes. Such experimental observations tend to vary depending upon the properties of the polymer, such as morphology, backbone rigidity, chemical structure, and degree of crosslinking. For example, empirical results show that the effects of plasticization on gas transport tend to be weak for flexible-chain (rubbery) polymers, but stronger for rigid-chain (glassy) polymers.25-27 It is believed that the microheterogeneity of glassy polymers accounts for the stronger interactions with the plasticizing agent. Another common effect is the swelling of polymer matrix, which simultaneously increases free volume of the polymer matrix and segmental mobility. Both of these inter-related parameters strongly influence gas transport by increasing the diffusivity and therefore the permeability of the 14 membrane. Additionally, the glass transition temperature is observed to decrease during plasticization. CO2 plasticization can usually be identified by plotting the CO2 permeability as a function of feed pressure for a given membrane.28-30 As illustrated in Figure 1.2, at low pressures an initial decrease in gas permeability with increasing feed pressure was observed, which would be consistent with dual mode transport theory. At higher pressures, if the CO2 permeability increases dramatically with increasing feed pressure, then the polymer is considered plasticized. The minimum pressure on the curve is considered the plasticization pressure. Wessling et al. noted another interesting phenomenon of CO2 plasticization, namely that the permeability of a plasticized glassy polymer is not constant, but increases with time.31 However, eventually the system will reach an equilibrium state. Below the plasticization pressure the penetrant molecules loosened the short chain segments, but above the plasticization pressure long chain rearrangements were enabled by the plasticizing agent loosening more dense entanglements.31 Typically, the presence of plasticization during gas transport will decrease the selectivity of the gas separation. Therefore, to optimize gas separation performance in the presence of a plasticizing agent, it is imperative to minimize the degree of plasticization in the membranes. To accomplish this task typically requires modification of the polymer membrane. For example, Krol et al. thermally annealed a non-crosslinked aromatic polyimide (Matrimid® 5218) below 15 Tg to form charge transfer complexes, which restricted chain mobility and the effects of plasticization.32 Crosslinking the polymer is another technique for suppressing CO2 plasticization. Unfortunately, a decrease in permeability usually accompanies increases in crosslinking.5 Bos et al. have blended a polyimide (Matrimid®) and an oligomer (Thermid) and heated the film at 265°C to effectively crosslink the polymer blend.33 The crosslinked Matrimid/Thermid film suppressed CO2 plasticization, whereas the non-crosslinked films did not. In a separate study, Staudt-Bickel and Koros have shown that increasing the crosslink density in fluorinated polymer membrane will deter plasticization effects up to 20 atm.29 Both studies effectively reduced plasticization via crosslinking and without significantly reducing the permeability. 16 Permeability (Barrer) Dual-mode Plasticized Pressure (atm) Figure 1.2. A plot illustrating the permeability as a function of pressure for a material that has been plasticized (adapted from Sanders et al.28). For comparison, typical results from the Dual Mode Sorption Theory are shown. The pressure at which the upswing occurs varies widely from polymer to polymer. 17 1.8 Organic-Inorganic Membranes using Sol-Gel Chemistry First, the term “sol-gel” needs to be defined. A sol is a colloidal suspension of solid particles in a liquid. A gel is a substance that contains a continuous solid structure. Therefore, the definition of sol-gel chemistry involves the conversion of a sol into gel network. The gel network usually involves metal or silicon-based oxides and may contain organic groups. Second, the term “organic-inorganic” must be defined. In the literature, “organic/inorganic” may refer to any number of different materials, including CERAMERS (ceramic polymers), ORMOSILS (organically modified silicates) and ORMOCERS (organically modified ceramics).34-36 In sol-gel chemistry, the inorganic part is a silica or metalloid and the organic part is typically an alkyl ligand attached to the silica or metalloid. To clarify these confusing terms, I will refer to the sol-gel network as an “organosilicate”. Therefore, the membranes in this work will be called “polyimide-organosilicate” hybrid materials, since they are comprised of organosilicates covalently bonded to a polyimide matrix. Sol-gel chemistry is very complex, so this review will be limited to the information needed to explain this project. In particular, this work utilized silicabased alkoxide precursors, hence this discussion will not consider other metalloid-based alkoxide precursors. Important variables that affect the chemistry and resulting gel network include pH, stoichiometry, solvent, temperature and pressure. In general, acid catalyzed systems generate a more linear network than base catalyzed systems.37-38 18 Gelation is an irreversible process involving several interrelated reactions. Three chemical equations are identified in this complex process, acid catalysis OR 1) RO Si OR H2O + OR RO Si OR 3) HO Si + OH OH + HO Si OH OH HO Si OH O Si OH + H2O O Si OH + ROH OH OH OH OH OR OH OR OH RO Si ROH OR OH 2) OH OR OR + HO Si OH RO Si OH OR OH where R is an alkyl group (CH3, C2H5, etc).37-40 Equation 1 is a hydrolysis reaction and equations 2 and 3 are condensation reactions. All three reactions occur simultaneously. The time of gelation is dependent upon pH, stoichiometry, solvent, temperature, pressure and evaporation rate. It usually takes many hours to dry. After the porous dry gel is obtained, it is sintered at a very high temperature (600-1400°C) to produce a fully densified and homogenous glass.39 The dry-gel (non-sintered) material is very brittle and fragile, but selectively porous. The size of these pores is dependent upon the many variables mentioned earlier.39,40 As a result of controlling pore size, favorable gas permeation qualities can be obtained for desire gas separations. In general, the gas transport properties are superior to polymeric membranes. However, it can be difficult to produce defect-free inorganic membranes. 19 To control the pore size distribution in the gel network, several research groups have created a “template” process.41-46 This process incorporates organic ligands into the sol-gel process that are later removed by calcination, leaving a continuous network of mesopores and micropores. Membranes created by this method exhibit an increase in gas flux proportional to the organic ligand volume. The gas selectivity of these membranes is dependent upon the resulting pore size and shape left by the templating group. Raman et al. demonstrated this technique by using a methyltriethoxysilane (MTMOS) and tetraethoxysilane (TMOS) system to show that the organic components can be removed by calcining the membranes at 550°C.41-42 At a calcination temperature of 400°C, permeance increased by a factor of 10 while CO2/CH4 selectivity dropped by about 20%. At a calcination temperature of 550°C, the CH4 permeance decreased dramatically, while the CO2/CH4 selectivity increased.41 The authors concluded that the organic ligands were removed from the gel at 550°C when the network collapsed to create a fully densified silica network and suggested that the increased selectivity was a result of a molecular sieving mechanism. They also noted that the constraint imposed by the underlying alumina support may have affected their results by limiting the densification of the inorganic network to temperatures above 400°C. In a separate study, Lu et al. pyrolyzed methacryloxypropyl ligands from a methacryloxypropylsilane (MPS)/TEOS sol-gel system at 350°C.43 The permeation data was consistent with molecular simulations and verified that a secondary pore size was created by the removal of the ligands. It was also 20 noted that above 25 vol% MPS, a partial collapse of the silica network occurred. Similarly, Kim et al. pyrolyzed methacryloxypropyl ligands from a MPS/TEOS system at 400, 500, 600 and 700°C.44 TGA data showed a significant weight loss at 320°C, which the authors attributed to the pyrolysis of the methacryloxypropyl ligand. Kusakabe et al. pyrolyzed octane, dodecane, and octadecane ligands from the respective alkyl-TEOS/TEOS systems at 600°C.45 From their TGA results, they concluded that organic weight loss started at 250°C and continued until 600°C. Sea et al. pyrolyzed the phenyl ligands from phenyltriethoxysilane (PTEOS) and diphenyltriethoxysilane (DPTEOS) at 600°C.46 They concluded that the phenyl group was removed between 400700°C. In summary, these results suggest that pore size in the silica network can be controlled by selective pyrolysis of organic templates. This can lead to an effective control of transport properties. 1.9 Polymer-Organosilicate Hybrid Materials Much effort has been invested into developing new polymeric materials for gas separations. Polymers are relatively inexpensive and easier to fabricate than inorganic membranes, however, their gas transport properties are limited, particularly at elevated temperatures or under environmentally harsh conditions. For example, polymers can plasticize or degrade in the presence of certain organic compounds. As a result, relatively few polymers have the necessary combination of favorable mechanical, chemical, and gas separation properties. 21 Fluorinated polyimides are particularly appealing materials for use as membranes because they have high temperature stability and have favorable transport properties. Recent efforts to combine polymers with sol-gel derived organosilicates have surfaced in the literature attempting to arrive at materials with enhanced separation characteristics.8-11 Smaihi et al. synthesized a polyimideorganosilicate hybrid system using polycondensation, imidization and sol-gel chemistry processes.8 A polyimide (PMDA) was coupled to the organosilicate (TMOS) via aminopropyltrimethoxysilane (APrTMOS) and aminopropylmethyldiethoxysilane (APrMDEOS) producing a homogeneous microstructure. The organosilicate network was formed during sol-gel coreaction of the hybrid polyamic (acid-siloxane) solution. The authors reported a decrease in gas permeability with increasing TMOS content. Some gas pair selectivities increased with increasing organosilicate content, while other selectivities peaked at moderate concentrations of TMOS. It was suggested that the methyl side groups of the TMOS did not interact with the permeating gas but contributed to the modification of the polymeric network, namely influencing the degree of cross-linking. This degree of cross-linking was determined to be the limiting factor to the gas transport. Tamaki et al. homogenously incorporated poly(N-vinylpyrrolidone) with a silica gel, also using a sol-gel process.9 Methytrimethoxysilane (MTMOS) was used as the organosilicate precursor because the methyl group prevented complete hydrolysis and provided a less cross-linked and more flexible gel. Gas 22 permeation results showed higher CO2/N2 and He/N2 selectivities than predicted by Knudsen flow. However, this composite was only thermally stable to 150°C. Joly et al. synthesized polyimide-organosilicate composite membranes by the addition of TMOS to a polyamic acid (PAA) in dimethylacetamid (DMAc) solution, a so-called “site isolation” method.10 The solution was heated to 300°C to thermally imidize the polyimide (PDMA) and drive the sol-gel reactions to higher degrees of completion. The permeation results were promising in that the composite membrane demonstrated higher permeability, selectivity, and solubility coefficients than the pure polyimide. However, IR spectroscopy data showed that the polyimide was not completely imidized in the hybrid samples. Sysel et al. also synthesized polyimide-organosilicate hybrid materials using the sol-gel process.11 TMOS was covalently bonded to a paminophenyltrimethoxysilane (APTMOS) terminated ODPA-ODA poly(amic acid) of controlled molecular weight. The films were dried by following a temperature ramping scheme up to 300°C and drying for 5 hours. The size of the silica domains did not exceed 100nm and the films were optically transparent. Using TGA, density measurements, and IR spectroscopy, the authors concluded that the sol-gel reactions, namely the condensation reactions, were not completed. Cornelius recently synthesized and characterized a series of hybrid materials consisting of organosilicate domains covalently bonded to a fluorinatedpolyimide matrix (6FDA-6FpDA-DABA).1-2 C13-NMR was used to confirm complete imidization of the polyamic acid. Sol-gel chemistry was employed to produce the organosilicate domains. These hybrid materials were cast into thin 23 films for use as gas separation membranes. The membranes were heat treated at 220°C to remove any excess solvents, a temperature which was not high enough to complete the condensation reactions in the sol-gel process. Furthermore, Cornelius concluded that the gas transport properties were influenced by the amount and type of alkoxide precursor used in the sol-gel chemistry.3-4 For example, the MTMOS-based hybrid samples had the largest increases in permeability and the PTMOS-based samples had the largest decreases in permeability compared to the pure polyimide. The optimum amount of organosilicate in the polyimide was 15.0 wt% solution during synthesis. 1.10 Annealing Polyimide-Organosilicate Hybrid Membranes The purpose for annealing these hybrid membranes is to maximize their gas transport properties, namely that of the organosilicate domains by further driving the sol-gel reactions. Additionally, it may be possible to decompose some of the organic groups in the organosilicate materials, thereby making the membranes more nanoporous and potentially more selective. The optimum annealing temperature should be high enough to gain advantages in the gas transport properties of the organosilicate materials without degrading the polyimide matrix. As mentioned earlier in the sol-gel chemistry section, the dried gel is sintered at very high temperatures (600 to 1400°C) to produce a fully densified and homogeneous glass.37,47 However, these temperatures cannot be attained 24 for the polyimide-organosilicate hybrid membranes because the polyimide will decompose at elevated temperatures. A different approach to organic-inorganic hybrid membranes is the “template approach” where organic templates are incorporated into the inorganic matrix and then removed without collapsing the matrix, creating a continuous network of micropores. The organic matrix can be removed by heating the membranes at 400 to 550°C under air for several hours.41-42 As Raman and Brinker have demonstrated, a calcination temperature of 400° to 550°C may effectively pyrolyze the alkyl groups trapped in the inorganic domains, resulting in nanoporous structures.41 The size of the nanopores can be controlled by the size of the alkyl group. Degradation of the polyimide during the annealing process is a valid concern. Most polyimides are thermally stable at high temperatures, although at temperatures above 400°C they begin to degrade, as has been well documented.48-52 Although carbon molecular sieve (CMS) membranes typically use a polyimide as starting material, the pyrolyzing temperature (>500°C) is much higher than the annealing temperature in this study (400°C).53-54 25 Chapter 2 2.1 Experimental Membrane Materials All membranes were previously synthesized and characterized by Dr. Chris Cornelius.1-4 A detailed description of the synthesis can be found elsewhere.1-4 To summarize, a series of polyimide-organosilicate hybrid materials were synthesized from 80K Mw 6FDA-6FpDA-DABA polyimides containing 12.5 and 25.0 mole percent DABA with respect to the total diamine content during synthesis. The nomenclature 6FDA-6FpDA-DABA refers to 4,4’(Hexfluoroisopropylidene)diphthalic Anhydride (6FDA), 4,4’(Hexfluoroisopropylidene)dianiline (6FpDA), and 3,5-Diaminobenzoic Acid (DABA). The notation DABA-12 and DABA-25 is used to reflect the respective DABA contents of the two different polymers studied. Three different types of alkoxide precursors were considered in the sol-gel chemistry and are illustrated in Figure 2.1: tetramethoxysilane (TMOS), methyltrimethoxysilane (MTMOS) and phenyltrimethoxysilane (PTMOS). The type of alkoxide precursor in the organosilicate domain had an effect on the physical and gas permeation 26 characteristics.1-4 These effects were due to the functionality and steric hindrances of the alkoxide precursors which influenced the degree of crosslinking between the polyimide and organosilicate domains. This study focused on the silica contents of 15.0 and 22.5 weight percent sol in the original polyimide solution. The organosilicate networks were bonded to the matrix via APTEOS, as shown in Figure 2.2. The films were cast using THF as the common solvent as dried for 4 days. Afterwards, they were dried at 220°C for 12 hours under vacuum to remove residual water and solvent. This process produced optically transparent membranes 2-4 mils thick. The end product consisted of organosilicate domains covalently bonded to a polyimide matrix, creating a crosslinked network. After the drying process, these films contained approximately 7.5 wt% and 11.0 wt% silica, respectively. The pure polyimide with the corresponding DABA content was used as a control in the experiments. OCH3 Tetramethoxysilane CH3O Si OCH3 OCH3 OCH3 Methyltrimethoxysilane CH3 Si OCH3 OCH3 OCH3 Phenyltrimethoxysilane Si OCH3 OCH3 Figure 2.1. Chemical structures of TMOS, MTMOS, and PTMOS. 27 O (EtO)3 Si CF3 N H CF3 HO O N O CF3 O n HN O O N H N Pi O O CF3 Si(EtO)3 OH O m Si(EtO)3 O CF3 CF3 Pi = N CF3 CF3 O O N O Figure 2.2. Chemical structure of the 6FDA-6FpDA-DABA polyimide functionalized with APTEOS (blue). The DABA group is highlighted in red. The 6FDA-6FpDA repeat unit is highlighted in green. 28 2.2 Annealing Procedure A Lindberg/Blue box furnace with a temperature range of 25-1100°C was used to anneal the membranes individually under air. The built-in programming was set to 400°C and allowed to preheat. The sample was placed in the oven on a glass plate and annealed for 30 minutes. The sample was removed an immediately place between two Teflon sheets to cool the sample as quickly as possible. All samples received the same heating and cooling protocol. 2.3 Gas Permeation – General Information Gas permeation data was collected for all materials using the Time-Lag Method. This method utilizes the increase of flux or pressure as a function of time to determine the quantities for permeability, solubility, and diffusivity. Each test was started after the sample was degassed to a pressure of 1 to 10 mTorr and the system reached thermal stability at 35°C. This study focused entirely on the pure gas separation of He, O2, N2, CH4 and CO2, all at 99.999% purity as received from the supplier. The feed pressure of these gases was 4 atm and the temperature was 35°C for all trials. Each membrane was tested three times for each gas and the average results were recorded to ensure reproducibility. The total error for permeability is 5% based upon testing in a different gas permeation set-up. 29 2.4 Gas Permeation - Equipment A schematic diagram of the gas permeation system is shown in Figure 2.3. The two-stage vane vacuum pump is an Alcatel 2010 SD model with a capacity of 10 L/min. The temperature box consists of ¾” plywood lined with ¾” Styrofoam insulation and a small fan to circulate the air. An Omegalux® silicone rubber flexible heater is coupled with an electronic digital thermometer to provide heat and maintain the desired temperature. An MKS Baratron® 722A absolute pressure transducer with a range of 0 to 100 Torr and a resolution of 0.1% of full-scale is used to measure the pressure of the permeate (vacuum) side. An Omega PX 621 pressure transducer with a range of 0 to 300 psig is used to measure the feed pressure. An Omega resistance thermal detector (RTD) with a resistance of 100 ohms is used to measure the temperature of the feed gas. An Accel 486 computer using LABTECH Notebook graphical interface programming software controls a series of Nupro® solenoid valves. The computer uses a Keithley Systems DAS-802 input board to control the valves and a Keithley Systems PIO-24 input/output board to control the measurement devices. All valves and measurements devices are connected using 1/8” or 1/16” OD 316 stainless steel tubing and appropriate Swagelok® fittings. 30 Pressure Pressure Transmitter Transmitter Temperature Box Control Valves Permeation (Feed) Control Valves (Vacuum) Gas Supply Vacuum Pump Figure 2.3. Schematic diagram of the permeation system. All valves and pressure transmitters are interfaced with a computer. 31 2.5 Gas Permeation - Cell A 316 stainless steel gas permeation cell was custom designed and constructed for this study and is illustrated in Figure 2.4. This cell is designed for thin membranes measuring two inches (5.08 cm) in diameter. The cell consists of two parts, a feed half and a permeate half, each four inches (10.16 cm) in diameter. Two porous 100µm stainless steel sintered disks (manufactured by Mött Corporation) are inserted to provide mechanical support for the membrane and prevent cracking or fractures. Three radial static seal fluorocarbon Viton® Static Seal O-rings are used to seal the membranes and prevent leaking. The two halves of the cell are fastened using six ¼” bolts. In order to accurately measure the temperature of the feed gas, a RTD probe is inserted into the cavity of the feed side via 1/8” Swagelok® fitting. The active permeation area is 1.78 sq. in. (11.51 cm2) for gas diffusion. 32 Viton® O-rings Dense Feed Permeat Porous disks Figure 2.4. Cross-sectional schematic diagram of gas permeation cell. 33 2.6 Gas Permeation - Volume of permeate side The volume on the permeate side was minimized to increase the accuracy of the data and reduce the experimental time. This volume was obtained by using the ideal gas law and adding a fixture of known volume and a valve near the permeate pressure transducer, as shown in Figure 2.5. A nonpermeable membrane is placed in the cell and Valve 1 is opened. The permeate side of the system (Vp) and the known volume (V1) are filled with an ideal gas at a known pressure (P1). (Note: V1 also includes the small volume of tubing used to connect the known volume to the system. This volume is calculated and added to the known volume.) Valve 1 is closed, so we have a known volume (V1) and pressure (P1) of an ideal gas. The permeate side of the system is exposed to vacuum by opening Valve 2. When the pressure of the permeate side (P2) is lowered, Valve 2 is closed and P2 is recorded. Valve 1 is opened and an equilibrium pressure (Peq) is recorded. The unknown volume (Vp) is calculated using Equation 2.1. The temperature and amount of gas are assumed to be constant for the calculation. Vp = V1 ( Peq − P1 ) (2.1) P2 − Peq For this experiment, we used aluminum foil as the nonpermeable membrane, helium as the ideal gas, and a known volume of 40 cm3. Of course, more accurate volume calculations result from larger differences in pressures P1 and P2. The volume of the permeate side for this system, including the tubing to 34 the pressure transducer, is 0.900 ± 0.004 cu. in. (14.74 ± 0.06 cm3). This volume is the average calculation of 14 trials with pressure differences ranging from 2 to 7 atm. Pressure Transducer Permeation Valve To permeation system Known Volume, Unknown Volume, V Valve 2 To gas supply Vacuum Pump Figure 2.5. Schmeatic diagram of measuring permeate volume using an ideal gas. 35 2.7 FTIR-ATR Fourier Transform Infrared Spectrometry-Attenuated Total Reflectance was employed to detect chemical bonding changes in the materials after the annealing process with BIO-RAD FTS-40A. Spectra were obtained sampling 64 scans at a wave number resolution of 2 cm-1 and aperture opening of 2 cm-1. The angle of incidence was 45° and a KRA-5 SPP crystal (Thallium Bromoiodine Si and Single-Pass Parallelepiped) with dimensions of 50mm x 10mm x 3mm was used. Based on these dimensions, the IR beam is reflected approximately 18 times. 2.8 Thermogravimetric Analysis – Mass Spectrometry TGA-MS was performed in a High-Resolution TA 2950 TGA instrument was coupled to a Pfeiser Thermostar mass spectrometer. Sample sizes ranging from 6.5 to 7.5 mg were subjected to a temperature sweep of 20 to 960°C, ramped at 10°C per minute under nitrogen flow of 90 µL/min. Mass was measured every 2 seconds and the effluent gas was simultaneously scanned every 100 seconds. 2.9 Density Measurements The densities of the samples were obtained using a Mettler AJ100 analytical balance fitted with a Mettler ME-33360 density determination kit. This method is based on the Archimedean Principle. Simply stated, a solid immersed in a liquid loses as much of its own weight as the weight of liquid it has displaced. 36 Knowing the density of the liquid, the mass of the sample in air, and the mass of the sample in the liquid, the unknown density can be determined using the equation: ρ solid = A × ρ liquid ( A − B) ρsolid = unknown density of solid sample ρliquid = density of liquid A = mass of sample in air B = mass of sample in liquid Iso-octane (ρliquid = 0.688 g/ml at 25°C) was employed as the liquid for these measurements because it will not dissolve the samples, vapor pressure is low, toxicity is low and low surface tension aids in wetting the samples. Sample films of the pure polyimide and hybrid materials were first subjected to 180°C for 24 hours under vacuum and then measured using this technique. The average density of three different samples ranging 40 to 120 mg in mass was recorded. Relative error for this process was 0.5% or 0.004 g/cm3. It is important to note that buoyancy in air is not taken into account and may be corrected by adding 0.001 g/cm3. The change in liquid volume when the unknown sample is submerged is assumed to be negligible. 37 Chapter 3 3.1 Annealing Polyimide-Organosilicate Hybrid Membranes Abstract Polyimide-organosilicate hybrid membranes were subjected to annealing to enhance gas separation performance. These membranes consisted of organosilicate domains covalently bonded to a 6FDA-6FpDA-DABA polyimide using partially hydrolyzed tetramethoxysilane (TMOS), methyltrimethoxysilane (MTMOS) or phenyltrimethoxysilane (PTMOS). The transport properties of the hybrid membranes were evaluated using pure gases (He, O2, N2, CH4, CO2) at 35°C and a feed pressure of 4 atm. The permeability for most of the membranes increased 200-500% after the annealing process while the permselectivity dropped anywhere from 0 to 50%. The exceptions were the 6FDA-6FpDADABA-25 22.5% TMOS and MTMOS hybrid membranes, both of which exhibited increases in the CO2 permeability and CO2-CH4 permselectivity. The transport data was compared to Robeson’s 1991 “upper bound” 7 and exceeded the boundary in some cases. The increase in permeation was attributed to increases 38 in the free volume and enhanced segmental mobility of the chain ends resulting from the removal of sol-gel condensation and polymer degradation byproducts. 3.2 Visual Observations Before annealing, the membranes were optically transparent and flexible. After annealing, some membranes were still transparent while others were opaque. Although annealing caused the membranes to be somewhat brittle, they were still flexible and durable. 3.3 TGA-MS The four samples shown in Table 3.1 were analyzed using TGA-MS to determine if the organic ligands (methyl and phenyl) were being decomposed and to qualitatively measure the amount of polyimide degradation. The 400°C annealing temperature was higher than the Tg for all samples and the total weight loss did not exceed 3.0% when the sample was heated to the annealing temperature. The percent weight loss in the hybrid materials was only slightly higher than that observed for the pure polyimide, which would be consistent with the loss of byproducts from the sol-gel condensation reactions. 39 Table 3.1 Summary of Tg and 5% weight loss temperatures for 6FDA-6FpDADABA-25 pure polyimide and hybrid materials. A B TgA (°C) 5% Wt. LossB (°C) % Wt. Loss at 400°C B Pure Polyimide 303 432 2.4% 22.5 wt% PTMOS 328 448 2.5% 22.5 wt% TMOS 340 438 2.8% 22.5 wt% MTMOS 340 459 2.6% DSC - data collected at 10°C/min in air and 2nd ramp, error ~0.7% 2. TGA - data collected at 10°C/min in nitrogen, error ~0.3% Carbon dioxide (m/z = 44, 28, 12), water (m/z = 18), HF (m/z =20), and CF3 (m/z = 69) were each detected for all samples during a temperature scan from 20° to 960°C.55-56 As shown in Figure 3.1, carbon dioxide (m/z = 44, 28, 12) removal occurred at two different temperatures, 400°C and 520°C, for all samples, which is consistent with the literature.49 However, no peaks were observed at m/z = 28 and 14 because nitrogen was used as the carrier gas and thus dominated the signal at these values. Since carbon monoxide peaks (m/z = 28, 12) coincide with the nitrogen and the carbon dioxide peaks, it was not possible to verify the presence of carbon monoxide, but several groups did report it as a common degradation product for polyimides using other techniques.52,55 40 1.0E-08 m/z = 12 Intensity m/z = 44 1.0E-09 1.0E-10 0 100 200 300 400 500 600 700 800 900 1000 Temperature, °C Figure 3.1. TGA-MS spectra for 6FDA-6FpDA-DABA-25 pure polyimide degradation. Intensity units are arbitrary. 3.0E-10 Mass to charge ratio, m/z 2.5E-10 Intensity 50 2.0E-10 51 52 1.5E-10 78 1.0E-10 5.1E-11 1.0E-12 300 400 500 600 Temperature, °C Figure 3.2. TGA-MS spectra for 6FDA-6FpDA-DABA-25 22.5wt% PTMOS hybrid material. Intensity units are arbitrary. 41 700 TGA results were inconclusive in determining if the methyl ligand was being decomposed from the MTMOS sample. Several sources reported that the methyl ligands are stable up to 450°C or 500°C for similar materials.41-42,57-58 The PTMOS hybrid sample was the only material to show peaks at m/z = 78 and m/z = 50 at 520°C, which correspond to the phenyl ligand (C6H6; m.w. = 78) and is shown in Figure 3.2. The peak at m/z = 50 was due to the opening of the aromatic ring and loss of C2H2 (m.w. = 28). In addition, there were similar peaks at m/z = 51 and 52 that were due to aromatic ring openings.56 Zhang et al. have shown the phenyl ligand can be removed from a PTMOS derived gel at 520580°C,59 which is consistent with our observations. Thus, we conclude that the phenyl ligands were not removed during the 400°C annealing process. Interestingly, a distinct peak at m/z = 69 was observed for all samples between 470 and 570°C, which was well above the annealing temperature. We attribute this peak to the removal of the CF3+ ion. In addition, there was a distinct peak at m/z = 20 at the same temperature range that was about four times larger than the peak at m/z = 69. This peak was attributed to the presence of HF. This data is consistent with Turk et al. who used TGA coupled with FTIR to analyze the decomposition gases.52 For fluorinated polyimides, CF3 and HF were present in the decomposition gas from 470°C to 580°C. 42 3.4 FTIR-ATR In addition to TGA-MS analysis, FTIR-ATR was employed to correlate the changes in the chemical bonding structure during the annealing process. Although the FTIR-ATR technique probes approximately the first 2 microns of the film, we assume that this is representative of the bulk of the sample. The average thickness of the membranes is 76 microns. The apparent changes in the hybrid systems upon annealing were compared to those of the pure polyimide as shown in Figures 3.3 through 3.6. Figure 3.3 highlights the subtle changes in the bonding structure for the pure polyimide upon annealing. The peaks associated with carbonyl groups at 1720 cm-1 and 1395 cm-1 become weaker with annealing. An aromatic peak appears at 1500 cm-1 after annealing, evidence of an aromatic ring structure. Some peaks in the 680-800 cm-1 range, assigned to the aromatic rings in the polyimide, also change slightly. For the hybrid membranes, shown in Figures 3.4 through 3.6, antisymmetric Si-O-Si stretching encompasses the range from 960-1280 cm-1, including strong absorption bands of amorphous SiO2 at 1090 and 1180.47,60 All three hybrid samples (TMOS, PTMOS, and MTMOS) had significant changes between 960-1280 cm-1, evidence that the silica bonding was changing during the annealing process. For example, in Figure 3.4, the peak at 1020 cm-1 (asymmetric stretching vibration Si-O-Si)61 nearly doubles when compared to the benzene peak at 716 cm-1. This indicates that more Si-O bonds were formed and 43 that the gel condensed as a result of annealing. The peak at 716 cm-1 remained constant because the number of benzene rings did not change. Benzene Ring Polyimide C-F C=O Before Anneal C-F C-N After Anneal 2000 1800 1600 1400 1200 Wave Number (cm-1) 1000 800 600 400 Figure 3.3. FTIR-ATR spectra of 6FDA-6FpDA-DABA-25 pure polyimide. Shading highlights areas of change after the annealing process. Si Bonding Benzene Ring Si-CH3 Si-CH3 Before Anneal C=O C-N Polyimide After Anneal 2000 1800 1600 1400 1200 1000 800 600 400 Wave Number (cm-1) Figure 3.4. FTIR-ATR spectra of 6FDA-6FpDA-DABA-25 - 22.5% MTMOSbased hybrid. Shading highlights areas of change after the annealing process. 44 Benzene Ring Si Bonding Before Anneal C=O C-N Polyimide After Anneal 2000 1800 1600 1400 1200 1000 800 600 400 -1 Wave Number (cm ) Figure 3.5. FTIR-ATR spectra of 6FDA-6FpDA-DABA-25 22.5% TMOS-based hybrid. Shading highlights areas of change after the annealing process. Si Bonding Benzene Ring C-F Si- Before Anneal C=O C-N Polyimide After Anneal 2000 1800 1600 1400 1200 1000 800 600 400 Wave Number (cm-1) Figure 3.6. FTIR-ATR spectra of the 6FDA-6FpDA-DABA-25 22.5% PTMOS. Shading highlights areas of change after the annealing process. 45 In conjunction with the TGA-MS and FTIR-ATR results, we postulate that the anhydride end-groups thermally/hydrolytically degrade in the pure polyimide, as reported by Cella and illustrated in Figure 3.7.48 This mechanism occurs in the presence of water and results in the loss of carbon dioxide. The presence of water and carbon dioxide at 400°C was confirmed by TGA-MS data. Water can come from several sources, namely the condensation of the carboxylic acid groups in the DABA and the condensation reactions of the sol-gel network in the hybrid materials. Cella also pointed out that at elevated temperatures, polyimides undergo rapid hydrolysis and these hydrolysis products suffer thermal degradation, which leads to chain scission, weight loss, and crosslinking.48 O O O H2O CO2H -CO2 CO2H ∆ CO2H Figure 3.7. Thermal/hydrolytic degradation of anhydrides.48 The degradation mechanism shown in Figure 3.7 is also supported by the FTIR-ATR spectra. The reduction of intensity for peaks assigned to the carbonyl groups at 1720 cm-1 and 1395 cm-1 was consistent with the thermal/hydrolytic degradation of the anhydride end groups. The formation of a peak at 1500 cm-1 and the slight changes in the 680-800 cm-1 range were assigned to the in-plane vibration of a benzene ring. The environment around the benzene ring was altered during degradation of the anhydride end groups, as shown in Figure 3.7. 46 It is important to understand that the degradation of the anhydride end groups only applies to the pure polyimide. The hybrid materials are fully functionalized with APTEOS and therefore do not have any anhydride end groups. This is evident by the FTIR-ATR spectra in Figure 3.4. The peaks assigned to the carbonyl groups at 1720 cm-1 and 1395 cm-1 do not change with annealing for any of the hybrid samples. Finally, it is important to compare TGA-MS data with FTIR-ATR observations concerning the methyl groups in the MTMOS sample. Peaks at 1260 cm-1 and 768 cm-1 were assigned to Si-CH3 stretching and rocking, respectively.62-64 Referring to the FTIR-ATR spectra in Figure 3.4 for MTMOS, both of these peaks increase with the annealing process. Therefore, we conclude that the methyl ligands are not being decomposed during the 400°C anneal. We attribute the higher intensities to changes in the bonding structure of the silicon atom attached to the methyl ligand.62 As the silica network cross-links during the annealing process, the environment around the methyl ligands is altered. 47 3.5 Swelling Studies Swelling measurements tabulated in Table 3.2 show that the degree of crosslinking increases for all samples with annealing. Before being subjected to annealing, the pure polyimide readily dissolved in NMP, but after annealing the pure polyimide registered very little NMP uptake. In fact, the pure polyimide swelled less than any of the hybrid samples after annealing. This surprising observation indicated significant crosslinking of the polyimide during the annealing process. Since the polyimide in the hybrid materials was functionalized with APTEOS, the hybrid materials were effectively crosslinked without the annealing process. This was evident by the swelling measurements. All but one of the hybrid samples (DABA-12 PTMOS) had relatively low NMP uptake. After the annealing process, the NMP uptake for all samples decreased, suggesting that the degree of crosslinking increased in the polyimide-organosilicate hybrids. This was attributed to the hydroxy-terminated groups in the organosilicate domains condensing with the APTEOS of the functionalized polyimide. 48 Table 3.2. Summary swelling measurements in NMP for 6FDA-6FpDA-DABA-25 and 6FDA-6FpDA-DABA-12.5 hybrid materials. Surface area to volume ratio is ~128. Amount of NMP is 200 grams for every gram of sample. Error ~10%. NMP Uptake gNMP/gPolymer Before Anneal NMP Uptake gNMP/gPolymer After Anneal --- 0.17 22.5 wt% PTMOS 1.25 0.55 22.5 wt% MTMOS 1.01 0.19 22.5 wt% TMOS 1.18 0.04 Before Anneal After Anneal Pure Polyimide --- 0.17 22.5 wt% PTMOS --- 0.49 22.5 wt% MTMOS 1.13 0.60 22.5 wt% TMOS 2.37 0.76 DABA-25 Pure Polyimide DABA-12 --- Indicates sample swelled to such a degree that measurements was not possible. 49 3.6 TEM Studies TEM images of the 22.5% MTMOS-based hybrid material before and after annealing are shown in Figure 3.8. The TMOS and PTMOS-based materials are not shown because the size of the silica domains, on the order of nanometers, was too small to discern. However, the MTMOS-based hybrid had larger, micron-sized silica domains, in addition to smaller, nano-sized domains. The larger silica domains that were visible in the MTMOS-based hybrid demonstrated a significant change with the annealing process. The wavy striations that accompany the annealed sample are an artifact of sample microtoming. These artifacts indicate that the silica domains become much harder after the annealing process, thereby supporting the conclusion that the condensation reactions were driven to a higher degree of completion resulting in more Si-O-Si bonding in the silica structures. Before Anneal After Anneal Figure 3.8. TEM images of 22.5% MTMOS-based hybrid material before and after the 400°C anneal for 30 minutes. 50 3.7 Gas Transport Gas permeation experiments were performed to determine the effects of the annealing process on gas transport properties of the hybrid membranes. The permeability, diffusivity and solubility coefficients for the materials before and after annealing are reported in Tables 3.3 and 4.4. The permeability for all gases through all membranes increased dramatically after the annealing process. These increases were mostly attributed to large increases in the diffusion coefficient. The increases in solubility coefficients were relatively small compared to increases in the diffusion coefficients. The permeabilities and ideal permselectivities are plotted in Figures 3.9 through 3.18 and are compared to Robeson’s 1991 “upper bound”.7 The applicability of the Time Lag Method originally developed for homogeneous systems needs to be discussed. To validate its use for these hybrid systems, we point to a study by Paul and Kemp, who concluded that using the Time Lag Method to measure the diffusivity of adsorptive, but nonpermeable fillers in a rubbery polymer results in large increases in the diffusion time lag but only minor effects on the steady-state permeability.16 It is unclear whether these large increases in diffusion time lag should be attributed to the gas penetrants taking a more tortuous path. In our hybrid membranes, we think that the filler materials (organosilicate domains) are permeable, unlike the study by Paul and Kemp. In fact, the diffusion coefficient for the pure polyimide is similar to that of the hybrid materials, suggesting that the organosilicates and polyimide have similar transport properties. 51 Table 3.3. Summary of Permeability, Diffusivity and Solubility coefficients for 6FDA-6FpDA-DABA-25 hybrid materials. Evaluated at 35°C and 4 atm (absolute). Overall error ~5% for permeability. He O2 N2 CH4 CO2 P D S P D S P D S P D S P D S 83.1 709 0.09 6.29 5.51 0.87 1.20 1.37 0.66 0.46 0.24 1.48 20.3 2.09 7.36 71.5 632 0.09 5.99 4.92 0.93 1.06 1.11 0.73 0.48 0.18 2.03 15.7 1.45 8.27 - - - - - - - - - - - - - - - 69.3 709 0.07 5.69 5.04 0.86 1.07 1.16 0.70 0.52 0.23 1.75 16.6 1.32 9.57 82.3 521 0.13 6.75 6.29 0.82 1.32 1.53 0.65 0.63 0.27 1.76 22.8 2.26 7.66 55.7 649 0.07 5.08 4.68 0.82 0.98 1.18 0.64 0.54 0.24 1.71 19.1 1.90 7.66 60.2 747 0.06 4.96 4.63 0.81 0.94 1.10 0.65 0.52 0.22 1.81 18.4 1.78 7.87 184 885 0.16 22.7 14.7 1.18 4.85 3.79 0.97 2.45 0.76 2.95 77.3 5.83 10.1 196 218 0.69 22.9 12.2 1.42 4.87 3.33 1.11 2.15 0.45 3.71 79.8 5.08 11.9 - - - - - - - - - - - - - - - 169 754 0.17 18.7 10.7 1.33 3.83 2.68 1.09 1.68 0.43 2.95 60.1 4.01 11.4 205 952 0.17 24.1 15.1 1.21 5.07 3.99 0.97 1.93 0.57 2.59 81.1 6.17 10.0 149 342 0.33 22.4 12.1 1.40 5.21 3.50 1.13 3.79 0.95 3.04 94.4 5.71 12.6 177 1100 0.12 27.7 17.2 1.22 6.25 4.94 0.96 3.71 1.00 2.83 104 7.72 10.3 Before anneal Pure polyimide 22.5 wt% TMOS 15.0 wt% TMOS 22.5 wt% MTMOS 15.0 wt% MTMOS 22.5 wt% PTMOS 15.0 wt% PTMOS After anneal Pure polyimide 22.5 wt% TMOS 15.0 wt% TMOS 22.5 wt% MTMOS 15.0 wt% MTMOS 22.5 wt% PTMOS 15.0 wt% PTMOS cm 3 (STP ) ⋅ cm P = 10 −10 2 cm ⋅ s ⋅ cmHg D = 10 −8 cm 2 s 52 cm 3 (STP ) S= 2 cm ⋅ atm Table 3.4. Summary of Permeability, Diffusivity and Solubility coefficients for 6FDA-6FpDA-DABA-12.5 hybrid materials. Evaluated at 35°C and 4 atm (absolute). Overall error ~5% for permeability. He O2 N2 CH4 CO2 P D S P D S P D S P D S P D S 107 966 0.08 10.0 7.73 0.98 2.01 1.89 0.81 1.00 0.35 2.15 34.0 3.14 8.24 119 297 0.31 9.42 5.56 1.29 1.70 1.15 1.12 0.75 0.22 2.62 30.9 - - Before anneal Pure polyimide 22.5 wt% TMOS 15.0 wt% TMOS 22.5 wt% MTMOS 15.0 wt% MTMOS 22.5 wt% PTMOS 15.0 wt% PTMOS After anneal - - - - - - - - - - - - - - - 117 451 0.13 11.8 8.60 1.05 2.62 2.35 0.84 1.22 0.43 2.29 - - - 120 750 0.12 12.2 8.11 1.14 2.53 2.07 0.93 1.24 0.36 2.59 44.0 3.21 10.4 73.7 591 0.09 9.42 8.98 0.86 1.88 2.05 0.70 0.90 0.37 1.87 30.7 2.75 8.51 93.6 650 0.11 9.08 6.99 0.99 1.80 1.71 0.80 0.93 0.30 2.33 32.3 2.73 9.02 Pure polyimide 176 1185 0.11 21.4 13.6 1.19 4.50 3.58 0.96 2.34 0.72 2.46 70.8 5.55 9.68 22.5 wt% TMOS 15.0 wt% TMOS 22.5 wt% MTMOS 15.0 wt% MTMOS 22.5 wt% PTMOS 15.0 wt% PTMOS 154 1015 0.12 17.4 12.1 1.09 3.16 2.03 1.18 1.30 0.36 2.72 47.6 3.26 11.1 - - - - - - - - - - - - - - - 233 218 0.23 29.0 20.0 1.44 7.07 5.76 0.94 3.57 1.23 2.23 - - - 225 1132 0.15 31.2 19.7 1.20 7.07 5.80 0.93 3.83 1.11 2.63 110 7.95 10.5 137 899 0.12 27.6 19.3 1.10 5.87 5.12 0.87 3.52 1.16 2.30 90.9 7.39 9.35 164 1001 0.12 24.7 16.8 1.12 5.59 5.10 0.83 3.30 0.97 2.58 91.8 6.94 10.0 D = 10 −8 cm 2 s cm 3 (STP ) ⋅ cm P = 10 −10 2 cm ⋅ s ⋅ cmHg 53 cm 3 (STP ) S= 2 cm ⋅ atm He-O2 Selectivity,α 20 Upper Bound Pure Polymer 22.5wt% MTMOS 15.0wt% MTMOS 22.5wt% PTMOS 15.0wt% PTMOS 22.5wt% TMOS Pure Polymer 22.5wt% MTMOS 15.0wt% MTMOS 22.5wt% PTMOS 15.0wt% PTMOS 22.5wt% TMOS 10 9 8 7 6 50 60 70 80 90 100 200 300 Helium Permeability, barrers Figure 3.9. Boundary diagrams of 6FDA-6FpDA-DABA-25 pure polyimide and hybrid materials for He-O2. The line represents Robeson’s 1991 “Upper Bound”.7 The blue symbols represent unannealed membranes and red symbols represent annealed membranes. He-N2 Selectivity, α 200 Upper Bound Pure Polymer 22.5wt% MTMOS 15.0wt% MTMOS 22.5wt% PTMOS 15.0wt% PTMOS 22.5wt% TMOS Pure Polymer 22.5wt% MTMOS 15.0wt% MTMOS 22.5wt% PTMOS 15.0wt% PTMOS 22.5wt% TMOS 100 90 80 70 60 50 40 30 50 60 70 80 90 100 200 300 Helium Permeability, barrers Figure 3.10. Boundary diagrams of 6FDA-6FpDA-DABA-25 pure polyimide and hybrid materials for He-N2. The line represents Robeson’s 1991 “Upper Bound”.7 The blue symbols represent unannealed membranes and red symbols represent annealed membranes. 300 Upper Bound Pure Polymer 22.5wt% MTMOS 15.0wt% MTMOS 22.5wt% PTMOS 15.0wt% PTMOS 22.5wt% TMOS Pure Polymer 22.5wt% MTMOS 15.0wt% MTMOS 22.5wt% PTMOS 15.0wt% PTMOS 22.5wt% TMOS He-CH4 Selectivity, α 200 100 90 80 70 60 50 40 30 50 60 70 80 90100 200 300 400 500 Helium Permeability, barrers Figure 3.11. Boundary diagrams of 6FDA-6FpDA-DABA-25 pure polyimide and hybrid materials for He-CH4. The line represents Robeson’s 1991 “Upper Bound”.7 The blue symbols represent unannealed membranes and red symbols represent annealed membranes. 7 Upper Bound Pure Polymer 22.5wt% MTMOS 15.0wt% MTMOS 22.5wt% PTMOS 15.0wt% PTMOS 22.5wt% TMOS Pure Polymer 22.5wt% MTMOS 15.0wt% MTMOS 22.5wt% PTMOS 15.0wt% PTMOS 22.5wt% TMOS O2-N2 Selectivity,α 6 5 4 5 6 7 8 9 10 20 30 40 O2 Permeability, barrers Figure 3.12. Boundary diagrams of 6FDA-6FpDA-DABA-25 pure polyimide and hybrid materials for O2-N2. The line represents Robeson’s 1991 “Upper Bound”.7 The blue symbols represent unannealed membranes and red symbols represent annealed membranes. 55 Upper Bound Pure Polymer 22.5wt% MTMOS 15.0wt% MTMOS 22.5wt% PTMOS 15.0wt% PTMOS 22.5wt% TMOS Pure Polymer 22.5wt% MTMOS 15.0wt% MTMOS 22.5wt% PTMOS 15.0wt% PTMOS 22.5wt% TMOS 70 CO2-CH4 Selectivity,α 60 50 40 30 20 30 40 50 60 70 80 90 100 200 CO2 Permeability, barrers He-O2 Selectivity,α Figure 3.13. Boundary diagrams of 6FDA-6FpDA-DABA-25 pure polyimide and hybrid materials for CO2-CH4. The line represents Robeson’s 1991 “Upper Bound”.7 The blue symbols represent unannealed membranes and red symbols represent annealed membranes. Upper Bound Pure Polymer 22.5wt% MTMOS 15.0wt% MTMOS 7.5wt% MTMOS 22.5wt% PTMOS 15.0wt% PTMOS 22.5wt% TMOS Pure Polymer 22.5wt% MTMOS 15.0wt% MTMOS 7.5wt% MTMOS 22.5wt% PTMOS 15.0wt% PTMOS 22.5wt% TMOS 10 9 8 7 6 5 4 70 80 90 100 200 300 400 500 Helium Permeability, barrers Figure 3.14. Boundary diagrams of 6FDA-6FpDA-DABA-12 pure polyimide and hybrid materials for He-O2. The line represents Robeson’s 1991 “Upper Bound”.7 The blue symbols represent unannealed membranes and red symbols represent annealed membranes. 56 100 Upper Bound Pure Polymer 22.5wt% MTMOS 15.0wt% MTMOS 7.5wt% MTMOS 22.5wt% PTMOS 15.0wt% PTMOS 22.5wt% TMOS Pure Polymer 22.5wt% MTMOS 15.0wt% MTMOS 7.5wt% MTMOS 22.5wt% PTMOS 15.0wt% PTMOS 22.5wt% TMOS 90 80 He-N2 Selectivity, α 70 60 50 40 30 20 70 80 90 100 200 300 400 500 Helium Permeability, barrers Figure 3.15. Boundary diagrams of 6FDA-6FpDA-DABA-12 pure polyimide and hybrid materials for He-N2. The line represents Robeson’s 1991 “Upper Bound”.7 The blue symbols represent unannealed membranes and red symbols represent annealed membranes. He-CH4 Selectivity, α 200 Upper Bound Pure Polymer 22.5wt% MTMOS 15.0wt% MTMOS 7.5wt% MTMOS 22.5wt% PTMOS 15.0wt% PTMOS 22.5wt% TMOS Pure Polymer 22.5wt% MTMOS 15.0wt% MTMOS 7.5wt% MTMOS 22.5wt% PTMOS 15.0wt% PTMOS 22.5wt% TMOS 100 90 80 70 60 50 40 30 60 70 80 90 100 200 300 400 500 Helium Permeability, barrers Figure 3.16. Boundary diagrams of 6FDA-6FpDA-DABA-12 pure polyimide and hybrid materials for He-CH4. The line represents Robeson’s 1991 “Upper Bound”. 7 The blue symbols represent unannealed membranes and red symbols represent annealed membranes. 57 10 9 8 7 Upper Bound Pure Polymer 22.5wt% MTMOS 15.0wt% MTMOS 7.5wt% MTMOS 22.5wt% PTMOS 15.0wt% PTMOS 22.5wt% TMOS Pure Polymer 22.5wt% MTMOS 15.0wt% MTMOS 7.5wt% MTMOS 22.5wt% PTMOS 15.0wt% PTMOS 22.5wt% TMOS O2-N2 Selectivity, α 6 5 4 3 2 1 7 8 9 10 20 30 40 50 60 70 80 90100 Helium Permeability, barrers Figure 3.17. Boundary diagrams of 6FDA-6FpDA-DABA-12 pure polyimide and hybrid materials for O2-N2. The line represents Robeson’s 1991 “Upper Bound”. 7 The blue symbols represent unannealed membranes and red symbols represent annealed membranes. 60 Upper Bound Pure Polymer 22.5wt% MTMOS 15.0wt% MTMOS 7.5wt% MTMOS 22.5wt% PTMOS 15.0wt% PTMOS 22.5wt% TMOS Pure Polymer 22.5wt% MTMOS 15.0wt% MTMOS 7.5wt% MTMOS 22.5wt% PTMOS 15.0wt% PTMOS 22.5wt% TMOS CO2-CH4 Selectivity,α 50 40 30 20 30 40 50 60 70 80 90100 200 300 400 Helium Permeability, barrers Figure 3.18. Boundary diagrams of 6FDA-6FpDA-DABA-12 pure polyimide and hybrid materials for CO2-CH4. The line represents Robeson’s 1991 “Upper Bound”.7 The blue symbols represent unannealed membranes and red symbols represent annealed membranes. 58 3.8 Gas Transport – Pure Polyimide The amount of diamino-benzoic acid (DABA) in the pure polymer greatly influenced the gas separation properties. First, the condensation of the carboxylic groups during the annealing process is a source of water, which promotes the degradation of the anhydride end-groups. Because the DABA-25 systems had double the concentration of carboxylic acid groups than the DABA12, these samples were more likely to condense during the annealing process, thus increasing cross-linking and producing more water to promote the degradation mechanism. Second, before annealing, the polyimide chains in the DABA-25 membranes were more likely to hydrogen bond along the polymer chain backbone due to higher concentrations of carboxylic acid groups. This was evident in the permeation data of the unannealed pure polyimide membranes, as DABA-12 membranes had higher permeabilities and lower permselectivities than the DABA-25 membranes. During the annealing process, these hydrogen bonds were easily broken and the carboxylic groups condensed to form cross-links along the polymer chain backbone. After annealing, the permeabilities were nearly the same for both DABA systems, although the permselectivities were slightly higher in the DABA-25 membranes, which may be due to the higher degree of cross-linking in the DABA-25. Therefore, the annealing process had a greater influence on the membrane with the higher DABA content. 59 3.9 Gas Transport – Hybrid Materials In a previous paper, Cornelius pointed out that the unannealed polyimide- organosilicate hybrid materials exhibit an increase in free volume and a decrease in chain mobility with increasing silica content.1-2 The authors concluded that these two phenomena are due to the formation of cross-links between the polymer backbone and the silica structures. These cross-links are primarily limited to the interface between these two components, inhibiting chain packing. In addition, we postulated that in the PTMOS hybrid system, the interface was non-selective as a result of the steric hindrance introduced by the bulky phenyl groups. These groups prevented efficient cross-linking with the polymer matrix and deactivated the hydrolysis and condensation reactions. On the other hand, silica structures generated from the TMOS and MTMOS alkoxides were efficiently incorporated into the polymer matrix because both, MTMOS and TMOS have fast hydrolysis rates and higher concentration of silanol groups that can undergo further condensation with the functionalized polyimides. As can be inferred from Tables 3.3 and 3.4, the permeability of the various gases increased more in the hybrid materials with annealing than it did in the pure polyimide. Most of this increase can be attributed to an increase in the diffusion coefficients. Thus, the inclusion of organosilicate domains, even at 7.5% and 11% by weight, was contributing to the increase in permeability and diffusivity of the various gases in the annealed membranes. Figures 3.9 through 3.18 show the trade-off curves of a number of gas pairs for the various hybrid and polymer systems before and after annealing. As can be inferred from the 60 figures, before annealing, the DABA-25 pure polyimide had higher permselectivities than the hybrid materials. After annealing, the permselectivities of the MTMOS and TMOS-based hybrid materials, particularly for the He/CH4 and CO2/CH4 gas pairs shown in Figures 8 and 9, were better than that of the pure polyimides, suggesting that the presence of the silica structures enhanced the integrity of the films. In fact, both, the permeability and the permselectivity for the CO2-CH4 gas pair increased in the DABA-25 22.5wt% TMOS and MTMOSbased hybrid materials. On the other hand, the PTMOS hybrid materials exhibited unusually large increases in permeability and large decreases in permselectivity with annealing, which could be attributed to the poor polymersilica interface as discussed previously.2 The dramatic increase in the permeability of all gases through all the membranes is, indeed, surprising in view of the apparent increases in the degree of cross-linking upon annealing as was shown in the swelling studies. Typically, one would expect that an increase in cross-linking would increase the permselectivity and decrease the permeability and diffusivity in glassy polymers.5 One possible explanation for these results is that the loss of the degradation byproducts created additional free volume, thereby increasing the permeability. This would be consistent with the Cohen-Turnbull model, which suggests that diffusion coefficients should increase exponentially with fractional free volume.65 While the free volume in the pure polyimide may be created by the degradation of the anhydride end-groups as mentioned earlier, the increase of free volume in 61 the hybrid samples could be attributed to the removal of the sol-gel condensation products. On the other hand, if the free volume of the hybrid materials is indeed changing with the annealing process, we hoped it would be evident in the density measurements. The density of the hybrid materials, presented in Table 5, was measured to the nearest 0.001 g/cm3 before and after exposure to the 400°C annealing process. Based on the TGA results, one would expect a 2-3% percent decrease in density, assuming the volume of the sample did not change. However, the results indicate no significant changes in density. While in the pure polyimide, the weight loss was attributed to the loss of water and carbon dioxide, in the hybrid materials, the majority of weight loss was attributed to water expelled during the condensation of the organosilicate network. These observations suggest both the mass and volume of the samples decreased to maintain constant densities. Although it was difficult to accurately measure the absolute volume of the samples, we did observe that the samples shrunk in diameter and slightly increased in thickness upon annealing. 62 Table 3.5. Summary of density measurements before and after annealing. All measurements were evaluated at 25°C. Relative error ~1.0%. Alkoxide DABA-25 Before Anneal (g/cm3) After Anneal (g/cm3) % Change Pure Polymer 22.5% TMOS 15.0% TMOS 22.5% MTMOS 15.0% MTMOS 22.5% PTMOS 15.0% PTMOS 1.472 1.508 1.427 1.451 1.443 1.468 1.510 1.434 1.449 1.444 -0.3% +0.2% +0.5% -0.2% +0.1% Alkoxide DABA-12 Before Anneal (g/cm3) After Anneal (g/cm3) % Change Pure Polymer 22.5% TMOS 15.0% TMOS 22.5% MTMOS 15.0% MTMOS 22.5% PTMOS 15.0% PTMOS 1.468 1.511 1.435 1.439 1.435 1.442 1.469 1.518 1.435 1.442 1.420 1.457 -0.0% +0.4% -0.0% +0.2% -1.1% +1.1% 63 However, a more likely explanation for the large increases in permeability and diffusivity may be that the molecular chain relaxation is enhanced during the annealing process. Unfortunately, the effects of chain relaxations on gas diffusion are not well characterized in the literature. We believe, that heating the polymer above the Tg caused a relaxation of the polymer chains and subsequently improved the molecular packing and enhanced the chain mobility.66 Physical changes to the polymer, such as free volume and chain mobility, would affect the diffusivity more than the solubility,67 which would be consistent with our permeation data. Additionally, this heat treatment may have induced a more uniform redistribution of the free volume within the polymer, making the diffusion process more sensitive to molecular size of the penetrant.66,68 Moe et al. reported that heating a fluorinated polyimide at 240°C for 24 hours favored the rapid transport of small gas molecules (H2) compared to larger gas molecules (CH4).68 However, our permeation data implies a different result. The 400°C annealing process appears to favor the diffusion of the larger gas penetrants. Larger differences in gas penetrant size, for a particular gas pair, resulted in larger decreases in permselectivity. For example, the permselectivity of similarsized oxygen and nitrogen (O2-N2) molecules decreased only by 5 to 10%, whereas the permselectivity of helium and methane (He-CH4), which had a greater difference in molecule size, resulted in a decrease of 30 to 60%. This observation may be due to a more uniform free volume distribution or local chain motions favoring a specific gas penetrant size. 64 3.10 Effects of Annealing To illustrate the effects of annealing, the relative changes of permeability and ideal selectivity were plotted as a function of molecule size. Figures 3.19 and 3.20 show the permeability after annealing (Panneal) normalized to the permeability before annealing (Po) for the two DABA contents (DABA-12 and DABA-25) in the polyimide matrix. Figures 3.21 and 3.22 show the ideal selectivity after annealing normalized to the ideal selectivity before annealing for each DABA content in the polyimide matrix. In each of the figures, the pure polyimide refers to 6FDA-6FpDA-DABA with no organosilicate content, which is used to qualify the properties of the hybrid systems. For the DABA-12 polyimide-based systems shown in Figures 3.20 and 3.22, the normalized permeability tends to increase with increasing molecule size, and the normalized selectivity generally decreases with increasing molecule size. This can be interpreted as the annealing process favors the permeability of larger molecules but does not favor the selectivity of gas pairs with large diameter differences. These results may be a consequence of the polymer chains experiencing a relaxation mechanism during the annealing process, which allows for the redistribution of free volume while maintaining localized cooperative motions. Different observations were noted for the DABA-25 polyimide-based systems in Figures 3.19 and 3.21. First, for the MTMOS and TMOS-based hybrids, the generalization that normalized permeability increases with increasing molecule size was broken at the nitrogen permeation. Second and most notable 65 is the increasing selectivity with annealing of the CO2/CH4 gas pair for the MTMOS and TMOS-based membranes. Undoubtedly, these observations correspond to the promising results presented in the boundary diagrams in section 3.7. It also suggests that the MTMOS and TMOS-based hybrids have similar mechanisms of diffusion, whereas the PTMOS-based hybrid has a mechanism of diffusion similar to the pure polyimide. I hypothesize that the polyimide phase-separates from the organosilicate domains in PTMOS-based hybrid membranes during annealing, thus creating a path of lesser resistance for the gas molecules to diffuse. 66 800% Pure Polymer 22.5wt% MTMOS 700% 15.0wt% MTMOS 22.5wt% TMOS 600% 22.5wt% PTMOS % PAnneal / Po 15.0wt% PTMOS 500% 400% 300% 200% CO2 He 100% 2.50 3.00 O2 N2 CH4 3.50 4.00 Kinetic Diameter (Angstroms) Figure 3.19. Normalized permeability as a function of molecule size for the 6FDA-6FpDA-DABA-25 polyimide based membranes. Pure polymer refers to pure 6FDA-6FpDA-DABA-25 polyimide. Panneal is the measurement of an annealed membranes. Po is the measurement of an unannealed membrane. 400% Pure Polymer 22.5wt% MTMOS 15.0wt% MTMOS 350% 22.5wt% PTMOS 15.0wt% PTMOS 22.5wt% TMOS % PAnneal / Po 300% 250% 200% 150% He 100% 2.50 CO2 3.00 O2 N2 3.50 CH4 4.00 Kinetic Diameter (Angstroms) Figure 3.20. Normalized permeability as a function of molecule size for the 6FDA-6FpDA-DABA-12 polyimide based membranes. Pure polymer refers to pure 6FDA-6FpDA-DABA-12 polyimide. Panneal is the measurement of an annealed membranes. Po is the measurement of an unannealed membrane. 67 140% Pure Polymer 22.5wt% MTMOS 15.0wt% MTMOS 120% % Change in Ideal Selectivity (P1/P2)annealed / (P1/P2) 22.5wt% TMOS 22.5wt% PTMOS 100% 15.0wt% PTMOS 80% 60% 40% 20% O2/N2 CO2/CH 4 He/CO2 He/O2 He/N2 He/CH4 0% 0.00 0.20 0.40 0.60 0.80 1.00 1.20 1.40 Kinetic Diameter Difference (Angstroms) Figure 3.21. Normalized ideal selectivity as a function of molecule size difference for the 6FDA-6FpDA-DABA-25 polyimide based membranes. 110% Pure 22.5wt% MTMOS % Change in Ideal Selectivity (P1/P2)Annealed / (P1/P2) 100% 15.0wt% MTMOS 22.5wt% PTMOS 90% 15.0wt% PTMOS 22.5wt% TMOS 80% 70% 60% 50% O2-N2 40% 0.00 0.20 CO2-CH4 0.40 He-CO2 0.60 He-O2 0.80 He-N2 1.00 He-CH 4 1.20 1.40 Kinetic Diameter Difference (A) Figure 3.22. Normalized ideal selectivity as a function of molecule size difference for the 6FDA-6FpDA-DABA-12 polyimide based membranes. (P1/P2)anneal is the measurement for annealed membranes. (P1/P2)o is the measurement for unannealed membranes. Subscripts 1 and 2 refer to different gases. The molecule size difference is measured as the difference in kinetic diameters for the selected gas pair. The dashed line represents no change with annealing. 68 3.11 Conclusions TGA-MS and FTIR-ATR analysis of the hybrid membranes showed that the annealing process is driving the condensation reactions to a greater extent, creating a denser SiO2 network. Neither the methyl nor phenyl ligands were decomposed from their respective hybrid samples during the 400°C annealing process. It was shown that the phenyl ligands decomposed from the PTMOS hybrid at 520°C, which is well above the annealing temperature. Degradation of the pure polyimide was attributed to two primary mechanisms, the condensation of the carboxylic groups along the backbone and thermal/hydrolytic degradation of the anhydride endgroups. In general, the annealing process increased permeation by about 200 to 500% and decreased the ideal permselectivity anywhere from 0 to 50%. The increase in permeability for these membranes was surprising considering that they became more crosslinked with the annealing process. For the hybrid materials, the changes in permselectivities after the annealing process vary with the type of alkoxide in the silica network. The permselectivity of the PTMOS hybrid membranes decreased significantly because the bulky phenyl group prevented effective crosslinking with the polyimide. Both the CO2-CH4 permselectivity and permeability increased for the 6FDA-6FpDA-DABA-25 22.5 wt% TMOS and MTMOS-based hybrid materials. The increases in permselectivity were attributed to effective crosslinking between the polyimide and organosilicate materials. The increases in permeability were attributed to relaxations of the polymer chains during the 69 annealing process, which increased localized segmental mobility and therefore the flux of gas penetrant molecules. 70 Chapter 4 4.1 Effects of Feed Pressure on Gas Transport Abstract The transport properties of fluorinated polyimides and fluorinated polyimide-organosilicate hybrid membranes were characterized as a function of feed pressure. Steady-state gas permeation experiments were performed at 35°C using pure CO2 and CH4 gases at feed pressures ranging from 4 to 30 atm. The non-crosslinked polyimide membranes consisted of a 6FDA-6FpDA polyimide and a 6FDA-6FpDA-DABA polyimide. The hybrid membranes consisted of phenyltrimethoxysilane (PTMOS) and methyltrimethoxysilane (MTMOS)-derived organosilicates covalently bonded to the 6FDA-6FpDA-DABA polyimide. All four materials exhibited dual mode sorption up to feed pressures of 17 atm, at which point the effects of CO2 plasticization were observed to varying degrees. 71 4.2 Results and Discussion The chemical structures of the two polyimides used in this study are illustrated in Figure 4.1. The permeabilities of pure CH4 and CO2 gases were measured at a temperature of 35°C and are plotted as a function of feed pressure in Figures 4.2 and 4.3. Gas permeation measurements of the noncrosslinked 6FDA-6FpDA polyimide corresponded well with data published by Wang et al.69 For both gases, the 6FDA-6FpDA-DABA polyimide membrane exhibited significantly lower permeabilities than the 6FDA-6FpDA polyimide due to hydrogen bonding interactions from the carboxylic groups on the DABA unit. This phenomenon has been well documented in previous studies.2-3 We believe these interactions were strong enough to decrease the chain mobility and therefore the permeability of the 6FDA-6FpDA-DABA polyimide. As shown in Figure 4.4, the ideal selectivity of the 6FDA-6FpDA-DABA polyimide is higher than 6FDA-6FpDA polyimide, which is consistent with this explanation. O CF3 N CF3 O CF3 N CF3 O O 6FDA-6FpDA O N O CF3 CF3 O O CF3 N N CF3 O O 7 CF3 CF3 O N O COOH 6FDA-6FpDA-DABA Figure 4.1. Chemical structure of 6FDA-6FpDA and 6FDA-6FpDA-DABA polyimides. 72 1 Fugacity (psia) 0 5 9.9 14.7 19.4 24.1 28.6 2.0 6FDA-6FpDA 6FDA-6FpDA-DABA MTMOS PTMOS CH4 Permeability (barrers) 1.8 1.6 1.4 1.2 1.0 0.8 0.6 0 5 10 15 20 25 30 CH4 Pressure (atm) Figure 4.2. Plot of pure CH4 permeability as a function of feed pressure for various polyimide and hybrid systems at 35°C. The permeabilities were calculated using the appropriate feed pressure. Error = ±2%. Fugacity (psia) 0 80 9.9 14.7 19.4 24.1 28.6 20 25 30 6FDA-6FpDA 6FDA-6FpDA-DABA MTMOS PTMOS 75 70 CO2 Permeability (barrers) 5 65 60 55 50 45 40 35 30 25 0 5 10 15 CO2 Pressure (atm) Figure 4.3. Plot of pure CO2 permeability as a function of feed pressure for various polyimide and hybrid systems at 35°C. The permeabilities were calculated using the appropriate fugacity. Error = ±2%. 73 56 6FDA-6FpDA 6FDA-6FpDA-DABA MTMOS PTMOS CO2 / CH4 Ideal Selectivity 52 48 44 40 36 32 0 5 10 15 20 25 30 Feed Pressure (psia) Figure 4.4. CO2/CH4 ideal selectivity plotted as a function of feed pressure for various polyimide and hybrid systems at 35°C. Error = ±4%. NMP Uptake gNMP/gPolymer 6FDA-6FpDA --- 6FDA-6FpDA-DABA --- MTMOS hybrid 1.13 PTMOS hybrid --- Table 4.1. Swelling data for the polyimides and polyimide-organosilicate hybrid materials. Both hybrid materials consist of an organosilicate covalently bonded to a 6FDA-6FpDA-D7ABA polyimide matrix. With the exception of the MTMOSbased hybrid, all materials swelled to such a degree that measurements were not possible. 74 Swelling measurements for each material are listed in Table 4.1. The amount of solvent uptake by a polymer was representative of the crosslink density. As expected, the two polyimides completely dissolved in NMP. In addition, the PTMOS-base hybrid swelled to such an extent that measurement was not possible. As reported elsewhere, this observation can be explained by poor bonding between the polyimide matrix and organosilicate domains, which resulted in low crosslink density.3 The gas permeation results of the PTMOSbased hybrid are also consistent with this explanation. The PTMOS-based hybrid exhibited slightly higher permeability than the 6FDA-6FpDA-DABA polyimide but the poorest selectivity of all the materials. The lack of polyimideorganosilicate interactions allows gases to diffuse faster but with less discrimination. On the contrary, swelling of the MTMOS-based hybrid was limited, an indication that the MTMOS alkoxide is effectively incorporated into the polyimide matrix. However, the permeabilities of the MTMOS-based hybrids were significantly higher than the 6FDA-6FpDA-DABA polyimide. Characterization results reported elsewhere3 suggest that the sol-gel processing of MTMOS leads to a loosely crosslinked structure, which contributes to higher diffusion rates. In the case of CH4 diffusion, all samples exhibited a decrease in permeability with increasing feed pressure up to 29 atm. This observation is consistent with dual mode sorption theory, thus we conclude that methane did not plasticize any of the membranes studied. However, different results were observed for the diffusion of CO2, as shown in Figure 4.3. All of the membranes 75 exhibited an initial decrease in permeability at feed pressures up to about 17 atm. Between 17 and 20 atm, each of the membranes began experiencing a slight increase in permeability, which was an indication of plasticization. It was surprising to see all the membranes respond in a similar manner at comparable feed pressures considering the diverse chemical structures of the materials. Apparently, all the materials are affected by CO2 at some critical concentration, in this case a feed pressure of 17 atm. Similarly, Staudt-Bickel and Koros reported the onset of plasticization at 17 atm for a non-crosslinked 6FDA-mPD polyimide29. This observation leads us to hypothesize that CO2 is interacting with the 6FDA-6FpDA segments, which is common to all the materials, causing CO2 plasticization at a common feed pressure. Since the hybrid materials in this study are crosslinked only at the polyimide-organosilicate interface, the bulk of the polymer matrix remains susceptible to plasticization. Another interesting observation is the pressure dependence of ideal selectivity is linear for the MTMOS-based hybrid membrane but nonlinear for the polyimide membranes. In fact, the polyimide membranes appear to be linear up to 14 atm, at which point the permeability begins to increase dramatically. The MTMOS-based hybrid membrane maintains a linear relationship between ideal selectivity and pressure, even at high pressures. The PTMOS-based hybrid membrane exhibits some unusual and unexpected behavior with higher selectivities at both low and high pressures, but is linear between these points. Plotting ideal selectivity as a function of pressure effectively cancels out the dualmode sorption effects and isolates the plasticization phenomenon. In other 76 words, the CO2 permeability increases with pressure more than the CH4 permeability for the polyimide membranes, but not the MTMOS-based hybrid membrane. Therefore, it appears that the CO2 plasticization has more influence on the pure polyimides than the MTMOS-based hybrid. To be certain, mixed gas permeation studies need to be performed to evaluate changes in selectivity with increasing feed pressure. For example, polymers that are plasticized by CO2 during a CO2-CH4 mixed gas experiment will experience a decrease in selectivity with increasing feed pressure because the polymer matrix will swell with increasing CO2 concentration, thereby permitting accelerated diffusion of both CO2 and CH4 gases. Figures 4.5 through 4.8 present the diffusion and solubility coefficients as a function of feed pressure. These values were determined using the Time Lag Method and are presented for qualitative analysis only. Again, I remind the reader that using the Time Lag Method in the analysis of glassy polymers does not always result in accurate absolute values for D and S. As illustrated in Figures 4.5 and 4.6, the diffusivity of all samples increases linearly with increasing feed pressure for both gases. This dependence is greater for CO2 than CH4. On the other hand, the solubility coefficient decreases with increasing feed pressure for both gases. For CO2, the solubility decreases exponentially, which will result in higher permeabilities at higher feed pressures. This observation corresponds well with the permeability data presented in Figure 4.3. These results are typical for the permeation of carbon dioxide through glassy polymers. 77 Fugacity (psia) 0 5 9.9 14.7 19.4 24.1 28.6 20 25 30 1.2 6FDA-6FpDA 6FDA-6FpDA-DABA MTMOS PTMOS Diffusivity 0.9 0.6 0.3 0.0 0 5 10 15 CH4 Pressure (atm) Figure 4.5. Plot of pure CH4 diffusivity as a function of feed pressure for various polyimide and hybrid systems at 35°C. The values were calculated using the appropriate feed pressure. Fugacity (psia) 0 5 9.9 14.7 19.4 24.1 28.6 20 25 30 13 6FDA-6FpDA 6FDA-6FpDA-DABA MTMOS PTMOS 12 11 10 Diffusivity 9 8 7 6 5 4 3 0 5 10 15 CO2 Pressure (atm) Figure 4.6. Plot of pure CO2 diffusivity as a function of feed pressure for various polyimide and hybrid systems at 35°C. The values were calculated using the appropriate fugacity. 78 Fugacity (psia) 0 5 9.9 14.7 19.4 24.1 28.6 2.4 6FDA-6FpDA 6FDA-6FpDA-DABA MTMOS PTMOS 2.2 Solubility 2.0 1.8 1.6 1.4 1.2 1.0 0 5 10 15 20 25 30 CH4 Pressure (atm) Figure 4.7. Plot of pure CH4 solubility as a function of feed pressure for various polyimide and hybrid systems at 35°C. The values were calculated using the appropriate feed pressure. Fugacity (psia) 0 5 9.9 14.7 19.4 24.1 28.6 12 6FDA-6FpDA 6FDA-6FpDA-DABA MTMOS PTMOS 11 10 Solubility 9 8 7 6 5 4 0 5 10 15 20 25 30 CO2 Pressure (atm) Figure 4.8. Plot of pure CO2 solubility as a function of feed pressure for various polyimide and hybrid systems at 35°C. The values were calculated using the appropriate fugacity. 79 4.3 Conclusions The permeability was plotted as a function of methane and carbon dioxide feed pressure for two fluorinated polyimides and two polyimide-organosilicate hybrid membranes. For methane, the permeability coefficient decreased with increasing feed pressure, which is consistent with dual mode sorption theory. For carbon dioxide, all membranes exhibited dual mode sorption behavior up to 17 atm, at which point the onset of plasticization becomes evident. Incidentally, all membranes exhibited plasticization behavior at a similar feed pressures, which may be due to CO2 interacting with the 6FDA-6FpDA segments. 80 Chapter 5 5.1 Recommendations Future Work To my knowledge, this is the first study that attempted to improve gas separation performance by annealing hybrid materials. Obviously, the effects of annealing on these systems is complicated and not completely understood. Further examination is required to determine the exact mechanisms of gas transport through these annealed hybrid membranes. In particular, there is a need for a gas transport model which could describe the diffusion of gas through heterogeneous systems, and relate this to the Time Lag Method. Further studies could examine the effects of heating and cooling rates on these systems. Presumably, the polyimide in this study will experience timedependent relaxations. Additionally, since two materials are present in these systems, rapid heating and cooling may affect the polyimide-organosilicate interface where the expansion coefficients may differ. In general, it would be good to study this interface, as it may be an important contribution to the gas transport. For example, preliminary small angle x-ray scattering (SAXS) results 81 indicate that upon annealing, large spherical domains are formed. Specifically, a TMOS-based hybrid sample has very small domains (46Å) before annealing and very large domains (2250Å) after annealing. One possible explanation for this is the larger domains actually contain polyimide chains constrained in an organosilicate network. This study also concluded that the organic ligands were not removed during the 400°C annealing process. The use of a ligand which decomposes at lower temperatures, such as methacryloxypropyl, which decomposes at 350°C, may be advantageous in this case. 43-44 Although methacryloxypropyl is a relatively large organic group, removing it from the organosilicate network may greatly improve the gas transport properties for olefins and paraffin separations. Finally, the annealing environment in the study was limited to nitrogen flowing over the membrane. It would interesting to examine the effects of annealing the hybrid materials under vacuum, as it may assist in removing the organic ligands or preventing some degradation to the polyimide. 82 5.2 References 1. C.J. Cornelius; E. Marand. Hybrid Inorganic-Organic Materials Bases on 6FDA-6FpDA-DABA Polyimide and Silica: Physical Characterization Studies. Polymer, 2002, 43, 2385. 2. C.J. Cornelius; E. Marand. Hybrid Inorganic-Organic Materials Based on a Series of Silica and Polyimide Composites: Gas Transport Properties. Journal of Membrane Science, submitted May 2001. 3. C.J. Cornelius; C. Hibshman; E. Marand. Hybrid Organic-Inorganic Membranes. Separation and Purification Technology, 2001, 25, 181. 4. C.J. Cornelius. Hybrid Inorganic-Organic Materials: Physical and Gas Permeation Properties for a Series of Fluorinated Polyimide Composites. Ph.D. Dissertation, Virginia Polytechnic Institute and State University, July 2000. 5. K. Ghosal; B.D. Freeman. Gas Separation Using Polymer Membranes: An Overview. Polymer for Advanced Technologies, 1994, 5, 673. 6. W.J. Koros; G.K. Fleming. Membrane-based gas separation. Journal of Membrane Science, 1993, 83, 1. 7. L.M. Robeson. Correlation of Separation Factor Versus Permeability for Polymeric Membranes. Journal of Membrane Science, 1991, 62, 165. 8. M. Smaihi; J.C. Schrotter; C. Lesimple; I. Prevost; C. Guizard. Gas Separation Properties of Hybrid Imide-Siloxane Copolymers with Various Silica Contents. Journal of Membrane Science, 1999, 161, 157. 9. R. Tamaki; Y. Chujo; K. Kuraoka; T. Yazawa. Application of OrganicInorganic Polymer Hybrids as Selective Gas Permeation Membranes. Journal of Materials Chemistry, 1999, 9, 1741. 10. C. Joly; S. Goizet; J.C. Schrotter; J. Sanchez; M. Escoubes. Sol-Gel Polyimide-Silica Composite Membrane: Gas Transport Properties. Journal of Membrane Science, 1997, 130, 63. 11. P. Sysel; R. Pulec; M. Maryska. Polyimide-Silica Hybrid Materials Based on a p-Aminophenyltrimethoxysilane Terminated Poly(amic acid)s. Polymer Journal (Toyko), 1997, 29, 607. 12. J.B. Alexopoulos, J.A. Barrie and D. Machin. The Time Lag for the Diffusion of Gas Mixtures. Polymer, 1969, 10, 265. 83 13. H.L. Frisch. Fundamentals of Membrane Transport. Polymer Journal, 1991, 23, 445. 14. F. Vasak; Z. Broz. A Method for Determination of Gas Diffusion and Solubility Coefficients in Poly(Vinyltrimethysilane) Using a Personal Computer. Journal of Membrane Science, 1993, 82, 265. 15. D. Perry; W.J. Ward; E.L. Cussler. Unsteady Diffusion in Barrier Membranes. Journal of Membrane Science, 1989, 44, 305. 16. D.R. Paul; D.R. Kemp. The Diffusion Time Lag in Polymer Membranes Containing Adsorptive Fillers. Journal Polymer Science: Symposium No. 41, 1973, 79. 17. A.S. Michaels ; W.R. Vieth; J.A. Barrie. Diffusion of Gases in Polyethylene Terephthalate. Journal of Applied Physics, 1963, 34, 13. 18. J.H. Petropolous. Quantitative Analysis of Gaseous Diffusion in Glassy Polymers. Journal of Polymer Science : Part A-2, 1970, 8, 1797. 19. D.R. Paul. Effect of Immobilizing Adsorption on the Diffusion Time Lag. Journal of Polymer Science Part A-2, 1969, 7, 1811. 20. D.R. Paul; W.J. Koros. Effect of Partially Immobilizing Sorption on Permeability and the Diffusion Time Lag. Journal of Polymer Science: Polymer Physics Ed., 1976, 14, 675. 21. R.J. Pace; A. Datyner. Statistical Mechanical Model for Diffusion of Simiple Penetrants in Polymers. I. Theory. Journal of Polymer Science: Polymer Physics Ed., 1979, 17, 437. 22. R.E. Kesting; A.K. Fritzsche. Polymeric Gas Separation Membranes. John Wiley and Sons, Inc., New York, United States, 1993. 23. C.M. Zimmerman; A.Singh; W.J. Koros. Diffusion in Gas Separation Membrane Materials: A Comparison and Analysis of Experimental Characterization Techniques. Journal of Polymer Science: Part B: Polymer Physics, 1998, 36,1747. 24. B.D. Freeman. Basis of Permeability/Selectivity Tradeoff Relations in Polymeric Gas Separation Membranes. Macromolecules, 1999, 32, 375. 25. J.H. Petropoulos. Plasticization Effects on the Gas Permeability and Permselectivity of Polymer Membranes. Journal of Membrane Science, 1992, 75, 47. 84 26. C.K. Yeom; S.H. Lee; J.M. Lee. Study of Transport of Pure and Mixed CO2/N2 Gases Through Polymeric Membranes. Journal of Applied Polymer Science, 2000, 78, 179. 27. X.G. Li; I. Kresse; Z.K. Xu; J. Springer. Effect of Temperature and Pressure on Gas Transport in Ethyl Cellulose Membrane. Polymer, 2001, 42, 6801. 28. E.D. Sanders ; S.M. Jordan; R. Subramanian. Penetrant-plasticized permeation in polymethylmethacrylate. Journal of Membrane Science, 1992, 74, 29. 29. C. Staudt-Bickel; W.J. Koros. Improvement of CO2/CH4 Separation Characteristics of Polyimides by Chemical Crosslinking. Journal of Membrane Science, 1999, 155, 145. 30. A. Bos; I.G.M. Pünt; M. Wessling; H. Strathman. CO2-induced plasticization in glassy polymers. Journal of Membrane Science, 1999, 155, 67. 31. M. Wessling; S. Schoeman; Th. van der Boomgaard; C.A. Smolders. Plasticization of Gas Separation Membranes. Gas Separation and Purification, 1991, 5, 222. 32. J.J. Krol; M. Boerrigter; G.H. Koops. Polyimide Hollow Fiber Gas Separation Membranes: Preparation and the Suppression of Plasticization in Propane/Propylene Environments. Journal of Membrane Science, 2001, 184, 275. 33. A. Bos; I.G.M. Pünt; M. Wessling; H. Strathman. Suppression of CO2Plasticization by Semiinterpentrating Polymer Network Formation. Journal of Polymer Science: Part B: Polymer Physics, 1998, 36, 1547. 34. B. Wang; G.L. Wilkes. Journal of Polymer Science: Part A: Polymer Chemistry, 1991, 29, 905. 35. H. Schmidt. Non-crystalline Solids, 1985, 73, 681. 36. A.B. Brennan. Ph.D. Dissertation, Virginia Polytechnic Institute and State University, 1990. 37. F. Orgaz-Orgaz. Gel to Glass Conversion: Densification Kinetics and Controlling Mechanisms. Journal of Non-Crystalline Solids, 1988, 100, 115. 85 38. C.J. Brinker; G.W. Scherer. Sol-Gel Science - The Physics and Chemistry of Sol-Gel Processing, Academic Press, Inc., San Diego, 1990. 39. P.F. James. The Gel to Glass Transition: Chemical and Microstructural Evolution. Journal of Non-Crystalline Solids, 1988, 100, 93. 40. M.M. Collinson. Analytical Applications of Organically Modified Silicates. Mikrochimica Acta, 1998, 129, 149. 41. N.K Raman; C.J. Brinker. Organic “Template” Approach to Molecular Sieving Silica Membranes. Journal of Membrane Science, 1995, 105, 273. 42. N.K Raman; M.T. Anderson; C.J. Brinker. Template-Based Approach to the Preparation of Amorphous, Nanoporous Silicas. Chemical Materials, 1996, 8, 1682. 43. Y. Lu; C. Guozhong; R.P. Kale; S. Prabakar; G. Lopez; C.J. Brinker. Microporous Silica Prepared by Organic Templating: Relationship between the Molecular Template and Pore Structure. Chemical Materials, 1999, 11, 1223. 44. Y.S. Kim; K. Kusakabe; S. Morooka; S.M. Yang. Preparation of Microporous Silica Membranes for Gas Separation. Korean Journal of Chemical Engineering, 2001, 18, 106. 45. K. Kusakabe; S. Sakamoto; T. Saie; S. Morooka. Pore Structure of Silica Membranes Formed by a Sol-Gel Technique using Tetraethoxysilane and Alkyltriethoxysilanes. Separation and Purification Technology, 1999, 16, 139. 46. B.K. Sea; K. Kusakabe; S. Morooka. Pore Size Control and Gas Permeation Kinetics of Silica Membranes by Pyrolysis of PhenylSubstituted Ethoxysilanes with Cross-Flow Through a Porous Support Wall. Journal of Membrane Science, 1997, 130, 41. 47. J.Y. Ying; J.B. Benzinger. Structure Tailoring of Alkoxide Silica. Journal of Non-Crystalline Solids, 1992, 147, 222. 48. J.A. Cella. Degradation and Stability of Polyimides. Polymer Degradation and Stability, 1992, 36, 99. 49. T. Ozawa; T. Arii; A. Kishi. Thermogravimetry and Evolved Gas Analysis of Polyimide. Thermochimica Acta, 2000, 352, 177. 50. E. Jakab; F. Till; T. Szekely; S.S. Kozhabekov; B.A. Zhubanov. Thermal Decomposition of Aryl-Alicyclic Polyimides Studied by 86 Thermogravimetry/Mass Spectrometry and Pyrolysis-Gas Chromatography/Mass Spectrometry. Journal of Analytical and Applied Pyrolysis, 1992, 23, 229. 51. B. Crossland; G.J. Knight; W.W. Wright. Thermal Degradation of Some Polyimides. British Polymer Journal, 1987, 19, 291. 52. M.J. Turk; A.S. Ansari; W.B. Alston; G.S. Gahn; A.A. Frimer;D.A. Scheiman. Evaluation of the Thermal Oxidative Stability of Polyimides via TGA Techniques. Journal of Polymer Science: Part A: Polymer Chemistry, 1999, 37, 3943. 53. C.W. Jones; W.J. Koros. Carbon Molecular Sieve Gas Separation Membranes-I. Preparation and Characterization Based on Polyimide Precursors. Carbon, 1994, 32, 1419. 54. V.C. Geiszler; W.J. Koros. Effects of Polyimide Pyrolysis Conditions on Carbon Molecular Sieve Membrane Properties. Industrial & Engineering Chemistry Research, 1996, 35, 2999. 55. I. Howe; D.H. Williams; R.D. Bowen. Mass Spectrometry – Principles and Applications. 2nd ed. McGraw-Hill Inc., 1981. 56. R.M. Silverstein; G.C. Bassler; T.C. Morrill. Spectrometric Identification of Organic Compounds. 4th ed. John Wiley & Sons, Inc., 1981. 57. J. Gallardo, P.Galliano, A. Duran. Thermal Evolution of Hybrid Sol-Gel Silica Coatings: A Structural Analysis. Journal of Sol-Gel Science and Technology, 2000, 19, 393. 58. A. Venkateswara Rao, G.M. Pajonk. Effect of Methyltrimethoxysilane as a co-precursor on the optical properties of silica aerogels. Journal of NonCrystalline Solids, 2001, 285, 202. 59. G. Zhang; Y. Chen; H. Li; Y. Xie. Preparation of Silica-Based InorganicOrganic Hybrid Membranes via the Sol-Gel Route. Journal of Sol-Gel Science and Technology, 2000, 19, 425. 60. P.D. Maniar; A. Navrotsky; E.M. Rabinovich; J.Y. Ying; J.B. Benzinger. Energetics and Structure of Sol-Gel Silicas. Journal of Non-Crystalline Solids, 1990, 124, 101. 61. K.A. Mauritz; J.T. Payne. [Perfluorosulfonate ionomer]/Silicate Hybrid Membranes via Base-Catalyzed in situ Sol-Gel Processes for Tetraethylorthosilicate. Journal of Membrane Science, 2000, 168, 39. 87 62. Andre P. Legrand, The Surface Properties of Silicas, John Wiley and Sons, New York, 1998. 63. Y. Yan; Y. Hashino; Z. Duan; S.R. Chaudhuri; A. Sarkar. Design and Characterization of Interconnected Microporous Hybrid Thin Films by a Sol-Gel Process. Chemical Materials, 1997, 9, 2583. 64. G. Qian; Z. Yang; C. Yung. Matrix effects and mechanisms of the spectral shifts of coumarin 440 doped in sol-gel-derived gel glass. Journal of Applied Physics, 2000, 88, 2503. 65. M.H. Cohen; D. Turnbull. Molecular Transport in Liquids and Glasses. Journal of Chemical Physics, 1959, 31, 1164. 66. H.H. Hoehn. Heat Treatment of Membranes of Selected Polyimides, Polyesters and Polyamides. U.S. Patent 3,822,202. 1974. 67. J.S. McHattie; W.J. Koros; D.R. Paul. Gas transport properties of polysulfones: 1. Role of symmetry of methyl group placement of bisphenol rings. Polymer, 1991, 32, 840. 68. M. Moe; W.J. Koros; H.H. Hoehn; G.R. Husk. Effects of Film History on Gas Transport in a Fluorinated Aromatic Polyimide. Journal of Applied Polymer Science, 1988, 36, 1833. 69. R. Wang; C. Cao; T.-S. Chung. A Critical Review on Diffusivity and the Characterization of Diffusivity of 6FDA-6FpDA Polyimide Membranes for Gas Separation. Journal of Membrane Science, 2002, 198, 259. 88 Appendix A.1 LABTECH NOTEBOOK Software General Information LABTECH NOTEBOOK Version 7.3.0 software was employed to assist with the data acquisition from the two gas permeation systems. The master diskettes and manuals for NOTEBOOK can be found in the glass cabinet above the IR equipment. The purpose of this appendix is to assist graduate students in understanding the NOTEBOOK programs we developed to acquire data. A.2 Systems We currently have two separate, yet very similar, gas permeation systems in our laboratory. The gas permeation setup using the GC 6000 oven to control the temperature will be referred to as “System CJC,” named after Chris J. Cornelius, who constructed the system. The other system will be referred to as “System CLH,” after Chris L. Hibshman, who constructed that system. Each 89 system has its own computer and both systems have similar LABTECH NOTEBOOK software programs. There are several differences between the two systems. First, System CJC can be operated at higher temperatures, at least up to 125°C, whereas System CLH is limited to 50°C. In addition, System CJC has five feed valves, one for each of five different gases. This will allow for up to five different gases to be run consecutively by the “batchrun” process, which is described later. System CLH has only one feed valve, which means that the feed gas must be changed prior to each testing sequence. Finally, the systems have different input/output (I/O) boards that interface with the computer. This will be evident in the relevant programming of each system. A.3 Computer Architecture There are two main executable (.exe) files in the NOTEBOOK software package, bld_nb.exe and batchrun.exe, that are used for programming. bld_nb.exe is where the programs are visually constructed. batchrun.exe is used to join several bld_nb.exe programs together to run consecutively. In order to run the batchrun.exe program, each bld_nb.exe program must be located in an individual folder. Therefore, each computer has a directory that contains a list of folders to support the bld_nb.exe programs contained in the respective folder. This list is tabulated in Table A.1. Each bld_nb.exe program is created to satisfy the specific testing conditions of each gas, namely the 90 sampling protocol, length of test, and to open and/or close specified valves. The only difference for the bld_nb.exe file in the degassing programs is the length of time the system degasses. A.4 bld_nb.exe Program Sections A.4-A.7 concern only the bld_nb.exe program. To follow along, open an existing bld_nb.exe program listed in Table A.1 by double-clicking on the filename. A.5 Main Menu As is common with most Windows-based software, there is a menu at the top of the page including “File” and “Run” buttons. Clicking on “File” allows one to exit the bld_nb.exe program. Clicking on “Run” allows one to run the program currently shown on the computer screen. 91 Table A.1 List of program folders in their respective directories. Name in System CLH Name in System CJC Working directory C:\batch\ C:\cjc\ Degasses for 3 minutes nb_003m --- Degasses for 30 minutes Degasses for 45 minutes Degasses for 60 minutes Degasses for 90 minutes Degasses for 120 minutes Degasses for 180 minutes Degasses for 240 minutes Helium Test Oxygen Test Nitrogen Test Methane Test Carbon Dioxide Test nb_030m nb_045m --nb_090m --nb_45m nb_60m nb_90m nb_120m nb_120m nb_180m nb_180m nb_240m nb_240m nb_he nb_o2 nb_n2 nb_ch4 nb_co2 nb_he nb_o2 nb_n2 nb_ch4 nb_co2 92 A.6 Description of Buttons – Left Side As you may notice, there are several buttons on the left side of the screen. This section will describe the purpose of these buttons. A. Save/Recall allows one to save, recall, and delete any program stored in this file. Single click on the button and a new screen will appear. Use the arrow keys on the keyboard to move the highlighted cursor. The mouse does not work in this screen. Hit enter to select save, recall or delete. If any programs are present, they will be listed on the screen. If you wish to save the current program, type a new name. If you wish to recall or delete a program, type the exact program name where the cursor is blinking and hit enter. Many different programs can be saved under this section. In fact, if you wish to alter a program, I suggest saving it as a separate name. This will allow you to return to the original settings by simply recalling the original program. You are permitted to look at only one program at a time. If you cannot open a program, be sure that other NOTEBOOK programs are closed. WARNING: Be careful! The program will not ask if you are sure you want to save, recall or delete any programs. It is very easy to accidentally overwrite or delete an existing program. B. Zoom allows one to zoom in and zoom out of the screen by clicking the arrows. 93 C. # button will show the block number associated with each block in the blue screen. D. Trash Can looks like a disappearing square hole in the bottom left of screen. Click and drag a block from the blue screen onto this button and the block will be deleted from the program. Be careful, you will not be able to retrieve it! A.7 Description of Blocks – Bottom of Screen At the bottom of the screen, there are twenty-eight blocks representing the different types used for programming. To add any of these blocks to the program, click and drag the block onto the blue area of the screen. To change the placement of any block, simply click and drag. To delete a block, refer to Section A.6.D. To start, double click on an existing block. A new screen will appear. To exit this screen, click on the “Done” button or hit the “Esc” key. The first two lines of this screen are information about the total Number of Blocks in the program and the Current Block number you are currently viewing. The blocks are numbered by the order in which they are added to the programming screen. The next line is labeled as the Block Type and should be highlighted in blue. This blue highlight is the cursor. This cursor will move by using the arrow keys on the keyboard or clicking on a different space with the mouse. The block 94 type can be changed at this line by hitting enter. A list will appear and the desired block type can be chosen form the list by scrolling and hitting enter. The next two lines correspond to the Block Name and Units. Each block can have its own name and units, as chosen by the programmer. The first five lines are common for most blocks. The following lines are used to dictate the programming of each block. The list that follows is a description of how each block is used for our purposes. This list certainly does not include every function of every type of block. See the user’s manual for more details. A. Digital Output Block (ON/OFF) – Each of these blocks corresponds to one of the solenoid valves in the permeation system. The block name usually describes each block with its corresponding valve. a. Interface Device, Interface Channel, and Bit Number correspond to the appropriate board name, channel number, and bit number, as shown in Tables A.2 and A.3. b. Upper and Lower Limits set the values at which the valve will perform the appropriate operation. The Output Polarity and Loop Type determine if the operation is to occur inside or outside the limits. The values are fail-close, meaning they will automatically close unless instructed otherwise or if power/pressure is lost to the system. c. The Input Block Number is automatically determined by connecting an arrow to a particular block. For the permeation setup, our upper and lower limits correspond to the vacuum or 95 permeate pressure, so the input block number corresponds to the permeate pressure block. For example, the lower limit of the feed valve is about 0.200 cmHg, which means the pressure must be less than 0.200 cmHg in order to open that valve and start the test. The lower limits of other valves are -1.000 cmHg, a value that cannot be obtained, which means the valves will always be open during the program until hitting the upper limit. d. Buffer Size, Number of Stages, Sampling Period, and Stage Duration are all related to how often data is measured. The buffer size is simply the number of times data is measured. The number of stages is determined by how many different sampling periods are desired. The stage duration determines the length of each sampling period. Typically, these programs follow the regime described in Table A.4, which has 3 sampling stages for different sampling periods and durations. The total buffer size in Table A.4 is 3720, so the number in buffer size must be 3720 or the program will not run. This sampling regime is designed to collect many points in the beginning of the permeation test to accurately define the time-lag. 96 Table A.2 – Interface Channel and Bit Numbers for each valve of System CLH. The Interface Device is 0:PIO-12. Valve Interface Channel Bit Number A 2 4 B C D E F G H I J K L M N 2 2 2 1 1 1 1 1 1 1 1 0 0 5 6 7 0 1 2 3 4 5 6 7 1 2 Table A.3 – Interface Channel and Bit Numbers for each valve of System CJC. The Interface Device is 2:5632TTL. Valve Interface Channel Bit Number 1 (CO2) 2 (CH4) 3 (N2) 4 (O2) 5 (He) 6 7 0 0 0 0 0 0 0 1 2 3 4 5 6 7 Table A.4 – Description of typical sampling regime for permeation tests. Stage Sampling Period Stage Duration Buffer Size 1 2 3 0.1 seconds 60 seconds 600 1.0 seconds 600 seconds 600 10 seconds 25200 seconds 2520 97 B. Analog Input Block (AI) – Each of these blocks corresponds to a measurement device, which is usually a pressure transducer. The block name usually describes the device used in the permeation system. a. Interface Device and Interface Channel correspond to the appropriate board name and channel number, as shown in Tables A.5 and A.6. b. Input Range corresponds to the output voltage of the measurement device, which can usually be found on the device or the operator’s manual for the specific device. c. Scale Factor and Offset Constant are used to convert the output voltage of the measurement device to appropriate measurement units. For example, the MKS 722A series pressure transducer has a voltage output of 10 volts. The range of pressure transducer is 0100 Torr, but we want the measurement in cmHg. Therefore the scale factor is 1.0 and the offset constant is 0.0 (as long as the pressure transducer is zeroed properly). d. Buffer Size, Number of Stages, Sampling Period, and Stage Duration are the same values as the digital output block (see Section A). 98 Table A.5 – Interface Channel and Bit Numbers for each measurement device of System CLH. The Interface Device is 1:DAS-8PGA. Device Permeate (Cell) Pressure Transducer Feed Pressure Transducer Cell Temperature (RTD) Ambient Temperature (RTD) Channel 0 2 4 5 Table A.6 – Interface Channel and Bit Numbers for each measurement device of System CJC. The Interface Device is 1:DAS-8PGA. Device Channel Permeate Pressure Feed Cell Pressure Vacuum Pressure (analog) 0 1 3 C. Thermocouple (TC) – A thermocouple block is very similar to the analog input block, but usually has a different input range. This type of block is only used in System CJC. System CLH used an analog input block to measure the temperature. a. Interface Device and Interface Channel correspond to the appropriate board name and channel number, as shown in Table A.7. Table A.7 – Interface Channel and Bit Numbers for each thermocouple of System CJC. The interface device is 3:5508TC. Device Cell Temperature Oven Temperature Channel 81 83 99 b. Temperature Scale describes the units of measurement. c. Input Range corresponds to the output voltage of the measurement device, which can usually be found on the device or the operator’s manual for the specific device. d. Thermocouple Type is set by the manufacture and is available in the operator’s manual. e. Scale Factor and Offset Constant are used to calibrate the thermocouple. Typically, one would compare the measured value with a thermometer using a beaker of water at different temperatures. Buffer Size, Number of Stages, Sampling Period, and Stage Duration are the same values as the digital output block (see Section A). D. Time – This block measure the time of the run. a. Format allows one to determine how the units are displayed. b. Mode allows one to dictate how the measurements are taken. c. Buffer Size, Number of Stages, Sampling Period, and Stage Duration are the same values as the digital output block (see Section A). E. Calculated (Off All) – Allows the programmer to choose from a list of many different operations. 100 a. Operation is chosen as “Off All” to close all the valves at the end of the run. b. Buffer Size, Number of Stages, Sampling Period, and Stage Duration are the same values as the digital output block (see Section A). c. Analog Trigger Value is the same as the upper limit for the digital output blocks (see Section A). F. File – Determines the file name where the data can be written. a. Data File Name is the directory and given name of the data file. Typically, the file is listed as a data (.dat) file. If several runs are made consecutively, the last digit is an ampersand, which will prevent the previous file from being overwritten. b. Storage Mode is the type of file. We use ASCII Real to collect the data. c. Header Lines allows on to add text to the top of the file, such as the date of the run. d. Data File Opening/Closing Mode determines when the data file will open and when to close. e. Number of Records to Close File should be equal to the buffer size in other blocks. 101 f. Number of Columns in File will determine how many columns are in the data file. This number should equal the number of measurement devices in the program. g. The last 5 lines will format the columns with labels, units, width and decimal places. G. Display – This block will format the display when performing a run. This will not affect the data collection, but is a nice visual to see during a run. a. The arrows on the upper right of the block (if you do not see arrows in the upper right, double-click on the block) will minimize and maximize the block. To add or delete windows in the display, you must first maximize the block. To add a window, click and drag in the black area. Click “exit” to leave this mode. To change the position or size of a window, click on the window of choice to adjust. b. Go back to the previous Display block. Click in the black area (not a window) and a new screen will appear. This is how one adjusts the formatting of the windows, such as scale and units. c. Go back to the previous Display block. Click on a window (not the black area) and a new screen will appear. This is used to customize the formatting or how the data is displayed. 102 A.8 batchrun.exe Program (Batchrun) Sections A.8-A.11 concern only the batchrun.exe program. The purpose of the batchrun program is to consecutively run programs without user interruption. To follow along, open an existing batchrun.exe from one of the gas tests listed in Table A.1 by double-clicking on the filename. A.9 Main Menu As is common with most Windows-based software, there is a menu at the top of the page. The “File” button gives the user the option of exiting the batchrun.exe program or saving the current settings for later use. A.10 Buttons A. Clicking on the Start button will start the batchrun program. A new window will appear, which indicates that the first step in the “Files to Run” list has started. B. Clicking on the Stop button will stop the batchrun program, but will not stop the bld_nb.exe program that is currently running. The batchrun program will stop when current bld_nb.exe program is finished. C. If the Run on Startup box is checked, the batchrun program will automatically start when opened. In other words, the “Start” button will be automatically clicked for the user when this screen is opened. I recommend this not be clicked unless running a series of gases. 103 D. Number of Files to Run corresponds to the number of steps in the “Files to Run” list. E. Number of Iterations determines how many times the “Files to Run” list repeats itself. F. The white box at the bottom of the screen displays the current status of the batchrun program. Typical displays are “running”, “stopping” and “completed.” G. Files to Run is always run_nb.exe for these programs. The Working Directory corresponds to where the run_nb.exe program is found and subsequently what program is run. Typically, a run_nb.exe program from a degassing program (i.e. nb_120m) is run first to degas the system. This is followed by a testing program (i.e. nb_he) to start the test and collect the permeation data. A.11 Testing Consecutive Gases The batchrun program can be set to run a series of gases without user interruption. For example, if set properly, the permeation system will perform 3 runs of helium, 3 runs of oxygen, 3 runs of nitrogen, 3 runs of methane and 3 runs of carbon dioxide at one click of the “Start” button. To do this, the last filename in the “Files to Run” column should be batchrun.exe in the directory corresponding to the next gas in line. See Table A.8 for an example. In addition, the “Run on Startup” box must be checked in each batchrun program. 104 Table A.8 – Example of how to run consecutive batchrun programs. 1 2 3 4 5 6 7 Files to Run Working Directory run_nb.exe run_nb.exe run_nb.exe run_nb.exe run_nb.exe run_nb.exe batchrun.exe nb_120 nb_n2 nb_120 nb_n2 nb_120 nb_n2 nb_ch4 105 Vitae Christopher L. Hibshman was born in Lancaster County, Pennsylvania in 1977. After graduating from Garden Spot High School in 1996, Chris attended Virginia Tech to study chemical engineering. After his freshman year at college, he was employed by Lockheed Martin Federal Systems as a co-op for three semesters to work in a semiconductor fabrication facility. This facility produced radiation-hardened computer chips for space and military applications. Chris was in need of a job during the summer of 1999. This is when he approached Dr. Eva Marand and started working as an undergraduate research assistant. His initial research project did not work as anticipated, so instead he focused on annealing these hybrid materials in an attempt to improve the gas transport properties. Eventually, this project evolved from some unexpected observations to a Master’s thesis. For the future, Chris has accepted a job at Eastern Research Group in Chantilly, VA where he will use his chemical engineering skills as an environmental consultant. 106