1
2015 OSIsoft TechCon
Geospatial Analysis
in Real Time
1|P age
Table of Contents
Table of Contents .......................................................................................................................................... 1
Introduction .................................................................................................................................................. 2
1. Verify that Prerequisites and Configuration Steps are Complete............................................................. 8
2. Verify that the PI AF Database is ready................................................................................................... 16
3. Create a Service and Layer via the PI Integrator for Esri ArcGIS ............................................................. 20
4. Run the ArcGIS Platform Wizard ............................................................................................................. 33
5. Create an ArcGIS Online Web Map to display the new Feature Service ................................................ 42
6. Add PI Coresight integration to the ArcGIS Online Web Map ................................................................ 49
7. Create an Operations View dashboard around that Web Map .............................................................. 53
Conclusion ................................................................................................................................................... 73
Appendix ..................................................................................................................................................... 74
OSIsoft Virtual Learning Environment ........................................................................................................ 76
1|P age
2015 TechCon Session
Introduction
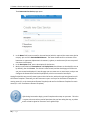
“The ArcGIS Online Organization subscription configured in this lab has expired. However you can work
on this lab using your own organization in ArcGIS Online. If you are not a member of an existing
organization, you can get a 60 day free trial: http://www.arcgis.com/features/freetrial.html?origin=arcgis”
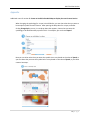
This session explores the newly formed partnership between Esri’s ArcGIS powerful mapping platform
and the real-time PI System infrastructure. In this session, you will discover how easy it is to connect
your PI System to your Esri ArcGIS platform to create an operational view of critical metrics on your
enterprise in a geospatial way. You’ll be guided through a few different scenarios to discover the power
of real-time data in a mapped world. Together, we will explore Esri’s ArcGIS platform and discover how
to use Esri’s Operations Dashboard for ArcGIS client to create insightful map-based dashboards of live PI
System data. You’ll also create valuable calculations through your PI AF Server, and you’ll learn how to
launch integrated PI Coresight displays from Esri maps to drill down into your data.
We have prepared an environment for you that represents a typical site that has both a PI System and
the Esri ArcGIS platform installed. Specifically, you will each have access to a pair of virtual machines,
one running a self-contained PI System—including the new PI Integrator for Esri ArcGIS—and another
virtual machine that runs an the Esri ArcGIS platform, including the required GeoEvent Extension. You
will use these two machines to walk through the workflow of creating a dashboard with a live map,
populated with live data from the PI System.
Regarding the two virtual machines that you’ll be using: on the OSIsoft side, we’ve installed the PI
System 2014, which includes both the PI Data Archive and the PI Asset Framework. Additionally, that
machine is running PI Coresight 2014, for visualizing data. We’ve preinstalled the PI Integrator for Esri
ArcGIS for you as well—and finally, in order to make using the Integrator easier, we have preloaded a PI
AF Database for you that already contains PI AF Templates, in addition to preloading all of the required
PI points as well, and the requisite simulated data for the scenario.
On the Esri side, on that VM we have installed ArcGIS Server 10.2.2, along with GeoEvent Extension for
Server 10.2.2, and finally, Esri’s Operations Dashboard, the free Esri client tool that will be used at the
end to create a custom dashboard.
Your instructors will inform you how to access these machines; after you have access to them, as a class
you’ll be guided through the following steps:
1. Verify that the requisite configuration steps have been performed on the GeoEvent Extension
and on the PI Integrator for Esri ArcGIS Application Server
2. Verify that the PI AF Database is ready for use (that it contains properly structured PI AF Element
Templates, and that data for all of the Elements is updating properly)
3. Create a Service and two Layers via the PI Integrator for Esri ArcGIS Application Server, one
Layer for static (immobile) Elements and one Layer for mobile Elements
2|P age
Introduction
4. Create a new Feature Service and Configure the GeoEvent Extension via the ArcGIS Platform
Wizard
5. Create a new ArcGIS Online Web Map to display the newly created Feature Service
6. Add PI Coresight integration to the ArcGIS Online Web Map
7. Create a custom dashboard around that Web Map, using Esri’s Operations Dashboard
If you ever have any questions, feel free to ask an instructor. Additionally, you can find the user guide at
the OSIsoft Live Library (livelibrary.osisoft.com), under Integrators > PI Integrator for Esri ArcGIS.
3|P age
2015 TechCon Session
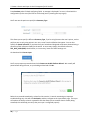
Below is are the names of the machines that you can use for this class, along with the credentials that
you’ll use for signing into them and arcGIS Online. We’ve included the names and credentials twice, and
we recommend tearing out one of the below sections from the book and keeping it close so you can be
quickly reminded of what credentials and machine names to use.
“The ArcGIS Online Organization subscription configured in this lab has expired. However you can work
on this lab using your own organization in ArcGIS Online. If you are not a member of an existing
organization, you can get a 60 day free trial: http://www.arcgis.com/features/freetrial.html?origin=arcgis”
Windows Credentials
Username
Nugreen\PISandboxAdmin
Password
0nc3Inawhil3!
ArcGIS GeoEvent Extension Credentials
Username
arcgis
Password
arcG1$88
ArcGIS Online Credentials
Username
User____ (your name will be User001, User002, etc.)
Password
osisoftesri1
Servers
PI Server Name
PI1
4|P age
Introduction
ArcGIS Server Name
GEP1
Integrator Application Server
https://pi1.nugreen.org:6443/pigeoportal
GeoEvent Extension Manager
https://gep1.nugreen.org:6143/geoevent/manager
This page was intentionally left blank.
5|P age
2015 TechCon Session
Tear out this page and keep it nearby as a handy reference.
Windows Credentials
Username
Nugreen\PISandboxAdmin
Password
0nc3Inawhil3!
ArcGIS GeoEvent Extension Credentials
Username
Arcgis
Password
arcG1$88
ArcGIS Online Credentials
Username
User____ (your name will be User001, User002, etc.)
Password
osisoftesri1
Servers
PI Server Name
PI1
ArcGIS Server Name
GEP1
Integrator Application Server
https://pi1.nugreen.org:6443/pigeoportal
GeoEvent Extension Manager
https://gep1.nugreen.org:6143/geoevent/manager
6|P age
Introduction
This page was intentionally left blank.
7|P age
2015 TechCon Session
1. Verify that Prerequisites and Configuration Steps are Complete
We have already installed all of the required software components for you, and after doing that, we
have completed the prerequisite configuration steps on both the ArcGIS GeoEvent Extension and the PI
Integrator for Esri ArcGIS.
The steps that we have already completed for you are:
1. Trust certificates for the GeoEvent Extension and for the PI Integrator for Esri ArcGIS
2. Install the PI Integrator for Esri ArcGIS Data Relay and verify that it is communicating with the PI
Integrator for Esri ArcGIS Application Server
3. Register at least one PI Coresight Server endpoint in the Application Server
4. Register at least one ArcGIS GeoEvent Extension endpoint in the Application Server
5. Register at least one valid Data Store on the GeoEvent Extension *(you’ll finish this yourself).
We’ll together walk through those configuration steps, even though they are already finished, so that
you’ll be familiar with what will need to be done on a completely new installation.
1. Trust certificates for the GeoEvent Extension and for the PI Integrator for Esri ArcGIS
After being instructed to begin, you will complete these steps on your own. This class
is a great chance to ask any and all questions that you have along the way, so please
do raise a hand to signal an instructor--we’re glad to help.
Both the PI Integrator for Esri ArcGIS Application Server and the ArcGIS GeoEvent Extension web sites
use HTTPS, and thus, if their certificates aren’t trusted, if you try to navigate to either web page, you will
see a security error, informing you that the certificate isn’t trusted.
You can use the web browser that is installed on the PI Server machine, which is
called PI1; from here on out, all of your work will be done from this machine.
The documentation for both the PI Integrator for Esri ArcGIS and for the ArcGIS GeoEvent Extension
describes how to trust that certificate; we have already gone through that process for you. To verify
that those certificates are indeed trusted, you should open the PI Integrator for Esri ArcGIS Application
Server and make sure that the browser address bar shows a lock icon, confirming that the certificate is
trusted (or at the very least, you should not see a red security error).
8|P age
1. Verify that Prerequisites and Configuration Steps are Complete
Repeat that check using the URL for the ArcGIS GeoEvent Extension Manager; it should be a bookmark in
your web browser address bar.
2. Install the PI Integrator for Esri ArcGIS Data Relay and verify that it is communicating with the PI
Integrator for Esri ArcGIS Application Server
The PI Integrator for Esri ArcGIS Data Relay (which we have already installed) is a data client that runs on
a computer located within your network. It provides data to the PI Integrator for Esri ArcGIS Application
Server. When that Application Server is hosted on-premises (as it is in our case), the Data Relay sends PI
data across your local network to the Application Server. In the following steps, we will together verify
that the Data Relay can indeed connect to the Application Server.
After being instructed to begin, you will complete these steps on your own. This class
is a great chance to ask any and all questions that you have along the way, so please
do raise a hand to signal an instructor--we’re glad to help.
1. Log in to PI Integrator for Esri ArcGIS Application Server by navigating to, for
example, https://pi1.nugreen.org:6443/pigeoportal. It should be a bookmark for you in your
web browser; consult the handy credential tear-out sheet (page 8) from earlier for credentials.
2. Navigate in the Application Server to the Administration > Data Relay page
9|P age
2015 TechCon Session
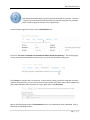
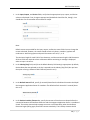
3. Verify that the following message displays:
Your Data Relay is running on node 'node_name'
If this message indeed appears, then your Data Relay Service is indeed properly communicating
with your Application Server.
3. Register at least one PI Coresight Server endpoint in the Integrator Application Server
The PI Integrator for Esri ArcGIS Application Server allows a DisplayServer link to be generated for each
Layer that is created in the Application Server. That link allows an ad hoc PI Coresight display to be
automatically generated for a specific Esri map Feature. For example, if this link is used in a Feature
pop-up, when a user clicks on a particular Feature, then clicks on the DisplayServer link, the identifying
information for that particular clicked Feature will be passed to the PI Integrator for Esri ArcGIS
Application Server, and the user will be redirected to an automatically generated ad hoc PI Coresight
display, containing a trend that shows all of the PI AF Attribute data for that specific map Feature.
In order for this functionality to work, a PI Coresight server must be registered in the Integrator
Application Server; moreover, that PI Coresight server must have access to the PI AF Element data that
corresponds to the Esri Features in question. For example, if a Layer was created from a PI AF Element
Template for trains, then the PI Coresight server should allow access to the PI AF Element database that
contains those train Elements. In our case, we have already registered a PI Coresight server for you, so
we’ll check now to show you what that should look like.
After being instructed to begin, you will complete these steps on your own. This class
is a great chance to ask any and all questions that you have along the way, so please
do raise a hand to signal an instructor--we’re glad to help.
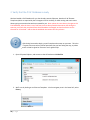
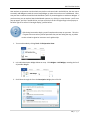
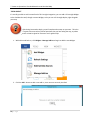
1. Open the PI Integrator for Esri ArcGIS Application Server and log in.
2. Select Administration > Systems.
10 | P a g e
1. Verify that Prerequisites and Configuration Steps are Complete
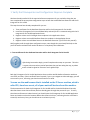
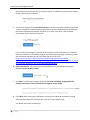
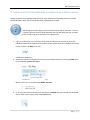
3. If no PI Coresight servers were defined previously, the following message displays:
You don't have any PI Coresight servers registered. Click here to add one.
In our case, since at least one PI Coresight server has already been defined, it will appear;
additional servers will be listed alphabetically on the page.
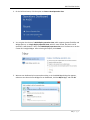
4. Click on the URL for your registered PI Coresight server in order to launch PI Coresight.
5. Log into PI Coresight using your Active Directory credentials.
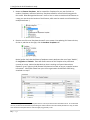
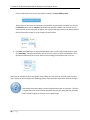
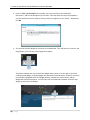
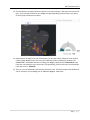
6. Verify that you can manually create a PI Coresight display that contains data for the PI AF
Elements that will make up your Esri map Layer. Specifically, click New Display:
Then in the search pane, navigate (click the triangle icons in PI Coresight) to the item Rail Co >
Rail Co > Rolling Stock > Locomotives > Locomotive 14001.
11 | P a g e
2015 TechCon Session
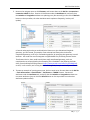
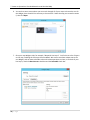
Click on Locomotive 14001 and drag it onto the display canvas on the right, and select that you
want the data to be shown as a Trend.
If you can successfully complete this step, you will get a trend of real-time data, and we can
safely proceed to the next step.
4. Register at least one ArcGIS GeoEvent Extension endpoint in the Application Server
The PI Integrator for Esri ArcGIS communicates with the ArcGIS GeoEvent Extension; we have already
registered it for you, and now we will again check to show you what that looks like.
After being instructed to begin, you will complete these steps on your own. This class
is a great chance to ask any and all questions that you have along the way, so please
do raise a hand to signal an instructor--we’re glad to help.
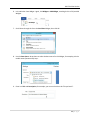
1. Open the PI Integrator for Esri ArcGIS Application Server and log in.
2. Select Administration > Systems.
12 | P a g e
1. Verify that Prerequisites and Configuration Steps are Complete
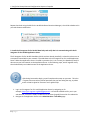
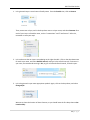
3. If one or more ArcGIS GeoEvent Extension servers have been defined (which in our case, is
indeed true), they are listed alphabetically on the page.
The URL should have the following format:
https://server:port
For example:
https://gep1.nugreen.org:6143
You can test that this URL is correct by copying it into your browser and appending
“geoevent/manager”; the final URL should look like this:
https://gep1.nugreen.org:6143/geoevent/manager
If the URL resolves to the GeoEvent Extension login screen, then you’ve indeed successfully
registered your GeoEvent Extension endpoint. Please make sure that there are no certificate
errors.
5. Register at least one valid Data Store on the GeoEvent Extension
The live-updating Esri Feature Services that we create through the Integrator will be created within an
ArcGIS Account, either an ArcGIS Online account or a local ArcGIS Server account (in this case, we’re
using ArcGIS Online). The GeoEvent Extension, therefore, needs access to that account, so that it can
write data to those Feature Services. Access to that account is allowed by registering it as a Data Store
on the GeoEvent Extension. Here you will actually set up a Data Store yourself, for your own unique
ArcGIS Online account.
13 | P a g e
2015 TechCon Session
After being instructed to begin, you will complete these steps on your own. This class
is a great chance to ask any and all questions that you have along the way, so please
do raise a hand to signal an instructor--we’re glad to help.
1. Sign into your GeoEvent Extension manager; a link should already be in the bookmarks bar of
your web browser. The URL should be of the form:
https://gep1.nugreen.org:6143:6143/geoevent/manager
Use the credentials provided on the handy credential tear-out page on page 8.
2. Navigate to Site > GeoEvent > Data Stores
14 | P a g e
1. Verify that Prerequisites and Configuration Steps are Complete
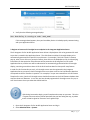
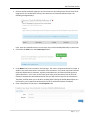
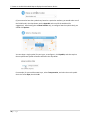
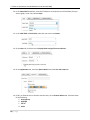
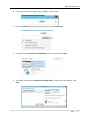
3. You should see, under Registered ArcGIS Server, the button Register ArcGIS Server; go ahead
and click it, which will allows us to begin adding a Data Store.
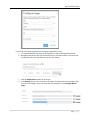
4. Select that the Data Store type is AGOL (ArcGIS Online), and enter in the ArcGIS Online
Username and Password (both are case-sensitive) that was provided to you. Leave the Update
Interval at its default value.
5. Click Register, then click on the Validate All button.
If a green check-mark appears next to your Data Store, then you’re all ready to proceed to the
next section.
15 | P a g e
2. Verify that the PI AF Database is ready
We have loaded a PI AF Database for you that already contains Elements, based on PI AF Element
Templates (which are required by the PI Integrator for Esri ArcGIS), for both moving and static assets.
We are going to examine what we have created for you. Note: please do not make any changes to this
PI AF database; after the class is over, feel free to ask us about possible alternatives, but during the
exercises, we’d ask that you please leave the AF database unchanged, so that the exercise can be
identical for all involved—and so that the workbook instructions will stay relevant.
After being instructed to begin, you will complete these steps on your own. This class
is a great chance to ask any and all questions that you have along the way, so please
do raise a hand to signal an instructor--we’re glad to help.
1. Open PI System Explorer, and connect to the AF Database called Rail Co.
2. We’ll start by looking at our Element Templates. Via the navigator pane in the lower left, select
Library.
16 | P a g e
2. Verify that the PI AF Database is ready
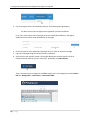
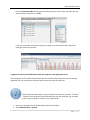
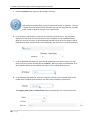
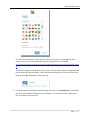
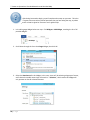
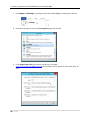
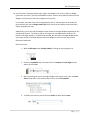
3. Browse to Element Templates. We’ve created four Templates for you, two of which are
tradition Templates, and two of which are Templates suited for use with the PI Integrator for
Esri ArcGIS. What distinguished the two? Here’s a hint: in order to visualize a PI AF Element on
a map, you must know the location of the Element, which must be stored as an AF Attribute (or
multiple Attributes…).
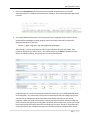
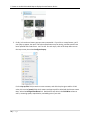
4. Examine one of the two Templates that we’ll use to create a live-updating Esri Feature Service;
click on it, and then on the right, click the Attribute Templates tab.
Notice (spoiler alert) that the Element Templates contain Attributes that are of type “Double”,
for Longitude and Latitude. These will allow instances of this Template to be positioned
correctly on a map. Notice that besides that, there is nothing at all special about these
Elements—that’s right; any PI AF Element Template can be used, so long as it supplies location
information1. What kind of data from your site or organization would benefit from being
visualized on a map?
1
And technically, the PI AF Element template doesn’t need to provide location information at all. In an advanced
use case, PI data can be streamed to preexisting Esri Feature Services that are already located on a map, in which
case the Element template doesn’t need to supply any geometry at all.
17 | P a g e
2015 TechCon Session
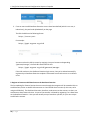
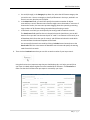
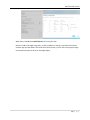
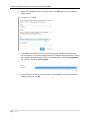
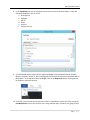
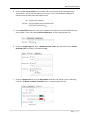
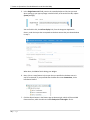
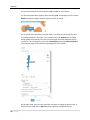
5. Now use the navigator pane to click Elements, and browse down to the Rail Co > Locomotives >
Locomotive 14001 Element. Examine it's Attributes under the Attributes tab, and verify that
the Latitude and Longitude Attributes are updating every few seconds (you can click the Refresh
button on the top toolbar; the other Attributes won’t update as frequently, but they will
update).
It’s worth noting again that you technically don’t have to use just latitude and longitude
geometry; you can instead, for example, create a brand-new Feature Service that has
complicated geometry, such as for a meandering pipeline, by specifying that geometry in an AF
attribute. You could even use the Integrator to append data to a preexisting Feature Service.
That Feature Service, then, could actually have really complicated geometry, such as a
complicated cross-country pipeline (an example of this is available in the following YouTube
video, from the OSIsoft Learning Channel: https://www.youtube.com/watch?v=fmaS03QylnE).
In short, in this scenario, we’re using latitudes and longitudes, but you technically don’t have to.
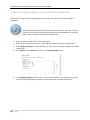
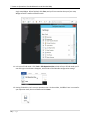
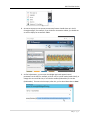
6. That was an example of a moving asset; next, look at a static asset. Browse down to the Rail Co
> Track Infrastructure > Electrification > Transformers > TR0606 Element. Examine it's
Attributes under the Attributes tab, and verify that the Latitude and Longitude Attributes are
now static Attributes (you can click the Refresh button on the top toolbar to see the other
Attributes update instead).
18 | P a g e
2. Verify that the PI AF Database is ready
19 | P a g e
2015 TechCon Session
3. Create a Service and Layer via the PI Integrator for Esri ArcGIS
The software has been installed, the configuration steps are done, and our PI AF Database is ready for us
to use as a data source to create live Esri Feature Services. Next, we’ll proceed through the steps to use
all that we have created and prepared: actually using the PI Integrator for Esri ArcGIS to create Esri
Feature Services that update in real-time with PI System data. Later on, we’ll create a map-based
dashboard using those Feature Services. For now, let’s get started in the PI Integrator for Esri ArcGIS
Application Server—that’s where all of this work is done.
After being instructed to begin, you will complete these steps on your own. This class
is a great chance to ask any and all questions that you have along the way, so please
do raise a hand to signal an instructor--we’re glad to help.
First, let’s create a Service to hold both of the Layers that we will create (note: this “Service”, which we
will create in the Integrator Application Server, is difference from an Esri “Feature Service”, which is
what we’ll later add to a map). When configuring a Service, you can select whether the Service supports
a StreamServer and a DisplayServer. The StreamServer allows you to stream data from your PI System to
the ArcGIS platform, while the DisplayServer provides PI Coresight display capabilities for map Features.
In our case, we’ll enable both functions.
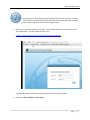
1. Access the link to the PI Integrator for Esri ArcGIS home screen (for example,
https://pi1.nugreen.org:6443/pigeoportal) and log in.
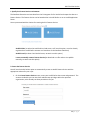
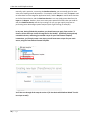
Since this is the first time you have started the PI Integrator for Esri ArcGIS, the following
message displays:
You don't have any Services defined. Click here to add one.
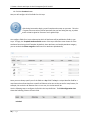
Later, after you have logged in and created Services previously, a list of Services is displayed.
You can change how the list of Services is displayed by clicking either Table view or Tile view; the
Tile view displays Services in a series of boxes or "tiles," while Table view shows the Services in a
table.
2. Click the Create Service button to add a new Service.
20 | P a g e
3. Create a Service and Layer via the PI Integrator for Esri ArcGIS
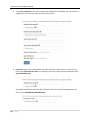
The Create new Geo Service page opens.
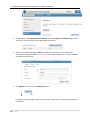
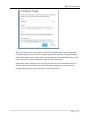
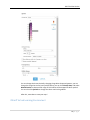
3. In the Name Field, enter a name for the new Service (which is required; the name must also be
unique); you can call it StaticAndMobileAssets. The name should contain a minimum of five
lowercase or uppercase alphanumeric characters, hyphens, or underscores (do not use special
characters in the name).
4. In the Description Field, enter a description for the Service.
5. Make sure that both the StreamServer and DisplayServer check boxes are checked (this is true
by default), then click Create. The Service is now created, and the details page of the Service
you just created are displayed. From this page you can create one or more Layers, and you can
configure the StreamServer and the DisplayServer, which are covered in later topics.
Having finished this step, we will create Layers within this Service, with each Layer being based on a PI
AF Element Template. Eventually, we will create two Layers: one Layer for the Element Template for
moving assets (a.k.a. the Locomotives Element Template) and one for the Element Template for static
assets (a.k.a. the Transformers Element Template).
After being instructed to begin, you will complete these steps on your own. This class
is a great chance to ask any and all questions that you have along the way, so please
do raise a hand to signal an instructor--we’re glad to help.
21 | P a g e
2015 TechCon Session
1. Examine the Service details page (you can also access this by clicking on the Service from the PI
Integrator for Esri ArcGIS home screen); since we have not previously defined a Layer, the
following message displays:
Later, once we have defined one or more Layers, they will be listed alphabetically on the screen.
2. Click either the here link or the Create Layer button.
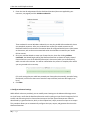
3. In the Name Field, enter a name for the new Layer. The name is required and must be unique. In
addition, the name must contain a minimum of five characters, may contain only lowercase and
uppercase alphanumeric characters, hyphens, and underscores, and cannot include spaces or
special characters. In this case, set the name of the Layer to be the name of one of the PI AF
Element Templates that we examined earlier (first you will create a Layer for the Locomotives
Template, and then when you’re all done, including after finishing the ArcGIS Wizard (done in a
later section), you’ll repeat the whole process for the Transformers Element Template).
4. Enter a description for the Layer in the Description Field.
22 | P a g e
3. Create a Service and Layer via the PI Integrator for Esri ArcGIS
5. Click the Continue button. Next, we will configure this Layer.
After being instructed to begin, you will complete these steps on your own. This class
is a great chance to ask any and all questions that you have along the way, so please
do raise a hand to signal an instructor--we’re glad to help.
6. In the AF Server drop-down list, select the AF server that you wish to use. The drop-down
displays all of the AF Servers that are known to the PI Integrator for Esri ArcGIS Data Relay.
When you select an AF server, all of the databases defined on that server are shown in the AF
Database drop-down list (the servers must be defined in the servers list in PI System Explorer).
7. In the AF Database drop-down list, select the AF database that you wish to use (in our case,
there is only one, the one formerly known as Rail Co). When you select an AF database, all of
the Templates defined in that database are shown in the Template drop-down list.
8. In the Template drop-down list, select the Template you wish to use; it should either be the
mobile assets Template (Locomotives) or the static assets Template (Transformers).
The Category, Max Count, and Search root fields are optional; we won’t use them this time.
23 | P a g e
2015 TechCon Session
a. You could, though, in the Category drop-down list, select the AF Element category that
you wish to use. You use a category to classify AF Elements in the Layer; we didn’t use
these in our case, but they can be helpful.
b. In the Max Count Field, you could also specify the maximum number of objects
returned from a search. Because some searches might return thousands or even tens of
thousands of results, the max count prevents bogging down the system by preventing
large numbers of AF Elements being returned when performing a search.
c. In the Search root Field, you could specify the starting node from which to search.
The Search root Field specifies where in the path the search should start; you can drill
down as far as you wish into the search path. A “node” is an Element in a hierarchy in an
AF database which forms the root of a search, and all Elements below this node which
are derived from the selected Template will be found.
You can specify the search root node by clicking the Select button located next to the
Search root Field. You can traverse the database tree to locate and specify the starting
node from which to search.
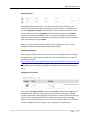
9. There is also a Preview button that you can click to see the results of your Layer search.
Using the Preview is an important step that you should always do, as it helps you verify that
your Layer is indeed referencing data from the intended PI AF Elements. Click Preview and
make sure that the PI AF data that you expect is returned by your Layer.
24 | P a g e
3. Create a Service and Layer via the PI Integrator for Esri ArcGIS
10. Click the Continue button.
Next, we will configure all of the Fields for this Layer.
After being instructed to begin, you will complete these steps on your own. This class
is a great chance to ask any and all questions that you have along the way, so please
do raise a hand to signal an instructor--we’re glad to help.
You configure Fields for a Layer to determine which AF Attributes will be published as Fields in your
Layer. To begin, the Template Attribute Fields section of the Layer definition screen shows all of the
Attributes found using the AF Template. By default, those Attributes are listed by Attribute category;
you can uncheck the Show categories check box to list Attributes alphabetically.
Note: you must always specify one of the Fields as a key Field. The key is a unique identifier Field for a
map Feature that allows data from a specific AF Element to be sent to the correct Esri map Feature; for
example, this can be the AF Element name. In our case, this is what we will do.
Use the following steps to configure the Fields in the Layer definition. The Field configuration view
shows the following columns for each Field:
Included
25 | P a g e
2015 TechCon Session
All Fields are included by default, and we’ll leave it this way (however, you could improve
performance by deselecting unwanted Fields or Fields that will not be used; transferring Field
data that is not used can slow system performance, and in addition, having fewer Fields might
make the list easier to understand).
You can select the individual Fields that you want exposed in the Template Attribute Fields
section. Fields with a checkmark are used in the Layer, while those without a checkmark are not.
Again, we’ll leave all Fields selected for these examples.
Name
The name Field shows the final name that will be used in the ArcGIS platform. The name can be
customized to be different from the Attribute name specified in PI AF, if necessary, to make it
easier for users to understand—we won’t make any changes here.
Attribute names must be composed from simple alphanumeric characters: A-Z, a-z, and 0-9 and
underscore (_). When the New Layer page opens, the AF Attribute names are converted
automatically to simple alphanumeric characters (for example, characters with diacritical marks
are converted into the closest corresponding simple characters), but they may then be edited
further as desired. Validation cues will appear if the user modifies an Attribute name to contain
invalid characters.
Attribute Name
The original name of the Attribute as it appears in PI AF. The Attribute name cannot be changed
in this screen.
Type
26 | P a g e
3. Create a Service and Layer via the PI Integrator for Esri ArcGIS
The data type of the Attribute, pulled from PI AF.
Source
The name of the AF data reference or static. The Attribute source can be PI point, calculation, or
static.
Units
The default measurement unit for the Attribute.
Function
The X and Y functions are pre-selected if the application finds any Attribute name that contains
the words longitude or latitude, or X or Y; if so, the application assigns them to the X and Y
function (if desired, you can select a different function: None, X, Y, Key or Geometry). Generally,
you specify X and Y functions for Attributes that indicate geographic positions, including
positions that move over time. Only one X and Y pair can be specified. In our case, we will
accept the default X and Y assignments.
For the Function drop-down, there are several options:
27 | P a g e
2015 TechCon Session
Specifying X and Y
By specifying the X and Y functions, you determine which Field values define the
location of the map Feature that corresponds to your AF Element. For example, when
you have longitude and latitude values defined in your AF Element Template, you can
select the X function for the longitude Attribute and the Y function for the latitude
Attribute. X and Y must be defined in pairs; you cannot have an X value without a Y,
value and you cannot have a Y value without an X value. Furthermore, X and Y function
Fields must always be of type numeric.
Again, in our case, we will accept the default X and Y assignments, since our PI AF
Template includes Attributes named Latitude and Longitude.
Specifying a geometry
Another option (which we won’t use here), rather than specifying X and Y, is to specify
the geometry for a map Feature by defining it in Esri Feature Geometry Json. See Esri
geometry information
(http://webhelp.esri.com/arcgisdesktop/9.2/index.cfm?TopicName=The_geometry_obj
ect) for more information. Specifying a geometry allows for much more complex areas
to be defined, such as polylines or polygons. Geometry function Fields must be of type
string.
Specifying a key function
In our case, under Element fields, set the element name Field to have the key function.
The key function specifies a unique identifier for a particular map Feature; the key
function is used when updating specific map Features in a Feature Service with the right
data from the corresponding AF Elements, and also when generating PI Coresight
displays. In your own environments, use care to ensure that the values of the Field that
receives the key function are unique for your configured search parameters.
28 | P a g e
3. Create a Service and Layer via the PI Integrator for Esri ArcGIS
Press Continue when finished configuring Fields. A message is displayed if an error is found with the
configuration (fix the error (feel free to ask for help) and try creating the Layer again).
You’ll next see the option to specify the Geometry Type.
This allows you to specify a different Geometry Type, if you’re using Features that aren’t points, such as
polylines; we are only using points in our case, so we’ll use the defaults that appear. You can also
specify the Spatial reference, if you know that your latitude and longitude values were obtained using a
particular spatial reference model for the world. In most cases, though, the default reference,
GCS_WGS_1984 (4326) should suffice, so in summary, leave all of these settings as is.
Go ahead and click Create Layer.
You’ll see a prompt to proceed to launch the Connect to ArcGIS Platform Wizard. We actually will
pause before doing this now, so you should go ahead and click No.
Rather than proceed immediately, at least for this exercise, it’s worth mentioning an important
troubleshooting step. We will click No thanks, and then navigate to the Layer details page. There you
will explore the ability to launch a powerful tool that allows you to see what data is actually being
streamed; this could help you verify that your Layer is configured properly.
29 | P a g e
2015 TechCon Session
After being instructed to begin, you will complete these steps on your own. This class
is a great chance to ask any and all questions that you have along the way, so please
do raise a hand to signal an instructor--we’re glad to help.
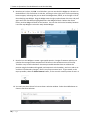
From the details page for the Layer, click the StreamServer tab.
Then click “This Layer is exposed as a StreamServer within the Services directory.” The resulting page
lets you manually stream updates from the Layer, so you can see what data is being sent.
Click Connect to manually open a connection, to see that data is being sent by the Integrator to the Esri
platform, and specifically, you can see how the sent data includes live PI data values, which include the x
and y values needed to place a Feature on a map. When done, click Disconnect.
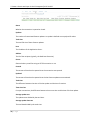
Back on the details page, under the StreamServer section, the StreamServer state is displayed, using a
table with the following columns:
30 | P a g e
3. Create a Service and Layer via the PI Integrator for Esri ArcGIS
Status
Whether the connection is opened or closed.
Updates
The number of transmitted Feature updates. An update is defined as one payload of values.
Total data
The total file size of these Feature updates.
Host
The IP address of the Application Server.
Address
The IP of the recipient (typically, the GeoEvent Extension).
Secure
Shows whether you will be using an HTTPS connection or not.
Created
The amount of time that has passed since the connection was opened.
Updated
The amount of time that has passed since the last Feature update was transmitted.
Total time
The difference between the time of the last update and the time of creation.
Time since last
For open connections, the difference between the current time and the time of the last update.
Average update rate
The update count divided by the total time.
Average update data rate
The total data divided by the total time.
31 | P a g e
2015 TechCon Session
Now that you are done exploring these important troubleshooting steps, proceed to section 4 by first,
from the Layer details page, clicking on the ArcGIS tab, then the link to launch the ArcGIS Wizard.
32 | P a g e
4. Run the ArcGIS Platform Wizard
4. Run the ArcGIS Platform Wizard
In section 3, when you finish defining a Layer and click Create Layer, the Layer is created and a window
opens asking whether to connect the Layer to the ArcGIS platform, specifically, via the ArcGIS Wizard,
which makes it very easy to automatically configure the Esri GeoEvent Extension to take PI AF Element
data from your newly created Layer and use that data to update the specific Features in your Esri
Feature Service. We will now launch that Wizard. We have already taken care of the prerequisites for
the Wizard:
We have given each of you an ArcGIS Online account that has privileges to publish a hosted
Feature Service.
Your ArcGIS Online account is registered as a data store in ArcGIS GeoEvent Extension.
The ArcGIS GeoEvent Extension is indeed running and is configured as a known ArcGIS GeoEvent
Extension in PI Integrator for Esri ArcGIS.
We’ve entered into the Application Server administrator credentials for your ArcGIS GeoEvent
Extension.
The GeoEvent Extension Manager certificate is set to be a trusted and valid certificate.
The wizard will walk you through four steps:
1.
1.
2.
3.
Specify the Feature Service environment
Create the Feature Service
Configure the GeoEvent Extension
Configure advanced settings
We will wait until everyone is done creating their first Layer, and then we will proceed so that everyone
can run through these four steps together. Again, after section 3, you should have clicked on the ArcGIS
tab, in the details page, and then clicked the link to launch the Wizard to configure the layer’s
connection to the ArcGIS GeoEvent Processor.
After being instructed to begin, you will complete these steps on your own. This class
is a great chance to ask any and all questions that you have along the way, so please
do raise a hand to signal an instructor--we’re glad to help.
33 | P a g e
2015 TechCon Session
1. Specify the Feature Service environment
The GeoEvent Extension retrieves data from the PI Integrator for Esri ArcGIS and outputs the data to a
Feature Service. The Feature Service can be hosted either in ArcGIS Online or on an ArcGIS Application
Server.
You are presented with the choices for creating the Esri Feature Service:
ArcGIS Online (to select the ArcGIS online cloud server; we’ll use this option, as we’ve already
registered our ArcGIS Online account as a Data Store on the GeoEvent Extension)
ArcGIS Portal (to select a local ArcGIS server; we won’t use this option)
I want to manually create a Feature Service (to download a csv file and use it to publish
manually; we won’t use this option)
2: Create the Feature Service
You will use the ArcGIS online option to automatically create an ArcGIS Feature Service with the
appropriate schema for your Layer.
1. On the Create Feature Service screen, enter your ArcGIS Online User name and password. The
account credentials you use must have administrator privileges within the specified
organization; we’ve already set those permissions for you.
34 | P a g e
4. Run the ArcGIS Platform Wizard
2.
Click Verify credentials. Once your ArcGIS Online credentials are validated, the wizard shows a
suggested Service and Layer name, with description Fields.
3. Important: append your ArcGIS Online username (which you entered earlier in step 1) to the
front of the Feature Service name. For example, in this case, rather than use the default name,
staticandmobileassets:
You should instead use a new name with your own ArcGIS Online username appended to the
front, such as User005staticandmobileassets.
35 | P a g e
2015 TechCon Session
This naming is essential, because since we’re all sharing the same ArcGIS Online organization,
we need to make sure that each person’s Feature Services are unique.
4. Leave the default Service description (you could, if you want, enter a new description).
5. Leave the default Layer name and description (you could, if you want, enter a new name and
description).
6. Click Create. When you select Create, the Service and Layer are created in ArcGIS Online.
If successful, the “Feature Service Created” message is displayed.
Note: you could then, in a separate browser window, log in to ArcGIS Online to view and change
permissions on your new Feature Service, so that others in your organization could use that
Feature Service in their own Web Maps and dashboards. In our case, we won’t do this, just for
simplicity’s sake. Should you wish to experiment with sharing, though, it’s important to note
that you should be cautious about choosing the option to share your Feature Service with
Everyone, as that will allow the ArcGIS Online global community to subscribing to your Feature
Service, and thus to have access to your live PI System data.
7. Having created your Feature Service, click Next to display the Configure GeoEvent Extension
screen; that will allow you to configure the GeoEvent Extension to accept the streamed data
from the PI Integrator and output it to the Feature Service that you just created.
3. Configure the GeoEvent Extension
After creating the Feature Service, you can connect the Service to the GeoEvent Extension. The Feature
Service that was created previously should be selected automatically for you.
1. In the GeoEvent Extension Field, select the appropriate GeoEvent Extension from the list of all
registered GeoEvent Extensions—remember, we verified earlier that yours was properly
registered (if you wanted to, to check up on that GeoEvent Extension, you can click the Manager
button to open a new browser tab containing the ArcGIS GeoEvent Extension Manager).
36 | P a g e
4. Run the ArcGIS Platform Wizard
2. Enter the User ID and password for the GeoEvent Extension (these are supplied by your
instructor; see page 8) and click Validate credentials.
These credentials are not Windows credentials, nor are they ArcGIS Online credentials; these
are completely separate. After you credentials are verified, the wizard connects to the
GeoEvent Extension and retrieves information about all configured ArcGIS servers (also known
as data stores, such as the one we examined earlier that had been created for your ArcGIS
Online account.
3. Since you used the Wizard to create your Feature Service, then after clicking Validate
credentials, the Wizard begins polling the GeoEvent Extension to detect the newly created
Feature Service in one of the GeoEvent Extension's data stores (which you verified earlier),
which can take a few minutes. You will be notified when the process is complete, after which
you may proceed to the next step.
(It’s worth noting that you could have created your Feature Service manually, instead of using
the Wizard, in which case there are a few other steps to follow, but those don’t apply to us
here.)
4. Click Next.
4. Configure advanced settings
While default values are provided, you can modify several settings on the Advanced Settings screen.
As a brief recap, recall that the GeoEvent Extension works by taking an input from PI Integrator for Esri
ArcGIS, and connecting it with a Feature Service output. How the input and output are related is
determined by a geoevent Service, which, at the simplest level, simply connects an input to an output.
This procedure allows you to automatically configure the input, output, and geoevent Service on the
GeoEvent Extension.
37 | P a g e
2015 TechCon Session
1. In the Input, Output, and Service Fields, verify that the appropriate input, output, and Service
values are displayed. If not, change as appropriate (the defaults should be fine, though). You
should take care to remember these names for step 8.
Note:
Default names are provided for the input, output, and Service name Fields. You can change the
names as desired; however, the names should contain only letters, numbers, hyphens and
underscores. Avoid using spaces and special characters such as &, ^, or %.
The minimum length for each Field is five characters, and the maximum length is 200 characters.
All three Fields are required to have valid names before continuing. A message is displayed
when an input is incorrect.
2. In the Identity (key) Field, verify that the default identity Field setting is appropriate. By default,
the Attribute that was selected as the key is entered into the Identity (key) Field, but you have
the option of using a different Field if desired (leave this as is).
3. In the Refresh Interval Field, specify (in seconds) how often the GeoEvent Extension should poll
the Integrator Application Server for new data. The default refresh interval is 5 seconds (leave
this as is).
4. In the Session Inactivity Timeout box, specify the amount of time that must elapse before the
connection between the GeoEvent Extension and the Integrator Application Server is considered
closed. The activity timeout helps manage resources on the Data Relay; when the GeoEvent
Extension begins polling again, data flow resumes seamlessly. The inactivity timeout should
38 | P a g e
4. Run the ArcGIS Platform Wizard
generally be several times greater than the poll interval. The default session inactivity timeout
period is 300 seconds (5 minutes).
5. You have the option to check Use HTTPS (secure) to specify that all data should be transmitted
securely. Using HTTPS requires performing a one-time security configuration on the GeoEvent
Extension before data can flow back and forth; in our case, since this is a self-contained
environment, do not select this check-box.
If you’re interested, though, for information about how to install certificates on the GeoEvent
Extension computer to use HTTPS polling, see the following Esri help page: Connecting to sites
with certificates issued by unknown certificate authorities via HTTPS
(http://resources.arcgis.com/en/help/install-guides/arcgis-geoevent-processorwindows/10.2/index.html#/Optional_Connecting_to_sites_with_certificates_issued_by_unkno
wn_certificate_authorities_via_HTTPS/02wn0000000z000000/)
6. Click Create Service. If the Service was created without errors, the following message is
displayed: Service Created – Done!
7. Click Next. The following message is displayed: You have successfully configured ArcGIS
GeoEvent Processor to receive data from PI Integrator for Esri ArcGIS.
8. Click Finish. After clicking the Finish button, the Service has indeed be successfully created
within GeoEvent Extension, and then you return to the Layer details page.
You should next ensure the following:
39 | P a g e
2015 TechCon Session
a. Click on the StreamServer tab, and verify that an opened connection from your ArcGIS
GeoEvent Extension is made to this Stream Server endpoint, which is displayed when the wizard
is closed.
b. Your ArcGIS GeoEvent Extension is receiving events from PI Integrator for Esri ArcGIS. Use the
ArcGIS GeoEvent Manager to check whether events are received; the URL for the ArcGIS
GeoEvent Manager is of the form
https:// gep1.nugreen.org:6143/geoevent/manager
After signing in, you can scroll down to find the Input, GeoEvent Service, and Output; their
names are the values you saw in step 1. You should verify that the Count of updates for those
objects is indeed increasing. If they are, then you can proceed further.
Congratulations! It’s worth mentioning that what we have done is an incredibly powerful ability
of the Integrator. You can actually click on each of these objects that was created, and you can
see that a lot of configuration values have been automatically entered in for you by the
Integrator. While you could have manually created each object, and then manually configured
each in precisely the right way, the Integrator has spared you all of that time, so that you can get
back to performing the analysis work that actually brings you value. Of course, for power users,
such as yourselves, with a little bit of practice it’s certainly possible to configure these objects
40 | P a g e
4. Run the ArcGIS Platform Wizard
manually, and in particular, concerning the GeoEvent Service, you can actually get a lot more
value out of making manual adjustments. For example, recall how in our case, the Input is used
to collect data from the Integrator Application Server, and the Output is used to write that data
to the Esri Feature Service, and the GeoEvent Service in our case simply passes data from the
Input to the Output. However, there are so many more powerful functions that you could do
with that GeoEvent Service, and thus by creating it for you, you get a quick jump-start on
performing more advanced geo-spatial analyses (such as geo-fencing, for example).
In any case, having finished this procedure, you should start over again, from section “3.
Create a Service and Layer via the PI Integrator for Esri ArcGIS”. Specifically, having already
created the Service, and having just created a Layer for your first Element Template,
Locomotives, you’ll simply create a new Layer; you will now create a Layer for your static
assets, using the Transformers Element Template.
You’ll also run through all the steps in section 4 (“4. Run the ArcGIS Platform Wizard” for this
new Layer as well).
41 | P a g e
2015 TechCon Session
5. Create an ArcGIS Online Web Map to display the new Feature Service
Having created our live-updating Feature Services, we’ll visualize them by adding them to an ArcGIS
Online Web Map. We’ll also format the way data is displayed on the map.
After being instructed to begin, you will complete these steps on your own. This class
is a great chance to ask any and all questions that you have along the way, so please
do raise a hand to signal an instructor--we’re glad to help.
1. Log in to ArcGIS online (your instructor will provide the URL that you should use) with your
individual ArcGIS Online credentials (these were used as a data store on the GeoEvent Extension
earlier), and click the Map menu item:
A base map is displayed.
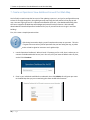
2. Add both of more of the Feature Services that you created previously by clicking the Add menu
item and selecting Search for Layers.
Make sure that you un-check the box Within map area.
3. In our case, leave the search box blank, and simply hit ENTER; the Layers should then be visible.
Next to each of your Layers, you’ll see the Add button.
42 | P a g e
5. Create an ArcGIS Online Web Map to display the new Feature Service
Click it to add each Layer to your map. When finished, click Done Adding Layers.
The Features in your Layers should show up, by default, as green boxes, and when you click on
the Details button, then on Content, you should see two Layers listed. You can then click on
each map Feature and see a pop-up appear; the values of that pop-up are set by data streamed
directly from the PI System, as is the location of each Feature.
4. Click Save, then Save again to save your Web Map; enter in a title, tags, and description, then
click Save Map. Having saved the map, we can thus use it later to create a dashboard in Esri’s
Operations Dashboard, but for now, we’ll work on making the map look a little nicer first.
We’ll wait for everyone to finish saving their map, making sure that they can see both Layers on their
map. After that, we’ll configure the symbology of each Layer and make a few other cosmetic changes.
After being instructed to begin, you will complete these steps on your own. This class
is a great chance to ask any and all questions that you have along the way, so please
do raise a hand to signal an instructor--we’re glad to help.
43 | P a g e
2015 TechCon Session
1. Let's give each Layer a more human-friendly name. From the Details view, click on Content.
Then, mouse-over a layer, and in the drop-down next to a Layer name, and select Rename. Give
each of your Layers a friendlier name, such as “Locomotives” and “Transformers”. After this,
remember to save your map!
2. Let’s make sure that our Layers are updating on the right schedule. Click on the drop-down next
for each Layer name, and select Refresh Interval, and type in the refresh interval, in minutes: in
your case, we recommend entering in 0.1, to give a 6-second refresh interval, for both Layers.
3. Let’s also give each Layer more appropriate symbols. Again, click on the drop-down, and select
Change Style.
We want to show the location of these Features, so you should leave the first drop-down at Set
Location Only:
44 | P a g e
5. Create an ArcGIS Online Web Map to display the new Feature Service
(If you wanted to have the symbols vary based on a particular attribute, you would select one of
the Fields listed in the drop-down; see the Appendix at the end of the workbook for
suggestions). After leaving that at Show location only, to configure how the symbols look, you
should click Options.
You can select a single symbol for your Layer; to configure it, click Symbols, and then explore
the many different symbol collections offered in the drop-down.
For example, for your mobile assets Layer, select Transportation, and select the truck symbol.
Set its size to be 44px, then click OK.
45 | P a g e
2015 TechCon Session
You could of course select any other symbol, specify any other size, or even add your own
custom image, if you know the web URL where that image resides. For example:
http://www.microsoft.com/global/enterprise/PublishingImages/partners/OSIsoft/osisoft_logo.p
ng
You can also change the transparency of your layer, or set the visible range, to change the zoom
level at which your layer will appear. We’ll leave these settings alone for now; now that you’re
done, just click OK. Remember to save your map!
4. Let’s also change the basemap to a more exciting map. Click on the Basemap button, and select
one of the many different basemaps, such as “Imagery”, or “Dark Gray Canvas”. Again, after
this, remember to save your map.
46 | P a g e
5. Create an ArcGIS Online Web Map to display the new Feature Service
5. Finally, let’s make our Feature pop-ups more presentable. If you click on a map Feature, you’ll
see a pop-up appear, but you’ll notice that capitalization may be missing, and that spaces have
been replaced with underscores. Let’s fix that. For each Layer, click on the drop-down next to
the Layer name, then select Configure Pop-up.
For the Pop-up Title Field, erase the current contents, and click the plus sign to add in a Field
value; let’s use the {name} Field, which means each pop-up will be titled with the Feature name.
Next, select the Configure Attributes link. Double-click each alias in the Field Alias column to
edit it, correcting spaces, capitalization, and adding units if you wish.
47 | P a g e
2015 TechCon Session
When done, click OK, then SAVE POP-UP, then save your map.
Next we’ll add PI Coresight integration, so that in addition to seeing a map with live locations,
and with pop-ups that feature live values from the PI System, you can also click a pop-up image
to automatically open an ad hoc PI Coresight display.
48 | P a g e
6. Add PI Coresight integration to the ArcGIS Online Web Map
6. Add PI Coresight integration to the ArcGIS Online Web Map
We’ll wait for everyone to finish preparing their Layers map; after that, we’ll set up PI Coresight
integration.
After being instructed to begin, you will complete these steps on your own. This class
is a great chance to ask any and all questions that you have along the way, so please
do raise a hand to signal an instructor--we’re glad to help.
1. Open your map in ArcGIS, if you’re not already there.
2. Select one of the Layers by clicking it; a drop-down list appears next to the selected Layer.
3. Select Configure Pop-up from the drop-down list; you’ll see the list of pop-up properties that we
visited earlier.
4. Select Image from the ADD drop-down list in the Pop-up Media section.
5. In the Configure Image window, as a title, you can enter “Analyze!” As a caption, enter “Open
an ad hoc PI Coresight display to visualize real-time data for this specific map Feature.”
49 | P a g e
2015 TechCon Session
For the URL, we’ll need to go back to the Integrator Application Server.
a. In a separate browser tab, open the PI Integrator for Esri ArcGIS Application Server.
b. Navigate to the Service that you created in section 3, and select within it the Layer that
corresponds to the Esri map Layer that you’re now editing.
c. Click the DisplayServer button for that Layer.
d. In the Sharing section, you can see a list of images, and right next to those images, URLs
for each of the images. Copy one of the URLs, for example, for the Coresight Button
Image.
50 | P a g e
6. Add PI Coresight integration to the ArcGIS Online Web Map
e. Back on your ArcGIS Online map, paste that URL in the URL Field in the Esri Configure
Image window.
f.
In the Link Field, we will enter the link to the DisplayServer endpoint, using the same
URL that appears in the Ad hoc display Field in the Integrator Application Server. Back in
the Integrator Application Server, for the corresponding Layer, under the DisplayServer
tab, you can see a URL for Ad hoc display.
g. Copy that URL and, back on your map, paste it into the Link Field on the Esri Configure
Image window, then click OK.
51 | P a g e
2015 TechCon Session
Now, you should click on a map Feature, and you’ll see a pop-up appear, and scrolling down
through the pop-up, you’ll see the PI Coresight image that you selected. Clicking that image in
the pop-up will open a link to your new PI Coresight display for that specific map Feature (you’ll
have to sign in with your AD credentials in order to access PI Coresight).
Repeat these steps for both Layers on your map, and test that you can successfully click on a
Feature to open its pop-up, then click on the PI Coresight image button, and that a new PI
Coresight display properly opens with data for that specific Feature.
52 | P a g e
7. Create an Operations View dashboard around that Web Map
7. Create an Operations View dashboard around that Web Map
You’ve finally created a map that has a pair of live updating Layers on it, and you’ve configured that map
to have PI Coresight integration, along with generally improving the look and feel of the pop-up and
map. Now we’re going to use Esri’s Operations Dashboard client tool, a free dashboard building client
that lets us augment this Web Map with Widgets and powerful analysis Features. We’ve already
downloaded and installed Operations Dashboard for you; all you need to do now is sign in and start
building!
First, let’s create a simple Operations View.
After being instructed to begin, you will complete these steps on your own. This class
is a great chance to ask any and all questions that you have along the way, so please
do raise a hand to signal an instructor--we’re glad to help.
1. Launch Operations Dashboard. When it loads, it’ll prompt you for a URL; here is where you can
connect to a dedicated ArcGIS server, but in our case, we’ll just leave the default value in place,
and we’ll click Continue.
2. Enter in your individual ArcGIS Online credentials, then click SIGN IN; this will grant you access
to the Web Map that you just created using that same ArcGIS Online account.
53 | P a g e
2015 TechCon Session
3. On the left-hand menu, click the option to Create a New Operation View.
4. You are given the choice of a Multidisplay operation view, which supports greater flexibility and
Widget options, or a Single display operation view, which is more limited, but which can be
opened in a web browser. We’ll chose Multidisplay operation view, since it allows us to use the
custom PI Coresight Widget. After selecting that option, click Create.
5. We want our dashboard to be centered on a Map, so in the Add Widget dialog that appears,
where we can select the first Widget for our dashboard, click the Map Widget, and click OK.
54 | P a g e
7. Create an Operations View dashboard around that Web Map
6. You can then see a screen where you can search through all of your maps to choose the one for
this Widget; there shouldn’t be too many to choose from. Select the map you created in section
5, then click Open.
7. Give your map Widget a title; for example, “Map with Live Layers”. You’ll also see a list of Layers
on the map, including the live Layers that we added. We want to use them as data sources for
our Widgets, and we want to be able to do multi-select operations on them, so for both of your
live Layers, check the Data Sources check box and the Selectable check box.
55 | P a g e
2015 TechCon Session
8. In the Capabilities tab, we can pick what actions we can perform for each Feature. Check the
following capabilities, then click “OK”:
a. Show pop-up
b. Highlight
c. Pan to
d. Select
e. Zoom to
f. Feature Pop-ups
9. Your dashboard will be created, with a single map Widget in the middle that shows the Web
Map you created in section 5. But it’s lacking some of the tools that we saw in the ArcGIS Online
Map viewer. In the top left of the map Widget, click on the Map Tools button, a little gear icon,
to enable our familiar map tools.
10. You’ll see a list of several of the tools that we saw in ArcGIS Online; select all of them, except for
Link Map Extents; that is only useful if you’re using multiple maps, and we’re only going to use a
56 | P a g e
7. Create an Operations View dashboard around that Web Map
single map Widget. When finished, click Close, and you’ll now see that the top of your map
Widget contains a toolbar of familiar tools.
11. Let’s turn off edit mode. Click Tools > Edit Operation View, which will turn off edit mode; you’ll
see all the gear icon buttons disappear, which hides all the editable configuration settings.
12. Having finished this, let’s save our operation view. On the toolbar, click File. Enter in a name for
your operation view, then scroll down and click Save.
57 | P a g e
2015 TechCon Session
Now we have an operation view that looks very similar to what we had in ArcGIS Online; the next step is
to actually add Widgets around the central map Widget, to make this much more of a dashboard. Once
everyone has created and saved the basic dashboard, we’ll all proceed together to add more Widgets. If
you have time, you can explore how the dashboard operates; try clicking on a map Feature—you’ll see a
pop-up appear, just like in ArcGIS Online, and you can click on the PI Coresight image in that pop-up to
be taken right to an ad hoc PI Coresight display, just like before.
After being instructed to begin, you will complete these steps on your own. This class
is a great chance to ask any and all questions that you have along the way, so please
do raise a hand to signal an instructor--we’re glad to help.
1. Turn on edit mode by clicking Tools > Edit Operation View.
2. Let’s add a description Widget below our map. Click Widgets > Add Widget, revealing the list of
all possible Widgets.
3. Scroll down through the list to the Description Widget, then click OK.
58 | P a g e
7. Create an Operations View dashboard around that Web Map
4. Enter in a Title and Description; for example, you can set the title to be “Dashboard
Description”, and for the description you can enter “This map shows live Layers that update in
real time with data from a PI System, courtesy of the PI Integrator for Esri ArcGIS.”. When done,
click OK.
5. You can now dock this Widget to a location on the dashboard. Click and hold on its title bar, and
drag it down; you’ll see four positioning buttons appear.
The buttons indicate that you can dock this Widget above, below, or to the right or left of the
underlying map Widget. Drag the Widget onto the bottom position button, and you’ll see a blue
area become highlighted where the Widget will dock. Release the mouse button, and the
Widget will dock to that location. You can then click on the boundary between it and the map
Widget to resize this new Widget.
59 | P a g e
2015 TechCon Session
6. Let’s add a bar chart Widget. Again, click Widgets > Add Widget, revealing the list of all possible
Widgets.
7. Scroll down through the list to the Bar Chart Widget, then click OK.
8. Use the Data Source drop-down to select the data source for this Widget; for example, pick the
mobile assets (locomotives) Layer.
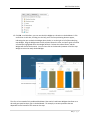
9. Enter in a Title and Description; for example, you can set the title to be “Torque levels”.
60 | P a g e
7. Create an Operations View dashboard around that Web Map
10. In the Value Field drop-down, select the Field (which corresponds to an AF Attribute) that you
wish to graph; in our case, select Torque.
11. In the Label Field and Sort Field, select that you want to use Name.
12. On the Axes tab, check the box to Display labels and grid lines on value axis.
13. On the Appearance tab, check the Show Labels box and the Use color ramp box.
14. Finally, to allow the user to interact with the chart, on the Feature Actions tab, check the boxes
for the following:
a. Show pop-up
b. Highlight
c. Pan to
d. Select
61 | P a g e
2015 TechCon Session
15. Click OK. Just like before, you can now dock this Widget to a location on the dashboard. Click
and hold on its title bar, and drag it to the left; you’ll see four positioning buttons appear,
indicating that you can dock this Widget above, below, or to the right or left of the underlying
map Widget. Drag the Widget onto the left position button this time, and you’ll again see a blue
area become highlighted where the Widget will dock. Release the mouse button, and the
Widget will dock to that location. You can then click on the boundary between it and the map
Widget to resize the newly docked Widget.
Thus far, we’ve created a fairly traditional dashboard, but now let’s add some Widgets that allow us to
do some geo-spatial analysis right in the dashboard—for example, to answer questions that are
dependent on the location of the assets on the map.
62 | P a g e
7. Create an Operations View dashboard around that Web Map
After being instructed to begin, you will complete these steps on your own. This class
is a great chance to ask any and all questions that you have along the way, so please
do raise a hand to signal an instructor--we’re glad to help.
1. Let’s add a gauge Widget below our map. Click Widgets > Add Widget, revealing the list of all
possible Widgets.
2. Scroll down through the list to the Gauge Widget, then click OK.
3. Select the Data Source for this Widget; in this case, since we’ll be selecting subgroups of assets,
we’ll choose the mobile assets Layer that ends in “- Selection”, which means this Widget will
only operate on data for selected Features.
63 | P a g e
2015 TechCon Session
4. Enter in a Title and Description; for example, you can set the title to be “Average Coolant
Temperature”, and for the description you can enter “This is the calculated average of all
selected assets that fall within the selection area”.
5. In the Value Field drop-down, select the Field (which corresponds to an AF Attribute) that you
wish to graph; in our case, select Coolant temperature. Leaver everything else as is.
6. Under the Target Range tab, enter a Maximum Value of 300. Also check the box for Include
threshold value, and specify a threshold of 150.
7. Under the Appearance tab, click the Show labels check box, and choose a pair of interesting
colors for the Below and Above Threshold colors. Leave everything else as is.
64 | P a g e
7. Create an Operations View dashboard around that Web Map
8. Now that you’re done, click OK. Just like before, you can now dock this Widget to a location on
the dashboard. Click and hold on its title bar, and drag it to the right; you’ll see four positioning
buttons appear, indicating that you can dock this Widget above, below, or to the right or left of
the underlying map Widget. Drag the Widget onto the right position button this time, and you’ll
again see a blue area become highlighted where the Widget will dock. Release the mouse
button, and the Widget will dock to that location. You can then click on the boundary between
it and the map Widget to resize the newly docked Widget.
9. Now let’s use this Widget to answer a geo-spatial question. Imagine if someone asked you to
calculate the average coolant temperature of all assets in the southeast corner of the map.
That’d be a very hard PI calculation—because you would somehow have to calculate the
position using the latitude and longitude, and compare it to the boundary, and so on and so on…
and what if the boundary changes?! But it’s very easy to answer here! To get started, on the
top map toolbar, select the Select Features button; it’s the one with a mouse pointer arrow in it.
10. You now have three choices for how to draw a selection window. Select the middle button to
choose a free-form selection.
65 | P a g e
2015 TechCon Session
11. Click and hold on the map, and draw a selection area around assets in the south-east area of the
map. You’ll see that the value in your Widget changes depending on which Feature you select,
or which group of Features you select.
12. Repeat steps 1 through 11 for your second Layer, for the static assets; follow the same steps to
create a gauge Widget, only in this case, pick a different Field to calculate (for example, the
current Field). Remember that when creating your Widget, specify that the Data Source is the
Layer that corresponds to your static assets, and specifically, make sure that you’ve selected the
Layer that ends in “-Selection”.
13. That’s it! Turn off edit mode, and save your operation view. Feel free to explore the dashboard
you’ve created, or try out adding new or additional Widgets. Well done!
66 | P a g e
7. Create an Operations View dashboard around that Web Map
“EXTRA CREDIT”
It’s actually possible to add a second level of PI Coresight integration; you can add a PI Coresight Widget
to the dashboard as well, though a custom Widget, to let you see a PI Coresight display right alongside
your map.
After being instructed to begin, you will complete these steps on your own. This class
is a great chance to ask any and all questions that you have along the way, so please
do raise a hand to signal an instructor--we’re glad to help.
1. With edit mode back on, click Widgets > Manage Add-Ins to begin to add the new Widget.
2. Click the Add… button to add a new add-in, since none are currently installed.
67 | P a g e
2015 TechCon Session
3. In the search box in the top right, type “Coresight”, and hit enter.
4. Under the Results drop-down below the search box, choose All Results.
5. You should see the OSIsoft PI Coresight AddIn; click on it, and then click Open.
6. You should now see that the OSIsoft PI Coresight AddIn is listed in your list of add-ins. Click
Close.
68 | P a g e
7. Create an Operations View dashboard around that Web Map
7. Click Widgets > Add Widget, revealing the list of all possible Widgets, including your new one.
8. Scroll down through the list to the PI Coresight Widget, then click OK.
9. In the Single Feature Url Field, paste in the URL for PI Coresight
(http://pi1.nugreen.org:8080/Coresight) then click OK. You can ignore all of the other fields, for
now.
69 | P a g e
2015 TechCon Session
10. You’ll see that PI Coresight display opens right in the Widget! You can thus dock this Widget
right where you want it, just like you docked the others. And for more powerful Features of this
Widget, if you have time, feel free to approach an instructor.
For example, you could create a PI Coresight display, save it, and then paste in the display for
that particular URL into the Single Feature Url Field, so that you will always see that particular
display alongside your map.
Additionally, you can also use this Widget to open ad-hoc PI Coresight displays depending on the
selected map Feature. The Feature pop-up link image that you added earlier allows you to
launch PI Coresight displays in a new browser window, but this new PI Coresight Widget allows
you to open ad hoc PI Coresight displays within the Widget, so the user never has to leave
Operations Dashboard.
Brief instructions:
1. While in Edit Mode, open Configure Map by clicking the top-right gear icon.
2. Under the Capabilities tab, check the box for the Analyze in PI Coresight Feature
Action, then click OK.
3. Open the settings for your PI Coresight Widget (click its gear icon), and in the Data
Source Field, select a non-selection data source, such as locomotives.
4. To identify the Features, specify that the Field drop-down will be name.
70 | P a g e
7. Create an Operations View dashboard around that Web Map
5. In the Single Feature Url field, paste in the same DisplayServer link that you used
when setting up your pop-up image in ArcGIS online; at the end of the URL, replace
{name} with {0}.
You can find this link, the Ad hoc display link, from the Integrator Application
Server, under the Layer that corresponds to the data source that you selected above
in step 3.
When done, click OK to finish editing your Widget.
6. Now, click on a map Feature in the Layer that you specified as the data source in
step 3; for example, if you specified that the data source was locomotives, click a
locomotive Feature.
7. Click the ellipsis button in the Feature pop-up bottom right, which will list available
Feature Actions, which should now include Analyze in PI Coresight. Click it.
71 | P a g e
2015 TechCon Session
8. An ad hoc display for that specific clicked map Feature should show up in the PI
Coresight widget! For example, if you clicked on Locomotive 14001, you should see
an ad hoc display for Locomotive 14001.
9. As final adjustments, you can open the Widget again and append control
parameters to the URL, for example, to force it to be in Kiosk mode (mode=kiosk), to
change the start and end time, or to hide the toolbar (hidetoolbar) or time bar
(hidetimebar). These are the last steps; after this, you’re done! Remember to Save!
72 | P a g e
Conclusion
Conclusion
Congratulations! You’ve just created a dashboard that shows locations of assets, a bar chart of their live
values, and contains Widgets that allow you to perform geospatial calculations on-the fly, calculations
that wouldn’t be possible with the standard OSIsoft tools. And you can still click on Feature pop-ups to
open PI Coresight displays for each map Features!
We’ve covered a lot together, from the PI Integrator for ArcGIS, to the Esri GeoEvent Extension, to
ArcGIS Online, and now finally Operations Dashboard. It’s been quite a lot--thanks for your attention
and participation. If you’ve any questions, feel free to bring them up with your instructors—we’d be
glad to help. And if ever have any future questions, remember to consult the handy OSIsoft Live Library,
available for anyone, for free, at anyone at livelibrary.osisoft.com; click the “Integrators” section to see
the full user manual for the PI Integrator for Esri ArcGIS.
73 | P a g e
2015 TechCon Session
Appendix
Additional notes for section 5. Create an ArcGIS Online Web Map to display the new Feature Service:
When changing the symbology for a Layer in ArcGIS Online, you can also select that you want to
have unique symbols for each Feature. After opening the drop-down for a Layer, and after
clicking Change Style, you can, in new drop-down that appears, choose that you want the
symbology to be determined by a specific Field. For example, you can choose Speed.
Now you can either select that you want the symbol size to vary based on the value of Speed, or
you can select that you want the symbol color to vary based on the value of Speed, or you could
create a heat map:
74 | P a g e
Appendix
You can also choose to vary the symbols by Size or Color for each Feature.
The first two options work similarly; after specifying Size, for example, you can click the
Options button to configure how the symbol sizes will be scaled.
You can divide the Field values by another field, if you wish, you can change the start
and ending symbol size, and more. You can also click on the Symbols link to change
which symbol will be used by this layer, which will open the same dialog box that we
saw earlier. Very importantly, you can click Classify Data, and select Manual Breaks to
choose which range of Field values will be mapped to which symbol.
On the other hand, you could also select that you want to change the symbol color, in
which case you could click on Options and see a different configuration pane:
75 | P a g e
2015 TechCon Session
You can change the theme, basically changing the gradient shape and pattern, you can
change the range that is used, and just like before, you can click Classify Data, and select
Manual Breaks to choose which range of Field values will be mapped to which symbol.
You can also click Symbols to change the colors used in the gradient.
After this, remember to save your map!
OSIsoft Virtual Learning Environment
76 | P a g e
OSIsoft Virtual Learning Environment
“The ArcGIS Online Organization subscription configured in this lab has expired. However you can work
on this lab using your own organization in ArcGIS Online. If you are not a member of an existing
organization, you can get a 60 day free trial: http://www.arcgis.com/features/freetrial.html?origin=arcgis”
The OSIsoft Virtual Environment provides you with virtual machines where you can complete the
exercises contained in this workbook. After you launch the Virtual Learning Environment, you will have
to connect to PI1 and GEP1 to complete different parts of the lab with the username
nugreen\pisandboxadmin, and password 0nc3Inawhil3!
The environment contains the following machines:
GEP1: the ESRI ARCGIS server.
PI1: a windows server that runs the PI System and that contains all the software and configuration
necessary to perform the exercises on this workbook. This is one the machines you need to connect to.
DC1: a domain controller that provides network and authentication functions.
The system will create these machines for you upon request and this process may take between 5 to 10
minutes. During that time you can start reading the workbook to understand what you will be doing in
the machine.
After you launch the virtual learning environment your session will run for up to 8 hours, after which
your session will be deleted. You can save your work by using a cloud storage solution like onedrive or
box. From the virtual learning environment you can access any of these cloud solutions and upload the
files you are interested in saving.
System requirements: the Virtual Learning Environment is composed of virtual machines hosted on
Microsoft Azure that you can access remotely. In order to access these virtual machines you need a
Remote Desktop Protocol (RDP) Client and you will also need to be able to access the domain
cloudapp.net where the machines are hosted. A typical connection string has the form
cloudservicename.cloudapp.net:xxxxx, where the cloud service name is specific to a group of virtual
machines and xxxxx is a port in the range 41952-65535. Therefore users connecting to Azure virtual
machines must be allowed to connect to the domain *.cloudapp.net throughout the port range 4195265535. If you cannot connect, check your company firewall policies and ensure that you can connect to
this domain on the required ports.
77 | P a g e