1
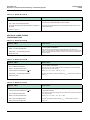
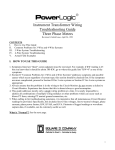
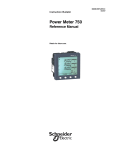
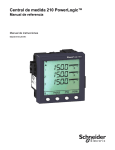
Power Meter 710 Reference Manual 63230-501-209A1 Instruction Bulletin HAZARD CATEGORIES AND SPECIAL SYMBOLS Read these instructions carefully and look at the equipment to become familiar with the device before trying to install, operate, service or maintain it. The following special messages may appear throughout this bulletin or on the equipment to warn of potential hazards or to call attention to information that clarifies or simplifies a procedure. The addition of either symbol to a “Danger” or “Warning” safety label indicates that an electrical hazard exists which will result in personal injury if the instructions are not followed. This is the safety alert symbol. It is used to alert you to potential personal injury hazards. Obey all safety messages that follow this symbol to avoid possible injury or death. DANGER DANGER indicates an imminently hazardous situation which, if not avoided, will result in death or serious injury. WARNING WARNING indicates a potentially hazardous situation which, if not avoided, can result in death or serious injury. CAUTION CAUTION indicates a potentially hazardous situation which, if not avoided, can result in minor or moderate injury. CAUTION CAUTION, used without the safety alert symbol, indicates a potentially hazardous situation which, if not avoided, can result in property damage. NOTE: Provides additional information to clarify or simplify a procedure. PLEASE NOTE Electrical equipment should be installed, operated, serviced, and maintained only by qualified personnel. No responsibility is assumed by Schneider Electric for any consequences arising out of the use of this material. FCC NOTICE This equipment has been tested and found to comply with the limits for a Class B digital device, pursuant to Part 15 of the FCC Rules. These limits are designed to provide reasonable protection against harmful interference in a residential installation. This equipment generates, uses and can radiate radio frequency energy and, if not installed and used in accordance with the instructions, may cause harmful interference to radio communications. However, there is no guarantee that interference will not occur in a particular installation. If this equipment does cause harmful interference to radio or television reception, which can be determined by turning the equipment off and on, the user is encouraged to try to correct the interference by one or more of the following measures: • • • Reorient or relocate the receiving antenna. Increase the separation between the equipment and receiver. Connect the equipment into an outlet on a circuit different from that to which the receiver is connected. Consult the dealer or an experienced radio/TV technician for help. 63230-501-209A1 07/2008 Power Meter 710 Table of Contents SECTION 1: INTRODUCTION Power Meter Hardware ............................................................................... 1 Power Meter Parts and Accessories ....................................................... 2 Box Contents ........................................................................................... 2 Firmware ..................................................................................................... 2 SECTION 2: SAFETY PRECAUTIONS Before You Begin ........................................................................................ 3 SECTION 3: OPERATION Operating the Display ................................................................................. 5 How the Buttons Work ............................................................................. 5 Menu Overview ........................................................................................... 6 Setting Up the Power Meter ........................................................................ 7 Set Up Power Meter ................................................................................ 7 Set Up CTs .............................................................................................. 8 Set Up PTs ............................................................................................. 8 Set Up System Frequency ....................................................................... 8 Set Up Meter System Type ..................................................................... 9 Set Up Demand Current .......................................................................... 9 Setup PQS Demand .............................................................................. 10 Set Up Passwords ................................................................................. 10 Set Up Communications ........................................................................ 11 Set Up Bar Graph Scale ........................................................................ 11 Set Up Meter’s Visualization Mode ........................................................ 11 Resetting the Power Meter ....................................................................... 12 Initialize the Meter ................................................................................. 12 Reset Individual Values ......................................................................... 12 Viewing Meter Information ........................................................................ 13 SECTION 4: METERING Power Meter Characteristics ..................................................................... 15 MODBUS RS485 ................................................................................... 16 Min/Max Values for Real-time Readings ................................................... 16 Power Factor Min/Max Conventions ......................................................... 16 Demand Readings .................................................................................... 16 Demand Power Calculation Methods .................................................... 17 Peak Demand ........................................................................................ 19 Demand Current Calculation Methods .................................................. 19 Energy Readings ...................................................................................... 19 Power Analysis Values ............................................................................. 20 SECTION 5: MAINTENANCE AND TROUBLESHOOTING Introduction ............................................................................................... 21 Get Technical Support ........................................................................... 21 Troubleshooting .................................................................................... 21 APPENDIX A: SPECIFICATIONS Power Meter Specifications ..................................................................... 23 APPENDIX B: REGISTER LIST Register List ............................................................................................. 25 Supported MODBUS Commands ............................................................. 36 APPENDIX C: INSTRUMENT TRANSFORMER WIRING: TROUBLESHOOTING GUIDE Section I: Using this Guide ........................................................................ 37 What is Normal? .................................................................................... 37 Section II: Common Problems for 3-Wire and 4-Wire Systems ............... 38 Section III: 3-Wire System Troubleshooting .............................................. 39 Section IV: 4-Wire System Troubleshooting ............................................. 40 Field Example ........................................................................................... 42 GLOSSARY .................................................................................................................... 43 Terms ........................................................................................................ 43 Abbreviations ............................................................................................ 45 INDEX © 2008 Schneider Electric All Rights Reserved .................................................................................................................... 47 i Power Meter 710 Table of Contents ii 63230-501-209A1 07/2008 © 2008 Schneider Electric All Rights Reserved 63230-501-209A1 07/2008 Power Meter 710 Section 1—Introduction SECTION 1— INTRODUCTION POWER METER HARDWARE Figure 1–1 below shows the parts of the Power Meter 710. Table 1–1 describes each part. Figure 1–1: Parts of the Power Meter 710 1 2 B A A B 4 5 3 6 Table 1–1: Parts of the Power Meter Number © 2008 Schneider Electric All Rights Reserved Part Description 1 Control power supply connector Connection for control power to the power meter. 2 Voltage inputs Voltage metering connections. 3 Current inputs Current metering connections. 4 RS485 port (COM1) The RS485 port is used for communications with a monitoring and control system. This port can be daisy-chained to multiple devices. 5 LED Steady = OFF/ON. Flashing = communications indicator. 6 Retainer clips Used to hold power meter in place. A Retainer slots, position A Use for installation locations thinner than 3 mm (1/8 in.). B Retainer slots, position B Use for installation locations 3 - 6 mm (1/8 to 1/4 in.). 1 Power Meter 710 Section 1—Introduction Power Meter Parts and Accessories 63230-501-209A1 07/2008 Table 1–2: Power Meter Parts and Accessories Description Power Meter with Integrated Display Box Contents FIRMWARE 2 • • • • Model Number PM710 PM710MG One (1) power meter Two (2) retainer clips One (1) installation sheet One (1) RS485 Terminator (MCT2W) This instruction bulletin is written to be used with firmware version 2.020. See “Viewing Meter Information” on page 13 for instructions on how to determine the firmware version. © 2008 Schneider Electric All Rights Reserved 63230-501-209A1 07/2008 Power Meter 710 Section 2—Safety Precautions SECTION 2— SAFETY PRECAUTIONS BEFORE YOU BEGIN This section contains important safety precautions that must be followed before attempting to install, service, or maintain electrical equipment. Carefully read and follow the safety precautions outlined below. DANGER HAZARD OF ELECTRIC SHOCK, EXPLOSION, OR ARC FLASH • Apply appropriate personal protective equipment (PPE) and follow safe electrical work practices. In the USA, see NFPA 70E. • Only qualified electrical workers should install this equipment. Such work should be performed only after reading this entire set of instructions. • NEVER work alone. • Before performing visual inspections, tests, or maintenance on this equipment, disconnect all sources of electric power. Assume that all circuits are live until they have been completely de-energized, tested, and tagged. Pay particular attention to the design of the power system. Consider all sources of power, including the possibility of backfeeding. • Turn off all power supplying the power meter and the equipment in which it is installed before working on it. • Always use a properly rated voltage sensing device to confirm that all power is off. • Before closing all covers and doors, carefully inspect the work area for tools and objects that may have been left inside the equipment. • Use caution while removing or installing panels so that they do not extend into the energized bus; avoid handling the panels, which could cause personal injury. • The successful operation of this equipment depends upon proper handling, installation, and operation. Neglecting fundamental installation requirements may lead to personal injury as well as damage to electrical equipment or other property. • NEVER bypass external fusing. • NEVER short the secondary of a PT. • NEVER open circuit a CT; use the shorting block to short circuit the leads of the CT before removing the connection from the power meter. • Before performing Dielectric (Hi-Pot) or Megger testing on any equipment in which the power meter is installed, disconnect all input and output wires to the power meter. High voltage testing may damage electronic components contained in the power meter. • The power meter should be installed in a suitable electrical enclosure. Failure to follow this instruction will result in death or serious injury © 2008 Schneider Electric All Rights Reserved 3 Power Meter 710 Section 2—Safety Precautions 4 63230-501-209A1 07/2008 © 2008 Schneider Electric All Rights Reserved 63230-501-209A1 07/2008 Power Meter 710 Section 3—Operation SECTION 3— OPERATION OPERATING THE DISPLAY The power meter is equipped with a large, back-lit LCD display. It can display up to five lines of information plus a sixth row of menu options. Figure 3– 1 shows the different parts of the power meter display. Figure 3– 1: Power Meter Display A B C A. Type of measurement B. Alarm indicator C. Maintenance icon D. Bar Graph (%) E. Units K F. Menu items G. Selected menu indicator H. Button I. J J. Values D E Return to previous menu K. Phase I How the Buttons Work H G F The buttons are used to select menu items, display more menu items in a menu list, and return to previous menus. A menu item appears over one of the four buttons. Pressing a button selects the menu item and displays the menu item’s screen. When you have reached the highest menu level, a black triangle appears beneath the selected menu item. To return to the previous menu level, press the button below 1;. To cycle through the menu items in a menu list, press the button below ###:. Table 3– 1 describes the button symbols. Table 3– 1: Button Symbols Navigation ---> View more menu items on the current level. 1; Return to the previous menu level. ^ Indicates the menu item is selected and there are no menu levels below the current level. Change Values + Change values or scroll through the available options. When the end of a range is reached, pressing + again returns to the first value or option. <- Select the next position in a number. OK Move to the next editable field or exit the screen if the last editable field is selected. NOTE: © 2008 Schneider Electric All Rights Reserved • Each time you read “press” in this manual, press and release the appropriate button beneath a menu item. For example, if you are asked to “Press PHASE,” you would press and release the button below the PHASE menu item. • Changes are automatically saved and take effect immediately. 5 Power Meter 710 Section 3—Operation Changing Values MENU OVERVIEW 63230-501-209A1 07/2008 When a value is selected, it flashes to indicate that it can be modified. A value is changed by doing the following: • • Press + or <- to change numbers or scroll through available options. • To save your changes and move to the next field, press OK. If you are entering more than one digit, press <- to move to the next digit in the number. Menu items are displayed below the horizontal line at the bottom of the screen. Figure 3– 2 below shows the menu items of the first two levels of the power meter menu hierarchy. Selecting a Level 1 menu item takes you to the next screen level containing the Level 2 menu items. Some Level 2 items have Level 3 items. The navigation buttons work consistently across all menu levels. NOTE: The ###: is used to scroll through all menu items on a level. Figure 3– 2: Abbreviated IEC Mode/Menu Items* I PHASE DMD U-V U V PQS PQS E PEAK PHASE DMD Ph Qh Sh U V PF F THD MINMX I MINMX I RESET METER E SETUP METER DIAGN. METER V PQS PF F THD V THD I TIMER DMD DMD PASSW MINMX COM MODE TIMER BARG U = Voltage L-L V = Voltage L-N *The power meter can be configured to display either IEC or IEEE nomenclature. Figure 3– 2 shows IEC nomenclature. NOTE: Reset and Setup menu items require a password to navigate to the second level menu. 6 © 2008 Schneider Electric All Rights Reserved 63230-501-209A1 07/2008 SETTING UP THE POWER METER Power Meter 710 Section 3—Operation The power meter ships with many default values already set up in the meter. These values may be changed by navigating to the appropriate screen and entering new values. Other values may be changed using the Reset function. Use the instructions in the following sections to change values. See “Resetting the Power Meter” on page 12 for more information on the Reset function. NOTE: New values are automatically saved when you exit the screen. The PM710 screen is able to display nomenclatures for both IEC and IEEE modes. Table 3– 2 shows the nomenclature for each mode. The different nomenclatures do not affect any of the meter calculations. See “Set Up Meter’s Visualization Mode” on page 11 for changing the meter mode. Table 3– 2: PM710 Mode Nomenclatures Measurement Symbols Phase labels IEC 1, 2, 3 IEEE ABC Voltage U, V VL-L, VL-N Power P, Q, S W, VAR, VA Energy Ph, Qh, Sh Power Factor Wh, VARh, VAh Total (no sign) IEC Menu Selections IEEE Current I AMPS Voltage U-V VOLTS Power PQS PWR Energy E ENERG Power Factor PF PF Frequency F HZ Diagnostics DIAGN NOTE: • • Set Up Power Meter Power factor is an absolute reading. The power meter does not consider a sign for power factor. Real and Reactive Power and Energy are absolute or unsigned readings. The power meter adds energy and power as a positive regardless of the flow direction. To begin power meter setup, do the following: 1. Scroll through the menu list at the bottom of the screen until you see SETUP. 2. Press SETUP. 3. Enter your password. NOTE: The default password is 00000. See “Set Up Passwords” for information on how to change. Follow the directions in the following sections to set up meter values. NOTE: All screen displays show IEC nomenclature. © 2008 Schneider Electric All Rights Reserved 7 Power Meter 710 Section 3—Operation 63230-501-209A1 07/2008 Set Up CTs 1. In SETUP mode, press ###: until METER is visible. 2. Press METER. 3. Press CT. 4. Enter the PRIM (primary CT) number. 5. Press OK. 6. Enter the SEC. (secondary CT) number. 7. Press OK to return to the METER SETUP screen. 8. Press 1; to return to the SETUP screen. Set Up PTs 1. In SETUP mode, press ###: until METER is visible. 2. Press METER. 3. Press PT. 4. Enter the SCALE value: x1, x10, x100, NO PT (for direct connect). ! 5. Press OK. 6. Enter the PRIM (primary) value. 7. Press OK. 8. Enter the SEC. (secondary) value. 9. Press OK to return to the METER SETUP screen. 10. Press 1; to return to the SETUP MODE screen. Set Up System Frequency 1. In SETUP mode, press ###: until METER is visible. 2. Press ###: until F (system frequency) is visible. # "#$%&'%() 3. Press F. 4. Select the frequency. 5. Press OK to return to the METER SETUP screen. 6. Press 1; to return to the SETUP MODE screen. 8 * #+ © 2008 Schneider Electric All Rights Reserved 63230-501-209A1 07/2008 Power Meter 710 Section 3—Operation Set Up Meter System Type 1. In SETUP mode, press ###: until METER is visible " 2. Press METER. 3. Press ###: until SYS (system type) is visible. 4. Press SYS. 5. Select the SYS (system type): 10, 11, 12, 30, 31, 32, 40, 42, 44. 6. Press OK to return to the METER SETUP screen. , " 7. Press 1; to return to the SETUP MODE screen. Set Up Demand Current 1. In SETUP mode, press ###: until DMD (demand) is visible. 2. Press DMD (demand setup). 3. Press I (current). 4. Enter the MIN (demand interval in minutes) for I (current): 1 to 60. 5. Press OK. 6. Press 1; to return to the SETUP MODE screen. NOTE: The calculation method used for current is Thermal. © 2008 Schneider Electric All Rights Reserved 9 Power Meter 710 Section 3—Operation 63230-501-209A1 07/2008 Setup PQS Demand 1. In SETUP mode, press ###: until DMD (demand) is visible. 2. Press DMD (demand setup). 3. Press PQS (real, reactive, apparent power). 4. Enter the MIN (demand interval in minutes) for P (power): 1 to 60. 5. Press OK. 6. Enter the SUB-I (number of subintervals) for P: 0 to 60. 7. Press OK. 8. Press 1; to return to the SETUP MODE screen. NOTE: The calculation method used for power is based on SUB-I as follows: • • • 0 = sliding block 1= block >1 = rolling block (The SUB-I value must divide evenly into the MIN value to the second. For example, you might set 2 subintervals for a 15-minute interval. The meter will calculate the subinterval period to be 7.5 minutes or 450 seconds. Demand is updated at each subinterval. Set Up Passwords 1. In SETUP mode, press ###: until PASSW (password) is visible. PASSWORD SETUP 2. Press PASSW. 00000 00000 3. Enter the SETUP password. 4. Press OK. 5. Enter the RESET (password to reset the power meter) password. 00000 6. Press OK to return to the SETUP MODE screen. 1; 10 <- + & DIAG. SETUP RESET MIN.MX OK © 2008 Schneider Electric All Rights Reserved 63230-501-209A1 07/2008 Power Meter 710 Section 3—Operation Set Up Communications 1. In SETUP mode, press ###: until COM is visible. 2. Press COM. 3. Enter the ADDR (meter address): 1 to 247. 4. Press OK. 5. Select the BAUD (baud rate): 2400, 4800, 9600, or 19200. 6. Press OK. 7. Select the parity: EVEN, ODD, or NONE. 8. Press OK to return to the SETUP MODE screen. NOTE: Default values are displayed. Set Up Bar Graph Scale 1. In SETUP mode, press ###: until BARG is visible. 2. Press BARG. 3. Enter the %CT (percent of CT primary to represent 100 on the bar graph). 4. Press OK to return to the SETUP MODE screen. Set Up Meter’s Visualization Mode The meter’s Visualization Mode is set up using the RESET menu. Follow the “Power Meter Setup” instructions but select RESET instead of SETUP. The meter mode is only a visualization mode. It does not change or affect the way the PM710 performs its calculations. 1. In RESET mode, press ###: until MODE is visible. 2. Press MODE. 3. Select IEEE or IEC by pressing the corresponding button below the selection. A small triangle is displayed below the current selection. 4. Press 1; to return to the RESET MODE screen. © 2008 Schneider Electric All Rights Reserved Selected Small Triangle 11 Power Meter 710 Section 3—Operation 63230-501-209A1 07/2008 RESETTING THE POWER METER Meter values can be re-initialized using the Reset function. The following values are affected by this Reset: • • • • Initialize the Meter Operation Timer Energy Accumulators Min/Max Values Demand Values To re-initialize the power meter, complete the following steps: 1. From the SUMMARY screen, press RESET. INIT METER? 2. Enter the RESET password (00000 is the default). 3. Press OK. 4. Press METER. 5. Press NO or YES. 6. Press 1; to return to the RESET screen. No Reset Individual Values Yes Individual values for Energy, Demand, Min/Max, and Timer can be reset without affecting other values. Below are instructions for resetting Energy values. Reset Energy Values 1. From the SUMMARY screen, press RESET. 2. Enter the RESET password (00000 is the default). 3. Press OK. 4. Press E. 5. Press NO or YES. 6. Press 1; to return to the RESET screen. NOTE: Individual settings for Demand, Min/Max, Mode, and Timer can be reset by selecting the value and using the above procedure. 12 © 2008 Schneider Electric All Rights Reserved 63230-501-209A1 07/2008 Power Meter 710 Section 3—Operation VIEWING METER INFORMATION 1. Press ###: until DIAGN (diagnostics) is visible. 2. Press METER. 3. View the meter information (model number, operating system firmware version, reset system firmware version, and power meter serial number). 4. Press 1; to return to the MAIN screen. © 2008 Schneider Electric All Rights Reserved 13 Power Meter 710 Section 3—Operation 14 63230-501-209A1 07/2008 © 2008 Schneider Electric All Rights Reserved 63230-501-209A1 07/2008 Power Meter 710 Section 4—Metering SECTION 4— METERING POWER METER CHARACTERISTICS METERING CAPABILITIES The power meter measures currents and voltages and reports in real time the rms values for all three phases and neutral. In addition, the power meter calculates power factor, real power, reactive power, and more. Table 4 lists the main or most important metering characteristics of the power meter. Table 4– 1: Power Meter Characteristics Instantaneous rms Values Current Per phase, neutral, average of 3 phases Voltage Average of 3 phases, L-L and L-N Frequency 45 to 65 Hz Active power Total and per phase (absolute)* Reactive power Total and per phase (absolute)* Apparent power Total and per phase Power factor Total (absolute) 0.000 to 1 Energy Values Active energy (total) 0 to 1.84 x 10¹⁸ Wh (absolute)* Reactive energy (total) 0 to 1.84 x 10¹⁸ VARh (absolute)* Apparent energy (total) 0 to 1.84 x 10¹⁸ VAh Operating time Up to 32,767 hours and 59 minutes Demand Values Current Per phase (Thermal) Active, reactive, apparent power Total (sliding block, rolling block, or block) Maximum Demand Values Maximum current Phase Maximum active power Total Maximum reactive power Total Maximum apparent power Total Power-quality Values Total harmonic distortion (THD) Current and voltage (L-L and L-N) Reset (password protected) Maximum demand current and power Energy values and operating time Minimum and maximum values Operational time Visualization Modes (password protected) IEC and IEEE Display (All calculations are the same under both visualization modes.) Minimum and Maximum Values (unsigned) Total real power (absolute)* Total apparent power Total reactive power (absolute)* Total power factor (absolute)* Current per phase Voltage (L-L and L-N) THD current per phase THD voltage (L-L and L-N) *Absolute values—Both power and energy in and out of the load are treated as additive. © 2008 Schneider Electric All Rights Reserved 15 Power Meter 710 Section 4—Metering 63230-501-209A1 07/2008 Table 4– 1: Power Meter Characteristics (continued) Local or Remote Setup Type of distribution system Rating of current transformers Voltage 3-phase 3- or 4-wire with 1, 2, or 3 CTs, two- or single-phase Primary 1 to 32,767 A Secondary 5 or 1 A Primary 3,276,700 V max Secondary 100, 110, 115, 120 Calculation interval for demand currents 1 to 60 minutes Calculation interval for demand power 1 to 60 minutes MODBUS RS485 Functions RS485 2-wire Communication protocol MODBUS RTU Settings Communication address 1 to 247 Baud rate (communication speed) 2400, 4800, 9600, 19200 bauds Parity none, even, odd MIN/MAX VALUES FOR REAL-TIME READINGS When certain readings reach their highest or lowest value, the Power Meter saves the values in its nonvolatile memory. These values are called the minimum and maximum (min/max) values. The min/max values stored since the last min/max reset can be viewed using the Power Meter display. See Table 4– 1 for a list of the minimum and maximum values stored in the PM710. The min/max value for power factor is based on the unsigned or absolute value of power factor. POWER FACTOR MIN/MAX CONVENTIONS The min/max value for power factor is based on the unsigned or absolute value of power factor. DEMAND READINGS The power meter provides a variety of demand readings. Table 4– 2 lists the available demand readings and their reportable ranges. Table 4– 2: Demand Readings Demand Readings Reportable Range Demand Current, Per-Phase Last Complete Interval 0 to 32,767 A Peak 0 to 32,767 A Demand Real Power, 3Ø Total 16 Last Complete Interval 0 to 3276.70 MW Peak 0 to 3276.70 MW © 2008 Schneider Electric All Rights Reserved 63230-501-209A1 07/2008 Power Meter 710 Section 4—Metering Table 4– 2: Demand Readings (continued) Demand Reactive Power, 3Ø Total Last Complete Interval 0 to 3276.70 MVAR Peak 0 to 3276.70 MVAR Demand Apparent Power, 3Ø Total Last Complete Interval 0 to 3276.70 MVA Peak 0 to 3276.70 MVA Demand Power Calculation Methods Demand power is accumulated power during a specified period divided by the length of that period. How the power meter performs this calculation depends on the method you select. To be compatible with electric utility billing practices, the power meter provides block interval demand. The default demand calculation is set to rolling block with a 5-minute intervals and 5 subintervals. Block Interval Demand In the block interval demand method, you select a “block” of time that the power meter uses for the demand calculation. You choose how the power meter handles that block of time (interval). Three different modes are possible: • Sliding Block. In the sliding block interval, you select an interval from 1 to 60 minutes (in 1-minute increments). Selection for subinterval is not required, but configuration software automatically sets a subinterval. If the interval is ≤15 minutes, the subinterval is 15 seconds. If the interval is >15 minutes, the subinterval is 60 seconds. The power meter displays the demand value for the last completed interval. • Fixed Block. In the fixed block interval, you select an interval from 1 to 60 minutes (in 1-minute increments). For the demand to be calculated as a fixed block, the subinterval value has to be set to 1. The power meter calculates and updates the demand at the end of each interval. • Rolling Block. In the rolling block interval, you select an interval and a subinterval. The subinterval must divide evenly into the interval to the second. The value here has to be >1. For example, you might set 2 subintervals for a 15-minute interval. The meter will calculate the subinterval period to be 7.5 minutes or 450 seconds. Demand is updated at each subinterval. The power meter displays the demand value for the last completed interval. Figure 4– 1 illustrates the three ways to calculate demand power using the block method. For illustration purposes, the interval is set to 15 minutes. © 2008 Schneider Electric All Rights Reserved 17 Power Meter 710 Section 4—Metering 63230-501-209A1 07/2008 Figure 4– 1: Block Interval Demand Examples Demand value is the average for the last completed interval 15-minute interval Time (sec) Sliding Block Demand value is the average for last completed interval Calculation updates at the end of the interval 15-minute interval 15 15-min 15-minute interval 30 45 Time (min) Fixed Block Demand value is the average for last completed interval Calculation updates at the end of the subinterval (5 min.) PLSD110131 15-minute interval 18 15 20 25 30 35 40 45 Time (min) Rolling Block © 2008 Schneider Electric All Rights Reserved 63230-501-209A1 07/2008 Peak Demand Power Meter 710 Section 4—Metering In nonvolatile memory, the power meter maintains a running maximum for power and current demand values, called “peak demand.” The peak is the highest average for each of these readings: per phase current demand, kWD, kVARD, and kVAD since the last reset. Table 4– 2 on page 16 lists the available peak demand readings from the power meter. You can reset peak demand values from the power meter display. From the Main Menu, select MAINT > RESET > DMD. You should reset peak demand after changes to basic meter setup, such as CT ratio or system type. Demand Current Calculation Methods The power meter calculates demand current using the thermal demand method. The default interval is 15 minutes, but you can set the demand current interval between 1 and 60 minutes in 1-minute increments. Thermal Demand The thermal demand method calculates the demand based on a thermal response, which mimics thermal demand meters. The demand calculation updates at the end of each interval. You select the demand interval from 1 to 60 minutes (in 1-minute increments). In Figure 4– 2 the interval is set to 15 minutes for illustration purposes. Figure 4– 2: Thermal Demand Example The interval is a window of time that moves across the timeline. 99% 90% % of Load Last completed demand interval 0% Time (minutes) 15-minute interval next 15-minute interval Calculation updates at the end of each interval ENERGY READINGS The power meter calculates and stores accumulated energy values for real, reactive, and apparent energy. You can view accumulated energy from the display. The resolution of the energy value will automatically change through the range of 000.000 kWh to 000,000 MWh (000.000 kVAh to 000,000 MVARh). Energy values can be reported over communications in two formats: scaled long integer and floating point. The units are always kWh, KVARh, or kVAh. The long integer values are limited to 2,147,483,647 x the scale factor. The floating point values are limited to 1.84 x 10¹⁸. © 2008 Schneider Electric All Rights Reserved 19 Power Meter 710 Section 4—Metering POWER ANALYSIS VALUES 63230-501-209A1 07/2008 The power meter provides power analysis values for Total Harmonic Distortion (THD). THD is a quick measure of the total distortion present in a waveform and is the ratio of harmonic content to the fundamental. It provides a general indication of the “quality” of a waveform. THD is calculated for both voltage and current. The power meter uses the following equation to calculate THD where H is the harmonic distortion: 2 ⎧ ( RMS ) 2 – H ⎫ THD = ⎨ --------------------------------1- ⎬ × 100 2 ⎩ ⎭ H 1 20 © 2008 Schneider Electric All Rights Reserved 63230-501-209A1 07/2008 Power Meter 710 Section 5—Maintenance and Troubleshooting SECTION 5— MAINTENANCE AND TROUBLESHOOTING CHAPTER 5 — MAINTENANCE AND TROUBLESHOOTING INTRODUCTION The power meter does not contain any user-serviceable parts. If the power meter requires service, contact your local sales representative. Do not open the power meter. Opening the power meter voids the warranty. Get Technical Support Please refer to the Technical Support Contacts provided in the power meter shipping carton for a list of support phone numbers by country or go to www.powerlogic.com, select your country > tech support for phone numbers by country. Troubleshooting The information in Table 5– 1 describes potential problems and their possible causes. It also describes checks you can perform or possible solutions for each. After referring to this table, if you cannot resolve the problem, contact the your local Square D/Schneider Electric sales representative for assistance. ALARMS DANGER HAZARD OF ELECTRIC SHOCK, EXPLOSION, OR ARC FLASH • Apply appropriate personal protective equipment (PPE) and follow safe electrical work practices. See NFPA 70E. • This equipment must be installed and serviced only by qualified electrical personnel. • Turn off all power supplying this equipment before working on or inside. • Always use a properly rated voltage sensing device to confirm that all power is off. • Carefully inspect the work area for tools and objects that may have been left inside the equipment. • Use caution while removing or installing panels so that they do not extend into the energized bus; avoid handling the panels, which could cause personal injury. Failure to follow this instruction will result in death or serious injury Table 5– 1: Troubleshooting Potential Problem Possible Cause Possible Solution • When the maintenance icon is illuminated, it indicates the The maintenance icon metered signals have reached saturation point or the is illuminated on the frequency is out of range. power meter display. For further detail refer to Register 4112. • The display is blank after applying control power to the power meter. • The power meter may not be receiving the necessary power. • • © 2008 Schneider Electric All Rights Reserved Verify voltage and current inputs range. The Voltage input metering range is 10-480 L-L VAC (direct) or 10-277 L-N VAC (direct) or up to 1.6 MV (with external VT). The Current input metering range is: 5 mA - 6 A. In addition, verify that the current and voltage inputs are free of noise. Call Technical Support or contact your local sales representative for assistance. Verify that the power meter line (L) and neutral (N) terminals are receiving the necessary power. Verify that the heartbeat LED is blinking. Check the fuse. 21 Power Meter 710 Section 5—Maintenance and Troubleshooting 63230-501-209A1 07/2008 Table 5– 1: Troubleshooting (continued) Incorrect setup values. Incorrect voltage inputs. The data being displayed is inaccurate or not what you expect. Power meter is wired improperly. See Appendix C—Instrument Transformer Wiring: Troubleshooting Guide on page 37 for more information on troubleshooting wiring problems. Power meter address is incorrect. Check that the correct values have been entered for power meter setup parameters (CT and PT ratings, System Type, Nominal Frequency, and so on). Check power meter voltage input terminals to verify that adequate voltage is present. Check that all CTs and PTs are connected correctly (proper polarity is observed) and that they are energized. Check shorting terminals. Check to see that the power meter is correctly addressed. Verify that the baud rate of the power Power meter baud rate (parity, meter matches the baud rate of all Cannot communicate stop bit) is incorrect. other devices on its communications with power meter from link. a remote personal Communications lines are Verify the power meter communications computer. improperly connected. connections. Check to see that a multipoint Communications lines are communications terminator is properly improperly terminated. installed. 22 © 2008 Schneider Electric All Rights Reserved 63230-501-209A1 07/2008 Power Meter 710 Appendix A—Specifications APPENDIX A—SPECIFICATIONS POWER METER SPECIFICATIONS Table A– 1: Specifications Electrical Characteristics True rms up to the 15th harmonic on three-phase AC system (3P, 3P + N) Type of measurement 32 samples per cycle Measurement Accuracy Current ±0.5% from 1A to 6A Voltage ±0.5% from 50 V to 277 V Power Factor ±0.0031 from 1A to 6A and from -0.50 to + 0.5 PF Power ±1.0% Frequency ±0.02 Hz from 45 to 65 Hz Real Energy IEC 62053-21 Class 1.0; ANSI C12.16 Accuracy Class 1 Reactive Energy Data update rate IEC 62053-23 Class 2 1s 10 to 480 V AC (direct L-L) Measured voltage 10 to 277 V AC (direct L-N) Up to 1.6 MV AC (with external VT). The starting of the measuring voltage depends on the PT ratio. Input-voltage Metering over-range 1.2 Un Impedance 2 MΩ (L-L) / 1 MΩ (L-N) Frequency range CT ratings Primary 45 to 65 Hz Adjustable from 1 A to 32767 A Secondary 5 A or 1 A Measurement input range 10 mA to 6 A 15 A continuous Input-current Permissible overload 50 A for 10 seconds per hour 120 A for 1 second per hour Control Power Impedance < 0.12 Ω Load < 0.15 VA AC 100 to 415 ±10% V AC, 5 VA; 50 to 60 Hz DC 125 to 250 ±20% V DC, 3W Ride-through time 100 ms at 120 V AC Mechanical Characteristics Weight 0.37 kg IP degree of protection (IEC 60529) Designed to IP52 front display, IP30 meter body 96 x 96 x 69 mm (meter with display) Dimensions 96 x 96 x 50 mm (behind mounting surface) Environmental Characteristics Operating temperature Storage temperature © 2008 Schneider Electric All Rights Reserved Meter -5 °C to +60 °C Display -10 °C to +55 °C Meter + display -40 °C to +85 °C Humidity rating 5 to 95% RH at 50 °C (non-condensing) Pollution degree 2 Metering category (voltage inputs and control power) CAT III, for distribution systems up to 277 V L-N / 480 V AC L-L Dielectric withstand As per IEC61010, UL508 Double insulated front panel display Altitude 3000 m 23 Power Meter 710 Appendix A—Specifications 63230-501-209A1 07/2008 Table A– 1: Specifications (continued) Electromagnetic Compatibility Electrostatic discharge Level III (IEC 61000-4-2) Immunity to radiated fields Level III (IEC 61000-4-3) Immunity to fast transients Level III (IEC 61000-4-4) Immunity to impulse waves Level III (IEC 61000-4-5) Conducted immunity Level III (IEC 61000-4-6) Immunity to magnetic fields Level III (IEC 61000-4-8) Immunity to voltage dips Level III (IEC 61000-4-11) Conducted and radiated emissions CE commercial environment/FCC part 15 class B EN55011 Harmonics IEC 61000-3-2 Flicker emissions IEC 61000-3-3 Safety Europe CE, as per IEC 61010-1 U.S. and Canada UL508 Communications RS485 port 2-wire, 2400, 4800, 9600, or 19200 baud; Parity— Even, Odd, None; 1 stop bit; Modbus RTU Display Characteristics Dimensions 73 x 69 mm 24 Back-lit green LCD (6 lines total, 4 concurrent values) © 2008 Schneider Electric All Rights Reserved 63230-501-209A1 07/2008 Power Meter 710 Appendix B—Register List APPENDIX B—REGISTER LIST CHAPTER 2 — MAINTENANCE AND TROUBLESHOOTING REGISTER LIST ALARMS Table B– 1: Register Listing—Setup and Status Setup & Status Reg Name Size Type Access NV Scale Units Range Notes 1204 Usage Hours 2 Float RO Y - Hours >= 0.0 This combination timer counts the total time for which the absolute current on at least one phase is > 0.1Amp. 1206 Usage Minutes 2 Float RO Y - Minutes 0.0-59.0 This combination timer counts the total time for which the absolute current on at least one phase is > 0.1Amp. 4105 Scale Factor I (current) 1 Integer RO N - - - Power of 10 4106 Scale Factor V (voltage) 1 Integer RO N - - - Power of 10 4107 Scale Factor W (power) 1 Integer RO N - - - Power of 10 4108 Scale Factor E (energy) 1 Integer RO N - - - Power of 10 4110 Usage Hours 1 Integer RO Y - Hours 0-32767 4111 Usage Minutes 1 Integer RO Y - Minutes 0-59 Wrench Icon Control bit0: VA Saturation bit1: VB Saturation bit2: VC Saturation bit3: IA Saturation bit4: IB Saturation bit5: IC Saturation bit6: Freq Invalid bit7-bit15: Reserved 4112 Error Bitmap 1 Integer RO N - - - 4117 Thermal Demand Interval 1 Integer R/W Y - Minutes 1-60 Current Demand Only 4118 Power Block Demand Interval 1 Integer R/W Y - Minutes 1-60 Duration in minutes 0: Sliding Block Calculation If Reg[4118] <= 15 Minutes the Sub-interval is 15 Seconds if Reg[4118] > 15 Minutes the Sub-interval is 60 Seconds 1: Fixed Block else: Rolling Block 4119 Power Block Demand Number of SubIntervals 1 Integer R/W Y - Seconds 1-60 4120 CT Ratio - Primary 1 Integer R/W Y - - 1-32767 4121 CT Ratio - Secondary 1 Integer R/W Y - - 1 or 5 4122 PT Ratio - Primary 1 Integer R/W Y - - 1-32767 4123 PT Ratio - Scale (0 = No PT) 1 Integer R/W Y - - 0, 1, 10, 100 RO = Read Only R/W = Read/Write NV = Nonvolatile. © 2008 Schneider Electric All Rights Reserved 25 Power Meter 710 Appendix B—Register List 63230-501-209A1 07/2008 Table B– 1: Register Listing—Setup and Status (continued) Setup & Status Reg Name Size Type Access NV Scale Units Range 4124 PT Ratio - Secondary 1 Integer R/W Y - - 100, 110, 115, 120 4125 Service Frequency 1 Integer R/W Y - Hz 50 or 60 4126 Reset Commands 1 Integer R/W N - - N/A 4127 System Type 1 Integer R/W Y - - 10,11,12,30,31, 32,40,42,44 4128 Display Mode 1 Integer R/W Y - - 0,1 Notes Always return a 0. A list of commands is shown in Table B– 5. 0 = IEC Units 1 = IEEE Units RO = Read Only R/W = Read/Write NV = Nonvolatile. The PM710 includes registers in two different formats: integer and floating point. For example, Real Power A is included in Register 1066 and 1067 (floating point) and register 4036 (integer). Table B– 2: Register Listing—Metered Data Metered Data Reg Name Size Type Access NV Scale Units Range Notes 1000 Real Energy, Total 2 Float RO Y - kWh - Absolute 1002 Apparent Energy, Total 2 Float RO Y - kVAh - 1004 Reactive Energy, Total 2 Float RO Y - kVARh - Absolute 1006 Real Power, Total 2 Float RO N - kW - Absolute 1008 Apparent Power, Total 2 Float RO N - kVA - 1010 Reactive Power, Total 2 Float RO N - kVAR - Absolute 1012 Power Factor, Total 2 Float RO N - - 0.0 - 1.0 Absolute 1014 Voltage, L-L, 3P Average 2 Float RO N - Volt - 1016 Voltage, L-N, 3P Average 2 Float RO N - Volt - 1018 Current, 3P Average 2 Float RO N - Amp - 1020 Frequency 2 Float RO N - Hz 45.0 - 65.0 1034 Current, A 2 Float RO N - Amp - 1036 Current, B 2 Float RO N - Amp - RO = Read Only R/W = Read/Write NV = Nonvolatile. 26 © 2008 Schneider Electric All Rights Reserved 63230-501-209A1 07/2008 Power Meter 710 Appendix B—Register List Table B– 2: Register Listing—Metered Data (continued) Metered Data Reg Name Size Type Access NV Scale Units Range Notes 1038 Current, C 2 Float RO N - Amp - 1040 Current, N 2 Float RO N - Amp - 1054 Voltage, A-B 2 Float RO N - Volt - 1056 Voltage, B-C 2 Float RO N - Volt - 1058 Voltage, C-A 2 Float RO N - Volt - 1060 Voltage, A-N 2 Float RO N - Volt - 1062 Voltage, B-N 2 Float RO N - Volt - 1064 Voltage, C-N 2 Float RO N - Volt - 1066 Real Power, A 2 Float RO N - kW - Absolute 1068 Real Power, B 2 Float RO N - kW - Absolute 1070 Real Power, C 2 Float RO N - kW - Absolute 1072 Apparent Power, A 2 Float RO N - kVA - 1074 Apparent Power, B 2 Float RO N - kVA - 1076 Apparent Power, C 2 Float RO N - kVA - 1078 Reactive Power, A 2 Float RO N - kVAR - Absolute 1080 Reactive Power, B 2 Float RO N - kVAR - Absolute 1082 Reactive Power, C 2 Float RO N - kVAR - Absolute 1084 Current, A, THD 2 Float RO N - % 0.0-1000.0 1086 Current, B, THD 2 Float RO N - % 0.0-1000.0 1088 Current, C, THD 2 Float RO N - % 0.0-1000.0 1092 Voltage, A-N, THD 2 Float RO N - % 0.0-1000.0 1094 Voltage, B-N, THD 2 Float RO N - % 0.0-1000.0 1096 Voltage, C-N, THD 2 Float RO N - % 0.0-1000.0 1098 Voltage, A-B, THD 2 Float RO N - % 0.0-1000.0 RO = Read Only R/W = Read/Write NV = Nonvolatile. © 2008 Schneider Electric All Rights Reserved 27 Power Meter 710 Appendix B—Register List 63230-501-209A1 07/2008 Table B– 2: Register Listing—Metered Data (continued) Metered Data Reg Name Size Type Access NV Scale Units Range Notes 1100 Voltage, B-C, THD 2 Float RO N - % 0.0-1000.0 1102 Voltage, C-A, THD 2 Float RO N - % 0.0-1000.0 4000 Real Energy, Total 2 Long RO Y E kWh/Scale 0Absolute 0xFFFFFFFF 4002 Apparent Energy, Total 2 Long RO Y E kVAh/Scale 00xFFFFFFFF 4004 Reactive Energy, Total 2 Long RO Y E kVARh/Scale 4006 Real Power, Total 1 Integer RO N W kW/Scale 0-32767 4007 Apparent Power, Total 1 Integer RO N W kVA/Scale 0-32767 4008 Reactive Power, Total 1 Integer RO N W kVAR/Scale 0-32767 Absolute 4009 Power Factor, Total 1 Integer RO N 0.0001 - 0-1 Absolute 4010 Voltage, L-L, 3P Average 1 Integer RO N V Volt/Scale 0-32767 4011 Voltage, L-N, 3P Average 1 Integer RO N V Volt/Scale 0-32767 4012 Current, 3P Average 1 Integer RO N I Amp/Scale 0-32767 4013 Frequency 1 Integer RO N 0.01 Hz 4500-6500 4020 Current, A 1 Integer RO N I Amp/Scale 0-32767 4021 Current, B 1 Integer RO N I Amp/Scale 0-32767 4022 Current, C 1 Integer RO N I Amp/Scale 0-32767 4023 Current, N 1 Integer RO N I Amp/Scale 0-32767 4030 Voltage, A-B 1 Integer RO N V Volt/Scale 0-32767 4031 Voltage, B-C 1 Integer RO N V Volt/Scale 0-32767 4032 Voltage, C-A 1 Integer RO N V Volt/Scale 0-32767 4033 Voltage, A-N 1 Integer RO N V Volt/Scale 0-32767 4034 Voltage, B-N 1 Integer RO N V Volt/Scale 0-32767 4035 Voltage, C-N 1 Integer RO N V Volt/Scale 0-32767 4036 Real Power, A 1 Integer RO N W kW/Scale 0-32767 0Absolute 0xFFFFFFFF Absolute Absolute RO = Read Only R/W = Read/Write NV = Nonvolatile. 28 © 2008 Schneider Electric All Rights Reserved 63230-501-209A1 07/2008 Power Meter 710 Appendix B—Register List Table B– 2: Register Listing—Metered Data (continued) Metered Data Reg Name Size Type Access NV Scale Units Range 4037 Notes Real Power, B 1 Integer RO N W kW/Scale 0-32767 Absolute 4038 Real Power, C 1 Integer RO N W kW/Scale 0-32767 Absolute 4039 Apparent Power, A 1 Integer RO N W kVA/Scale 0-32767 4040 Apparent Power, B 1 Integer RO N W kVA/Scale 0-32767 4041 Apparent Power, C 1 Integer RO N W kVA/Scale 0-32767 4042 Reactive Power, A 1 Integer RO N W kVAR/Scale 0-32767 Absolute 4043 Reactive Power, B 1 Integer RO N W kVAR/Scale 0-32767 Absolute 4044 Reactive Power, C 1 Integer RO N W kVAR/Scale 0-32767 Absolute 4045 Current, A, THD 1 Integer RO N 0.1 % 0-10000 4046 Current, B, THD 1 Integer RO N 0.1 % 0-10000 4047 Current, C, THD 1 Integer RO N 0.1 % 0-10000 4049 Voltage, A-N, THD 1 Integer RO N 0.1 % 0-10000 4050 Voltage, B-N, THD 1 Integer RO N 0.1 % 0-10000 4051 Voltage, C-N, THD 1 Integer RO N 0.1 % 0-10000 4052 Voltage, A-B, THD 1 Integer RO N 0.1 % 0-10000 4053 Voltage, B-C, THD 1 Integer RO N 0.1 % 0-10000 4054 Voltage, C-A, THD 1 Integer RO N 0.1 % 0-10000 RO = Read Only R/W = Read/Write NV = Nonvolatile. © 2008 Schneider Electric All Rights Reserved 29 Power Meter 710 Appendix B—Register List 63230-501-209A1 07/2008 Table B– 3: Register Listing—Demand Values Demand Values Reg Name Size Type Access NV Scale Units Range Notes 1022 Real Power, Total Demand Present 2 Float RO N - kW - 1024 Apparent Power, Total Demand Present 2 Float RO N - kVA - 1026 Reactive Power, Total Demand Present 2 Float RO N - kVAR - Absolute 1028 Real Power, Total Demand Peak 2 Float RO Y - kW - Absolute 1030 Apparent Power, Total Demand Peak 2 Float RO Y - kVA - 1032 Reactive Power, Total Demand Peak 2 Float RO Y - kVAR - 1042 Current, A, Demand Present 2 Float RO N - Amp - 1044 Current, B, Demand Present 2 Float RO N - Amp - 1046 Current, C, Demand Present 2 Float RO N - Amp - 1048 Current, A, Demand Peak 2 Float RO Y - Amp - 1050 Current, B, Demand Peak 2 Float RO Y - Amp - 1052 Current, C, Demand Peak 2 Float RO Y - Amp - 4014 Real Power, Total Demand Present 1 Integer RO N W kW/Scale 0-32767 4015 Apparent Power, Total Demand Present 1 Integer RO N W kVA/Scale 0-32767 4016 Reactive Power, Total Demand Present 1 Integer RO N W kVAR/Scale 0-32767 Absolute 4017 Real Power, Total Demand Peak 1 Integer RO Y W kW/Scale 0-32767 Absolute 4018 Apparent Power, Total Demand Peak 1 Integer RO Y W kVA/Scale 0-32767 4019 Reactive Power, Total Demand Peak 1 Integer RO Y W kVAR/Scale 0-32767 4024 Current, A, Demand Present 1 Integer RO N I Amp/Scale 0-32767 4025 Current, B, Demand Present 1 Integer RO N I Amp/Scale 0-32767 4026 Current, C, Demand Present 1 Integer RO N I Amp/Scale 0-32767 Absolute Absolute Absolute Absolute RO = Read Only R/W = Read/Write NV = Nonvolatile. 30 © 2008 Schneider Electric All Rights Reserved 63230-501-209A1 07/2008 Power Meter 710 Appendix B—Register List Table B– 3: Register Listing—Demand Values (continued) Demand Values Reg Name Size Type Access NV Scale Units Range 4027 Current, A, Demand Peak 1 Integer RO Y I Amp/Scale 0-32767 4028 Current, B, Demand Peak 1 Integer RO Y I Amp/Scale 0-32767 4029 Current, C, Demand Peak 1 Integer RO Y I Amp/Scale 0-32767 Notes RO = Read Only R/W = Read/Write NV = Nonvolatile. Table B– 4: Register Listing—Min Max Values Min Max values Reg Name Size Type Access NV Scale Units Range Notes 1104 Real Power, Total Minimum 2 Float RO Y - kW - 1106 Apparent Power, Total Minimum 2 Float RO Y - kVA - 1108 Reactive Power, Total Minimum 2 Float RO Y - kVAR - Absolute 1110 Power Factor, Total Minimum 2 Float RO Y - - 0.0-1.0 Absolute 1112 Frequency Minimum 2 Float RO Y - Hz 45.0-65.0 1114 Current, A, Minimum 2 Float RO Y - Amp - 1116 Current, B, Minimum 2 Float RO Y - Amp - 1118 Current, C, Minimum 2 Float RO Y - Amp - 1122 Voltage, A-N, Minimum 2 Float RO Y - Volt - 1124 Voltage, B-N, Minimum 2 Float RO Y - Volt - 1126 Voltage, C-N, Minimum 2 Float RO Y - Volt - 1128 Voltage, A-B, Minimum 2 Float RO Y - Volt - 1130 Voltage, B-C, Minimum 2 Float RO Y - Volt - 1132 Voltage, C-A, Minimum 2 Float RO Y - Volt - 1134 Current, A, THD Minimum 2 Float RO Y - % 0.0-1000.0 1136 Current, B, THD Minimum 2 Float RO Y - % 0.0-1000.0 1138 Current, C, THD Minimum 2 Float RO Y - % 0.0-1000.0 Absolute RO = Read Only R/W = Read/Write NV = Nonvolatile. © 2008 Schneider Electric All Rights Reserved 31 Power Meter 710 Appendix B—Register List 63230-501-209A1 07/2008 Table B– 4: Register Listing—Min Max Values (continued) Min Max values Reg Name Size Type Access NV Scale Units Range Notes 1142 Voltage, A-N, THD Minimum 2 Float RO Y - % 0.0-1000.0 1144 Voltage, B-N, THD Minimum 2 Float RO Y - % 0.0-1000.0 1146 Voltage, C-N, THD Minimum 2 Float RO Y - % 0.0-1000.0 1148 Voltage, A-B, THD Minimum 2 Float RO Y - % 0.0-1000.0 1150 Voltage, B-C, THD Minimum 2 Float RO Y - % 0.0-1000.0 1152 Voltage, C-A, THD Minimum 2 Float RO Y - % 0.0-1000.0 1154 Real Power, Total Maximum 2 Float RO Y - kW - 1156 Apparent Power, Total Maximum 2 Float RO Y - kVA - 1158 Reactive Power, Total Maximum 2 Float RO Y - kVAR - Absolute 1160 Power Factor, Total Maximum 2 Float RO Y - - 0.0-1.0 Absolute 1162 Frequency Maximum 2 Float RO Y - Hz 45.0-65.0 1164 Current, A, Maximum 2 Float RO Y - Amp - 1166 Current, B, Maximum 2 Float RO Y - Amp - 1168 Current, C, Maximum 2 Float RO Y - Amp - 1172 Voltage, A-N, Maximum 2 Float RO Y - Volt - 1174 Voltage, B-N, Maximum 2 Float RO Y - Volt - 1176 Voltage, C-N, Maximum 2 Float RO Y - Volt - 1178 Voltage, A-B, Maximum 2 Float RO Y - Volt - 1180 Voltage, B-C, Maximum 2 Float RO Y - Volt - 1182 Voltage, C-A, Maximum 2 Float RO Y - Volt - 1184 Current, A, THD Maximum 2 Float RO Y - % 0.0-1000.0 1186 Current, B, THD Maximum 2 Float RO Y - % 0.0-1000.0 1188 Current, C, THD Maximum 2 Float RO Y - % 0.0-1000.0 1192 Voltage, A-N, THD Maximum 2 Float RO Y - % 0.0-1000.0 Absolute RO = Read Only R/W = Read/Write NV = Nonvolatile. 32 © 2008 Schneider Electric All Rights Reserved 63230-501-209A1 07/2008 Power Meter 710 Appendix B—Register List Table B– 4: Register Listing—Min Max Values (continued) Min Max values Reg Name Size Type Access NV Scale Units Range Notes 1194 Voltage, B-N, THD Maximum 2 Float RO Y - % 0.0-1000.0 1196 Voltage, C-N, THD Maximum 2 Float RO Y - % 0.0-1000.0 1198 Voltage, A-B, THD Maximum 2 Float RO Y - % 0.0-1000.0 1200 Voltage, B-C, THD Maximum 2 Float RO Y - % 0.0-1000.0 1202 Voltage, C-A, THD Maximum 2 Float RO Y - % 0.0-1000.0 4055 Real Power, Total Minimum 1 Integer RO Y W kW 0-32767 4056 Apparent Power, Total Minimum 1 Integer RO Y W kVA 0-32767 4057 Reactive Power, Total Minimum 1 Integer RO Y W kVAR 0-32767 Absolute 4058 Power Factor, Total Minimum 1 Integer RO Y 0.0001 - 0-10000 Absolute 4059 Frequency Minimum 1 Integer RO Y 0.01 Hz 4500-6500 4060 Current, A, Minimum 1 Integer RO Y I Amp 0-32767 4061 Current, B, Minimum 1 Integer RO Y I Amp 0-32767 4062 Current, C, Minimum 1 Integer RO Y I Amp 0-32767 4064 Voltage, A-N, Minimum 1 Integer RO Y V Volt 0-32767 4065 Voltage, B-N, Minimum 1 Integer RO Y V Volt 0-32767 4066 Voltage, C-N, Minimum 1 Integer RO Y V Volt 0-32767 4067 Voltage, A-B, Minimum 1 Integer RO Y V Volt 0-32767 4068 Voltage, B-C, Minimum 1 Integer RO Y V Volt 0-32767 4069 Voltage, C-A, Minimum 1 Integer RO Y V Volt 0-32767 4070 Current, A, THD Minimum 1 Integer RO Y 0.1 % 0-10000 4071 Current, B, THD Minimum 1 Integer RO Y 0.1 % 0-10000 4072 Current, C, THD Minimum 1 Integer RO Y 0.1 % 0-10000 4074 Voltage, A-N, THD Minimum 1 Integer RO Y 0.1 % 0-10000 4075 Voltage, B-N, THD Minimum 1 Integer RO Y 0.1 % 0-10000 Absolute RO = Read Only R/W = Read/Write NV = Nonvolatile. © 2008 Schneider Electric All Rights Reserved 33 Power Meter 710 Appendix B—Register List 63230-501-209A1 07/2008 Table B– 4: Register Listing—Min Max Values (continued) Min Max values Reg Name Size Type Access NV Scale Units Range Notes 4076 Voltage, C-N, THD Minimum 1 Integer RO Y 0.1 % 0-10000 4077 Voltage, A-B, THD Minimum 1 Integer RO Y 0.1 % 0-10000 4078 Voltage, B-C, THD Minimum 1 Integer RO Y 0.1 % 0-10000 4079 Voltage, C-A, THD Minimum 1 Integer RO Y 0.1 % 0-10000 4080 Real Power, Total Maximum 1 Integer RO Y W kW 0-32767 4081 Apparent Power, Total Maximum 1 Integer RO Y W kVA 0-32767 4082 Reactive Power, Total Maximum 1 Integer RO Y W kVAR 0-32767 Absolute 4083 Power Factor, Total Maximum 1 Integer RO Y 0.0001 - 0-10000 Absolute 4084 Frequency Maximum 1 Integer RO Y 0.01 Hz 4500-6500 4085 Current, A, Maximum 1 Integer RO Y I Amp 0-32767 4086 Current, B, Maximum 1 Integer RO Y I Amp 0-32767 4087 Current, C, Maximum 1 Integer RO Y I Amp 0-32767 4089 Voltage, A-N, Maximum 1 Integer RO Y V Volt 0-32767 4090 Voltage, B-N, Maximum 1 Integer RO Y V Volt 0-32767 4091 Voltage, C-N, Maximum 1 Integer RO Y V Volt 0-32767 4092 Voltage, A-B, Maximum 1 Integer RO Y V Volt 0-32767 4093 Voltage, B-C, Maximum 1 Integer RO Y V Volt 0-32767 4094 Voltage, C-A, Maximum 1 Integer RO Y V Volt 0-32767 4095 Current, A, THD Maximum 1 Integer RO Y 0.1 % 0-10000 4096 Current, B, THD Maximum 1 Integer RO Y 0.1 % 0-10000 4097 Current, C, THD Maximum 1 Integer RO Y 0.1 % 0-10000 4099 Voltage, A-N, THD Maximum 1 Integer RO Y 0.1 % 0-10000 4100 Voltage, B-N, THD Maximum 1 Integer RO Y 0.1 % 0-10000 4101 Voltage, C-N, THD Maximum 1 Integer RO Y 0.1 % 0-10000 Absolute RO = Read Only R/W = Read/Write NV = Nonvolatile. 34 © 2008 Schneider Electric All Rights Reserved 63230-501-209A1 07/2008 Power Meter 710 Appendix B—Register List Table B– 4: Register Listing—Min Max Values (continued) Min Max values Reg Name Size Type Access NV Scale Units Range 4102 Voltage, A-B, THD Maximum 1 Integer RO Y 0.1 % 0-10000 4103 Voltage, B-C, THD Maximum 1 Integer RO Y 0.1 % 0-10000 4104 Voltage, C-A, THD Maximum 1 Integer RO Y 0.1 % 0-10000 Notes RO = Read Only R/W = Read/Write NV = Nonvolatile. Table B– 5: Register Listing—Reset Commands Reset Commands—Write commands to Register 4126. Command Parameters Notes 666 6209 Restart demand metering Register: Energy value to appear in register: 7016 4000 7017 4001 7018 4002 7019 4003 7020 4004 7021 4005 Preset Energy Values 10001 Clear the Usage Timers. (Set to 0) 14255 Reset all Min/Max Values. (Sets values to defaults) 21212 Reset Peak Demand values. (Set to 0) 30078 Clear all Energy Accumulators. (Set to 0) NOTE: Register List is bsed on Firmware versions 2.020 © 2008 Schneider Electric All Rights Reserved 35 Power Meter 710 Appendix B—Register List SUPPORTED MODBUS COMMANDS 63230-501-209A1 07/2008 Table B– 6: Modbus Commands Command 0x03 Description Read holding registers 0x04 Read input registers 0x06 Preset single registers 0x10 Preset multiple registers Report ID Return String byte 1: 0x11 0x11 byte 2: number of bytes following without crc byte 3: ID byte = 250 byte 4: status = 0xFF bytes 5+: ID string = PM710 Power Meter last 2 bytes: CRC Read device identification, BASIC implementation (0x00, 0x01, 0x02 data), conformity level 1, Object Values 0x2B 0x01: If register 4128 is 0, then “Merlin Gerin. If register 4128 is 1, then “Square D” 0x02: “PM710” 0x03: “Vxx.yyy” where xx.yyy is the OS version number. This is the reformatted version of register 7001. If the value for register 7001 is 12345, then the 0x03 data would be “V12.345” 36 © 2008 Schneider Electric All Rights Reserved 63230-501-209A1 07/2008 Power Meter 710 Appendix C—Instrument Transformer Wiring: Troubleshooting Guide APPENDIX C—INSTRUMENT TRANSFORMER WIRING: TROUBLESHOOTING GUIDE Abnormal readings in an installed meter can sometimes signify improper wiring. This appendix is provided as an aid in troubleshooting potential wiring problems. NOTE The information in this appendix is intended to be general in nature and covers a variety of metering devices. The Power Meter 710 does not display signed readings for Power, Engergy, or Power Factor. Throughout this appendix, when values are stated in terms of positive, negative, or lagging, for the Power Meter 710, those readings are absolute. SECTION I: USING THIS GUIDE The following sections contain “Case” tables showing a variety of symptoms and probable causes. The symptoms listed are “ideal,” and some judgment should be exercised when troubleshooting. For example, if the kW reading is 25, but you know that it should be about 300 kW, go to a table where “kW = 0” is listed as one of the symptoms. “Section II: Common Problems for 3-Wire and 4-Wire Systems ” addresses symptoms and possible causes that occur regardless of system type. Check this section first. If the symptoms are more complicated, proceed to “Section III: 3-Wire System Troubleshooting” or “Section IV: 4-Wire System Troubleshooting” as is appropriate. Because it is nearly impossible to address all combinations of multiple wiring mistakes or other problems that can occur (e.g., blown PT fuses, missing PT neutral ground connection, etc.), this guide generally addresses only one wiring problem at a time. Before trying to troubleshoot wiring problems, it is imperative that all instantaneous readings be available for reference. Specifically those readings should include the following: • • • • • • • What is Normal? line-to-line voltages line-to-neutral voltages phase currents power factor kW kVAR kVA Most power systems have a lagging (inductive) power factor. The only time a leading power factor is expected is if power factor correction capacitors are switched in or over-excited synchronous motors with enough capacitive kVARS on-line to overcorrect the power factor to leading. Some uninterruptable power supplies (UPS) also produce a leading power factor. "Normal" lagging power system readings are as follows: © 2008 Schneider Electric All Rights Reserved • kW = 3 × V AB × I 3ΦAvg × PF 3ΦAvg ) ⁄ 1000 • kVAR = 2 2 ( ( kVA ) – ( kW ) ) 37 Power Meter 710 Appendix C—Instrument Transformer Wiring: Troubleshooting Guide 63230-501-209A1 07/2008 • kVA = 3 × V AB × I 3ΦAvg ) ⁄ 1000 • PF 3ΦAvg = lagging in the range 0.70 to 1.00 (for 4-wire systems, all phase PFs are about the same) • Phase currents approximately equal • Phase voltages approximately equal A quick check for proper readings consists of kW comparisons (calculated using the equation above and compared to the meter reading) and a reasonable lagging 3-phase average power factor reading. If these checks are okay, there is little reason to continue to check for wiring problems. SECTION II: COMMON PROBLEMS FOR 3-WIRE AND 4-WIRE SYSTEMS Table C– 1: Section II—Case A Symptoms: 3-Wire and 4-Wire • Zero amps • Zero kW, kVAR, kVA Possible Causes • CT secondaries shorted • Less than 2% load on power meter based on CT ratio Example: with 100/5 CT's, at least 2A must flow through CT window for power meter to “wake up” Table C– 2: Section II—Case B Symptoms: 3-Wire and 4-Wire • Negative kW of expected magnitude • Positive kVAR • Normal lagging power factor (See “NOTE” on page 37.) Possible Causes • All three CT polarities backwards; could be CTs are physically mounted with primary polarity mark toward the load instead of toward source or secondary leads swapped • All three PT polarities backwards; again, could be on primary or secondary NOTE: Experience shows CTs are usually the problem. Table C– 3: Section II—Case C Symptoms: 3-Wire and 4-Wire • 38 Frequency is an abnormal value; may or may not be a multiple of 50/60 Hz. Possible Causes • PTs primary and/or secondary neutral common not grounded (values as high as 275 Hz and as low as 10 Hz have been seen) • System grounding problem at the power distribution transformer (such as utility transformer), though this is not likely © 2008 Schneider Electric All Rights Reserved 63230-501-209A1 07/2008 Power Meter 710 Appendix C—Instrument Transformer Wiring: Troubleshooting Guide SECTION III: 3-WIRE SYSTEM TROUBLESHOOTING Table C– 4: Section III—Case A Symptoms: 3-Wire Possible Causes • Currents and voltages approximately balanced • kW = near 0 • kVAR = near 0 • PF can be any value, probably fluctuating • CT secondary leads are swapped (A-phase lead on C-phase terminal and vice versa) • PT secondary leads are swapped (A-phase lead on C-phase terminal and vice versa) Table C– 5: Section III—Case B Symptoms: 3-Wire Possible Causes 3 higher than A and C (except in • Phase B current is System Type 31) • kVA = about half of the expected magnitude • kW and kVAR can be positive or negative, less than about half of the expected magnitude • PF can be any value, probably a low leading value • One CT polarity is backwards Table C– 6: Section III—Case C Symptoms: 3-Wire • V CA is • kVA = about half of the expected magnitude • kW and kVAR can be positive or negative, less than about half of the expected magnitude • PF can be any value, probably a low leading value Possible Causes 3 higher than V AB and V BC • One PT polarity is backwards Table C– 7: Section III—Case D Symptoms: 3-Wire Possible Causes • kW = 0 or low, with magnitude less than kVAR • kVAR = positive or negative with magnitude of close to what • is expected for kW • kVA = expected magnitude • PF = near 0 up to about 0.7 lead • Either the two voltage leads are swapped OR the two current leads are swapped AND one instrument transformer has backwards polarity (look for V CA = 3 high or phase B current = 3 high) The power meter is metering a purely capacitive load (this is unusual); in this case kW and kVAR will be positive and PF will be near 0 lead (See “NOTE” on page 37.) © 2008 Schneider Electric All Rights Reserved 39 Power Meter 710 Appendix C—Instrument Transformer Wiring: Troubleshooting Guide 63230-501-209A1 07/2008 Table C– 8: Section III—Case E Symptoms: 3-Wire Possible Causes • One phase current reads 0 • kVA = about 1/2 of the expected value • The CT on the phase that reads 0 is short-circuited • kW, kVAR, and power factor can be positive or negative of any value • Less than 2% current (based on CT ratio) flowing through the CT on the phase that reads 0 (See “NOTE” on page 37.) SECTION IV: 4-WIRE SYSTEM TROUBLESHOOTING Table C– 9: Section IV—Case A Symptoms: 4-Wire Possible Causes • kW = 1/3 of the expected value • kVAR = 1/3 of the expected value • power factor = 1/3 of the expected value • All else is normal • One CT polarity is backwards NOTE: The only way this problem will usually be detected is by the Quick Check procedure. It is very important to always calculate kW. In this case, it is the only symptom and will go unnoticed unless the calculation is done or someone notices backwards CT on a waveform capture. Table C– 10: Section IV—Case B Symptoms: 4-Wire • Possible Causes • kW = 1/3 of the expected value One PT polarity is backwards NOTE: The line-to-line voltage reading that does not reference the PT with backwards polarity will be the only correct reading. • kVAR = 1/3 of the expected value • 2 of the 3 line-to-line voltages are • power factor = 1/3 of the expected value • All else is normal 3 low Example: V AB = 277, V BC = 480, V CA = 277 In this case, the A-phase PT polarity is backwards. reference V A . V BC is correct because it does not Table C– 11: Section IV—Case C Symptoms: 4-Wire Possible Causes • One line-to-neutral voltage is zero • 2 of the 3 line-to-line voltages are • kW = 2/3 of the expected value NOTE: The line-to-line voltage reading that does not reference the missing PT input will be the only correct reading. • kVAR = 2/3 of the expected value Example: • kVA = 2/3 of the expected value • Power factor may look abnormal 40 • 3 low PT metering input missing (blown fuse, open phase disconnect, etc.) on the phase that reads zero. V AB = 277, V BC = 277, V CA = 480 In this case, the B-phase PT input is missing. reference V B . V CA is correct because it does not © 2008 Schneider Electric All Rights Reserved 63230-501-209A1 07/2008 Power Meter 710 Appendix C—Instrument Transformer Wiring: Troubleshooting Guide Table C– 12: Section IV—Case D Symptoms: 4-Wire Possible Causes • 3-phase kW = 2/3 of the expected value • 3-phase kVAR = 2/3 of the expected value • The CT on the phase that reads 0 is short-circuited • 3-phase kVA = 2/3 of the expected value • • One phase current reads 0 Less than 2% current (based on CT ratio) flowing through the CT on the phase that reads 0 • All else is normal Table C– 13: Section IV—Case E Symptoms: 4-Wire • kW = near 0 • kVA = near 0 • 3-phase average power factor flip-flopping lead and lag • Voltages, currents, and kVA are normal Possible Causes • Two CT secondary leads are swapped (A-phase on B-phase terminal, for example) • Two PT secondary leads are swapped (A-phase on B-phase terminal, for example) NOTE: In either case, the phase input that is not swapped will read normal lagging power factor. Table C– 14: Section IV—Case F Symptoms: 4-Wire • kW = negative and less than kVAR • KVAR = negative and close to value expected for kW • kVA = expected value • Power factor low and leading • Voltages and currents are normal Possible Causes • All three PT lead connections “rotated” counterclockwise: A-phase wire on C-phase terminal, B-phase wire on A-phase terminal, C-phase wire on Bphase terminal. • All three CT lead connections “rotated” clockwise: A-phase wire on B-phase terminal, B-phase wire on C-phase terminal, C-phase wire on A-phase terminal. Table C– 15: Section IV—Case G Symptoms: 4-Wire • kW = negative and less than kVAR • kVAR = positive and close to the value for kW Possible Causes • All three PT lead connections “rotated” clockwise: A-phase wire on B-phase terminal, B-phase wire on C-phase terminal, C-phase wire on A-phase terminal. • All three CT lead connections “rotated” counterclockwise: A-phase wire on C-phase terminal, B-phase wire on A-phase terminal, C-phase wire on Bphase terminal. NOTE: looks like kW and kVAR swapped places • kVA = expected value • Power factor low and lagging • Voltages and currents are normal © 2008 Schneider Electric All Rights Reserved 41 Power Meter 710 Appendix C—Instrument Transformer Wiring: Troubleshooting Guide FIELD EXAMPLE 63230-501-209A1 07/2008 Readings from a 4-wire system • • • • • • • • • • • • • • kW = 25 kVAR = – 15 * kVA = 27 I A = 904A I B = 910A I C = 931A I 3ΦAvg = 908A V AB = 495V V BC = 491V V CA = 491V V AN = 287V V BN = 287V V CN = 284V PF 3ΦAvg = 0.75 lag to 0.22 lead fluctuating* Troubleshooting Diagnosis • • Power factors cannot be correct • Cannot calculate kW because 3-phase power factor cannot be right, so calculate kVA instead • Calculated kVA =( 3 × V ab × I 3ΦAvg ) ⁄ 1000 = 1.732 × 495 × 908 ) ⁄ 1000 = 778 kVA • • • Power meter reading is essentially zero compared to this value • Since A-phase power factor is the only one that has a normal looking lagging value, suspect B and C-phase CT leads may be swapped* • After swapping B and C-phase CT leads, all readings went to the expected values; problem solved None of the “Section II” symptoms exist, so proceed to the 4-wire troubleshooting (“Section IV”) 4-wire Case E looks similar Since the PTs were connected to other power meters which were reading correctly, suspect two CT leads swapped *See “NOTE” on page 37. 42 © 2008 Schneider Electric All Rights Reserved 63230-501-209A1 07/2008 Power Meter 710 Glossary GLOSSARY TERMS absolute energy—both energy in and out of the load are treated as additive. absolute power—both power in and out of the load are treated as additive. accumulated energy—energy can accumulates in either signed or unsigned (absolute) mode. In signed mode, the direction of power flow is considered and the accumulated energy magnitude may increase and decrease. In absolute mode, energy accumulates as a positive regardless of the power flow direction. active alarm—an alarm that has been set up to trigger the execution of a task or notification when certain conditions are met. An icon in the upperright corner of the meter indicates that an alarm is active (!). See also enabled alarm and disabled alarm. baud rate—specifies how fast data is transmitted across a network port. block interval demand—power demand calculation method for a block of time and includes three ways to apply calculating to that block of time using the sliding block, fixed block, or rolling block method. communications link—a chain of devices connected by a communications cable to a communications port. current transformer (CT)—current transformer for current inputs. demand—average value of a quantity, such as power, over a specified interval of time. device address—defines where the power meter resides in the power monitoring system. event—the occurrence of an alarm condition, such as Undervoltage Phase A, configured in the power meter. firmware—operating system within the power meter fixed block—an interval selected from 1 to 60 minutes (in 1-minute increments). The power meter calculates and updates the demand at the end of each interval. float—a 32-bit floating point value returned by a register. The upper 16bits are in the lowest-numbered register pair. For example, in the register 4010/11, 4010 contains the upper 16-bits while 4011 contains the lower 16-bits. frequency—number of cycles in one second. line-to-line voltages—measurement of the rms line-to-line voltages of the circuit. line-to-neutral voltages—measurement of the rms line-to-neutral voltages of the circuit. maximum demand current—highest demand current measured in amperes since the last reset of demand. maximum demand real power—highest demand real power measured since the last reset of demand. maximum demand voltage—highest demand voltage measured since the last reset of demand. maximum demand—highest demand measured since the last reset of demand. © 2008 Schneider Electric All Rights Reserved 43 Power Meter 710 Glossary 63230-501-209A1 07/2008 maximum value—highest value recorded of the instantaneous quantity such as Phase A Current, Phase A Voltage, etc., since the last reset of the minimums and maximums. minimum value—lowest value recorded of the instantaneous quantity such as Phase A Current, Phase A Voltage, etc., since the last reset of the minimums and maximums. nominal—typical or average. parity—refers to binary numbers sent over the communications link. An extra bit is added so that the number of ones in the binary number is either even or odd, depending on your configuration). Used to detect errors in the transmission of data. phase currents (rms)—measurement in amperes of the rms current for each of the three phases of the circuit. See also maximum value. phase rotation—refers to the order in which the instantaneous values of the voltages or currents of the system reach their maximum positive values. Two phase rotations are possible: A-B-C or A-C-B. potential transformer (PT)—also known as a voltage transformer. power factor (PF)—true power factor is the ratio of real power to apparent power using the complete harmonic content of real and apparent power. Calculated by dividing watts by volt amperes. Power factor is the difference between the total power your utility delivers and the portion of total power that does useful work. Power factor is the degree to which voltage and current to a load are out of phase. real power—calculation of the real power (3-phase total and per-phase real power calculated) to obtain kilowatts. rms—root mean square. Power meters are true rms sensing devices. rolling block—a selected interval and subinterval that the power meter uses for demand calculation. The subinterval must divide evenly into the interval to the second. Demand is updated at each subinterval, and the power meter displays the demand value for the last completed interval. scale factor—multipliers that the power meter uses to make values fit into the register where information is stored. safety extra low voltage (SELV) circuit—a SELV circuit is expected to always be below a hazardous voltage level. short integer—a signed 16-bit integer. sliding block—an interval selected from 1 to 60 minutes (in 1-minute increments). If the interval is between 1 and 15 minutes, the demand calculation updates every 15 seconds. If the interval is between 16 and 60 minutes, the demand calculation updates every 60 seconds. The power meter displays the demand value for the last completed interval. system type—a unique code assigned to each type of system wiring configuration of the power meter. thermal demand—demand calculation based on thermal response. Total Harmonic Distortion (THD or thd)—indicates the degree to which the voltage or current signal is distorted in a circuit. total power factor—see power factor. true power factor—see power factor. unsigned integer—an unsigned 16-bit integer. unsigned long integer—an unsigned 32-bit value returned by a register. The upper 16-bits are in the lowest-numbered register pair. For example, in the register pair 4010 and 4011, 4010 contains the upper 16-bits while 4011 contains the lower 16-bits. 44 © 2008 Schneider Electric All Rights Reserved 63230-501-209A1 07/2008 ABBREVIATIONS Power Meter 710 Glossary A—Ampere ADDR—Power meter address AMPS—Amperes BARGR—Bargraph COMMS—Communications CPT—Control Power Transformer CT—see current transformer on page 43 DMD—Demand DOM—Date of Manufacturing F—Frequency HZ—Hertz I—Current IMAX—Current maximum demand kVA—Kilovolt-Ampere kVAD—Kilovolt-Ampere demand kVAR—Kilovolt-Ampere reactive kVARD—Kilovolt-Ampere reactive demand kVARH—Kilovolt-Ampere reactive hour kW—Kilowatt kWD—Kilowatt demand kWH—Kilowatthours kWH/P—Kilowatthours per pulse kWMAX—Kilowatt maximum demand MAINT—Maintenance screen MBUS—MODBUS MIN—Minimum MINMX—Minimum and maximum values MSEC—Milliseconds MVAh—Megavolt ampere hour MVARh—Megavolt ampere reactive hour MWh—Megawatt hour O.S.—Operating System (firmware version) P—Real power PAR—Parity PASSW—Password Pd—Real power demand PF—Power factor Ph—Real energy PM—Power meter PQS—Real, reactive, apparent power PQSd—Real, reactive, apparent power demand PRIM—Primary PT—Number of voltage connections (see potential transformer on page 44) © 2008 Schneider Electric All Rights Reserved 45 Power Meter 710 Glossary 63230-501-209A1 07/2008 PWR—Power Q—Reactive power Qd—Reactive power demand Qh—Reactive energy R.S.—Firmware reset system version S—Apparent power S.N.—Power meter serial number SCALE—see scale factor on page 44 Sd—Apparent power demand SECON—Secondary SEC—Secondary Sh—Apparent Energy SUB-I—Subinterval THD—Total Harmonic Distortion U—Voltage line to line V—Voltage VAR—volt ampere reactive. VMAX—Maximum voltage VMIN—Minimum voltage 46 © 2008 Schneider Electric All Rights Reserved 63230-501-209A1 07/2008 Power Meter 710 Index INDEX PT B R block interval demand method 17 communications functions 16 setup 11 CT setup 8, 11 readings demand 16 real-time readings 15 min/max values 16 register list 25 resets of peak demand values 19 rolling block 17 D S default password 7 demand current 19 thermal 19 demand current calculation 19 demand power calculation 17 demand readings 16 demand current 19 diagnostics password 10 display menu overview 6 operating 5 setup 7 communications 11 CT 8, 11 demand current power 9 password 10 PTs 8, 11 sliding block 17 C English setup 8, 11 T thermal demand method 19 troubleshooting 21 instrument transformer wiring 37 E energy password 10 energy readings 19 F firmware 2 fixed block 17 M menu 6 metered values demand readings 16 energy readings 19 real-time readings 15 minimum/maximum password 10 P password default 7 diagnostics 10 energy 10 minimum/maximum 10 setup 10 peak demand calculation 19 power analysis values 20 power factor min/max conventions 16 power meter accessories 2 firmware 2 hardware 1 setup 7 specifications 23 © 2008 Schneider Electric All Rights Reserved 47 Schneider Electric Power Monitoring and Control 295 Tech Park Drive, Suite 100 Lavergne, TN 37086 Tel: 1-615-287-3400 2195 Keating Cross Road Saanichton, BC Canada V8M 2A5 Tel: 1-250-652-7100 Electropole (38 EQI) 31, rue Pierre Mendes France F - 38050 Grenoble Cedex 9 Tel: +33 (0) 4 76 57 60 60 Getting technical support: Contact your local Schneider Electric sales representative for assistance or go to the www.powerlogic.com website. PowerLogic is a trademark or registered trademark of Schneider Electric in the USA, France and other countries. Electrical equipment should be installed, operated, serviced, and maintained only by qualified personnel. No responsibility is assumed by Schneider Electric for any consequences arising out of the use of this material. 63230-501-209A1 07/2008 All Rights Reserved