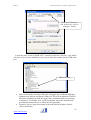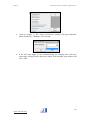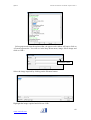
1
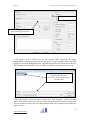
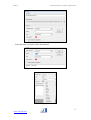
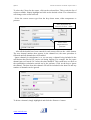
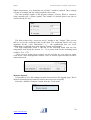
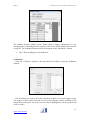
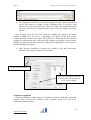
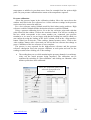
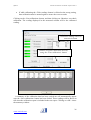
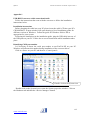
QMF 40
EaziVal SE Software User Manual Sept 2010 Issue 2
EaziVal SE Software User Manual.
(QMF40)
Sept 2010 Issue 2
Manual written And Compiled by A.Gillespie LCGI & J.Stutters
Anville Instruments Ltd.
Bramble Orchard,
46a Folly Lane North,
Farnham
Surry, GU9 0HX
Enquiries & Support: [email protected]
Tel. 01252 351030
Fax.01252 323492
NOTICE
The contents of this manual are liable to change without notice. Whilst every effort has been made to
ensure the accuracy of this manual, Anville will not be responsible for any errors and omissions or their
consequence.
EaziVal is a trademark of Anville Instruments Ltd.
Windows is a registered trademark of Microsoft Corporation.
Lotus® is a registered trademark of IBM.
COPYRIGHT
This documentation and the software described in it are copyrighted with all rights reserved. Under
copyright laws, neither the documentation nor the software may be copied, photocopied, reproduced,
translated, or reduced to any electronic medium or machine readable form, in whole or in part, without
the written consent of Anville Instruments Ltd. Failure to comply with this condition may result in
prosecution.
1
www.eazival.com
QMF 40
EaziVal SE Software User Manual Sept 2010 Issue 2
ANVILLE INSTRUMENTS LTD
EAZIVAL SE
Guide Manual
The ANVILLE INSTRUMENTS EAZIVAL software is specifically designed with
the engineer in mind. It is easy to use and even if the engineer is not computer literate
he should not find too much difficulty in mastering the system. The system is laid out
so a natural path is followed to the machine to be tested with every click of the mouse.
The hospital engineer in particular will find that all the tests contained in HTM2010,
HTM2030 and HTM01 are included within the software. These include weekly,
quarterly and yearly test sheets for the following machine types: Porous load sterilizer.
Unwrapped Instrument sterilizer.
Washer Disinfector machines.
The system has the ability to calculate holding and equilibration times for all
machine types and sterilizing bands. Compile reports including machine identification
details, thermometric charts, data listings and test sheets. Reports can be printed out or
sent to other recipients using e-mail.
Manual written by A.Gillespie & J.Stutters
©Anville Instruments Ltd. 2004
2
www.eazival.com
QMF 40
EaziVal SE Software User Manual Sept 2010 Issue 2
Getting started
Before installing EaziVal SE
Please shut down all running programs.
Software installation
Place the EaziVal SE CD in your computers CD ROM drive. If you have auto run
then the installer will start automatically.
Follow the instructions given by the set-up program to complete the installation of
EaziVal SE on your system.
If the installation does not start automatically then you should open My Computer.
Double click the CD ROM drive to display its contents.
Once the contents of the CD are displayed locate the Setup.exe program and double
click it. After this follow the instructions from the set-up program.
E.g.: - Porous load cycle.
3
www.eazival.com
QMF 40
EaziVal SE Software User Manual Sept 2010 Issue 2
E.g.: - Washer disinfector cycle.
Password
On starting the program you will automatically be asked for a password.
The initial password when first starting the software is: User name = new user
Password = password
These are case sensitive and are in lower case. Once you are in the program you
will be able to set up user accounts and passwords.
4
www.eazival.com
QMF 40
EaziVal SE Software User Manual Sept 2010 Issue 2
The password has three levels, “supervisor”, “user” or “administrator”. In the
“supervisor” level user accounts and security can be managed. The “user” level can
only perform tasks that he has been allowed by the supervisor.
Later in this manual there is instruction on changing passwords, setting up users
and setting user access levels. This can be found in the chapters “user management”
and “user capabilities”.
Site window and machine selection
Click <New> and “New
hospital” will appear in
the window
Use the <Edit> button
to change the site name
In this section you are able to list all the sites where you have machines to be
tested. The levels range from site (being the hospital or clinic), department, and
machine type, right down to the actual machine.
The menu in this window is in a tree format. It is easy to follow; as you click on the
site it will automatically lead you onto the next level in the tree.
When the site window first appears it will be blank and the first sites need to be
entered. Click on the <New> button and “New hospital” will appear in the site
window. Click on the site to highlight it. With the site highlighted the name of that
site can be edited by clicking on the <Edit> button. Delete the words “New hospital”
and enter the name required.
The first title is for the sites where the machines are situated i.e. Hospitals, clinics
etc. This same procedure is followed through all the folders. So you can easily name
5
www.eazival.com
QMF 40
EaziVal SE Software User Manual Sept 2010 Issue 2
the site, the individual name of the department within that site and so on. Each time a
new site needs to be added highlight a site and click on <New>.
•
The first “new” site must be edited before you can add further sites.
Once you have named your hospital the next stage is to give the department a title.
Just click on the hospital, this opens a new section. Title the department in the same
way as you did for the hospital.
Click on the department and this will then bring you to “machine” types. This could
be just the one type, for example “Autoclaves”, or you can have as many as you wish.
All you do to add more is click on the <New> button when you have an existing type
highlighted. You can, as with the other titles change the words “New type” to suit the
machine type you are testing. Clicking on the machine type will bring you to the next
level, this one is where you title the individual machines, e.g.: - by serial number,
department number and so on.
Once you have entered the details of each site you will find it is very quick to
access each machine to be tested without the need to repeatedly enter details. Every
time you do a test on a particular machine all the results will go back to the folder on
your PC allocated to that machine.
Edit the tree so that you have the
site, department, machine type
and then the actual machine.
Deleting unwanted sites and machines
When a site is no longer wanted in the program there is a path that you need to
follow in order to remove it. You must first of all delete the machine itself and then
work your way back to the site by deleting the machine type and then the department.
You will need to delete all the items in each section before you can delete the section
itself. To delete an item simply highlight it and then click on the <Delete> button.
6
www.eazival.com
QMF 40
•
•
EaziVal SE Software User Manual Sept 2010 Issue 2
The system will position the site window at the site that was last used when
you next log on. If that site is not required simply select the site that is and
click<OK>.
The site location, or machine, can easily be changed without the need to log
off the system. Select the “Select machine” button from the “File” drop down
menu. The site window opens, simply select the site etc and click on <OK>.
The main EaziVal SE window
User, site and machine details
are shown on the site window
The main window has a number of menu’s and toolbar containing a row of buttons.
The menu’s contain options used during the set-up of EaziVal 2 and the creation of
logger and test set-up files.”
File menu
The file menu has different uses depending on the task being carried out and at what
stage of the software is being used. In the main window the file menu has three
functions.
• Select machine: Click on this button to open the initial site window and to
change location without the need to close the program.
7
www.eazival.com
QMF 40
•
•
EaziVal SE Software User Manual Sept 2010 Issue 2
Open report: Click on this button to open reports that have been assembled
and saved for the machine that you have logged onto.
Exit: Click on this button to exit the program.
Set-up menu
Clicking on the Set-up menu reveals a drop down menu. All these features are
explained in greater detail in there relevant chapters later in the manual.
• Create logger set-up: The type of Anville logger being used, type and quantity
of thermocouples and pressure transducers are set up using this button.
• Create test set-up: Types of tests with positions of sensors, chart configuration
and sterilizing bands for the logging are set up here.
• Design custom form: Personalised test sheets can be designed to suit the
machine and cycle being tested.
• User management: New users can be added and the level of use can be set.
• User capabilities: Allows a “supervisor” to change the tasks that can be
performed by an engineer logged on at “user” level.
• Change password: Simply change your password.
• Set machine information for location. Enter all the machine details into the
form. Including Manufacturer, serial number, department identification etc.
• Machine information database: Ideal for machines that might be moved to
different locations and cannot be located easily in the site window.
• Select serial port: You can select the active port on your PC to connect the
data logger to.
• Language: There is a choice of languages in which to use EaziVal SE.
8
www.eazival.com
QMF 40
EaziVal SE Software User Manual Sept 2010 Issue 2
Tools menu
The Tools menu reveals a drop down menu. All of these features are explained in
greater detail in there relevant chapters later in the manual.
• Monitor channels: The sensor readings can be viewed to aid positioning.
• Manage Files: Using this feature will enable you to access all saved files
easily by using the site list or by browsing the type of file. Files can be deleted
here.
• Export .CSV: This is used to export logging data in the CSV format.
Programs such as Microsoft Excel can read this data.
• Generate PDF from report: A PDF file can be made of a saved report and can
then be e-mailed to another pc.
• View event log: The event log is a record of all access to the software and
actions performed by EaziVal SE users that change the configuration of the
software or the files on disk.
The toolbar contains buttons to access the most frequently used operations in
EaziVal SE. The functions are explained further in the relevant chapters.
•
•
•
•
•
•
•
Calibrate: The calibrate button opens the calibration window for calibrating
the sensors.
Verification: The verification button is used to verify the calibration of the
sensors after testing is complete.
New Test: The new test button is used for each test. Test set-ups and
calibration files can be selected for each individual test.
Start, Stop and Save: These buttons become active once the logging facility is
being used.
Paperwork: Tests sheets for report building can be found here.
Viewer: Charts from logged tests can be view and edited here.
Report: Report bundles can be assembled to suit each test type, e.g.: - weekly,
quarterly and yearly.
9
www.eazival.com
QMF 40
EaziVal SE Software User Manual Sept 2010 Issue 2
User management
To add or delete users with access to the program open the user management
window from the set-up drop down menu.
The user management window has three functions: add user, modify user and
delete user.
To add a new user, click on the <Add user> button. This will open the user settings
window where you need to enter the new users name, the length of time the user has
access to the system and whether or not they are to have access at supervisor or user
levels.
Enter the users name.
Tick this box if you
want the new user to
have supervisor
privileges.
•
It is worth remembering that the user name is case sensitive and will only be
recognised when logging onto the system if entered exactly the same as it is
written in the user management.
10
www.eazival.com
QMF 40
EaziVal SE Software User Manual Sept 2010 Issue 2
Clicking on the date box menu button enters the expiry date for the new user. The
calendar will open and you simply select the expiry date by using the directional
buttons and then highlighting the day of that particular month.
Click on the menu button
to open the calendar
Use the directional
buttons to select the
month and year
Highlight the exact
day required.
Once the exact day has been selected that date is inserted into the expiry box. These
details are saved to the user list by clicking on <OK>.
The expiry date and user status of users can be changed at any time by clicking on
the <Modify user> button. The user settings box is then opened and the settings can
be entered in the same way as in “Add user”.
To delete a user highlight the unwanted user and click the <Delete user> button.
That user is then removed from the program and can no longer log on.
User capabilities
In user capabilities it is possible to limit areas in the program that any person that
logs on at “user” level can access. Any person that logs on in “supervisor” mode is
able to edit the user capabilities.
User capabilities are accessed from the set-up drop down menu, highlight and click.
When the user capability box opens you will see a comprehensive list of actions that
can be performed in EaziVal SE. By simply clicking on each one you can either select
or de-select access.
11
www.eazival.com
QMF 40
EaziVal SE Software User Manual Sept 2010 Issue 2
Clicking on each item in
the program selects, or
de-selects user access.
Once the user access has been edited click on the <OK> button to save the settings.
Change password
For security reasons it will be necessary to change each users password from the
default password used to open the program for the first time. The program can be
opened at any time using the default of: - new user and the password of: - password.
The default user can be removed by editing it out in “user management”. The default
password will still apply to all new users.
Select “change password” from the set-up drop down menu.
In the “Change password” box enter the current password, the new password and then
repeat the new password in the “Confirm new password” box. Clicking on <OK>
saves the new password.
12
www.eazival.com
QMF 40
EaziVal SE Software User Manual Sept 2010 Issue 2
Logger set-up
Select “Create logger set-up” from the set-up drop down menu.
Select the logger
you are using
Use the tabs to
select different
ranges of channels.
The logger set-up window will open. First you need to select the logger type that
you are using from the list at the top of the window. Simply clicking on the
corresponding logger does this.
Depending on the test being carried out effects the number of channels, or sensors
being used. Each tab reveals the next eight channels. If however a 16-channel logger
has been selected there will be three tabs showing. Two tabs have the 16 temperature
sensors listed, and the other one with pressure sensors. Check the boxes on all the
channels required.
13
www.eazival.com
QMF 40
Save the current
set-up
EaziVal SE Software User Manual Sept 2010 Issue 2
Close the set-up
window
Previous set- ups
can be loaded.
Once the set-up is complete click on the <Save> button, the set-up is then saved for
future use.
Enter the filename and click on
<OK>
The set-up can be saved using your personal filenames. Once the filename has been
entered click on <OK>. The “save as” window will close. To close the “Set-up”
window simply click on close. If the close button is selected before the set-up has
been saved then a warning will prompt you to either cancel, so you can go back and
save the set-up. Or you can click on <OK> to delete the set-up. The warning will not
appear when closing set-ups that have been loaded from previously saved files as
these are always saved.
To load previously saved set-ups, click on the <Load> button in the set-up window.
14
www.eazival.com
QMF 40
EaziVal SE Software User Manual Sept 2010 Issue 2
Highlight the file name and click
<OK>
A similar window opens as to the “Save as” window titled “Open”. Highlight and
click on the file you wish to load. The file name will be inserted into the filename;
click on <OK> and the set-up will automatically be loaded into the logger set-up.
Create test set-up
A test set-up will have to be assembled for any different tests that are required. The
Set-ups are saved and can be used time and again. Select “Create test set-up” from the
set-up drop down menu.
It is easier to view the “Test set-up” window as five separate sections. In the first
section enter the test name. This can be anything you wish e.g.: - Porous load, Media
cycle or any name you wish to use. All users are able to access the saved test set-ups,
creating uniformity in testing methods.
15
www.eazival.com
QMF 40
EaziVal SE Software User Manual Sept 2010 Issue 2
Enter the test name.
Select the logger set-up for
the test being carried out.
The logger set-up is taken from the file created while setting up the logger
configuration. Click on the button at the end of the “Logger settings” box to open the
logger set-up folder. Highlight the file required from the set-ups saved and click on it.
The file name is then loaded. Click on <OK> to load the set-up into the test set-up.
Highlight the logger set-up
required and click on it.
The file is then loaded into the
filename box.
Once the logger set-up has been selected the “Test channels” section becomes
active. This section allows you to label, colour and position all the sensors being used.
The test channels section will only show channels that were originally entered into the
logger set-up.
16
www.eazival.com
QMF 40
EaziVal SE Software User Manual Sept 2010 Issue 2
Enter the name or position of the first channel.
17
www.eazival.com
QMF 40
EaziVal SE Software User Manual Sept 2010 Issue 2
To select the Colour for the sensor, click on the coloured box. This reveals the list of
colours available. Simply highlight and click on the desired colour. The coloured box
will change to the colour selected.
Select the correct sensor type from the drop down menu, either temperature or
pressure.
Once all details are
entered, click on <Add>
Select either
temperature or
pressure.
After all the details have been entered for each sensor click on the <Add> button.
The next channel number then appears in the channel box, the same procedure is
followed until all channels have been added.
Ignore channel for calculations is so you can stop a channel being included in the
calculations that Eazival SE carries out during logging. For example, the free space
channel may well reach 134° before the other channels. This would have an effect on
the equilibration calculation carried out by the software. Click on the box to ignore
the channel. The data from this channel will still be included in the data file and any
number of channels can be ignored.
To delete a channel, simply highlight it and click the <Remove> button.
18
www.eazival.com
QMF 40
EaziVal SE Software User Manual Sept 2010 Issue 2
Select the type of test you wish to carry out by. Depending on which test type is
selected other parts of the Test set-up window will be greyed out.
Selecting Sterilization will grey out the mid target in the targets section. Selecting
Thermal will grey out the pressure boxes in the Plot set-up. Eazival SE will
automatically select the parts of the software required for the test you are doing.
Mid target greyed out
after sterilization has
been selected
Higher and lower
targets are usually
the sterilizing or
disinfection band.
The Plot set-up section of the test set-up window is centred on the chart
configuration for the logging window. Details entered here will determine the
temperature and pressure axis on the chart.
Temperature Axis maximum and minimum is the range you wish the chart to have.
For example on a porous load test where the temperatures have a wide range from
ambient to around 140°C a range from 0-150°C would provide a well-balanced chart.
Washer disinfectors, where the temperatures being recorded are a lot lower, the chart
would benefit from having a range from 0-100°C. A hot air sterilizer reaches much
19
www.eazival.com
QMF 40
EaziVal SE Software User Manual Sept 2010 Issue 2
higher temperatures, so a maximum axis of 200°C would be required. These settings
are only an example and any setting required can be used.
The same principle applies to the pressure settings (Y2 axis). Where a vacuum is
being measured use a minus symbol. The number of decimal places can also be
selected for the Y2 axis.
The final section of the “create test set-up” window is the “Targets”. Here you are
able to set out the sterilizing band on the chart. The sterilizing band is also very
important for the “cycle information”, i.e.: - the equilibration time etc. Cycle
information is explained later in the logging section of the manual.
The high temperature mark is the top of the sterilizing band with the low
temperature mark being the bottom. I.e.: - on a porous load test the sterilizing band
would be 134 - 137°C.
Once a test set-up has been created it can be saved for use over and over again.
Click on the <Save configuration> button, a save as window opens and the test can be
named and saved.
Monitor channels
It is possible to view the readings from the sensors before the logging stage. This is
ideal for location purposes and also ensures the sensors are not faulty.
Select the <Monitor Channels> button from the “Tools menu”.
20
www.eazival.com
QMF 40
EaziVal SE Software User Manual Sept 2010 Issue 2
The channel monitor window opens. Select either a logger configuration or test
configuration by checking the box required. Click on the locate button and select the
set-up file. The readings from the sensors will appear in the “Measured” column.
•
Note: These readings are not calibrated.
Calibration
Click the <Calibrate> button on the main EaziVal toolbar to open the calibration
window.
The first thing you need to do in the calibration window is to load a logger set-up.
The logger set-up is taken from the list of set-ups already created; clicking on the
button next to the probe set-up box accesses these. Highlight the set-up required and
click on <OK>.
21
www.eazival.com
QMF 40
•
EaziVal SE Software User Manual Sept 2010 Issue 2
All calibrations carried out on a particular logger set-up are stored against that
set-up. This means, as a logger set-up is included in the “Test set-up”, that
when a test set-up is selected in the “New test” window any calibration carried
out can be used. This is explained further in the “new test” chapter later in the
manual.
Once a logger set-up file has been selected a reading will appear in the boxes
relating to channels in the set-up. “Calculating” will appear in the drift (x/min)
column when the window first opens. The software is calculating the rate that the
readings are drifting and after a short time the readings will appear in this column.
Monitor the drift to determine when the readings have stabilized to a level where a
reliable reading can be taken.
•
Note: Pressure transducers respond very quickly so the drift from these
channels can be ignored at the users discretion.
Logger set-up is shown
Once the temperature drift has
settled at the calibration point,
click “Take reading”.
Calibration equipment
With the calibration window open it is possible to open the calibration equipment
window. This is accessed by clicking on the <Options> menu at the top of the
calibration window tool bar.
22
www.eazival.com
QMF 40
EaziVal SE Software User Manual Sept 2010 Issue 2
Simply type in all the details of the data logger, temperature measurement,
temperature source, pressure source and milli-volt source. There is also a space to
enter the calibration details of each piece of equipment, such as date calibrated, the
date it is due for calibration and the calibration certificate number. The details entered
will be printed in the report with the calibration record.
Once all the details have been entered click on <OK>.
Calibrating the sensors
The first thing you need to do when calibrating is to select the sensors you are
going to calibrate first, temperature or pressure. If you have just placed your
temperature sensors in the heat source and you are waiting for them to stabilize then
you can do the pressure transducer while you are waiting. You can also cross over
from temperature calibration to pressure calibration if you are waiting for the
23
www.eazival.com
QMF 40
EaziVal SE Software User Manual Sept 2010 Issue 2
temperature to stabilize in your heat source from, for example from low point to high
point. Do your pressure calibration then return to the temperature sequence.
Pressure calibration
Select the pressure inputs in the calibration window. Move the cursor down the
window and click in the low reference box. All the reference settings in the pressure
section need to be entered in milli-bar.
For a low reference setting 1000mb would be ideal when testing sterlizers. High
reference could be 3000mb and the checkpoint reference would be 2000mb.
Using a pressure-calibrating device set at the low reference point and with that
point selected in the window, click on the <monitor> button. You will see a reading in
the box, which corresponds to the sensor number you, connected your pressure
transducer to. As soon as you are happy with that the reading has settled, which you
can confirm by using the reading in the “drift” column, click on the <Stop monitor>
button. When you do this the <Take reading> button becomes active. Click on the
<take reading> button, after a short wait you will see the low reference box change to
green. Calibration of the low reference is now complete.
The process is now repeated for the high-pressure reference and the pressure
reference checkpoint. Reset the pressure calibrator at each point and wait for the
reading to settle before clicking on <Take reading>.
•
The reading that you see while monitoring the pressure channels is an arbitrary
value, not the actual pressure being measured. The calibration can be
confirmed by switching to “Post calibration” and clicking on <Monitor> after
all three points have been calibrated.
Enter the calibration points and
select the first point to be
calibrated.
24
www.eazival.com
QMF 40
EaziVal SE Software User Manual Sept 2010 Issue 2
Temperature calibration
Temperature calibration is done in precisely the same way as with the pressure
calibration. This time entering in the low reference, high reference and check point
reference. Use three temperatures that are relevant to the test that you are doing.
For example if you are testing a porous load sterilizer the reference points would be
ambient or 50°C for the low point, 140.0°C for the high point and then use the
sterilizing temperature of 134.0°C for your reference. These are guide settings and
can be changed to suit individual requirements. If you are using additional equipment
to corroborate your heat source then you can set the calibration points to suit. These
set points can be altered right up to the moment you click the <Take reading> button.
Choose a set of temperatures to suit the cycle you are testing. Washer disinfectors
with a disinfecting temperature of 80°C, use ambient for a low reference and 90°C for
a high reference. The system is very accurate and the accuracy of your entries in the
reference boxes will be repeated in your calibration.
If you only have one temperature reference you will have to wait for stabilization
between your settings, as with pressure, you can monitor what is happening by using
the “Drift” column. As each reference point settles click on <Take reading>, wait for
the box being calibrated to change to green. When it has that point is calibrated.
•
It is recommended that an external temperature reference is used to
corroborate a heat source and that the reading taken is from the external
temperature reference.
Click the <Take reading>
button, the point being
calibrated will change to
green.
•
If the low and high temperature set points used is too close together then the
software will not be able to calibrate properly. The cycle being tested and the
data to be recorded should determine the settings being used when calibrating.
25
www.eazival.com
QMF 40
•
EaziVal SE Software User Manual Sept 2010 Issue 2
If while calibrating the <Take reading> button is clicked on the wrong setting,
then calibration must be started again to ensure the correct results.
Clicking on the <Post calibration> button, and then clicking on <Monitor> can check
calibration. The reading displayed in the measured column will be the calibrated
reading.
Calibrated readings shown in
measured column
With all set points calibrated, check by
using the <Post calibration> button.
A summary of the calibration that has been carried out will automatically appear
once the <Save calibration> button has been clicked. These readings will be shown in
full when the calibration report is included in the test report. Clicking on <OK> closes
the summary window.
26
www.eazival.com
QMF 40
EaziVal SE Software User Manual Sept 2010 Issue 2
Saving the calibration
The calibration can be saved and then loaded for future use. To save a calibration
set, click on the <Save calibration> button. The calibrations “Save as” window opens
enter the filename for the calibration set into the filename box. Then click on <OK>.
Re-loading calibration sets
Calibration sets can be re-used for a number of reasons and loading and checking
them is very simple. When in the new test window, the calibration file required could
be loaded, more can be found later in the manual under “New Test”.
Verification
The best way to prove an old calibration is still good is in the “verification” mode.
This procedure should also be carried out after thermometric tests to prove calibration
on either side of your test. This is done in the main EaziVal SE window, click on the
<Verification> button.
The verification widow opens. Similarly to calibration you need to select a file to
be verified. This time it is a calibration set and not a logger set-up. Click on the
<filename> button and the file folder opens.
The calibration folder is the same as all the other folders in EaziVal SE simply
highlight and click on the file required.
27
www.eazival.com
QMF 40
EaziVal SE Software User Manual Sept 2010 Issue 2
Once the file has been loaded you can start checking the calibration by entering the
input settings and then clicking on <Monitor>. This is the same procedure as in the
calibration window. As each set point settles click on <Stop monitoring> and then
<Take reading>. The related box will change to green when the reading has been
successfully recorded. The reading that is taken at this point has not been calibrated at
this time. When used in the report builder it will show a direct comparison between
the input temperatures or pressures, and what the test equipment is measuring.
•
•
•
Using the verification mode is a good way of checking the calibration of reloaded calibration files. If all the readings are within the parameters allowed
then you do not need to calibrate again. The original calibration and the new
verification report will show a date and time to prove calibration.
A second verification would need to be carried out after the logging is
complete to prove calibration during the test.
The verification can be saved after any number of set points have been tested
New test
The new test window is where you select the type of test being carried out and a
calibration set to use. The length of the time axis in the logging display and the
settings for automatically stopping the logging can also be adjusted at this point.
Firstly highlight the test required in the “Select test” box. This will be one of the
tests that were set-up in the “create test set-up” earlier in the program. When a test
set-up has been selected all the calibration sets that have been carried out against that
28
www.eazival.com
QMF 40
EaziVal SE Software User Manual Sept 2010 Issue 2
set-up will appear in the “Select calibration” box. Highlight the calibration set
required.
• This is the point where any calibration set can be used. I.e.; - if calibration was
not carried out for this particular test, then any set can be used, then by using
the calibration verification mode the calibration can be proven.
• Calibration files are stored against logger set-ups. Hence the “Logger set-up”
that has been included in the “Test set-up” will produce a list of calibration
files to select from.
Estimated time of test
cycle
Time for automatically
stopping logging
With the test and calibration set highlighted the next section in this window is the
test details.
Firstly enter the cycle number followed by the estimated time of the cycle. This
time must be entered in hours and minutes. The time entered will determine the length
of the time axis of the logging chart. If the cycle runs for longer than the length set for
the time axis then the time interval displayed will automatically advance and logging
will continue uninterrupted. The software will not allow the time axis to be set to
longer than 8 hours 59 minutes, however this does not define the maximum length of
time that logging may continue for.
There is the facility for the logging to be stopped automatically. If this is not
required simply select the <manual stop> button. To automatic stop logging the <Stop
test after (hh:mm)> is selected. The time entered must exceed the estimated cycle time
and be entered in hours and minutes. It is recommended that you manually log off to
prevent the loss of data.
Another feature for stopping the logging automatically is if a particular sensor falls
below a set point. Select the <Stop logging on event> button. From the drop down
menu select the sensor, which is to be monitored. Then in the “Falls below:” box enter
the set point at which you would like the logging stopped. Once that sensor reaches
that point the logging will be stopped.
•
After any of the automatic logging stops has been activated, using the logging
<Start> button can restart logging.
29
www.eazival.com
QMF 40
EaziVal SE Software User Manual Sept 2010 Issue 2
When all details have been entered click on <OK> and the main logging window
will open
The logging window
The layout of the logging window has been determined by settings entered in previous
sections of the program. The temperature and pressure axis were set-up in the “Create
test set-up” and the time axis was set in “New test”. The sterilizing temperature band
is also included.
There are six buttons used in logging. On the main EaziVal SE toolbar there is
“Start, Stop and Save”. In the logging window there is “Cycle information, Show
Diagnostics and Show Legend”.
The first button used is the show legend button. Click on this button to reveal the
logger set-up. It confirms that you have the correct sensor set-up before commencing
logging.
30
www.eazival.com
QMF 40
EaziVal SE Software User Manual Sept 2010 Issue 2
The next button used would be the <Show Diagnostics>. The diagnostics read as
soon as this box is opened.
The pressure diagnostics are viewed by clicking on the <Diagnostics> button when
logging is running. The diagnostics windows can be closed and opened again anytime
during logging.
•
Use the “Show diagnostics” feature when placing thermocouples in their
required positions. Each thermocouple is easily identifiable by its temperature
change.
There is a stopwatch available by clicking on the <Stopwatch> button. The stopwatch
starts automatically when the logging is started.
The only other button that is active at this point is the <Start> button. Once you
click on this button the logging will start. It is therefore important to be ready with all
aspects of the test before proceeding. If <Start> is pressed accidentally then using the
<Stop> button will stop the logging. The trace is then re-set by closing the window
and then starting again from the “New test” section.
Once the <Start> button is clicked and the logging starts the stopwatch at the
bottom of the screen is activated.
31
www.eazival.com
QMF 40
EaziVal SE Software User Manual Sept 2010 Issue 2
The clock time is the real time the logging started and the elapsed time is the length
of time since logging commenced. By starting the logging at the precise time as
starting the machine it will be very easy to separate certain stage times of the cycle
when report building in the viewer section of the program. I.e.: - Negative pulsing,
positive pulsing etc.
The cycle information button becomes active in logging and this box contains a lot
of useful information.
All the information that appears in the “Cycle information” window will be
reproduced in the report when the data listing from the cycle is included.
The “Cycle information” window shows: • The maximum temperature reached during the logging session.
• The time that maximum temperature was reached.
• If the high temperature point was exceeded. I.e. the high point that was entered
in the “test set-up” window.
• All channels mean reading.
• The time the first and last channel attained sterilizing temperature. These are
the points between the low and high temperature band entered into the “Test
set-up” window. I.e.: - the sterilizing band. This feature can also be used on
other machines to determine holding times such as washer disinfectors.
• Equilibration time. The time difference between the first and last channel
entering the sterilizing band.
Note: - It is very important that the correct channel is ignored in the “Test setup” window for this facility to work correctly. E.g. the free space channel on a
porous load cycle needs to be ignored as it reaches the sterilizing band much
sooner than the drain or load channels. If this channel is not ignored the
32
www.eazival.com
QMF 40
•
•
•
EaziVal SE Software User Manual Sept 2010 Issue 2
reading given will been taken from the time the free space went over 134°C
and not when the drain reached 134°C.
The time the first and last channels left the sterilizing band. The time the first
channel leaves the sterilizing band will determine the holding time. Add the
holding time to the equilibration time and the plateau period is reached.
The running Fo calculation.
The minimum and maximum pressures (Y2) reached during the logging
session.
Once logging has been started it will continue until the <Stop> button is clicked or
if the “Auto-log off” facility is activated by the settings entered into the “New test”
window.
When logging has been stopped the <Save> button is activated and the <Start>
button is reactivated. If logging is stopped accidentally it is possible to re-start by
clicking on the start button, although stage times etc will be affected.
33
www.eazival.com
QMF 40
EaziVal SE Software User Manual Sept 2010 Issue 2
To save the data click on the “Save” button. You will be asked for a password. This
is the same password used when logging on to the software.
Entering the password and clicking on <OK> saves and gives the data logged a digital
signature. Clicking on <Skip> will still save the data, but without the digital signature.
The plot can be reset without the need to leave the logging window. This is useful if
the logging has been started accidentally. To reset the plot the logging needs to be
stopped. Click on the <Rest> button. The user will have the choice of either saving
the data or not, a warning window will remind you. Once the plot has been reset
logging can then be started again by clicking the <Start> button.
The trace on the chart can be reset. To do this stop the logging, save the trace as
described, then click on the <Reset> button. The trace can also be reset without
saving if logging was started accidentally.
Viewer
The viewer is where the chart and data can be edited for the report and viewed for
purposes of analysing tests. To open the viewer window click the <Viewer> button on
the main EaziVal SE toolbar.
34
www.eazival.com
QMF 40
EaziVal SE Software User Manual Sept 2010 Issue 2
Click on the <Load data>
button to view the list of tests
carried out.
When the viewer window opens the only button that is active is the <Load data>
button. Click on this button to access all tests that have been carried out and saved for
the machine that you are currently logged onto.
•
If you need to view charts or data from other machines you will need to
“change location” as described the file button section of this manual. It is also
possible to view files through the file manager.
Highlight and click on the test required,
the test will be shown in the filename
box.
From the list of tests carried out select the one required to view by highlighting and
clicking on <OK>.
The title of the test is governed by the title of the test in the “Test set-up” and the
cycle number entered in the “New test”. Each test is dated.
35
www.eazival.com
QMF 40
EaziVal SE Software User Manual Sept 2010 Issue 2
The selected trace will be loaded into the viewer window. Also at this point all the
other buttons in the viewer control will become active.
Working from the top of the viewer control the first button is a drop down menu
with a list of sensors used on the chart being displayed. This drop down menu works
in conjunction with the “Visible” and “Highlight” buttons.
36
www.eazival.com
QMF 40
EaziVal SE Software User Manual Sept 2010 Issue 2
Each sensor can toggled on or off on the chart. If a particular sensor trace is not
required you can remove it from the chart by selecting that sensor in the drop down
menu. To hide sensors uncheck the visible button. When the visible button has been
un-checked that sensor will be removed from the trace. The data that has been
recorded for that sensor will not however be removed from the data list. The trace
with the edited sensors can be saved for printing in a report by using the <Save view>
button which will be explained later in this chapter.
The highlight button enables the user to view a particular sensor easier. When the
highlight button has been checked that trace will pulse making it easier to view in a
group of sensors reading similar temperatures or pressures. Any number of channels
can be highlighted at any one time, simply use the highlight button on each channel
required.
Remove a channel using
the <Visible> check box
Highlight one or more
channels using the highlight
check box.
The highlighted channel will pulse for better
visibility
Entering stages
The next three buttons down the viewer control allow you to add stage lines to the
chart. Each stage through a cycle can be identified such as negative pulsing, positive
pulsing, heat up, sterilizing and drying etc. Whatever the cycle type, the stages can be
customised to suit.
37
www.eazival.com
QMF 40
EaziVal SE Software User Manual Sept 2010 Issue 2
The first button in this facility is the <Add marker>. This allows you to add a
marker at any point you wish to. When you click on the <Add marker> button you
will be asked to enter the name of the stage.
Enter the name required (I.e. Start of sterilizing) and click on <OK>. A data line will
appear on the left of the chart with the stage name attached.
Stage name appears on
the left.
38
www.eazival.com
QMF 40
EaziVal SE Software User Manual Sept 2010 Issue 2
To get the stage data line into the correct position on the chart it needs to be
dragged. This is done by clicking on the stage name and holding down the left or right
hand button on the mouse. With this done drag the data line to the correct position.
The time on the trace is shown next to the data line to enable accurate placing. If the
logging was started at exactly the same time as the cycle on the machine then the
stage lines can be placed very accurately and easily in their correct place. The stage
name can also be moved up and down its axis so as not to interfere with other stage
names.
Delete marker
The delete marker button simply removes any unwanted data lines that have been
placed on the chart. Click on the data line to be removed and then on the <delete
marker> button. The data line will then be removed from the chart.
Auto-mark
The Auto-mark button will place markers at the following points. Time the first
sensor reached the sterilizing band, time the last sensor reached the sterilizing band
and the time the first sensor left the sterilizing band. These positions are taken directly
from the recorded data and will automatically mark out the equilibration and holding
times. When Auto-mark is used to mark these stages they are not adjustable. Only the
position of the stage name along its axis is adjustable so as not to interfere with other
stage names.
39
www.eazival.com
QMF 40
EaziVal SE Software User Manual Sept 2010 Issue 2
Equilibration time, start of
sterilizing and the holding time
automatically entered onto the
chart.
Data lines that have been inserted using the auto-mark can be deleted in the normal
way using the delete marker button.
Show data list
Click on the <Show data list> button to view the complete data stored from the
viewed test. The data listing is displayed at 1-second intervals.
Entering stages into the data list
Stages can be inserted using the data list. The stages will be placed onto the chart in
the exact position selected on the data list. Decide exactly where the stage starts and
highlight the row on the data list. Click on the <Add stage here> button and the “enter
stage name” box opens. Enter the stage name and click on <OK>. The data line and
stage name will appear on the chart.
40
www.eazival.com
QMF 40
EaziVal SE Software User Manual Sept 2010 Issue 2
Data list options
Data list options allows you to adjust how much data is listed in your report. It is
possible to show the data listed every 1-second or every 60 seconds; it is up to the
user. This is very useful when testing long cycles and a report is being printed. A
report of a long cycle containing data recorded every second can be very bulky when
printed so reducing the frequency of the data is a great advantage.
For example the negative pulsing could be changed from every second to every 20
seconds. The positive pulsing stage the same, but when the data needs to be more
detailed during the sterilizing stage, the data could be displayed every 10 seconds.
The times and frequency are under the users control.
When included in a saved report the data listing will appear in the new format in
the report. However the data listing originally recorded while logging will not be
affected and can always be referred to.
After entering all the data lines required to the chart click on the <Data list options>
button to open data list set up window.
In the stage box you will see the first stage as entered onto the chart. The name of
the stage will correspond to that which was given when entering the data line stages to
the chart. Enter the stage name, as you would like it to appear in the data listing.
The display interval is the frequency that you wish the data to be listed. The default
interval is every 1-second. If a long cycle has been logged, and the data listing was to
be included in the report without changing the interval settings, the report could
become very large. Stages of a cycle, such as air removal and drying may not have to
show the data as frequently as the sterilizing time. The interval time is set in minutes
and seconds and can be edited for each stage. Edit each stage by highlighting it in the
drop down menu. When the display interval has been set for all the stages click on
<OK>.
The edited data listing is saved by storing the view. This is explained in the “Saving
a view” section in this manual.
41
www.eazival.com
QMF 40
EaziVal SE Software User Manual Sept 2010 Issue 2
Show cursor
All channels viewed at the
same time using the
channel values widow.
The cursor allows you to follow any of the data traces to accurately see a reading at
any given point. Clicking on the <Show cursor> button opens the channel values
window and also places the red cursor onto the chart. The channels values window
allows you to easily follow the readings on the chart as you follow the trace using the
cursor.
Single channel
values viewed
The cursor appears on the chart as a single vertical red line on the chart. There are two
methods of moving it along the trace. It is possible to move the cursor using the
mouse click and drag method. Simply left click and hold down the mouse on the
cursor line and drag it to the position required. The second way of moving the cursor
is to use the arrow keys on the keyboard.
42
www.eazival.com
QMF 40
EaziVal SE Software User Manual Sept 2010 Issue 2
Change channel
viewed up
Move cursor left
Move cursor right
Change channel
viewed down
When the cursor has been selected the reading from one of the channels will be shown
in the bottom left hand corner of the viewer screen. As the cursor is moved along that
channel the time and value will change. It is possible to view each of the channels in
this way. To change the channel that is shown simply use the up and down arrow keys
on your keyboard. The channel will be shown using the name and colour given to that
channel in the “Test set-up” section.
To follow the path of the channel with the cursor using the arrow keys on the
keyboard simply press either the right or left directional keys.
Zoom facility
Click on the <Show zoom box> button to place the zoom box onto the chart. The
zoom box can be moved to any part of the chart using the arrows keys on the
keyboard in the same way as with the cursor in the cursor section.
To zoom in on any area, simply place the zoom box over that area and press the return
button on the keyboard.
43
www.eazival.com
QMF 40
EaziVal SE Software User Manual Sept 2010 Issue 2
Continue to click the <Show zoom box> and that area of the chart can be zoomed in
to see in great detail how the cycle has performed. To zoom out, simply click the
<Full zoom out> button. The zoomed in area can be saved and printed in the report by
storing the view.
Saving views
Many changes can be made to charts and any number of views of a particular chart
can be saved without interfering with the default chart. E.g.: - for a report the default
chart may be required along with a chart with all the stages indicated and a zoomed
chart to show the holding time. All three views would be stored under the heading of
the default view using the <Store view> button.
After clicking the <Store view> button enter the name you would like to store the
view under. Then click on <OK>.
44
www.eazival.com
QMF 40
EaziVal SE Software User Manual Sept 2010 Issue 2
The view will then be stored in the drop down menu located the bottom of the
“viewer control” toolbar. To view a saved chart at future dates, select the default view
and then select the required view from the drop down menu.
•
When closing the viewer window, you will be asked, “save changes to this
data”? <Yes> must be clicked. If <No> is clicked then any changes made to
views will not be saved.
Print a view
By clicking on the <Print> button in the viewer, a view can be printed off
independently of any other paperwork.
Paperwork
Incorporated in EaziVal SE is a selection of test sheets that can be used when
carrying out the weekly, quarterly or yearly tests on porous load and bench top
sterilizers. The sheets are also included to carry testing on washer disinfectors.
EaziVal SE has three methods to work with additional paperwork required for
reporting. If you are able to you should use the built in paperwork as this offers a
higher degree of integration with other parts of the program. For longer text based
documents EaziVal SE is able to import documents in the RTF format. To include
shorter forms based on tables it is recommended that you use the custom form design
functions of EaziVal SE.
•
The test sheets contained in the program can be completed and saved while the
logging process is running.
45
www.eazival.com
QMF 40
EaziVal SE Software User Manual Sept 2010 Issue 2
EaziVal SE test sheets
To access the test sheets contained in the program click the <Paperwork> button.
Click on the headings to
reveal the list of test sheets.
The paperwork window opens showing a list of test sheets. The initial list shown
contains the default sheets contained in the program; any test sheets manufactured in
the design section will be added to the list.
•
Completing test sheets in the paperwork section can be done before, during
and after logging.
•
General paperwork
The general paperwork list contains sheets that are applicable to tests on all types of
machines. All the sheets are completed and saved in the same way. To open a sheet,
tick the checkbox and click <OK>.
46
www.eazival.com
QMF 40
EaziVal SE Software User Manual Sept 2010 Issue 2
Enter the details required into the relevant boxes. When all details are entered, click
on <OK>.
Enter the name of the test sheet into
the filename box.
The “Save as” window opens and to save the sheet you need to enter the filename
and click the <OK> button. The sheet can then be used in the report building section.
You can also recall the sheet to view it at anytime in the manage files section.
Report title and footers
The report title and footers for the report pages are prepared in the paperwork
section. In the “general paperwork” tree you will find the heading for “Report Title”
and “Report Footer”. To open each one in turn, check the box and click on <OK>.
Enter the title of the report
and check the boxes to
include the details required.
The details entered into the two title boxes are completely down to the user. The
information included from the list of check boxes would have been entered earlier in
the program.
Included in any report title can be a company logo. The image should be saved in
bitmap (BMP) format. Any logo’s that you wish to use need to be entered into the
main EaziVal SE data folder. This is found at: My Documents/EaziValSE/Data/Images. Once this has been done it can be included
in the header or footer by clicking on the button in the logo box and selecting it.
47
www.eazival.com
QMF 40
EaziVal SE Software User Manual Sept 2010 Issue 2
A list of all logo’s included in the image folder will be shown and you simply
highlight the image required so it appears in the filename box and click on <OK>.
The filename will appear in the logo box. When all the editing of the report title or
footer window is complete click on <OK> and the “Save as” window opens.
Simply enter the filename that you wish to give the report title or footer. Click on
<OK> and the set-up is saved. How to use the header and footers in your report is
explained in the report building section of this manual.
48
www.eazival.com
QMF 40
EaziVal SE Software User Manual Sept 2010 Issue 2
The footer window is slightly different to the report title in what is included. The
difference being that two customized comments, company names etc can be added.
Simply enter the company name etc into the custom box and check the box. The setup is saved in the same way as the report title. Page numbers will appear as page 1 of
etc. Save the set-up in the same way as with the report title.
•
The report title will appear on the front of the report. The footers will appear
on all pages.
Design custom form
The Design custom form facility allows you to create your own test sheets to suit
the type of machine and cycle being tested. Click on the <Design custom form>
button, this is found in the “Set-up” drop down menu.
Highlight a cell.
Enter the details for a
cell here.
In the “Custom form design” window there is a default number of cells, three
horizontal rows and four vertical rows columns.
To enter a title into a cell e.g.: - Neg pulsing, sterilizing etc, highlight the cell and
then enter the title into the “Cell:” box. As the title is entered it will appear in the
highlighted cell. Leave a cell blank if there are details to be entered during a test. To
change what is written in a cell, highlight it and then edit it in the “Cell:” box.
49
www.eazival.com
QMF 40
EaziVal SE Software User Manual Sept 2010 Issue 2
The “Test category” is the folder in the paperwork window where the custom-made
test sheet will appear. If you wish to place it in one of the folders that already exist
then type the name of that folder in the box. I.e.: - Porous load or washer disinfector.
If a new category name is typed then a new folder will appear in the paperwork
window.
The “Test name” box is the title you wish to give the custom sheet i.e.: - automatic
process control test etc.
To add extra columns to the custom sheet click on the <Add column> button, a
column will be added on to the end column. To remove columns, click on the
<Remove column> button. Adding rows is done in the same way by clicking on the
<Add row> button, a row will be added under the bottom row. To delete a row, click
on the <Remove row> button.
New rows and
columns added.
50
www.eazival.com
QMF 40
EaziVal SE Software User Manual Sept 2010 Issue 2
Check the Fixed box to
lock the cells.
To lock the cells so that they cannot be edited in the paperwork section check the
“Fixed” box. Only the empty cells will be able to have data entered into them.
Once all the details have been loaded into the design it can be permanently saved.
Click on the <Save design> button, enter a title into the filename box and click
<OK>.
51
www.eazival.com
QMF 40
EaziVal SE Software User Manual Sept 2010 Issue 2
Previous custom sheet designs can be loaded into a new design and then edited. This
is useful if the new custom design is very similar to a design previous loaded and
saved. Click on the <load design> button and the custom designs file window will
open. Simply highlight the design required, and click on the <OK> button. The design
will automatically be loaded into the new sheet.
The test name given to the
form will identify it in the
paperwork window
To open the custom test sheet, click on the <Paperwork> button.
The custom sheets will either be
in a new folder or one of the
original, depending where they
where placed.
Check the box for the new
sheet and click the <OK>
button.
Check the box next to the custom made sheet and click on the <OK> button. The
sheet will then open and can be completed, and saved in the same way as the other
sheets in the program. The custom design sheets can also be used in building reports.
52
www.eazival.com
QMF 40
EaziVal SE Software User Manual Sept 2010 Issue 2
Report building
EaziVal SE has the ability to build a complete report for weekly, quarterly and
yearly tests to meet the requirements of HTM’s 2010, 2030 and HTM 01.
Click on the <Report> button on the main toolbar.
The report builder window is made up of three main sections.
• File information: Who created the file, when it was created and the cycle
number are shown here. This helps to identify the correct file as it is loaded
into a report.
• Report contents: The thermometric data, calibration data, paperwork and
miscellaneous files are listed.
• Report options: The headers and footers can be included in the report by
checking the boxes.
Most of the report building is carried out in the “Report contents” section.
53
www.eazival.com
QMF 40
EaziVal SE Software User Manual Sept 2010 Issue 2
Select the thermometric data that is required for the report. Any number of data sets
can be included in a report.
•
The settings in the “Data list options” in the viewer section regarding the
frequency that the data is displayed will have an effect on the size of the
report.
With the thermometric data selected the “file information” section will automatically
be completed.
Each set of thermometric data will consist of the original plot logged, listed as the
default plot, and any additional plot views, which have been edited, and saved, in the
viewer section. I.e.: - zoomed views. The original data listing, which is listed as the
default, and data listings for each saved views, which would include data listings,
which have been edited to include stages etc.
The cycle selected for the report
The saved views listed under the
plot heading
54
www.eazival.com
QMF 40
EaziVal SE Software User Manual Sept 2010 Issue 2
There is a data listing for
every saved view.
There is a data listing for every saved plot and a plot for every saved data listing. This
means if a zoomed view has been saved it will be listed under the plot heading.
Automatically another data listing will be saved with it. This will appear under the
data-listing heading. The same will happen if a data listing has been edited to include
stages, when it is saved the plot is saved as well.
The plot and the data listing used in a report do not have to be from the same view.
To include any piece of information in a report i.e. – plot, data listing, paperwork
etc, there are two ways of doing it. The information can be dragged or the information
can be moved using the arrow buttons in the report builder.
Dragging the information is simply done by clicking on the information required
and holding down the left hand mouse button, a hand will appear, move the hand over
to the report window and release the mouse button.
The default data listing in the
example has moved to the report
window from the contents
window.
The information will appear in the report window, it will no longer be in the contents
window. The procedure is the same for all pieces of information that you wish to
include in the report. Information can be removed from the report by dragging in the
opposite direction back to the contents window.
The alternative way of transferring the information into a report is to highlight it
and then click on the directional button. To remove information from the report,
highlight it and click on the directional arrow to send it back to the contents window.
55
www.eazival.com
QMF 40
EaziVal SE Software User Manual Sept 2010 Issue 2
Information can be loaded into the report in any order, as there is the facility to
move items up or down so that they are placed from the front to the back of the report
in the order required.
To move an item up or down in the list simply highlight it and click on the <Move
up> button or <Move down> button.
This is particularly useful when including page breaks. Page breaks can be used to
provide a blank page in a report so that machine printouts can be included for
example. Any number of page breaks could be placed in a report and then placed
where required. A page break can also be used before a test sheet if the sheet is split
between two pages and would be better complete on a single page.
•
Page breaks can be found in the miscellaneous folder and are useful for
including blank pages in a report.
Once the contents of a report have been assembled the next section in the report
builder is the report options, which refers to the report title and footers. Click on the
button at the end of either the report title or the footer filename box. The report title or
footer saved files window will open, click on the file required to highlight it, and then
on the <OK> button. The file name will appear in the filename box.
Check the <Enabled> checkbox for the header and footer to be included in the report.
The report title will appear on the front page of the report only; the footers will appear
on all pages.
Previewing the report
The report can be previewed before saving so that adjustments can be made if
necessary.
56
www.eazival.com
QMF 40
EaziVal SE Software User Manual Sept 2010 Issue 2
Click on the <Build report> button and the VPE viewer will open.
Using the VPE Viewer the report can be previewed to enable you to check that the
layouts of all the pages are, as you would like them. If the layouts of pages need to be
changed, close the VPE viewer and edit the report again in the report builder. When
the changes have been made open the edited report by using the <Build report>
button.
Zoom the view in or
out
Toggle through the pages of
the report
When you are happy with the layout of the report close the VPE viewer, return to the
report builder and save the report. Simply click on the <Save> button. A “Save as”
window opens, name the report, i.e. Sdu AC 1 Quarterly and then click on <OK>.
57
www.eazival.com
QMF 40
EaziVal SE Software User Manual Sept 2010 Issue 2
Reports can be opened easily from the main EaziVal SE toolbar.
From the “file” drop down menu, select the <Open report> button. The report folder
will open and simply select the required report and click on <OK>. The VPE viewer
will open displaying the selected report.
Generating PDF’s from reports
Reports can be converted easily into PDF files and sent via e-mail. When a report is
sent via e-mail is this form the recipient does not need to have EaziVal SE software
on their PC. Adobe Reader or another PDF viewer is all that is required to open and
read the report.
Every part of the report that is assembled in EaziVal SE can be converted to PDF.
Click on the <Generating PDF from report> button found in the “Tools” drop down
menu.
The reports folder opens showing a list of saved reports. Click on the report to be
converted so that it appears in the filename box. Click on <OK>.
58
www.eazival.com
QMF 40
EaziVal SE Software User Manual Sept 2010 Issue 2
The windows “Save as” window opens and you can save the PDF file. From the
windows drop down menu click on the destination required. I.e.: - My documents.
When the destination folder has been selected enter the title of the report into the
filename box and click on <Save>. The report will be converted and then saved to the
selected destination.
The PDF file will appear as shown and can be sent via e-mail to any PC. To open the
PDF files Adobe Acrobat Reader is required.
59
www.eazival.com
QMF 40
EaziVal SE Software User Manual Sept 2010 Issue 2
Manage files
Manage files is a way of viewing all the files that have been created using EaziVal
SE. Click on the <manage files> button found in the “tools” drop down menu.
The files can be browsed by Site. Select a machine and all the files related to that
machine can be viewed. These files are divided up into three sections.
• Thermometric data, charts and data listings.
• Reports, the complete reports assembled for the machine.
• Paperwork. All the paperwork that has been completed, and saved for the
machine selected.
To view the files of a particular type highlight the appropriate heading.
60
www.eazival.com
QMF 40
EaziVal SE Software User Manual Sept 2010 Issue 2
There are some useful functions accessible by right clicking on the mouse in the file
manager. Files can be deleted, copied, pasted, re-named, Export CSV and when the
report list is showing, generate PDF’s.
A complete list of files will be displayed, by clicking on a file the VPE viewer will
open and the file can be viewed. This can be done on all files with the exception of
the set-up files, which are not viewable.
Browsing by Type allows you to view all files of the same type from all the
machines on EaziVal SE. Simply check the box for the file type you wish to view.
Double click on a file to open it.
The set-up files differ slightly from the other files in that they cannot be viewed.
The set-up files contain the logger and test set-ups. These are global and the list will
be the same no matter what machine location has been selected.
Files can be deleted in this window; this is useful if a set-up file is no longer used.
Click on the file to be deleted and when it is highlighted delete it using the delete
button on the keyboard.
61
www.eazival.com
QMF 40
EaziVal SE Software User Manual Sept 2010 Issue 2
Export CSV
Data logging files can be exported in CSV format and applications such as
Microsoft Excel can read them.
Click on <Export.CSV> from the “Tools” drop down menu. The data file
connected to the current machine that you are logged onto opens. From the list of data
select the required file.
The main “windows save as” window opens and you can decide on a destination
for the CSV file.
Once you have decided on a destination, name the file and click on <OK>. The
“save as” window closes and the CSV file has been exported to it’s chosen
destination.
The CSV files appear as shown and double click to open it. The file opens in
Microsoft Excel.
62
www.eazival.com
QMF 40
EaziVal SE Software User Manual Sept 2010 Issue 2
The data appears as in the example and all the features of Microsoft Excel can be used
on the data list.
Saving the files in a different location
All the files in Eazival SE can be copied to another location on your PC. For
example if you wish to ensure the safety of the data that has been recorded so it is not
lost should a fault occur on your PC. Most of the Eazival SE files can be copied by
simply locating the files in the Eazival 2 data in My Documents. Right click on the
files required and select copy. All that needs to be done then is to decide where you
wish to store the files; this could be on the C drive. This is found in My Computer,
then select the C drive. Right clicking the mouse and clicking on <Paste> will then
place a copy of the file in the C drive.
63
www.eazival.com
QMF 40
EaziVal SE Software User Manual Sept 2010 Issue 2
Appendix 1
USB-RS232 converter cable connection details
Follow the instructions that come with the converter or follow the installation
instructions below.
Installation instructions
Before plugging the cable into your PC please insert the cable's CD into your PCs
CD ROM drive. A menu window will open showing a list of installation guides for
different versions of Windows. Follow the guide for Windows 2000 or XP as
appropriate for your system.
Following the instructions in the installation guide, plug the USB cable into one of
the USB ports on your PC. Follow the on screen instructions while installation takes
place.
Identifying COM port number
It is necessary to know the serial port number to run EaziVal SE on your PC.
Windows will allocate this number during installation of the converter driver.
Click on <Start> on your PC and then on <Control panel>.
Double click on the System icon
Double click on the System icon to open the System properties window. Click on
the Hardware tab and then the <Device manager> button.
64
www.eazival.com
QMF 40
EaziVal SE Software User Manual Sept 2010 Issue 2
Click on the Hardware
tab, then on the <Device
manager> button
Locate the entry “Ports (COM & LPT)” from the list shown. Click the + sign which
will show a list of ports installed in your system. Note the number for the USB serial
port.
USB serial port
•
•
Note: Occasionally when the USB cable is plugged into a different USB port,
Windows may allocate a different COM port. This will be apparent if EaziVal
SE cannot communicate with the logger and a communication error message
is displayed. To find the ‘new’ serial port number repeat the identification
procedures described above or follow the next procedure.
From the “Set-up” drop down menu in the main Eazival window click on
“Select Serial Port”.
65
www.eazival.com
QMF 40
EaziVal SE Software User Manual Sept 2010 Issue 2
•
Click on “Logger 1”. The “Active Serial Port” window will open and show
which Serial port “Windows” has selected.
•
If the 825 data logger is not communicating try changing the serial port
selected by clicking on the drop down menu. Select another port number and
click <OK>.
66
www.eazival.com
QMF 40
EaziVal SE Software User Manual Sept 2010 Issue 2
Appendix 2
Importing photographic images
Photograph files in j.peg format can be imported into reports. This is particularly
useful when carrying out a residual soil test on a washer disinfector for example.
Select the j.peg you wish to import from the picture file on your PC. These are
usually found in My documents/my pictures.
<Right click> on the image required, select copy from the menu. The image now
has to be placed in the eazival2 data folder. In My documents, select eazival 2 data.
Then open the images folder.
Open the data folder, then
the images folder
The images folder is the same as the pictures file opened earlier, with your curser
along the line of images already in the folder <right click> and select paste. The
image will then appear in the folder and will be available in the general paperwork
section within eazival2 itself.
67
www.eazival.com
QMF 40
EaziVal SE Software User Manual Sept 2010 Issue 2
Select paperwork from the main toolbar, the paperwork window will open, click on
<General paperwork>. You will see in the drop down menu, image. Select image and
click on <OK>.
Filename button
Select the image required by clicking on the filename button.
Highlight the image required and click on <OK>.
68
www.eazival.com
QMF 40
EaziVal SE Software User Manual Sept 2010 Issue 2
The image will appear in the “filename box”. You are able to give the image a title;
this will appear above it in the report. Simply enter the details into the title box. The
same can be done for a caption, which will appear below the image in the report. Then
click on <OK>.
The “Save as” window will open, enter the details for the picture in the “filename”
box and click on <OK>. The image with its title and caption are saved and will appear
in the paperwork menu when building your report.
To include the image in the report you simply double click on the one required,
highlight it and use the directional arrows or you can highlight and drag it.
69
www.eazival.com
QMF 40
EaziVal SE Software User Manual Sept 2010 Issue 2
The image title and caption automatically appear in the report. Any editing to the
image itself must be carried out before the image is imported into the eazival2 data
folder.
70
www.eazival.com
QMF 40
EaziVal SE Software User Manual Sept 2010 Issue 2
Appendix 3
Fo Calculations
The following is an attempt to simplify the Fo calculation concept.
Up to a few years ago it was thought that steam sterilization was an all or nothing
process. This would mean that once a certain temperature is reached and maintained
for a certain time span, all the micro organisms contained with in a unit (container,
bottle, etc) would die within that time, (lethality rate) regardless of their number.
It has been shown however that stem sterilization is like a chemical reaction, the
higher the temperature, faster the kill rate. It will depend on the items, fluids being
sterilized to what temperature are used, and the length of time required in eliminating
the micro organisms contained within a unit.
This rate can be expressed by means of the decay time, symbol D. D is the time in
minutes required to reduce the number of micro organisms present by one tenth.
D varies according to the kind of micro organisms, the medium in which they are
contained and the sterilization temperature.
At a sterilizing temperature of 121°C, D is compromised between 0.5 and 2
minutes so we will work on an average that D = 1 minute. This means that at the end
of each minute at a constant 121°C the number of micro organisms will be reduced to
one tenth of the total at the beginning of that minute.
Therefore, if the unit being sterilized was kept at 121°C for 3 minutes the number
of micro organisms will be reduced to one thousandth of the original total.
I.e. 1/10 x 1/10 x 1/10 = 1/1000.
So if you started with an average of 1000 micro organisms in a unit, you would
now have just 1. Sterilize for another minute at 121°C and this would go down to 0.1
and so on.
After 9 minutes of sterilization the bacterial load is reduced on average to
1/1,000,000. (10-6).
F0 is defined as: - the time that sterilization is performed at 121°C, or the time in at
another temperature, related by calculation to 121°C so as to be equivalent in lethal
heat dose.
Note: - the exact temperature of F0 is 121.11°C (250°F).
A temperature fluctuation of 10°C will create a ten-fold variation in the sterilization
rate.
D-value = time in minutes at a specific temperature to reduce the surviving microbial
population by 90%. D value is the time to kill an organism at a certain temperature.
Z-value = the temperature in degrees that are required for an organism to move one
log cycle on the thermal destruction curve.
F – value = the number of minutes to kill a specified number of organisms with a
specified Z value at a specific temperature.
71
www.eazival.com
QMF 40
EaziVal SE Software User Manual Sept 2010 Issue 2
Fo- value = the number of minutes to kill a specified number of micro organisms with
a Z value of 10°C at a temperature of 121.1°C.
1 Fo = the equivalent of 1 minute at 121°C.
Eazival SE will automatically do the calculations in the cycle information window.
A report can be produced in the general paperwork window.
A0 calculations in disinfection
Ao calculations are carried out in much the same way as the Fo. A0 values are used
in disinfection as opposed to sterilization.
1 minute at 80°C gives an Ao value of 60.
10 minutes at 80°C gives an Ao value of 600.
As with the Fo values an increase in temperature will decrease the amount of time
required to achieve these results.
1 minute at 90° will give an Ao value of 600; the same result would be achieved in
30 seconds at 93°C.
Where a higher Ao value of 3000 is required the time required goes up
considerably at lower temperatures. 50 minutes is required at 80°C, only 5 minutes
though at 90°C.
72
www.eazival.com
QMF 40
EaziVal SE Software User Manual Sept 2010 Issue 2
Index
Getting started
Software installation
Password
Site window and machine selection
Deleting unwanted sites and machines
The main Eazival SE window
File menu
Set-up menu
Tools menu
User management
User capabilities
Change password
Logger set-up
Create test set-up
Monitor channels
Calibration
Calibration equipment
Calibrating the sensors
Pressure calibration
Temperature calibration
Saving the calibration
Re-loading calibration sets
Verification
New test
The logging window
Viewer
Entering stages
Delete marker
Auto-mark
Show data list
Entering stages into the data list
Data list options
Show cursor
Zoom facility
Saving views
Print a view
Paperwork
Eazival SE test sheets
General paperwork
Report title and footers
Design custom form
Report building
Previewing the report
Generating PDF’s from reports
Manage files
Export CSV
Appendix 1
USB-RS232 Converter Cable Connection Details
www.eazival.com
3
3
4
5
6
7
7
8
9
10
11
12
13
16
20
21
22
23
23
24
26
27
27
28
30
34
37
39
39
40
40
40
41
44
44
45
45
46
47
47
49
53
56
58
60
62
64
64
73
QMF 40
EaziVal SE Software User Manual Sept 2010 Issue 2
Identifying COM port number
64
Appendix 2
Importing photographic images
67
Appendix 3
Fo calculations
Ao calculations
71
72
74
www.eazival.com