1
SOFTmax® PRO for Lmax
User’s Manual
Version 1.0L Software
for Macintosh® and Windows® Operating Systems
Molecular Devices Corporation
Sunnyvale, California 94089
Part # 0012-0074
Rev. A
Molecular Devices Corporation
SOFTmax® PRO for Lmax User’s Manual
Copyright
© Copyright 2000, Molecular Devices Corporation. All rights reserved. No part of this publication may be
reproduced, transmitted, transcribed, stored in a retrieval system, or translated into any language or
computer language, in any form or by any means, electronic, mechanical, magnetic, optical, chemical,
manual, or otherwise, without the prior written permission of Molecular Devices Corporation.
Trademarks
SOFTmax is a registered trademark and Lmax and MAXline are trademarks of Molecular Devices
Corporation.
All other trademarks or registered trademarks are the property of their respective owners.
Lmax is one of Molecular Devices’ MAXline Microplate Readers.
Disclaimer
Molecular Devices Corporation reserves the right to change its products and services at any time to
incorporate technological developments. This manual is subject to change without notice.
Although this manual has been prepared with every precaution to ensure accuracy, Molecular Devices
Corporation assumes no liability for any errors or omissions, nor for any damages resulting from the
application or use of this information. This manual does not represent a commitment on the part of
Molecular Devices Corporation. The software described in this document is furnished under a license
agreement or nondisclosure agreement. The software may be used or copied only in accordance with the
terms of the agreement. It is against the law to copy the software on any medium except as specifically
allowed in the license or nondisclosure agreement.
ii
SOFTmax PRO for Lmax User’s Manual
SOFTmax PRO for Lmax Software License Agreement and Warranty
Important: The right to use this Molecular Devices Corporation (“MDC”) software is sold only on the condition that
the user agrees to the terms of this license agreement. If you do not agree to the terms of this license, you may return
the unopened package to MDC or its authorized agent for a full refund. However, opening the package indicates your
acceptance of these terms and conditions.
License Agreement
In consideration of payment of the license fee, which is part of the purchase price you paid for this product,
Molecular Devices Corporation (“MDC”), the licensor, hereby grants a non-exclusive license to you the Licensee (“User”), to use SOFTmax PRO for Lmax and its utilities (“Software”) included with SOFTmax PRO
for Lmax upon license. The user is licensed to copy the software for a backup or archival copy as necessary.
Simultaneous use of the software with more than one MAXline Microplate Reader per license is expressly
prohibited. Simultaneous use of the software on four(4) additional computers solely for the purpose of analyzing already acquired data is expressly permitted. The user is expressly prohibited from using the software to control any other instrument, computing hardware, or peripherals other than MDC’s MAXline
Microplate Readers.
This license agreement does not grant the user title to the software, or any copyrights of proprietary rights
in the software. The user may not sublicense, rent, lease, modify, translate, decompile, or disassemble the
software for any purpose. The user, however, does own the media on which the software is originally or
subsequently recorded or fixed. MDC retains title and ownership of the software recorded on the original
disc and all subsequent copies of the software, regardless of the form or media in or on which the original
and other copies may exist. This license is not a sale of the original software or any copy.
Limited Warranty
MDC warrants that the disc on which the program is furnished is free of defects in materials and workmanship and will operate under normal use for a period of 90 days from the date of delivery. Except as provided
above, the Software is provided “as is” without additional warranties of any kind, either express or implied,
including, but not limited to, any implied warranty of merchantability or fitness for a particular purpose.
The entire risk as to the quality and performance of the Software is the User’s. MDC does not warrant that
the functions contained in the Software will meet the User’s requirements nor that the operation of the program will be uninterrupted or error free. Some states do not allow the exclusion of implied warranties and,
therefore, the above exclusion may not apply to you.
Limitation of Remedies
MDC’s entire liability and the User’s only remedy with respect to the Limited Warranty set forth above is:
1) The replacement of any discs not meeting the Limited Warranty set forth above, provided such discs are
returned to MDC with evidence of date of purchase; or
2) If MDC is unable to delivery ar replacement disc which is free of defects in materials and workmanship,
the user may terminate this license agreement upon return of all materials including manual and disc(s) to
MDC for a full refund of purchase price.
In no event will MDC be liable to the User for any damages, including any lost profits, lost savings, or other
incidental or consequential damages arising out of the use or inability to use the software even if MDC has
been advised of the possibility of such damages, or for any claim by another party. Some states do not allow
the limitation or exclusion of liability for incidental or consequential damages so the above limitations or
exclusions may not apply to you.
Duration and Termination
The License is effective from the date of the first use of the Software by the User until terminated or until
the expiration of fifty years, whichever occurs first. The User may terminate the License by returning to
MDC all Software documentation, the original Software, all backup and archival copies of the Software, and
all demonstration copies of the Software. The License agreement will terminate automatically without notice from MDC if the User fails to comply with any provision of this License Agreement. It is incumbent
upon the User to take all reasonable measures to effect termination only in accordance with this License
Agreement.
SOFTmax PRO for Lmax User’s Manual
iii
General
1) This License Agreement shall be governed by the laws of the State of California.
2) The provisions of this License Agreement are severable and if any one or more of such provisions are
judicially determined to be illegal or otherwise unenforceable, whether in whole or in part, those remaining
provisions or portions of the License Agreement unaffected by such determination shall be binding on and
enforceable by and between the User and MDC.
3) In the event it becomes necessary to retain the services of an attorney to enforce any provisions of this
License Agreement, the non-prevailing party to such legal action an/or litigation agrees to pay the prevailing party’s costs, including reasonable attorney’s fees and court costs, if any.
4) The User acknowledges that by opening the media package the User has read this License Agreement,
understands it, and agrees to be bound by its terms and conditions. The User further agrees that this License
Agreement constitutes the full and complete agreement between the user and MDC with respect to the Software and License, which agreement supersedes any proposal or prior agreement, whether oral or written,
and any other communication between the User and MDC relating to this License Agreement.
Trademark Information
SOFTmax is a registered trademark of MDC and MAXline is a trademark of MDC; these are not to be used
in any type of promotion or advertising without written permission from MDC.
iv
SOFTmax PRO for Lmax User’s Manual
Contents
Contents . . . . . . . . . . . . . . . . . . . . . . . . . . . . . . . . . . . . . . . . . . . . . . . . . . . . . . . . . . . . . . . . v
Figures . . . . . . . . . . . . . . . . . . . . . . . . . . . . . . . . . . . . . . . . . . . . . . . . . . . . . . . . . . . . . . . . . ix
Tables . . . . . . . . . . . . . . . . . . . . . . . . . . . . . . . . . . . . . . . . . . . . . . . . . . . . . . . . . . . . . . . . . . ix
Chapter 1: Welcome to SOFTmax PRO for Lmax . . . . . . . . . . . . . . . . . . . . . . . . . . . . . . . .1-1
Introduction . . . . . . . . . . . . . . . . . . . . . . . . . . . . . . . . . . . . . . . . . . . . . . . . . . . . . . . . . . . 1-3
About the Documentation . . . . . . . . . . . . . . . . . . . . . . . . . . . . . . . . . . . . . . . . . . . . . . . 1-4
Conventions Used in This Manual. . . . . . . . . . . . . . . . . . . . . . . . . . . . . . . . . . . 1-5
Getting Help . . . . . . . . . . . . . . . . . . . . . . . . . . . . . . . . . . . . . . . . . . . . . . . . . . . . . . . . . . . 1-7
Macintosh On-Line Help . . . . . . . . . . . . . . . . . . . . . . . . . . . . . . . . . . . . . . . . . . . 1-7
Windows On-Line Help. . . . . . . . . . . . . . . . . . . . . . . . . . . . . . . . . . . . . . . . . . . . 1-8
Troubleshooting and Technical Support. . . . . . . . . . . . . . . . . . . . . . . . . . . . . 1-10
Glossary of Terms . . . . . . . . . . . . . . . . . . . . . . . . . . . . . . . . . . . . . . . . . . . . . . . . . . . . . 1-11
Chapter 2: Installation . . . . . . . . . . . . . . . . . . . . . . . . . . . . . . . . . . . . . . . . . . . . . . . . . . . . . . .2-1
Connect the Hardware . . . . . . . . . . . . . . . . . . . . . . . . . . . . . . . . . . . . . . . . . . . . . . . . . . 2-3
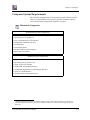
Computer System Requirements. . . . . . . . . . . . . . . . . . . . . . . . . . . . . . . . . . . . . . . . . . 2-5
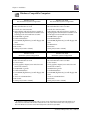
Macintosh Computer . . . . . . . . . . . . . . . . . . . . . . . . . . . . . . . . . . . . . . . . . . . . . . 2-5
Windows-Compatible Computer. . . . . . . . . . . . . . . . . . . . . . . . . . . . . . . . . . . . 2-6
Install SOFTmax PRO for Lmax . . . . . . . . . . . . . . . . . . . . . . . . . . . . . . . . . . . . . . . . . . 2-7
What Is Installed . . . . . . . . . . . . . . . . . . . . . . . . . . . . . . . . . . . . . . . . . . . . . . . . . . 2-8
Enter Registration Information . . . . . . . . . . . . . . . . . . . . . . . . . . . . . . . . . . . . . . . . . . . 2-8
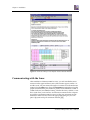
Communicating with the Lmax. . . . . . . . . . . . . . . . . . . . . . . . . . . . . . . . . . . . . . . . . . 2-10
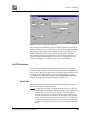
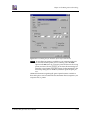
Set Preferences . . . . . . . . . . . . . . . . . . . . . . . . . . . . . . . . . . . . . . . . . . . . . . . . . . . . . . . . 2-11
Serial Port. . . . . . . . . . . . . . . . . . . . . . . . . . . . . . . . . . . . . . . . . . . . . . . . . . . . . . . 2-11
Export Format . . . . . . . . . . . . . . . . . . . . . . . . . . . . . . . . . . . . . . . . . . . . . . . . . . . 2-12
Autosave . . . . . . . . . . . . . . . . . . . . . . . . . . . . . . . . . . . . . . . . . . . . . . . . . . . . . . . 2-12
Autoprint . . . . . . . . . . . . . . . . . . . . . . . . . . . . . . . . . . . . . . . . . . . . . . . . . . . . . . . 2-15
Assays Folder . . . . . . . . . . . . . . . . . . . . . . . . . . . . . . . . . . . . . . . . . . . . . . . . . . . . . . . . . 2-15
Chapter 3: SOFTmax PRO for Lmax Overview . . . . . . . . . . . . . . . . . . . . . . . . . . . . . . . . . .3-1
Introduction . . . . . . . . . . . . . . . . . . . . . . . . . . . . . . . . . . . . . . . . . . . . . . . . . . . . . . . . . . . 3-3
The SOFTmax PRO for Lmax Window . . . . . . . . . . . . . . . . . . . . . . . . . . . . . . . . . . . . 3-3
Window Size. . . . . . . . . . . . . . . . . . . . . . . . . . . . . . . . . . . . . . . . . . . . . . . . . . . . . . . . . . . 3-5
Status Bar . . . . . . . . . . . . . . . . . . . . . . . . . . . . . . . . . . . . . . . . . . . . . . . . . . . . . . . . . . . . . 3-6
Experiments and Sections. . . . . . . . . . . . . . . . . . . . . . . . . . . . . . . . . . . . . . . . . . . . . . . . 3-7
Experiments . . . . . . . . . . . . . . . . . . . . . . . . . . . . . . . . . . . . . . . . . . . . . . . . . . . . . . 3-7
Sections. . . . . . . . . . . . . . . . . . . . . . . . . . . . . . . . . . . . . . . . . . . . . . . . . . . . . . . . . . 3-8
Notes Section . . . . . . . . . . . . . . . . . . . . . . . . . . . . . . . . . . . . . . . . . . . . . . . . . . . . 3-12
Plate Section. . . . . . . . . . . . . . . . . . . . . . . . . . . . . . . . . . . . . . . . . . . . . . . . . . . . . 3-13
Group Section . . . . . . . . . . . . . . . . . . . . . . . . . . . . . . . . . . . . . . . . . . . . . . . . . . . 3-15
Graph Section . . . . . . . . . . . . . . . . . . . . . . . . . . . . . . . . . . . . . . . . . . . . . . . . . . . 3-17
Instrument Settings . . . . . . . . . . . . . . . . . . . . . . . . . . . . . . . . . . . . . . . . . . . . . . . . . . . . 3-19
Menus and Commands. . . . . . . . . . . . . . . . . . . . . . . . . . . . . . . . . . . . . . . . . . . . . . . . . 3-19
Interprocess Messaging . . . . . . . . . . . . . . . . . . . . . . . . . . . . . . . . . . . . . . . . . . . . . . . . 3-33
SOFTmax PRO for Lmax User’s Manual
v
Chapter 4: Reading Microplates . . . . . . . . . . . . . . . . . . . . . . . . . . . . . . . . . . . . . . . . . . . . . . .4-1
Introduction . . . . . . . . . . . . . . . . . . . . . . . . . . . . . . . . . . . . . . . . . . . . . . . . . . . . . . . . . . . 4-3
Instrument Settings . . . . . . . . . . . . . . . . . . . . . . . . . . . . . . . . . . . . . . . . . . . . . . . . . . . . . 4-4
Instrument Settings Options . . . . . . . . . . . . . . . . . . . . . . . . . . . . . . . . . . . . . . . . 4-9
Template Editor . . . . . . . . . . . . . . . . . . . . . . . . . . . . . . . . . . . . . . . . . . . . . . . . . . . . . . . 4-13
Selecting Wells in the Template Editor . . . . . . . . . . . . . . . . . . . . . . . . . . . . . . 4-14
The Template Editor Tool Bar. . . . . . . . . . . . . . . . . . . . . . . . . . . . . . . . . . . . . . 4-15
Blanking . . . . . . . . . . . . . . . . . . . . . . . . . . . . . . . . . . . . . . . . . . . . . . . . . . . . . . . . 4-24
Copying and Pasting Templates. . . . . . . . . . . . . . . . . . . . . . . . . . . . . . . . . . . . 4-27
Reading a Microplate . . . . . . . . . . . . . . . . . . . . . . . . . . . . . . . . . . . . . . . . . . . . . . . . . . 4-29
Chapter 5: Displaying and Analyzing Data . . . . . . . . . . . . . . . . . . . . . . . . . . . . . . . . . . . . .5-1
Introduction . . . . . . . . . . . . . . . . . . . . . . . . . . . . . . . . . . . . . . . . . . . . . . . . . . . . . . . . . . . 5-3
Initial Data Display and Reduction. . . . . . . . . . . . . . . . . . . . . . . . . . . . . . . . . . . . . . . . 5-4
The Data Display . . . . . . . . . . . . . . . . . . . . . . . . . . . . . . . . . . . . . . . . . . . . . . . . . . . . . . . 5-4
The Display Dialog Box . . . . . . . . . . . . . . . . . . . . . . . . . . . . . . . . . . . . . . . . . . . . 5-5
Well Graphs of Kinetic Wells . . . . . . . . . . . . . . . . . . . . . . . . . . . . . . . . . . . . . . 5-12
Masking Wells . . . . . . . . . . . . . . . . . . . . . . . . . . . . . . . . . . . . . . . . . . . . . . . . . 5-15
Data Reduction. . . . . . . . . . . . . . . . . . . . . . . . . . . . . . . . . . . . . . . . . . . . . . . . . . . . . . . . 5-16
Endpoint. . . . . . . . . . . . . . . . . . . . . . . . . . . . . . . . . . . . . . . . . . . . . . . . . . . . . . . . 5-18
Dual Read. . . . . . . . . . . . . . . . . . . . . . . . . . . . . . . . . . . . . . . . . . . . . . . . . . . . . . . 5-18
Long and Fast Kinetics. . . . . . . . . . . . . . . . . . . . . . . . . . . . . . . . . . . . . . . . . . . . 5-18
Custom Reduction Formulas . . . . . . . . . . . . . . . . . . . . . . . . . . . . . . . . . . . . . . 5-21
Recalculation Options . . . . . . . . . . . . . . . . . . . . . . . . . . . . . . . . . . . . . . . . . . . . 5-22
Displaying Data in Group, Graph, and Notes Sections . . . . . . . . . . . . . . . . . . . . . . 5-22
Group Sections . . . . . . . . . . . . . . . . . . . . . . . . . . . . . . . . . . . . . . . . . . . . . . . . . . 5-22
Notes Sections . . . . . . . . . . . . . . . . . . . . . . . . . . . . . . . . . . . . . . . . . . . . . . . . . . . 5-28
Graph Section . . . . . . . . . . . . . . . . . . . . . . . . . . . . . . . . . . . . . . . . . . . . . . . . . . . 5-28
Formulas in SOFTmax PRO for Lmax . . . . . . . . . . . . . . . . . . . . . . . . . . . . . . . . . . . . 5-46
Chapter 6: File Management and Printing . . . . . . . . . . . . . . . . . . . . . . . . . . . . . . . . . . . . . .6-1
File Creation and Management . . . . . . . . . . . . . . . . . . . . . . . . . . . . . . . . . . . . . . . . . . . 6-3
Default Protocol . . . . . . . . . . . . . . . . . . . . . . . . . . . . . . . . . . . . . . . . . . . . . . . . . . 6-3
Locating Protocol and Data Files . . . . . . . . . . . . . . . . . . . . . . . . . . . . . . . . . . . . 6-4
Creating New Files . . . . . . . . . . . . . . . . . . . . . . . . . . . . . . . . . . . . . . . . . . . . . . . . 6-4
Opening Files. . . . . . . . . . . . . . . . . . . . . . . . . . . . . . . . . . . . . . . . . . . . . . . . . . . . . 6-6
Saving Files Manually . . . . . . . . . . . . . . . . . . . . . . . . . . . . . . . . . . . . . . . . . . . . . 6-9
Autosave . . . . . . . . . . . . . . . . . . . . . . . . . . . . . . . . . . . . . . . . . . . . . . . . . . . . . . . . 6-9
Printing . . . . . . . . . . . . . . . . . . . . . . . . . . . . . . . . . . . . . . . . . . . . . . . . . . . . . . . . . . . . . . 6-11
The Printed Report . . . . . . . . . . . . . . . . . . . . . . . . . . . . . . . . . . . . . . . . . . . . . . . 6-12
Customizing the Report. . . . . . . . . . . . . . . . . . . . . . . . . . . . . . . . . . . . . . . . . . . 6-12
The Print Dialog Box . . . . . . . . . . . . . . . . . . . . . . . . . . . . . . . . . . . . . . . . . . . . . 6-14
Exporting/ Importing Information. . . . . . . . . . . . . . . . . . . . . . . . . . . . . . . . . . . . . . . 6-16
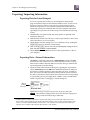
Exporting Data for Later Reimport . . . . . . . . . . . . . . . . . . . . . . . . . . . . . . . . . 6-16
Exporting Data—General Information . . . . . . . . . . . . . . . . . . . . . . . . . . . . . . 6-16
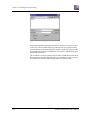
Importing Data from Outside of SOFTmax PRO for Lmax . . . . . . . . . . . . . 6-20
Importing and Exporting Templates . . . . . . . . . . . . . . . . . . . . . . . . . . . . . . . . 6-20
Exporting Graphs. . . . . . . . . . . . . . . . . . . . . . . . . . . . . . . . . . . . . . . . . . . . . 6-21
Copying and Pasting . . . . . . . . . . . . . . . . . . . . . . . . . . . . . . . . . . . . . . . . . . . . . 6-21
Password Protection . . . . . . . . . . . . . . . . . . . . . . . . . . . . . . . . . . . . . . . . . . . . . . . . . . . 6-25
Setting and Changing a Password . . . . . . . . . . . . . . . . . . . . . . . . . . . . . . . . . . 6-26
vi
SOFTmax PRO for Lmax User’s Manual
Chapter 7: Tutorial. . . . . . . . . . . . . . . . . . . . . . . . . . . . . . . . . . . . . . . . . . . . . . . . . . . . . . . . . . .7-1
Introduction . . . . . . . . . . . . . . . . . . . . . . . . . . . . . . . . . . . . . . . . . . . . . . . . . . . . . . . . . . . 7-3
Hard and Soft Parameters . . . . . . . . . . . . . . . . . . . . . . . . . . . . . . . . . . . . . . . . . . 7-3
Description of the Assay Example . . . . . . . . . . . . . . . . . . . . . . . . . . . . . . . . . . . 7-4
Define the Protocol . . . . . . . . . . . . . . . . . . . . . . . . . . . . . . . . . . . . . . . . . . . . . . . . . . . . . 7-4
Start SOFTmax PRO for Lmax and Open the Tutorial File . . . . . . . . . . . . . . . . . . . . 7-5
Define the Instrument Settings . . . . . . . . . . . . . . . . . . . . . . . . . . . . . . . . . . . . . . . . . . . 7-6
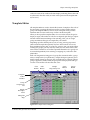
Define the Template. . . . . . . . . . . . . . . . . . . . . . . . . . . . . . . . . . . . . . . . . . . . . . . . . . . . 7-11
Set the Display Parameters. . . . . . . . . . . . . . . . . . . . . . . . . . . . . . . . . . . . . . . . . . . . . . 7-17
Save the Protocol . . . . . . . . . . . . . . . . . . . . . . . . . . . . . . . . . . . . . . . . . . . . . . . . . . . . . . 7-18
“Read” the Plate. . . . . . . . . . . . . . . . . . . . . . . . . . . . . . . . . . . . . . . . . . . . . . . . . . . . . . . 7-19
Data Analysis—Group Sections . . . . . . . . . . . . . . . . . . . . . . . . . . . . . . . . . . . . . . . . . 7-21
Data Analysis—Standard Curve . . . . . . . . . . . . . . . . . . . . . . . . . . . . . . . . . . . . . . . . . 7-29
Print a Report . . . . . . . . . . . . . . . . . . . . . . . . . . . . . . . . . . . . . . . . . . . . . . . . . . . . . . . . . 7-31
Chapter 8: Troubleshooting. . . . . . . . . . . . . . . . . . . . . . . . . . . . . . . . . . . . . . . . . . . . . . . . . . .8-1
Introduction . . . . . . . . . . . . . . . . . . . . . . . . . . . . . . . . . . . . . . . . . . . . . . . . . . . . . . . . . . . 8-3
Message Boxes and Alerts . . . . . . . . . . . . . . . . . . . . . . . . . . . . . . . . . . . . . . . . . . . . . . . 8-3
One or More Points Lost Message . . . . . . . . . . . . . . . . . . . . . . . . . . . . . . . . . . . 8-4
Error Message Boxes . . . . . . . . . . . . . . . . . . . . . . . . . . . . . . . . . . . . . . . . . . . . . . . . . . . . 8-4
Communication Problems . . . . . . . . . . . . . . . . . . . . . . . . . . . . . . . . . . . . . . . . . . . . . . . 8-5
Macintosh Cable Connections. . . . . . . . . . . . . . . . . . . . . . . . . . . . . . . . . . . . . . . 8-8
PC Cable Connections . . . . . . . . . . . . . . . . . . . . . . . . . . . . . . . . . . . . . . . . . . . . . 8-9
Display Problems. . . . . . . . . . . . . . . . . . . . . . . . . . . . . . . . . . . . . . . . . . . . . . . . . . . . . . 8-10
Printing Problems . . . . . . . . . . . . . . . . . . . . . . . . . . . . . . . . . . . . . . . . . . . . . . . . . . . . . 8-10
General Problems. . . . . . . . . . . . . . . . . . . . . . . . . . . . . . . . . . . . . . . . . . . . . . . . . . . . . . 8-11
Appendix A: SOFTmax PRO for Lmax Remote Command Language . . . . . . . . . . . . . .8-1
Introduction . . . . . . . . . . . . . . . . . . . . . . . . . . . . . . . . . . . . . . . . . . . . . . . . . . . . . . . . . . . A-3
SOFTmax PRO for Lmax Responses. . . . . . . . . . . . . . . . . . . . . . . . . . . . . . . . . . . . . . . A-3
SOFTmax PRO for Lmax Commands. . . . . . . . . . . . . . . . . . . . . . . . . . . . . . . . . . . . . . A-4
Visual Basic (Excel Macro) Example . . . . . . . . . . . . . . . . . . . . . . . . . . . . . . . . . A-7
MFC C++ Interface to SOFTmax PRO for Lmax Remote
Commands that Return Values . . . . . . . . . . . . . . . . . . . . . . . . . . . . . . . . . . A-8
SOFTmax PRO for Lmax User’s Manual
vii
viii
SOFTmax PRO for Lmax User’s Manual
Figures
Figure 1.1
Figure 1.2
Figure 1.3
Figure 1.4
Figure 1.5
Figure 1.6
Figure 1.7
Help Menu for SOFTmax PRO for Lmax for the Macintosh. . . . . . . . . . . . . . . . . . . 1-7
Formula Help Window. . . . . . . . . . . . . . . . . . . . . . . . . . . . . . . . . . . . . . . . . . . . . . . . . . 1-7
Help Menu for SOFTmax PRO for Lmax for Windows. . . . . . . . . . . . . . . . . . . . . . . 1-8
Help Contents for SOFTmax PRO for Lmax for Windows . . . . . . . . . . . . . . . . . . . . 1-8
Using the Search Function within Help in SOFTmax PRO for
Lmax for Windows . . . . . . . . . . . . . . . . . . . . . . . . . . . . . . . . . . . . . . . . . . . . . . . . . . . . . 1-9
Choose a Topic within Help in SOFTmax PRO for Lmax for Windows . . . . . . . . . 1-9
Hypertext Links within SOFTmax PRO for Lmax for Windows . . . . . . . . . . . . . . 1-10
Figure 2.1
Figure 2.2
Figure 2.3
Figure 2.4
Figure 2.5
Figure 2.6
Figure 2.7
Figure 2.8
Figure 2.9
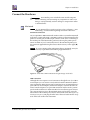
8-Pin DIN to DB-25 Macintosh Straight-through Serial Cable . . . . . . . . . . . . . . . . . 2-3
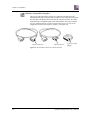
25-Pin DIN to 25-Pin or 9-Pin Serial Cable . . . . . . . . . . . . . . . . . . . . . . . . . . . . . . . . . 2-4
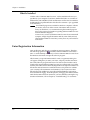
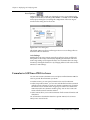
Registration Dialog Box . . . . . . . . . . . . . . . . . . . . . . . . . . . . . . . . . . . . . . . . . . . . . . . . . 2-9
SOFTmax PRO for Lmax Title Screen. . . . . . . . . . . . . . . . . . . . . . . . . . . . . . . . . . . . . . 2-9
SOFTmax PRO for Lmax Default Protocol Untitled Window . . . . . . . . . . . . . . . . 2-10
Preferences Dialog Box (Windows) . . . . . . . . . . . . . . . . . . . . . . . . . . . . . . . . . . . . . . 2-11
Autosave Information (Windows) . . . . . . . . . . . . . . . . . . . . . . . . . . . . . . . . . . . . . . . 2-13
Autosave Location Dialog Box (Windows) . . . . . . . . . . . . . . . . . . . . . . . . . . . . . . . . 2-13
File Prefix Field (Windows) . . . . . . . . . . . . . . . . . . . . . . . . . . . . . . . . . . . . . . . . . . . . . 2-14
Figure 3.1
Figure 3.2
Figure 3.3
Figure 3.4
Figure 3.5
Figure 3.6
Figure 3.7
Figure 3.8
Figure 3.9
Figure 3.10
Figure 3.11
Figure 3.12
Figure 3.13
Figure 3.14
SOFTmax PRO for Lmax Title Screen. . . . . . . . . . . . . . . . . . . . . . . . . . . . . . . . . . . . . . 3-3
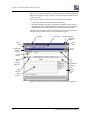
SOFTmax PRO for Lmax Screen and Window for the PC (Windows) . . . . . . . . . . 3-4
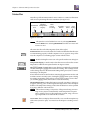
Status Bar . . . . . . . . . . . . . . . . . . . . . . . . . . . . . . . . . . . . . . . . . . . . . . . . . . . . . . . . . . . . . 3-6
Tool Bar from an Active Graph Section . . . . . . . . . . . . . . . . . . . . . . . . . . . . . . . . . . . . 3-9
Example of a Tool Bar “Sticking” to the Top of the Window. . . . . . . . . . . . . . . . . 3-10
Closed and Open Sections . . . . . . . . . . . . . . . . . . . . . . . . . . . . . . . . . . . . . . . . . . . . . . 3-10
Result of Minimizing an Experiment (Tool Bars Hidden). . . . . . . . . . . . . . . . . . . . 3-11
Separate Section Window. . . . . . . . . . . . . . . . . . . . . . . . . . . . . . . . . . . . . . . . . . . . . . . 3-11
Example Notes Section, Named “Results.” . . . . . . . . . . . . . . . . . . . . . . . . . . . . . . . . 3-12
Plate Section.. . . . . . . . . . . . . . . . . . . . . . . . . . . . . . . . . . . . . . . . . . . . . . . . . . . . . . . . . . 3-13
Group Section (example shown prior to collecting data) . . . . . . . . . . . . . . . . . . . . 3-15
Graph Section (example shown before data collection). . . . . . . . . . . . . . . . . . . . . . 3-17
Menu Bar (Macintosh menu top, Windows menu bottom) . . . . . . . . . . . . . . . . . . 3-19
SOFTmax PRO for Lmax Menus (Windows version) . . . . . . . . . . . . . . . . . . . . . . . 3-21
Figure 4.1
Figure 4.2
Figure 4.3
Figure 4.4
Figure 4.5
Figure 4.6
Figure 4.7
Figure 4.8
Figure 4.9
Figure 4.10
Instrument Settings Dialog Boxes for an Endpoint Reading . . . . . . . . . . . . . . . . . . 4-5
Instrument Settings Dialog Boxes for a Dual Read . . . . . . . . . . . . . . . . . . . . . . . . . . 4-6
Instrument Settings Dialog Boxes for a Long KineticsReading . . . . . . . . . . . . . . . . 4-7
Instrument Settings Dialog Boxes for a Fast Kinetics Reading. . . . . . . . . . . . . . . . . 4-8
Instrument Settings for an Endpoint Reading. . . . . . . . . . . . . . . . . . . . . . . . . . . . . . . 4-9
Instrument Settings for a Dual Reading. . . . . . . . . . . . . . . . . . . . . . . . . . . . . . . . . . . 4-10
Instrument Settings for a Long Kinetics Reading. . . . . . . . . . . . . . . . . . . . . . . . . . . 4-10
Instrument Settings for a Fast Kinetics Reading. . . . . . . . . . . . . . . . . . . . . . . . . . . . 4-11
Plate Type Setting . . . . . . . . . . . . . . . . . . . . . . . . . . . . . . . . . . . . . . . . . . . . . . . . . . . . . 4-12
Partial Plate Read (Wells to Read) Dialog Box with Wells
B2 through F9 Selected . . . . . . . . . . . . . . . . . . . . . . . . . . . . . . . . . . . . . . . . . . . . . . . . . 4-12
Template Editor Dialog Box. . . . . . . . . . . . . . . . . . . . . . . . . . . . . . . . . . . . . . . . . . . . . 4-13
The Appearance of the Template Editor Tool Bar under
Different Circumstances . . . . . . . . . . . . . . . . . . . . . . . . . . . . . . . . . . . . . . . . . . . . . . . . 4-15
The Group Drop-Down List. . . . . . . . . . . . . . . . . . . . . . . . . . . . . . . . . . . . . . . . . . . . . 4-16
Group Settings Dialog Box Using Default Settings . . . . . . . . . . . . . . . . . . . . . . . . . 4-16
Figure 4.11
Figure 4.12
Figure 4.13
Figure 4.14
SOFTmax PRO for Lmax User’s Manual
ix
Figure 4.15
Figure 4.16
Figure 4.17
Figure 4.18
Figure 4.25
Figure 4.26
Figure 4.27
Figure 4.28
Figure 4.29
Figure 4.30
Group Settings Dialog Box for the Group Named “Patient#1” . . . . . . . . . . . . . . . 4-19
Groups Settings Dialog Box Showing Original Column Format . . . . . . . . . . . . . . 4-19
Modifying Sample Names and Descriptor Values in the Template Editor . . . . . 4-20
The Sample Drop-Down List. When this list first appears, the only selection shown
below the dividing line is “BL”; the active sample name that is ready to be assigned
appears above the line.4-20
Sample Drop-Down List—Sample Names Defined and Wells Selected. . . . . . . . 4-21
Assign Area of the Template Editor Tool Bar . . . . . . . . . . . . . . . . . . . . . . . . . . . . . . 4-21
Template with Wells Selected for a Series . . . . . . . . . . . . . . . . . . . . . . . . . . . . . . . . . 4-22
Series Dialog Box . . . . . . . . . . . . . . . . . . . . . . . . . . . . . . . . . . . . . . . . . . . . . . . . . . . . . . 4-22
Fill Options and Replicate Settings . . . . . . . . . . . . . . . . . . . . . . . . . . . . . . . . . . . . . . . 4-23
Pre-Read Plate Blanking Section of the Instrument Settings Dialog Box
(Endpoint Mode Only) . . . . . . . . . . . . . . . . . . . . . . . . . . . . . . . . . . . . . . . . . . . . . . . . . 4-24
Graphic Representation of Plate Blank Subtraction . . . . . . . . . . . . . . . . . . . . . . . . . 4-26
Template Editor Showing Plate Blank and Group-Associated Blank Wells. . . . . 4-27
Copy Template and Paste Template Commands in the Plate Menu . . . . . . . . . . . 4-28
Select Section Dialog Box . . . . . . . . . . . . . . . . . . . . . . . . . . . . . . . . . . . . . . . . . . . . . . . 4-29
Alert Regarding Replacing Data for Plate Section . . . . . . . . . . . . . . . . . . . . . . . . . . 4-29
Status Bar during a Long Kinetics Reading . . . . . . . . . . . . . . . . . . . . . . . . . . . . . . . . 4-30
Figure 5.1
Figure 5.2
Figure 5.3
Figure 5.4
Figure 5.5
Figure 5.6
Figure 5.7
Figure 5.8
Figure 5.9
Figure 5.10
Figure 5.11
Figure 5.12
Figure 5.13
Figure 5.14
Figure 5.15
Figure 5.16
Figure 5.17
Figure 5.18
Figure 5.19
Figure 5.20
Figure 5.21
Figure 5.22
Figure 5.23
Figure 5.24
Figure 5.25
Figure 5.26
Figure 5.27
Figure 5.28
Figure 5.29
Figure 5.30
Figure 5.31
Figure 5.32
Figure 5.33
Relationship of Sections . . . . . . . . . . . . . . . . . . . . . . . . . . . . . . . . . . . . . . . . . . . . . . . . . 5-3
Endpoint, Dual Read, and Long and Fast Kinetics Display Dialog Boxes.. . . . . . . 5-6
Display Dialog Box for Long Kinetics Threshold Display . . . . . . . . . . . . . . . . . . . 5-10
Endpoint Data Displayed as Threshold with Reduced Number . . . . . . . . . . . . . . 5-10
Fast Kinetics Data (Reduced) Displayed as Ranged. . . . . . . . . . . . . . . . . . . . . . . . . 5-11
Endpoint Data (Reduced) Displayed as Gray Scale . . . . . . . . . . . . . . . . . . . . . . . . . 5-11
Graph Options Dialog. . . . . . . . . . . . . . . . . . . . . . . . . . . . . . . . . . . . . . . . . . . . . . . . . . 5-13
Well Graph for a Single Fast Kinetics Microplate Well (Raw Data) . . . . . . . . . . . 5-14
Well Graph for Three Fast Kinetic Wells of a Microplate (Raw Data). . . . . . . . . . 5-14
Masked Wells . . . . . . . . . . . . . . . . . . . . . . . . . . . . . . . . . . . . . . . . . . . . . . . . . . . . . . . . . 5-15
Reduction Dialog Boxes for All Read Modes. . . . . . . . . . . . . . . . . . . . . . . . . . . . . . . 5-17
Limits in Reduction Dialog Box. . . . . . . . . . . . . . . . . . . . . . . . . . . . . . . . . . . . . . . . . . 5-19
“Custom” Selected Showing Formula Button (Endpoint). . . . . . . . . . . . . . . . . . . . 5-21
Calculation Dialog Box (Endpoint) . . . . . . . . . . . . . . . . . . . . . . . . . . . . . . . . . . . . . . . 5-21
Cursor Positioned on a Line between Columns . . . . . . . . . . . . . . . . . . . . . . . . . . . . 5-23
Dragging a Column Divider Line . . . . . . . . . . . . . . . . . . . . . . . . . . . . . . . . . . . . . . . . 5-24
The “Show Formulas” Command in the Group Menu . . . . . . . . . . . . . . . . . . . . . . 5-25
Formulas Shown in Group Columns . . . . . . . . . . . . . . . . . . . . . . . . . . . . . . . . . . . . . 5-25
Formula Button Activated and Column Formulas Shown . . . . . . . . . . . . . . . . . . . 5-26
Column Formula Dialog Box . . . . . . . . . . . . . . . . . . . . . . . . . . . . . . . . . . . . . . . . . . . . 5-26
Calculation Dialog Box . . . . . . . . . . . . . . . . . . . . . . . . . . . . . . . . . . . . . . . . . . . . . . . . . 5-27
Graph Options Dialog Box . . . . . . . . . . . . . . . . . . . . . . . . . . . . . . . . . . . . . . . . . . . . . . 5-30
Standards and Unknowns Groups Created. . . . . . . . . . . . . . . . . . . . . . . . . . . . . . . . 5-31
GA(native) Group Section . . . . . . . . . . . . . . . . . . . . . . . . . . . . . . . . . . . . . . . . . . . . . . 5-31
Graph Options Dialog Box . . . . . . . . . . . . . . . . . . . . . . . . . . . . . . . . . . . . . . . . . . . . . . 5-32
Graph Options Dialog Box with Second Plot Added for GA(h) . . . . . . . . . . . . . . 5-32
Graph Displaying Eight Plots . . . . . . . . . . . . . . . . . . . . . . . . . . . . . . . . . . . . . . . . . . . 5-33
Plot Showing Error Bars . . . . . . . . . . . . . . . . . . . . . . . . . . . . . . . . . . . . . . . . . . . . . . . . 5-34
Graph with No Fit . . . . . . . . . . . . . . . . . . . . . . . . . . . . . . . . . . . . . . . . . . . . . . . . . . . . . 5-35
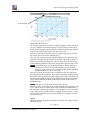
Graph with Linear Fit (simulated data) . . . . . . . . . . . . . . . . . . . . . . . . . . . . . . . . . . . 5-36
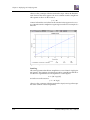
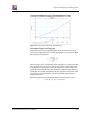
Graph with Semi-Log Fit (simulated data) . . . . . . . . . . . . . . . . . . . . . . . . . . . . . . . . 5-37
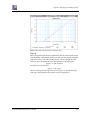
Graph with Log-Log Fit (simulated data) . . . . . . . . . . . . . . . . . . . . . . . . . . . . . . . . . 5-38
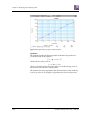
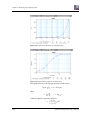
Graph with Quadratic Fit (simulated data) . . . . . . . . . . . . . . . . . . . . . . . . . . . . . . . . 5-39
Figure 4.19
Figure 4.20
Figure 4.21
Figure 4.22
Figure 4.23
Figure 4.24
x
SOFTmax PRO for Lmax User’s Manual
Figure 5.34
Figure 5.35
Figure 5.36
Figure 5.37
Figure 5.38
Figure 5.39
Figure 5.40
Figure 5.41
Figure 5.42
Graph with 4-Parameter Fit (simulated data) . . . . . . . . . . . . . . . . . . . . . . . . . . . . . .
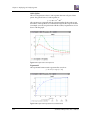
Graph with Log-Logit Fit (simulated data) . . . . . . . . . . . . . . . . . . . . . . . . . . . . . . . .
Graph with Point-to-Point Fit . . . . . . . . . . . . . . . . . . . . . . . . . . . . . . . . . . . . . . . . . . .
Graph with Cubic Spline Fit . . . . . . . . . . . . . . . . . . . . . . . . . . . . . . . . . . . . . . . . . . . .
Graph with Exponential Fit (simulated data) . . . . . . . . . . . . . . . . . . . . . . . . . . . . . .
Graph Options Dialog Box . . . . . . . . . . . . . . . . . . . . . . . . . . . . . . . . . . . . . . . . . . . . . .
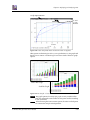
Scatter Graph with Points Connected (Linear Fit Applied) . . . . . . . . . . . . . . . . . .
Bar Graphs—Cluster and Stack . . . . . . . . . . . . . . . . . . . . . . . . . . . . . . . . . . . . . . . . . .
X-Axis Dialog Box . . . . . . . . . . . . . . . . . . . . . . . . . . . . . . . . . . . . . . . . . . . . . . . . . . . . .
Figure 6.1
Figure 6.2
Figure 6.3
Figure 6.4
Figure 6.5
Figure 6.6
Figure 6.7
Figure 6.8
Figure 6.9
Figure 6.10
Figure 6.11
Figure 6.12
Figure 6.13
Figure 6.14
Figure 6.15
Figure 6.16
Figure 6.17
Figure 6.18
Example Assays Menu . . . . . . . . . . . . . . . . . . . . . . . . . . . . . . . . . . . . . . . . . . . . . . . . . . 6-3
Set Folder Dialog Box—Macintosh and PC . . . . . . . . . . . . . . . . . . . . . . . . . . . . . . . . . 6-4
Save as... Dialog Box—Macintosh . . . . . . . . . . . . . . . . . . . . . . . . . . . . . . . . . . . . . . . . . 6-5
Save as... Dialog Box—Windows . . . . . . . . . . . . . . . . . . . . . . . . . . . . . . . . . . . . . . . . . 6-5
PC Exchange Dialog Box . . . . . . . . . . . . . . . . . . . . . . . . . . . . . . . . . . . . . . . . . . . . . . . . 6-7
Add Mapping Dialog Box . . . . . . . . . . . . . . . . . . . . . . . . . . . . . . . . . . . . . . . . . . . . . . . 6-8
Preferences Dialog Box . . . . . . . . . . . . . . . . . . . . . . . . . . . . . . . . . . . . . . . . . . . . . . . . . 6-10
Print Dialog Box. . . . . . . . . . . . . . . . . . . . . . . . . . . . . . . . . . . . . . . . . . . . . . . . . . . . . . . 6-12
Format Text Dialog Box (Macintosh) . . . . . . . . . . . . . . . . . . . . . . . . . . . . . . . . . . . . . 6-13
Print Dialog Box for the Macintosh. . . . . . . . . . . . . . . . . . . . . . . . . . . . . . . . . . . . . . . 6-14
Print Dialog Box for Windows (Epson Stylus 800 Shown) . . . . . . . . . . . . . . . . . . . 6-15
Choosing an Export Format from the Preferences Dialog Box . . . . . . . . . . . . . . . . 6-16
Display Dialog Box . . . . . . . . . . . . . . . . . . . . . . . . . . . . . . . . . . . . . . . . . . . . . . . . . . . . 6-17
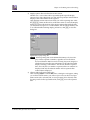
Export Dialog Box . . . . . . . . . . . . . . . . . . . . . . . . . . . . . . . . . . . . . . . . . . . . . . . . . . . . . 6-18
Import Dialog Box . . . . . . . . . . . . . . . . . . . . . . . . . . . . . . . . . . . . . . . . . . . . . . . . . . . . . 6-20
Error Message Generated When Pasting Mismatched Data . . . . . . . . . . . . . . . . . . 6-23
Set Password Dialog Box . . . . . . . . . . . . . . . . . . . . . . . . . . . . . . . . . . . . . . . . . . . . . . . 6-26
Password Required Dialog Box. . . . . . . . . . . . . . . . . . . . . . . . . . . . . . . . . . . . . . . . . . 6-27
Figure 7.1
Figure 7.2
Figure 7.3
Figure 7.4
Figure 7.5
Tutorial File (Blank) with Notes #1 and Plate#1 Sections Open . . . . . . . . . . . . . . . 7-5
Instrument Settings Dialog Box—Integration and Pre-read Section Open. . . . . . . 7-6
Instrument Settings Dialog Box—Injection and Delay Section Open . . . . . . . . . . . 7-7
Instrument Settings Dialog Box—Injection and Delay Section Revised . . . . . . . . . 7-8
Instrument Settings Dialog Box—Injection Wells Section Open with
P Injector Enabled . . . . . . . . . . . . . . . . . . . . . . . . . . . . . . . . . . . . . . . . . . . . . . . . . . . . . . 7-9
Instrument Settings Dialog Box—Injection Wells Selected . . . . . . . . . . . . . . . . . . . 7-10
Template with Three Columns of Wells Selected and New Group
Being Created . . . . . . . . . . . . . . . . . . . . . . . . . . . . . . . . . . . . . . . . . . . . . . . . . . . . . . . . . 7-11
Instrument Settings Dialog Box. . . . . . . . . . . . . . . . . . . . . . . . . . . . . . . . . . . . . . . . . . 7-11
Template with Standards Assigned.. . . . . . . . . . . . . . . . . . . . . . . . . . . . . . . . . . . . . . 7-12
Template with Group-Associated Blank Included with Standards. . . . . . . . . . . . 7-12
Series Dialog Box . . . . . . . . . . . . . . . . . . . . . . . . . . . . . . . . . . . . . . . . . . . . . . . . . . . . . . 7-13
Template with CTRL+Shift Keys Depressed. . . . . . . . . . . . . . . . . . . . . . . . . . . . . . . 7-13
First Unknowns Added to the Template . . . . . . . . . . . . . . . . . . . . . . . . . . . . . . . . . . 7-14
Unknowns Changed to a Series. . . . . . . . . . . . . . . . . . . . . . . . . . . . . . . . . . . . . . . . . . 7-15
Group Settings Dialog Box for Unknowns with Dilution . . . . . . . . . . . . . . . . . . . . 7-15
Template Complete . . . . . . . . . . . . . . . . . . . . . . . . . . . . . . . . . . . . . . . . . . . . . . . . . . . . 7-16
The Plate Section Showing Template Group Boundaries . . . . . . . . . . . . . . . . . . . . 7-16
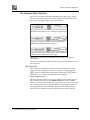
Display Dialog Box (Endpoint) . . . . . . . . . . . . . . . . . . . . . . . . . . . . . . . . . . . . . . . . . . 7-17
Display Dialog Box after Choosing Reduced and Clicking the
Display Choices Drop Down Menu . . . . . . . . . . . . . . . . . . . . . . . . . . . . . . . . . . . . . . 7-17
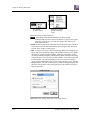
Save As... Dialog Box—Macintosh . . . . . . . . . . . . . . . . . . . . . . . . . . . . . . . . . . . . . . . 7-18
Save As... Dialog Box—Windows . . . . . . . . . . . . . . . . . . . . . . . . . . . . . . . . . . . . . . . . 7-18
Figure 7.6
Figure 7.7
Figure 7.8
Figure 7.9
Figure 7.10
Figure 7.11
Figure 7.12
Figure 7.13
Figure 7.14
Figure 7.15
Figure 7.16
Figure 7.17
Figure 7.18
Figure 7.19
Figure 7.20
Figure 7.21
SOFTmax PRO for Lmax User’s Manual
5-40
5-40
5-41
5-42
5-42
5-44
5-45
5-45
5-46
xi
Figure 7.22
Figure 7.23
Figure 7.24
Figure 7.25
Figure 7.26
Figure 7.27
Figure 7.29
Figure 7.30
Figure 7.31
Figure 7.32
Figure 7.33
Figure 7.34
Figure 7.35
Figure 7.36
Figure 7.37
Figure 7.38
Figure 7.39
Figure 7.40
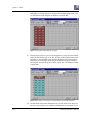
Simulator Choice in the Preferences Dialog Box. . . . . . . . . . . . . . . . . . . . . . . . . . . .
Plate Section with Simulated Data . . . . . . . . . . . . . . . . . . . . . . . . . . . . . . . . . . . . . . .
Display Dialog Box Updated with Low and High Limit Settings . . . . . . . . . . . . .
Plate Display with Data Displayed as Gray Scale . . . . . . . . . . . . . . . . . . . . . . . . . .
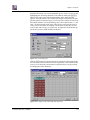
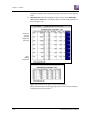
The Group Section for Standards . . . . . . . . . . . . . . . . . . . . . . . . . . . . . . . . . . . . . . . .
A Portion of the Standard Group Section with Formulas Shown
(by Pressing the CTRL+Shift Keys). . . . . . . . . . . . . . . . . . . . . . . . . . . . . . . . . . . . . . .
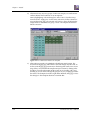
Standards Group Section with Formula Shown for Highlighted Column
(MeanValue) . . . . . . . . . . . . . . . . . . . . . . . . . . . . . . . . . . . . . . . . . . . . . . . . . . . . . . . . . .
Sizing the Concentration Column Wider. . . . . . . . . . . . . . . . . . . . . . . . . . . . . . . . . .
Columns Before and After Autosize. . . . . . . . . . . . . . . . . . . . . . . . . . . . . . . . . . . . . .
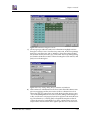
Calculation Dialog Box . . . . . . . . . . . . . . . . . . . . . . . . . . . . . . . . . . . . . . . . . . . . . . . . .
New MaxValue Column Appended to Standards Section . . . . . . . . . . . . . . . . . . .
Summaries in the Standards Section . . . . . . . . . . . . . . . . . . . . . . . . . . . . . . . . . . . . .
Calculation Dialog Box from Summary in Standards Section . . . . . . . . . . . . . . . .
Standard Section Before and After Hide Replicates . . . . . . . . . . . . . . . . . . . . . . . . .
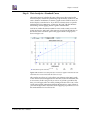
Standard Curve Graph Section—Linear Fit Applied . . . . . . . . . . . . . . . . . . . . . . . .
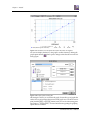
Standard Curve Graph Section with 4-Parameter Fit Applied. . . . . . . . . . . . . . . .
Graph Options Dialog Box . . . . . . . . . . . . . . . . . . . . . . . . . . . . . . . . . . . . . . . . . . . . . .
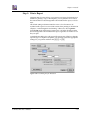
Print Dialog Box for Macintosh . . . . . . . . . . . . . . . . . . . . . . . . . . . . . . . . . . . . . . . . . .
Print Dialog Box for Windows (Epson Stylus 800 Shown) . . . . . . . . . . . . . . . . . . .
Figure 8.1
Figure 8.2
Figure 8.3
Figure 8.4
Figure 8.5
Figure 8.6
Example of an Alert Message . . . . . . . . . . . . . . . . . . . . . . . . . . . . . . . . . . . . . . . . . . . . 8-3
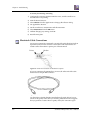
8-Pin Din Connection to Macintosh Computer. . . . . . . . . . . . . . . . . . . . . . . . . . . . . . 8-8
8-Pin DIN to 8-Pin DIN Serial Cable. . . . . . . . . . . . . . . . . . . . . . . . . . . . . . . . . . . . . . . 8-8
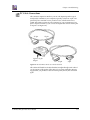
25-Pin DIN to 25-Pin or 9-Pin Serial Cable . . . . . . . . . . . . . . . . . . . . . . . . . . . . . . . . . 8-9
About This Macintosh Dialog Box . . . . . . . . . . . . . . . . . . . . . . . . . . . . . . . . . . . . . . . 8-11
SOFTmax PRO for Lmax Info Dialog Box . . . . . . . . . . . . . . . . . . . . . . . . . . . . . . . . . 8-12
Figure 7.28
7-19
7-20
7-20
7-21
7-22
7-23
7-23
7-24
7-25
7-25
7-26
7-27
7-27
7-28
7-29
7-30
7-30
7-31
7-32
Tables
Table 3.1
Table 3.2
Table 3.3
Table 3.4
Notes Section Menu Commands and Tool Bar Buttons . . . . . . . . . . . . . . . . . . . . .
Plate Section Menu Commands and Tool Bar Buttons . . . . . . . . . . . . . . . . . . . . . .
Group Section Menu Commands and Tool Bar Buttons . . . . . . . . . . . . . . . . . . . . .
Graph Section Menu Commands and Tool Bar Buttons . . . . . . . . . . . . . . . . . . . . .
Table 4.1
Table 4.2
Features Available in the Instrument Settings Dialog Box . . . . . . . . . . . . . . . . . . . . 4-4
Columns Created and Their Formulas . . . . . . . . . . . . . . . . . . . . . . . . . . . . . . . . . . . . 4-18
Table 5.1
Minimum Number of Standards Required for Curve Fits . . . . . . . . . . . . . . . . . . . 5-43
Table 6.1
PC File Name Extensions and Macintosh Document Types
for Use with File Exchange. . . . . . . . . . . . . . . . . . . . . . . . . . . . . . . . . . . . . . . . . . . . . . . 6-8
ASCII Data File Fields and Descriptors . . . . . . . . . . . . . . . . . . . . . . . . . . . . . . . . . . . 6-19
ASCII Template File Columns and Descriptions . . . . . . . . . . . . . . . . . . . . . . . . . . . 6-21
New vs. Duplicate within an Experiment . . . . . . . . . . . . . . . . . . . . . . . . . . . . . . . . . 6-25
Actions Protected by Password . . . . . . . . . . . . . . . . . . . . . . . . . . . . . . . . . . . . . . . . . . 6-26
Table 6.2
Table 6.3
Table 6.4
Table 6.5
xii
3-12
3-14
3-15
3-18
SOFTmax PRO for Lmax User’s Manual
Chapter 1: Welcome to SOFTmax PRO for Lmax
Introduction . . . . . . . . . . . . . . . . . . . . . . . . . . . . . . . . . . . . 1-3
About the Documentation . . . . . . . . . . . . . . . . . . . . . . . . 1-4
Conventions Used in This Manual . . . . . . . . . . . 1-5
Getting Help . . . . . . . . . . . . . . . . . . . . . . . . . . . . . . . . . . . 1-7
Macintosh On-Line Help . . . . . . . . . . . . . . . . . . . 1-7
Windows On-Line Help . . . . . . . . . . . . . . . . . . . . 1-8
Troubleshooting and Technical Support . . . . . 1-10
Glossary of Terms . . . . . . . . . . . . . . . . . . . . . . . . . . . . . . 1-11
Chapter 1: Welcome to SOFTmax PRO for Lmax
1-2
SOFTmax PRO for Lmax User’s Manual
Chapter 1: Welcome to SOFTmax PRO for Lmax
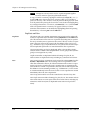
Introduction
The Lmax™ Microplate Luminometer uses SOFTmax PRO® for Lmax software. This software allows you to create files containing all of the parameters
required to acquire and analyze data from the Lmax. SOFTmax PRO for Lmax
(version 1.0L) is available in either Macintosh or Windows format. The
Macintosh version of the software is a fat binary application that includes
native code for both 68K and Power Macintosh computers. The Windows version is a 32-bit application that is Windows 95/98/2000 and Windows NT 4.0
compliant.
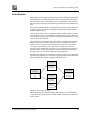
SOFTmax PRO for Lmax is powerful, yet easy to use. It performs three major
functions:
• Instrument Control: You can set up and run a complete assay. Instrument
settings can be saved as a protocol file and used repeatedly for reading different microplates.
• Data Collection: SOFTmax PRO for Lmax collects and stores all raw data
received from the Lmax. Data is displayed on the computer screen in a grid
format that corresponds to the wells in a microplate. How the data is shown
depends on other settings made using the software.
• Data Reduction and Plotting: You can reduce the data using built-in formulas or you can define custom reduction formulas. More than one reduction can be shown and results from different microplates can be compared
within the same experiment.
SOFTmax PRO for Lmax can collect data from one or more microplates and
store it in a single data file, using the same or different instrument settings for
different microplates. Four read modes are possible using SOFTmax PRO for
Lmax,:
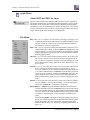
• Endpoint: Allows a single integration of samples in 96- or 384-well plates
with two injections possible, if desired, in any or all wells of a 96-well plate
(no injection possible in 384-well plates). A pre-read of the microplate may
be made before injection of buffer or reagent and/or reading of the samples.
The signal is integrated for each well over a user-selectable reading time
(maximum 5000 seconds). You can program a delay after each injection, if
desired (no minimum delay for the M injector; the P injector has a minimum delay of 1.6 seconds; both have a maximum setting of 1000 seconds),
and you can read all or only some of the wells in the plate. Default values
reported are relative luminescence units (RLU).
• Dual Read: Also an endpoint reading, this mode is designed to perform two
separate integrations, one after each of two possible injections in any or all
wells of a 96-well microplate (no injection possible in a 384-well plate). Integration times for both readings must be the same (minimum integration
time is 0.1 second; maximum is 1000 seconds). You may program a delay
after each injection, if desired (no minimum delay for the M injector; the P
injector has a minimum delay of 1.6 seconds; both have a maximum setting
of 1000 seconds). You may read only some or all of the wells in the plate;
pre-reading the microplate is not possible with this mode. Default values
reported are relative luminescence units (RLU).
SOFTmax PRO for Lmax User’s Manual
1-3
Chapter 1: Welcome to SOFTmax PRO for Lmax
• Long Kinetics: Allows repeated measurements on one or more wells of a 96or 384-well microplate. Pre-reading the microplate is not possible with this
mode. One or two injections can be made in any or all wells of a 96-well
plate at the beginning of the reading (no injection possible in 384-well
plates). An important application for this mode is cellular luminescence
(see page B-5). Default data reductions for kinetic data are Vmax per Sec,
Vmax, Time to Vmax, or Onset Time.
• FastKinetics: Allows repeated measurements of one or more wells of a 96or 384-well microplate up to a 100-point maximum integration. Pre-reading
the microplate is not possible with this mode. One or two injections can be
made in each well of a 96-well plate at the start of the reading (no injection
possible in 384-well plates). Integration time can be set from 1 to 100 seconds. Default data reductions for kinetic data are Vmax per Sec, Vmax,
Time to Vmax, or Onset Time.
About the Documentation
The SOFTmax PRO for Lmax documentation set consists of this manual, an
on-line help system, and a formula reference manual. Additional documents
on disk may also be provided to cover the latest information regarding the
software. An outline of the contents of this manual follows, along with introductory information that should help you get started using SOFTmax PRO
for Lmax,.
NOTE: Screens and parts of screens represented in this manual may depict
either the Macintosh or the Windows version of the software. The
two interfaces are quite similar, but bear subtle differences such as
where the Help menu is located, etc. Depending upon which computer platform you are using, which operating system you are using,
and the type of screen that is depicted, your screen may look different
from the one shown. Note that Macintosh screens are depicted using
OS versions 7 through 9.
• The rest of this chapter, “Welcome to SOFTmax PRO for Lmax,” provides
introductory information regarding the program and its features.
A glossary of terms is included at the end of this chapter.
• Chapter 2, “Installation,” contains basic information about installing the
program on your computer and making sure the correct connections are
made between the computer and the instrument.
• Chapter 3, “SOFTmax PRO for Lmax Overview,” explains how SOFTmax
PRO for Lmax is organized and how it is used with the Lmax.
• Chapter 4, “Reading Microplates,” contains instructions regarding how to
prepare for and conduct a reading using SOFTmax PRO for Lmax,.
• Chapter 5, “Displaying and Analyzing Data,” describes how data is displayed during and after a reading and how this display can be customized.
Additionally it describes data reduction and the different means for analyzing the raw data received from the Lmax.
• Chapter 6, “File Management and Printing,” explains the printing options
available within SOFTmax PRO for Lmax along with how to customize
reports. Other topics include managing files and importing, exporting,
1-4
SOFTmax PRO for Lmax User’s Manual
Chapter 1: Welcome to SOFTmax PRO for Lmax
copying, pasting, and duplicating data, both within SOFTmax PRO for
Lmax as well as to and from other external programs.
• If you are new to SOFTmax PRO for Lmax, Chapter 7, “Tutorial,”provides a
written series of steps that will help you learn the basics of working with
the software.
• Chapter 8, “Troubleshooting,” describes alert messages that may appear
while using SOFTmax PRO for Lmax and what to do if they occur. Other
information in this chapter pertains to possible communication problems
with the Lmax and other computer-related issues.
This manual assumes that you are familiar with the basic operating environment of your computer. We recommend that you become familiar with
your computer’s operating environment prior to installing and using
SOFTmax PRO.
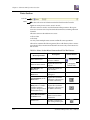
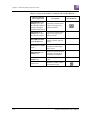
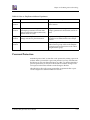
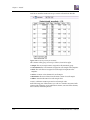
Conventions Used in This Manual
This manual uses visual cues and standard text formats as follows.
Visual Cues
The following typographic conventions are used in this manual.
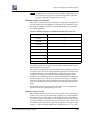
Format
Meaning
Menu Item
Menu titles and menu items.
Text Entry/Key Name Entries that you type from the keyboard or keys that
you press on the keyboard. Information shown in this
font should be entered exactly as it appears.
Text Entry
Placeholders for information you must provide. for
Example, if you are asked to type filename, you should
type the actual name for the file instead of the word
shown in this other font.
[Button]
Buttons shown on the screen. Note that sometimes an
actual representation of the button may be shown.
The accompanying text applies only to SOFTmax PRO for Lmax for
Macintosh.
The accompanying text applies only to SOFTmax PRO for Lmax for
Windows.
SOFTmax PRO for Lmax User’s Manual
1-5
Chapter 1: Welcome to SOFTmax PRO for Lmax
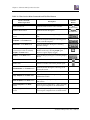
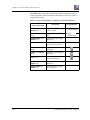
Keyboard Formats
Key designations, combinations, and sequences appear in the following
formats.
Format
Meaning
Key
Selections on the Macintosh can be made using the mouse, but
often shortcuts are available using the keyboard. Shortcuts commonly use the command () key in conjunction with another key
and are shown with the command key symbol () followed by
the accompanying key. To use a shortcut, you must press and hold
the command key while pressing the second key.
Key1+Key2 A plus sign (+) between key names means to press and hold down
the first key while you press the second key (within Windows). For
example, “press ALT+ESC” means to press and hold down the
ALT key and press the ESC key. Then release both keys.
Key1, Key2 A comma (,) between key names means to press and release the keys
one after the other. For example, “press ALT, F” means to press and
release the ALT key, and then press and release the F key.
NOTE: The names of keys found on different Windows-compatible PC
computer keyboards may vary somewhat from machine to machine.
The key names shown in this manual reflect typically used key
names. Yours should be similar but may not be exactly like those
shown. For example, the “print screen” key may be shown on some
keyboards as “Prt Scrn”; other keyboards may spell out the complete
key name.
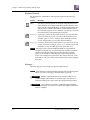
Messages
The following types of messages may appear in this manual:
NOTE: Calls attention to information that should be followed during installation, use, and/or servicing of the instrument or software.
! CAUTION: Indicates a potentially hazardous situation which, if not
avoided, might result in minor or moderate injury, loss of data, or
mechanical damage. It is also used to alert against unsafe practices.
WARNING: Used whenever an action or condition might potentially
cause serious injury to yourself or to others who might use the instrument or computer.
1-6
SOFTmax PRO for Lmax User’s Manual
Chapter 1: Welcome to SOFTmax PRO for Lmax
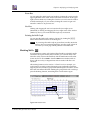
Getting Help
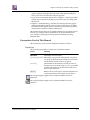
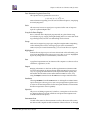
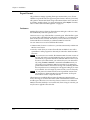
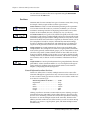
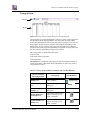
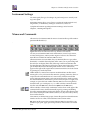
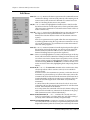
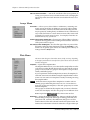
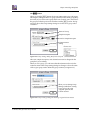
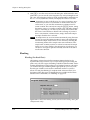
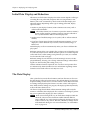
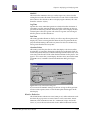
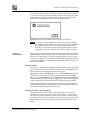
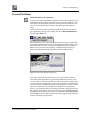
Macintosh On-Line Help
On-line help is available while working with SOFTmax PRO for Lmax for the
Macintosh by clicking the Help menu at the far right of the menu bar.
Click here
for the Help Menu
SOFTmax PRO for Lmax
Help Options
Figure 1.1: Help Menu for SOFTmax PRO for Lmax for the Macintosh
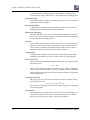
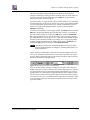
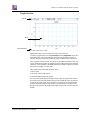
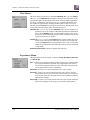
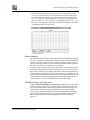
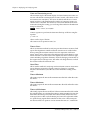
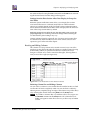
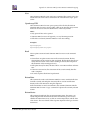
Choosing either of the two help options at the bottom of this menu (SOFTmax
PRO for Lmax Help or Formula Help) causes a Help window to appear. This
window provides a list of topics on the left and information about the
selected topic on the right. Figure 1.2 shows the window for Formula Help. In
this figure, the topic “Math Functions” has been selected (on the left) and the
corresponding information about that topic appears on the right.
Figure 1.2: Formula Help Window
SOFTmax PRO for Lmax User’s Manual
1-7
Chapter 1: Welcome to SOFTmax PRO for Lmax
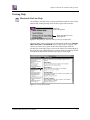
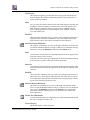
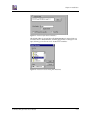
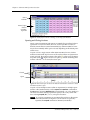
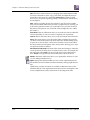
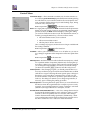
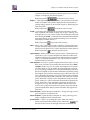
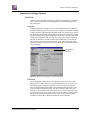
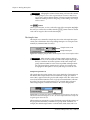
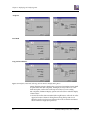
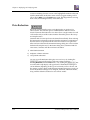
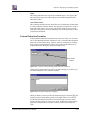
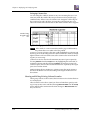
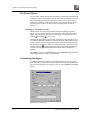
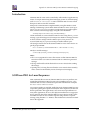
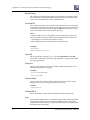
Windows On-Line Help
You can access on-line help within SOFTmax PRO for Lmax for Windows by
selecting the Help menu in the menu bar. Three types of help are immediately
available: you can view the contents of the help file, seek specific help about
formulas, or get general information about how to use the help function.
Click here
for the Help Menu
or press ALT, H
SOFTmax PRO for Lmax Help Options
Figure 1.3: Help Menu for SOFTmax PRO for Lmax for Windows
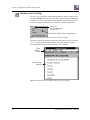
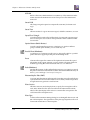
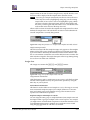
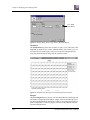
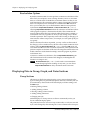
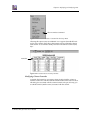
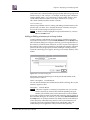
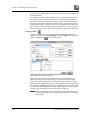
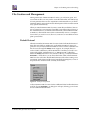
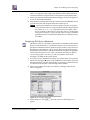
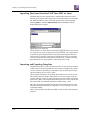
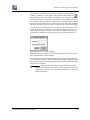
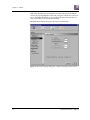
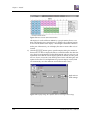
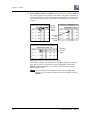
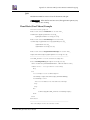
Choosing Contents (by clicking on the menu item with the mouse or pressing
ALT, H, C) brings up the SOFTmax PRO for Lmax help Contents window,
showing the general organization of the help that is available.
Help
Window
Menu
Contents of the
Help File
Figure 1.4: Help Contents for SOFTmax PRO for Lmax for Windows
1-8
SOFTmax PRO for Lmax User’s Manual
Chapter 1: Welcome to SOFTmax PRO for Lmax
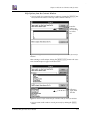
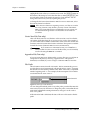
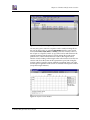
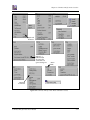
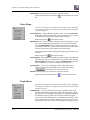
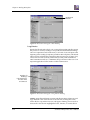
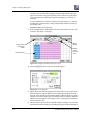
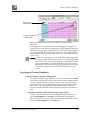
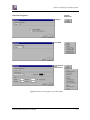
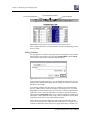
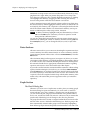
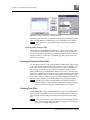
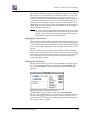
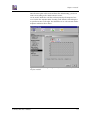
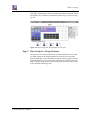
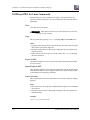
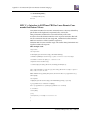
Help Options from the Contents Window
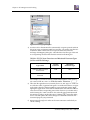
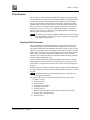
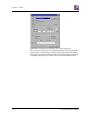
• You can search for a particular item or subject by clicking the [Search] button (located in the tool bar at the top of the Contents window).
Enter the
subject you
are searching
for in this
box
Figure 1.5: Using the Search Function within Help in SOFTmax PRO for Lmax for
Windows
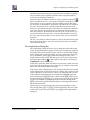
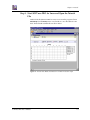
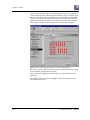
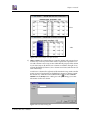
After entering a search subject, clicking the [Show Topics] button will cause
a list of related topics to appear in the box below.
Choose a
topic from
this list
Figure 1.6: Choose a Topic within Help in SOFTmax PRO for Lmax for Windows
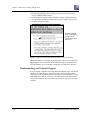
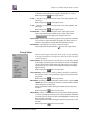
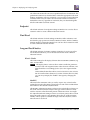
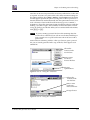
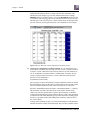
• You can return to the window viewed previously by clicking the [Back]
button.
SOFTmax PRO for Lmax User’s Manual
1-9
Chapter 1: Welcome to SOFTmax PRO for Lmax
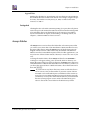
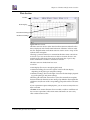
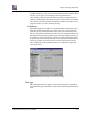
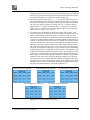
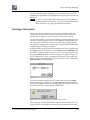
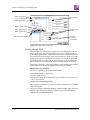
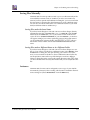
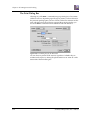
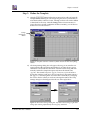
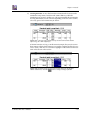
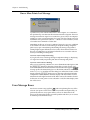
• Clicking the [History] button will provide a list of all areas you have
viewed within the Help function.
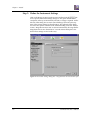
• Text that appears in green with an underline contains a hypertext link to
more detailed information about that item. Figure 1.7 below shows some
examples of hypertext links.
Hypertext linked
item (clicking here
will give more
information about
this item)
Figure 1.7: Hypertext Links within SOFTmax PRO for Lmax for Windows
Additional options are available, depending upon where you are within the
Help function. More information about Windows Help can be found in the
Microsoft Windows User’s Guide that accompanies your Windows software.
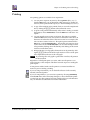
Troubleshooting and Technical Support
If you encounter a problem while using SOFTmax PRO for Lmax, refer first to
Chapter 8, "Troubleshooting," and try to locate a remedy for the problem.
For problems with SOFTmax PRO for Lmax that are not listed there, or if you
need additional assistance, in the U.S., call Molecular Devices Technical Services group at 800-635-5577 or 408-747-1700; elsewhere, call your local representative.
1-10
SOFTmax PRO for Lmax User’s Manual
Chapter 1: Welcome to SOFTmax PRO for Lmax
Glossary of Terms
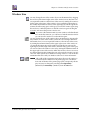
Active
The window or icon that you are currently using or that is currently selected.
The active section is the section in which you are currently working. The title
bar for the active section or window will be highlighted (gray); inactive sections are not highlighted (white). Only one section or window can be active at
a time. To make a section or window active, click anywhere within it. If you
scroll past the bottom or top of the active section, the tool bar for that section
“sticks” to the top of the window (you can always tell which section is active
in this way and can always access the items in its tool bar).
ANSI Character Set
The American National Standards Institute 8-bit character set. It contains 256
characters.
Area Under Curve
Reduction formula for a kinetic reading that determines the area under the
kinetic plot, or under a plot in a Graph section. First the area under the curve
is divided into a series of trapezoids; then the area defined by each trapezoid
is computed and all areas are summed.
ASCII Character Set
The American Standard Code for Information Interchange 7-bit character set.
It consists of the first 128 (0–127) characters of the ANSI character set (and
most other 8-bit character sets). The ASCII character set is the most universal
character-coding set.
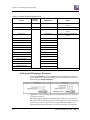
Autosave
Enabling the Autosave feature in the Preferences dialog box will save a data
file automatically each time a plate is read. You can Autosave to one of two
different file formats: SOFTmax PRO for Lmax (used to save your data automatically in SOFTmax PRO for Lmax format) or Text File (used when you
want to have the data available for use with a spreadsheet or other program
for data analysis external to SOFTmax PRO for Lmax).
Blanking
Pre-Read Blanking subtracts background signal caused by the microplate
itself, as well as by solvents, reagents, or samples. This feature is available
only for endpoint mode. The individual blank reading from each well can be
subtracted from the final reading from the same individual wells (choose
“Pre-read plate” from within the Instrument Settings dialog box).
Plate Blanks are created by entering a Blank group in the template. After a
reading, the average of the blank values obtained from the Blank group is
subtracted from all wells in the plate. Plate blanks can be used with all read
modes.
Group-Associated Blanks are created by placing blank wells within a group
in the template. The values of group blanks are averaged and subtracted from
the values of the wells within that group only.
SOFTmax PRO for Lmax User’s Manual
1-11
Chapter 1: Welcome to SOFTmax PRO for Lmax
Checkbox
A small, square box that appears in a dialog box and that can be selected or
cleared. When the checkbox is selected, an X appears in the box. A checkbox
represents an option that you can turn on or off.
Clear
Within the Template Editor, Clear removes information that was designated
previously for selected wells. By highlighting wells and then choosing Clear,
any information regarding those wells will be erased (the wells will return to
their default status of empty). Note that if you clear the entire template, the
groups themselves will not be deleted and are still selectable. Keeping the
groups allows you to reassign wells without having to recreate groups.
Click
You click an object on the screen by pressing and quickly releasing the mouse
button while the pointer is on that object. When you click once on an object,
such as an icon or file name, it becomes highlighted, which means it is
selected. Whatever action you choose next will affect a selected object.
Clipboard
A temporary storage location within the operating system used to transfer
data within and between files and applications.
Concentration
The amount of a substance present per unit volume. Used as the default sample descriptor for a series of samples.
Control
A sample that is run as an internal check of the assay. The control has a predictable or known assay result against which other results can be compared.
Control Menu Box (Windows)
The icon that opens the Control menu for the window. It is located at the left
of the SOFTmax PRO for Lmax title bar. The Control menu can be activated
by clicking in this box with the mouse or by pressing ALT, SPACEBAR.
Copy
A function common to most software applications that duplicates the selected
text or item and places this duplicate on the clipboard. The copy function is
enabled by pressing C on the Macintosh and CTRL+C in Windows.
Copy-and-Paste
A method of copying selected text or graphics from one location and pasting
them to a different location in the same file or into another file (which could
be in an application other than SOFTmax PRO for Lmax).
Cubic Spline (Curve Fit)
This curve fitting option generates a fit to a cubic equation between each pair
of data points. The cubic equations are computed such that these equations
and their first two derivatives are continuous everywhere.
More information regarding curve fits can be found in Chapter 5, “Displaying
and Analyzing Data.”
1-12
SOFTmax PRO for Lmax User’s Manual
Chapter 1: Welcome to SOFTmax PRO for Lmax
Curve Fit
Specifies the type of curve (linear, logarithmic, quadratic, and so on) that is
applied to the data points in a plot. The curve is a graphic representation of
the mathematical relationship between the data points in the plot. More information regarding curve fits can be found in Chapter 5, “Displaying and Analyzing Data.”
Cut
A function common to most software applications that removes a selection of
text or graphics and places it on the clipboard. The cut function is enabled by
pressing X on the Macintosh and CTRL+X in Windows.
Cut-and-Paste
A method of moving selected text or graphics from one location to a different
location in the same file or into another file (which could be in an application
other than SOFTmax PRO for Lmax).
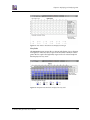
Data Display
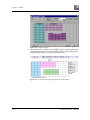
Located in the Plate section, the data display is a grid that corresponds to the
layout of the wells in the microplate. This display can show the results of the
reading in various formats [for example: raw signal data (RLU), reduced data
(number or plot), Threshold, Ranged, and Gray Scale].
Data File
Contains the raw data collected from the instrument, as well as any associated
sections or settings (Notes, Graphs, Groups, Instrument Setup, Display
Options, and Data Reductions).
Default Protocol
A protocol file, included with the SOFTmax PRO for Lmax program or created by a user. The Default Protocol file defines the initial information that
will appear when you open SOFTmax PRO for Lmax or when you create a
new file from within the program.
Desktop
The background on which windows and icons appear.
Dialog Box
A rectangular window that appears temporarily to request information. Some
dialog boxes have options you must choose before SOFTmax PRO for Lmax
can carry out a command and must be closed before you can continue in the
software.
Dilution Factor
Specifies the amount of dilution for a given sample. This factor can be multiplied against interpolated values to determine concentration of undiluted
sample.
Dimmed
Unavailable or disabled. A dimmed button or command is displayed in light
gray instead of black and it cannot be chosen.
SOFTmax PRO for Lmax User’s Manual
1-13
Chapter 1: Welcome to SOFTmax PRO for Lmax
Double-Click
To rapidly press and release the mouse button twice while the pointer is on an
object. Double-clicking carries out an action, such as opening an icon.
Drag
To move an object on the screen by clicking it, holding down the mouse button, and then moving the mouse. Also to select an item in a list by dragging
through the list or to select multiple items by dragging across them.
Dual Read
An endpoint reading, this mode is designed to perform two separate integrations, one after each of two possible injections in any or all wells of a 96-well
microplate (no injection is possible in a 384-well plate).
Duplicate
A command available in the Edit menu that allows you to create identical copies (except data) of all sections and experiments. The name of the duplicated
item will be the same as the previously active item with the word “Copy”
appended.
Endpoint
A single integration of samples in 96- or 384-well plates with two injections
possible, if desired, in any or all wells of a 96-well plate (no injection possible
in 384-well plates).
End Time
Reduction parameter used to omit the end of a kinetic run from data reduction.
Export
Data from SOFTmax PRO for Lmax is copied to a new file that can be opened
by another program such as a spreadsheet or word processing application.
Data from some or all Plate or Group sections may be exported as tab-delimited ASCII files.
Exponential (Curve Fit)
The exponential function used to generate this curve fit is:
y = A + B * (1 - exp^(-x / C))
More information regarding curve fits can be found in Chapter 5, “Displaying
and Analyzing Data.”
Fast Kinetics
During fast kinetics readings, data is collected over time, with multiple readings made at regular intervals up to a specified number of points. The values
calculated based on raw kinetic data are Vmax, Vmax per Sec, Time to Vmax,
and Onset Time.
Fluorophore
A material which absorbs light energy of a characteristic wavelength, undergoes an electronic state change, and instantaneously emits light of a longer
wavelength.
1-14
SOFTmax PRO for Lmax User’s Manual
Chapter 1: Welcome to SOFTmax PRO for Lmax
Four Parameter Logistic (Curve Fit)
The equation used to generate this curve fit is:
y = ((A - D) /(1 + (x /C)B)) + D
More information regarding curve fits can be found in Chapter 5, “Displaying
and Analyzing Data.”
Gain
The amount of increase in signal power expressed as the ratio of output to
input for a photomultiplier tube.
Gray Scale Data Display
Raw or reduced data is displayed proportionally in a plate format using
seven shades of gray, ranging from light shading at the low end to dark shading at the high end, based on user-defined high and low limits.
Group
Wells can be assigned to group types using the Template Editor. Depending
on the default protocol used, certain group types (such as Standard or
Unknown) may be created automatically; you can create others as required.
Highlighted
Indicates that an object or piece of text is selected and will be affected by your
next action. Highlighted text appears in reverse video or in color. Highlighted
objects may change color or be surrounded by a selection cursor.
Icon
A graphical representation of an element of the computer or software such as
a disk drive, application, or file.
Import
Bringing information or data from another application into SOFTmax PRO
for Lmax. Information can be brought into SOFTmax PRO for Lmax in two
ways: by copying tab-delimited text to the clipboard and then pasting this
information into the Plate section within SOFTmax PRO for Lmax; or by
using the Import command under the File menu to import ASCII text files.
Incubator
Choosing Incubator from the Control menu or clicking the incubator button
opens a dialog box allowing you to start or stop temperature regulation and
to select an elevated temperature for the microplate chamber on instruments
that have temperature control capability.
Injection
The process of adding reagent and/or buffer to a microplate well. Lmax has
two injectors that may be used wiht the 96-well plate format (injection not
available with 384-well plates).
Instrument Icon
Located in the status bar, the instrument icon shows the status of the connection between the computer and the instrument. If the icon has an “X” through
SOFTmax PRO for Lmax User’s Manual
1-15
Chapter 1: Welcome to SOFTmax PRO for Lmax
it, the connection is not functioning or no instrument is connected; if the
instrument icon appears without an “X,” the connection is working properly.
Instrument Setup
Defines the parameters (read mode, run time, read interval, etc.) used to integrate data from the microplate.
Interleaved Display
A display choice available with 384-well plates is useful when four 96-well
daughter plates are combined into one 384-well plate.
Interprocess Messaging
Messages that can be sent to and received from other applications. This feature is very useful for interfacing Lmax with robotic systems and for sending
and receiving data from LIMS systems.
Lag Time
Lag time is the period of time in a kinetic assay of very slow growth (microorganisms) or rate of reaction that may precede the rapid (or linear) phase of
reaction. When a lag time is specified in SOFTmax PRO for Lmax, data collected prior to the lag time is not included in data reduction.
Large Display
A display choice available with 384-well plates. This setting is useful when
looking at large numbers if you have a larger (17-inch or greater) monitor.
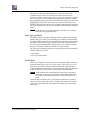
Linear (Curve Fit)
The linear function fits the best straight line to the data. The equation for this
fit has the form of:
y = A + Bx
where A is the y-intercept of the line and B is the slope. A linear fit should be
used whenever the values appear to lie on or scattered around a straight line.
More information regarding curve fits can be found in Chapter 5, “Displaying
and Analyzing Data.”
Log-Logit (Curve Fit)
The Log-Logit is also called a two-parameter curve fit. The equation used to
generate this curve fit is:
y = ((A - D) / (1 + (X /C)B)) + D
More information regarding curve fits can be found in Chapter 5, “Displaying
and Analyzing Data.”
Long Kinetics
During long kinetics readings, data is collected over time, with multiple readings made at regular intervals. The values calculated based on raw kinetic
data are Vmax, Vmax per Sec, Time to Vmax, and Onset Time.
1-16
SOFTmax PRO for Lmax User’s Manual
Chapter 1: Welcome to SOFTmax PRO for Lmax
Luminescence
The emission of light by processes that derive energy from essentially nonthermal changes, the motion of subatomic particles, or the excitation of an
atomic system by radiation.
Mask
Lets you “hide” the data in selected wells of the Plate display so that the data
stored there will not be used for calculations and will not be reported. The
Mask function is commonly used to suppress outliers. Masked wells are
shown with diagonal lines across them and the word “Masked” is shown
over each masked well.
MaxRLU
The limit for the maximum value you wish to use for displaying and analyzing kinetic data. The default is 20,000 RLU. Any values that are above this
limit will not be shown and will be excluded from data reduction.
Maximize Button (Windows)
The small box containing an up arrow at the right of the title bar. Mouse users
can click the Maximize button to enlarge a window to its maximum size. Keyboard users can use the Maximize command on the Control menu.
Menu
A list of items, most of which are commands. Menu item names appear in the
menu bar at the top of the window.
To choose an item in a menu, place the pointer on the menu heading and drag
to the selection you desire—then release the mouse button.
Menu Bar
A list of items, most of which are commands. Menu item names appear in the
menu bar (the horizontal bar that appears below the title bar at the top of the
window).
MinRLU
The limit for the minimum value you wish to use for display and analysis of
kinetic data. Any values that are under this limit will not be shown and will
be excluded from data reduction. The default is 0. To display negative Kinetics, the value should be set below 0 (zero).
Minimize Button (Windows)
The small box containing a down arrow at the right of the title bar. Mouse
users can click the Minimize button to reduce a window to its icon. Keyboard
users can use the Minimize command on the Control menu. A minimized
application continues running and you can select the icon to make it the
active application.
Modem Port (Macintosh)
A serial communication port on the back panel of the Macintosh marked with
the icon of a telephone handset (Ê).
Normal Display
The default display for 384-well plates.
SOFTmax PRO for Lmax User’s Manual
1-17
Chapter 1: Welcome to SOFTmax PRO for Lmax
NVRAM
Refers to the Non-Volatile Random Access Memory of the instrument. Information stored in the NVRAM is not lost when power to the instrument is
turned off.
Onset RLU
The change in signal required to compute the onset time (for kinetic readings).
Onset Time
The time it takes for a given increase in signal, called the onset RLU, to occur.
Open/Close Triangle
A small triangle located on the left-hand side of section and experiment tool
bars. Used to open/close sections and experiments within a SOFTmax PRO
for Lmax file.
Option Button (Radio Button)
A small, round button that appears in a dialog box or window. Within a
group of related option buttons, you can select only one.
Parallel Port (Windows)
A connection on a computer, usually LPT1, to plug in the cable for a parallel
printer. Windows supports parallel ports LPT1 through LPT3.
Paste
A function that copies the contents of the clipboard and inserts this copied
information at the current selection or cursor position. The paste function is
enabled by pressing V on the Macintosh and CTRL+V in Windows.
Path (Windows)
Specifies the location of a file within the directory tree. For example, to specify
the path of a file named ASSAY.BAT located in the SOFTmaxPRO directory on
drive C, you would type c:\softmaxpro\assay.bat.
Photomultiplier Tube (PMT)
A vacuum tube that detects light especially from dim sources through the use
of photoemission and successive instances of secondary emission to produce
enough electrons to generate a useful current.
Plate Section
The Plate section is used to display data, to specify how microplates will be
read, and to define how the data received from the instrument should be
reduced. The data display in this section is a matrix that corresponds to the
well format of the microplate in use.
Plate Type
A choice in the Instrument Settings dialog box to distinguish between 96- and
384-well microplates. The specification of the plate type depends on the well
format and manufacturer of the microplate.
1-18
SOFTmax PRO for Lmax User’s Manual
Chapter 1: Welcome to SOFTmax PRO for Lmax
Point (Using the Mouse)
You point to an object on the screen by moving the mouse so that the pointer
is positioned on that object. When the pointer is an arrow, the tip of the arrow
must be on the object.
Point-to-Point
This curve-fitting option fits a linear equation to each pair of data points.
Port
A connection or socket on the computer. Ports are common used for connecting devices, such as printers or monitors, to your computer, and for sending
information to and/or from your computer to such devices.
Protocol File
Contains the template(s), instrument settings, and reduction parameters. Protocol files are useful if you repeat a particular type of assay frequently.
Quadratic (Curve Fit)
A mathematical description of a parabola:
y = A + Bx + Cx2
RAM (Random Access Memory)
The memory that can be used by applications to perform necessary tasks
while the computer is on. When you turn the computer off, all information in
RAM is lost.
Ranged Data Display
Raw or reduced data is assigned proportionally to integer values from 0
through 9 based on user-defined limits. Values above the high limit are displayed as plus (+) and values below the low limit are displayed as minus (-).
Raw Data
Signal reported as RLU from the Lmax with no alteration.
Read Interval
The interval of time between the start of one reading and the start of the next
reading during a kinetic run.
Read Button or Command
Starts the reading process and shows the endpoint, dual read, or kinetic data
in the data display of the Plate section.
Read Mode
The method used to read the microplate: endpoint, dual read, or kinetic.
Reduced Data
Data reduction causes the raw signal values reported by the instrument to be
calculated and displayed according to user-defined formula settings.
Reduction Limits
Sets limits on data to be included in data reduction for kinetic readings.
SOFTmax PRO for Lmax User’s Manual
1-19
Chapter 1: Welcome to SOFTmax PRO for Lmax
Restore Box (Windows)
The small box containing both an up and a down arrow at the right of the title
bar. The Restore box appears only after you have enlarged a window to its
maximum size. Mouse users can click the Restore box to return the window to
its previous size. Keyboard users can use the Restore command on the Control menu.
Rotated Display
A display option for 384-well plates that shows the plate rotated 90 degrees.
Scroll
To move up, down, right, or left through text or graphics in order to see parts
of the file or list that cannot fit on the screen. A scroll bar appears at the bottom and/or right edge of a window whose contents are not entirely visible.
Each scroll bar contains a scroll box and two scroll arrows. A scroll box is a
small box that shows the position of information currently in the window or
list box relative to the contents of the entire window. A scroll arrow is an
arrow on either end of a scroll bar that you can use to scroll through the contents of the window or list box.
Semi-Log (Curve Fit)
The semi-log function fits the best straight line to a set of data for log(X) plotted against Y. The resulting curve displayed will be a straight line with the Xaxis drawn in logarithmic scale.
Serial Port (Windows)
A connection on a computer, usually COM1, where you plug in the cable for a
serial device such as a plate reader, a printer, or a modem. Serial, asynchronous, and RS232 interfaces are all the same type by which the computer sends
single bits of information to the connected device, one after the other. Windows supports COM1 through COM4. The Lmax requires COM1 or COM2.
Series
Lets you assign a set of wells within groups in the Template so that the standard value or dilution factor increases or decreases in specified steps and the
name increments as well.
Slope
A reduction option for a kinetic run that determines the slope of the combined plot (i.e., the slope of the line using linear regression). This reduction
uses all timepoints visible in the reduction window.
Standard Curve
A mathematically idealized representation of the relationship between the
concentration of a standard calibrator (X-value) and the optical density
(Y-value). The standard curve may be set to a linear, semi-log, log-log, quadratic, 4-parameter logistic, log-logit (2-parameter logistic), exponential, cubic
spline, or point-to-point curve fits.
1-20
SOFTmax PRO for Lmax User’s Manual
Chapter 1: Welcome to SOFTmax PRO for Lmax
Status Bar
Shown above the SOFTmax PRO for Lmax window, the Status Bar contains
the Lmax icon, the current temperature within the microplate chamber, and
buttons allowing you to activate the Read function, the incubator, etc.
Template Editor
A representation of the microplate shown as a grid of wells that can be used
to designate the location of blanks, standards, controls, unknowns, empty
wells, or to assign wells to other groups you create. The template is a map of
the microplate. It tells the software what is in the microplate and where it is
located.
Threshold Data Display
Data is displayed as plus (+) for values above, asterisk (*) for values within,
and minus (-) for values below user-defined limits.
Time at Half Maximum
Reduction for a kinetic run that reports the time at half the maximum signal
within the reduction limits as follows: SOFTmax PRO for Lmax first determines the kinetic point (within the reduction limits) that has the maximum
signal level. It then scans the kinetic plot from left to right until it finds two
points that have signals bracketing one-half of that signal value. A linear
interpolation between these two points is used to estimate the Time at Half
Maximum.
Time at Maximum
Reduction for a kinetic run that reports the time at the maximum signal
within the reduction limits.
Time at Minimum
Reduction for a kinetic run that reports the time at the minimum signal
within the reduction limits.
Time to Vmax
The elapsed time until the maximum reaction rate of a kinetic reading is
reached, reported in seconds.
Title Bar
The horizontal bar (at the top of a window) that contains the title of the window or dialog box. On many windows within the Windows environment, the
title bar also contains the Control-menu box and Maximize and Minimize
buttons. On the Macintosh, the title bar also contains the Close box and Zoom
box.
Undo
Cancels the previous operation (if possible). The paste function is enabled by
choosing Undo from the File menu, pressing V on the Macintosh, or pressing
CTRL+V in Windows.
Vertical Display
A display option for 384-well plates which shows the plate as two 8 × 12
arrays stacked vertically.
SOFTmax PRO for Lmax User’s Manual
1-21
Chapter 1: Welcome to SOFTmax PRO for Lmax
Vmax Points
The number of points in the kinetic curve included in each of a series of
regressions to calculate the maximum rate, Vmax, or the time segment used to
calculate the Time to Vmax.
Vmax (units per sec)
The kinetic rate reported as signal/sec (RLU units per second). It is calculated
using a linear curve fit, y = Ax + B. A creeping iteration is performed using
Vmax Points and the slope of the steepest line segment is reported as Vmax
Rate.
Zoom Box (Macintosh)
A small box containing a smaller box at the right of the title bar. You can click
the Zoom box to return the window to its previous size.
1-22
SOFTmax PRO for Lmax User’s Manual
Chapter 2: Installation
Connect the Hardware . . . . . . . . . . . . . . . . . . . . . . . . . . . . . . . . . . . . 2-3
Computer System Requirements . . . . . . . . . . . . . . . . . . . . . . . . . . . 2-5
Macintosh Computer . . . . . . . . . . . . . . . . . . . . . . . . . . . . . . 2-5
Windows-Compatible Computer. . . . . . . . . . . . . . . . . . . . 2-6
Install SOFTmax PRO for Lmax . . . . . . . . . . . . . . . . . . . . . . . . . . . . 2-7
What Is Installed. . . . . . . . . . . . . . . . . . . . . . . . . . . . . . . . . . 2-8
Enter Registration Information . . . . . . . . . . . . . . . . . . . . . . . . . . . . . 2-8
Communicating with the Lmax . . . . . . . . . . . . . . . . . . . . . . . . . . . 2-10
Set Preferences. . . . . . . . . . . . . . . . . . . . . . . . . . . . . . . . . . . . . . . . . . 2-11
Serial Port . . . . . . . . . . . . . . . . . . . . . . . . . . . . . . . . . . . . . . 2-11
Export Format . . . . . . . . . . . . . . . . . . . . . . . . . . . . . . . . . . . 2-12
Autosave . . . . . . . . . . . . . . . . . . . . . . . . . . . . . . . . . . . . . . . 2-12
Autoprint . . . . . . . . . . . . . . . . . . . . . . . . . . . . . . . . . . . . . . . 2-15
Assays Folder . . . . . . . . . . . . . . . . . . . . . . . . . . . . . . . . . . . . . . . . . . 2-15
Chapter 2: Installation
2-2
SOFTmax PRO for Lmax User’s Manual
Chapter 2: Installation
Connect the Hardware
! CAUTION: Turn OFF the power to both the Lmax and the computer
before connecting or disconnecting any components or cables. Not
doing so could potentially result in damage to components in either
or both machines.
Macintosh
NOTE: If your Macintosh has a single serial port, refer to Chapter 8, “Troubleshooting,” for information regarding connection to the Lmax.
Serial Port Connection
Use an 8-pin DIN to DB-25 Macintosh modem cable to connect the Macintosh
to the Lmax. Connect the 8-pin, round DIN connector to the Macintosh (to the
printer or modem port) and the 25-pin connector to the Lmax. Connecting to
the modem port of the Macintosh is preferred, allowing the printer port to
remain available. If you do connect the Lmax to the Macintosh printer port,
first inactivate AppleTalk using the Chooser desk accessory in the Apple ()
menu.
NOTE: If you are running other applications that use AppleTalk, it may be
necessary to quit them before making AppleTalk inactive.
Figure 2.1: 8-Pin DIN to DB-25 Macintosh Straight-through Serial Cable
USB Connection
Although the Lmax requires a serial connection, through the use of a USB-toserial adapter you can connect a serial cable between the Macintosh and the
Lmax instrument. Molecular Devices has tested and can recommend the Keyspan USB Twin Serial Adapter (not the PDA adapter). Connect the USB connector from the adapter to an open USB connection and choose the “printer”
port from the Preferences in SOFTmax PRO for Lmax (the Keyspan software
only supports direct access to the emulated printer port and may cause the
Mac to freeze if the modem port is chosen). Connect the serial cable to port 1 of
the adapter (not port 2) and plug the other end of the serial cable into the receptacle on the back of the Lmax instrument.
SOFTmax PRO for Lmax User’s Manual
2-3
Chapter 2: Installation
Windows-Compatible Computer
The type of cable required to connect your computer and the Lmax will
depend upon the type of serial port(s) available on your computer. The end of
the cable that will attach to the Lmax must be a 25-pin connector. The cable
itself should be a straight-through serial (null modem) cable. The connector
for your computer may be a 9-pin or 25-pin connector (or you can use an
adapter that converts from 9-pins to 25-pins—see Figure 2.2).
25-pin connector
9-pin connector
9-pin to 25-pin
adapter
Figure 2.2: 25-Pin DIN to 25-Pin or 9-Pin Serial Cable
2-4
SOFTmax PRO for Lmax User’s Manual
Chapter 2: Installation
Computer System Requirements
The following computer hardware and operating system software specifications are recommended to ensure proper operation of SOFTmax PRO for
Lmax. The minimum configuration required is also given.
Macintosh Computer1
Recommended System Configuration
• Apple Power Macintosh G3
• Operating software System 9.0
• Sony 17-inch Multisync Color Monitor
• 64 MB RAM, 6 GB hard disk drive
• CD-ROM drive
• Extended keyboard
• Keyspan USB Twin Serial Adapter
• Epson 740I color printer
Minimum System Configuration
• Apple Macintosh PowerPC
• Operating software System 7.5.5
• Apple 14-inch color monitor
• 24 MB RAM, 270 MB hard disk drive
• 1.44 MB HD (high-density) 3.5-inch floppy disk drive
• Access to a CD-ROM drive
• Available serial communications port
1. Macintosh
hardware tested for the SOFTmax PRO for Lmax release: iMac with OS 8.1; Macintosh G4;
PowerMac 7600/120 with OS 8.1; PowerMac 7100/80AV with OS 7.5.5. Printer tested: Apple Laserwriter
Select 360.
SOFTmax PRO for Lmax User’s Manual
2-5
Chapter 2: Installation
Windows-Compatible Computer2
Windows 95/98
Recommended System Configuration
Windows NT/2000
Recommended System Configuration
• Pentium III, 450 MHz computer
• Microsoft Windows 95 or 98
• 17-inch color SVGA monitor
• Video adapter and software driver capable of
displaying 800 x 600 minimum resolution set to
16-bit high color and small fonts or better
• 64 MB RAM or greater
• 6 GB hard disk drive
• 1.44 MB HD (high-density) 3.5-inch floppy disk
drive
• CD-ROM drive
• Bus mouse
• Serial port (COM1 or COM2)
• Pentium III, 450 MHz computer
• Microsoft Windows NT 4.0 or 2000
• 17-inch color SVGA monitor
• Video adapter and software driver capable of
displaying 800 x 600 minimum resolution set to
16-bit high color and small fonts or better
• 128 MB RAM or greater
• 6 GB hard disk drive
• 1.44 MB HD (high-density) 3.5-inch floppy disk
drive
• CD-ROM drive
• Bus mouse
• Serial port (COM1 or COM2)
Windows 95/98
Minimum System Configuration
Windows NT/2000
Minimum System Configuration
• 486 33 MHz computer
• Microsoft Windows 95 or 98
• Color monitor
• SVGA graphics adapter (set to 256 colors and
small fonts or better)
• 24 MB RAM or greater
• 1 GB hard disk drive
• 1.44 MB HD (high-density) 3.5-inch floppy disk
drive
• Access to a CD-ROM drive
• Bus mouse
• Serial port (COM1 or COM2)
• 486 33 MHz computer
• Microsoft Windows NT 4.0 or 2000
• Color monitor
• SVGA graphics adapter (set to 256 colors and
small fonts or better)
• 32 MB RAM or greater
• 1 GB hard disk drive
• 1.44 MB HD (high-density) 3.5-inch floppy disk
drive
• Access to a CD-ROM drive
• Bus mouse
• Serial port (COM1 or COM2)
2. PC
hardware tested for the SOFTmax PRO for Lmax release: Dell Dimension XPS R350 with Windows 98;
Dell Dimension XPS H266 with Windows 2000; HP Vectra XU 3/200 with Windows NT; Compaq Presario
9234 with Windows 95. Printers tested: HP DeskJet 812C and HP LaserJet 4000N.
2-6
SOFTmax PRO for Lmax User’s Manual
Chapter 2: Installation
Install SOFTmax PRO for Lmax
Follow these instructions to install SOFTmax PRO for Lmax from the CD to
your computer’s hard disk.
1) Insert the SOFTmax PRO for Lmax CD into the CD-ROM drive.
2) Macintosh: Double-click the CD-ROM drive icon to open it.
Windows: Open “My Computer” and then double-click the CD-ROM drive icon
to open it.
3) Double-click the Installer icon (Macintosh) or Setup icon (Windows) and follow
the screen prompts.
4) The “Welcome” screen suggests that you close all other programs before beginning installation of SOFTmax PRO for Lmax software. It is also recommended
that you disable any virus protection software you may have running before
installing SOFTmax PRO for Lmax. Click [Cancel] to exit the installer and close
any programs and/or disable virus protection and then start the installer again
from step 3 above. To continue with installation, click [Next].
5) The screen named “Choose Destination Location” asks you to select the drive
where the software will be installed. A default location will be shown on the
screen. If you have more than one hard drive in your computer, you may change
the destination to the disk drive where you wish SOFTmax PRO for Lmax to
reside or accept the default location.
6) The “Setup Type” screen asks you to choose between “Complete” (the default) or
“Basic.” Basic installation installs all but the tutorial files. If you wish to omit the
tutorials, choose Basic. Otherwise, just click [Next] to continue.
NOTE: The [Back] button is available on all but the first screen, allowing
you to go back to previous screens and review or change information
that you have entered.
7) Click [Next] to start the actual installation of SOFTmax PRO for Lmax files.
8) When installation is complete, the “Finished” screen will appear. Click [Close] to
end the installer/setup program. On the Macintosh, remove the CD by dragging
its icon to the Trash. On the PC, close the window for the CD and “My Computer”
and then press the CD eject button on the CD-ROM drive. Replace the CD in its
holder and store it in a safe place.
An open folder named “SOFTmax PRO for Lmax” will be visible on your screen. It
will contain the SOFTmax PRO program. If you want SOFTmax PRO for Lmax to be
able to communicate with your Lmax, be sure to turn the Lmax on prior to starting
the SOFTmax PRO for Lmax program. After the instrument is powered on and has
completed its start-up sequence, double-click the “lpf” icon (
) to start SOFTmax
PRO for Lmax.
NOTE: In Windows, a shortcut for the program will be available in the Start
menu under “Programs\SOFTmax PRO for Lmax\lpf.”
SOFTmax PRO for Lmax User’s Manual
2-7
Chapter 2: Installation
What Is Installed
A folder called “SOFTmax PRO for Lmax” will be installed in the area you
specified on your computer’s hard drive. Within this folder are a number of
different files and subfolders (folder and filenames are the same for Windows
and Macintosh except that Windows files have the extension “.lpr” appended
to the file name).
NOTE: An uninstall program is available for Windows computers. Should
you need to remove an older version of SOFTmax PRO for Lmax
from your hard drive, we recommend using the uninstall program
since it also removes information regarding SOFTmax PRO for Lmax
from the Windows Registry.
To remove any version of SOFTmax PRO for Lmax from a Macintosh
computer, simply drag the SOFTmax PRO for Lmax folder and any
other SOFTmax PRO for Lmax files you may have on your hard drive
to the trash.
Enter Registration Information
Turn on the Lmax and allow it to complete its start-up sequence. Then double-click the program icon (
inside the SOFTmax PRO for Lmax folder—
Mac—or on the desktop—Windows) or choose SOFTmax PRO for Lmax from
the Windows Start menu to begin the software program.
The first time you open SOFTmax PRO for Lmax, a registration dialog box
will appear, asking that you enter your name, company, and the serial numbers of the software program and Lmax. The software serial number can be
found on the original SOFTmax PRO for Lmax CD, on the inside cover of this
manual, and on the software Warranty Registration Card (please remember to
fill out this card and return it to Molecular Devices Corporation to validate
your warranty). The instrument serial number (S/N) is located on a label
affixed to the back of the Lmax. Type the information into the appropriate
boxes and then click [OK]. Note: the option to click [OK] will not be available
until all information has been entered. If you have difficulty entering the registration information, refer to Chapter 8, “Troubleshooting,” for assistance.
2-8
SOFTmax PRO for Lmax User’s Manual
Chapter 2: Installation
Figure 2.3: Registration Dialog Box
After you click [OK], a title screen will appear (see Figure 2.4) showing the
registration information you entered.
Figure 2.4: SOFTmax PRO for Lmax Title Screen
After a few seconds, the title screen will be replaced by an untitled SOFTmax
PRO for Lmax window (see Figure 2.5).
SOFTmax PRO for Lmax User’s Manual
2-9
Chapter 2: Installation
Figure 2.5: SOFTmax PRO for Lmax Default Protocol Untitled Window
Communicating with the Lmax
After installation of SOFTmax PRO for Lmax, you will note that the instrument icon in the upper left-hand corner of the window appears with an “X”
and the words “No port selected” through it. You must access the Preferences
settings (from the Edit menu, choose the Preferences command) to select the
proper communications port (modem or printer for the Macintosh, COM1 or
COM2 for the PC). An additional setting, which is the factory default, is “Neither” (used when you do not have an instrument connected to the computer
and wish to use SOFTmax PRO for Lmax or if the port connection must be
disabled for other reasons). Choose the appropriate setting for your computer’s physical serial port connection and click [OK].
2-10
SOFTmax PRO for Lmax User’s Manual
Chapter 2: Installation
Set serial port here
Figure 2.6: Preferences Dialog Box (Windows)
The instrument icon should now appear normally (without an X through it).
If the port setting is correct and the Lmax is on, yet communication is still not
functioning properly, quit SOFTmax PRO for Lmax, turn off the power to
both the computer and the Lmax, and check that the cable connections
between the instrument and computer are secure. Turn both machines on
again and restart SOFTmax PRO for Lmax. If an “X” still appears over the
icon, refer to Chapter 8, “Troubleshooting,” for more information.
Set Preferences
It is a good idea to set the SOFTmax PRO for Lmax preferences before proceeding to use the program. The preferences include certain configuration settings, such as which port is used for the connection to the instrument, as well
as settings for automatic printing and saving of files, and the format for
exported data. To make these selections, choose Preferences from the Edit
menu to bring up the Preferences dialog box (see Figure 2.6).
Serial Port
Check that the setting for the serial port matches the physical port used to
connect the computer and the instrument.
NOTE: A selection of “Neither” can be made for the serial port which can
be selected if communication with an instrument is not required or if
no instrument is connected to the computer. When this option is
selected, the Status Bar in SOFTmax PRO for Lmax will reflect it by
showing an instrument icon with an “X” through it, along with the
words “No port selected.” This selection allows you to use the serial
ports for other purposes (modem connection, network connection, or
printing, for example), but does not allow you to communicate with a
Lmax.
SOFTmax PRO for Lmax User’s Manual
2-11
Chapter 2: Installation
Export Format
The preferences settings regarding the Export Format allow you to choose
whether to export the data as it appears in plate format or linearly (over time).
The option to include text labels along with numerical data can be activated
by clicking “Include Labels.” For more information on the Export... function,
refer to “File Creation and Management” on page 6-3.
Autosave
Enabling the Autosave feature in the Preferences dialog box will save a data
file automatically each time a plate is read.
Autosave saves a copy of the file that is currently open. If the file that is open
is a protocol file, note that the file will still be “Untitled” (i.e., not named) even
after an autosave has occurred. This allows you to to autosave to a text file
format and then save manually as a SOFTmax PRO for Lmax file.
You can Autosave to one of two different file formats:
• SOFTmax PRO for Lmax—used to save your data automatically in SOFTmax
PRO for Lmax format.
• Text File—used when you want to have the data available for use with a
spreadsheet or other program for data analysis external to SOFTmax PRO
for Lmax.
NOTE: If you autosave as a text file, the SOFTmax PRO for Lmax version of
the data will not be saved automatically and you will not be able to
automatically re-open the data file in SOFTmax PRO for Lmax. If you
choose to save to this format, you will need to save your data manually, using the Save or Save As... commands in the File menu if you
also want to save a SOFTmax PRO for Lmax file. If you attempt to
quit SOFTmax PRO for Lmax before saving a file containing data that
has not yet been saved, a message box will appear asking if you want
to save the file. You can assign any name to a file you save manually.
NOTE: If your protocol contains more than one experiment section when
you Autosave to SOFTmax PRO for Lmax file format, each experiment will be saved to a separate data file.
When Autosave is enabled, the box below the Autosave option becomes
active, allowing you to choose the folder within which data files will be saved
and the type of file to be saved. You may choose to autosave as a SOFTmax
PRO for Lmax file (default) or as a text file and, when saving as a text file, you
may choose to append to the same file.
2-12
SOFTmax PRO for Lmax User’s Manual
Chapter 2: Installation
Figure 2.7: Autosave Information (Windows)
The default folder for saving files is the SOFTmax PRO for Lmax folder. To
save data files in a different folder, click the [Set] button. A dialog box will
open, allowing you to choose a new location for saved files.
Figure 2.8: Autosave Location Dialog Box (Windows)
SOFTmax PRO for Lmax User’s Manual
2-13
Chapter 2: Installation
Highlight the folder where you want files to be saved. The [Select] button at
the bottom of the dialog box will reflect this choice; clicking the [Select] button will set this folder as the default location for saved data files. You can
change the location at any time by repeating this process.
To change the file format from SOFTmax PRO for Lmax to ASCII text, select
the Text File format from the list.
NOTE: If the Autosave function is reporting an error, or if files are saved in
the wrong location, it may be that a previous version of SOFTmax
PRO was not uninstalled prior to installing the newest version. Follow the instructions given above to choose the correct folder for
saved files.
Create New File (Text only)
After each Plate section is read, the data will be saved in a new file. This file
will contain all the data from the current and previous readings (for example, if
you read a Plate section andthen another Plate section, File1 will contain data
for Plate1; File2 will contain data for Plate1 and Plate2. This option is available
for both file formats (SOFTmax PRO for Lmax and ASCII text).
! CAUTION: If you Autosave to ASCII text format, you will not have a
SOFTmax PRO for Lmax version of the file unless you also manually
save the file using the Save as... command.
Append to File (Text only)
If you are saving data to an ASCII text file, you may choose to save all data to
a single file for all plates by choosing “Append to File.” This option is
dimmed (not available) if you are saving to a SOFTmax PRO for Lmax file.
File Prefix
The information entered into the “File Prefix” field is automatically given to
new files that are saved automatically. The default prefix is “Data.” Accepting
this default saves files starting with the name “Data” followed by a sequential
number beginning with “1.” For example, the first microplate read would be
saved under the file name “Data 1.”
File Prefix Field
Figure 2.9: File Prefix Field (Windows)
You can change this default prefix to any other prefix, provided the entire file
name will not exceed 31 characters. To change the prefix, click within the File
Prefix field, highlight the existing information, and type over the word to
enter a new prefix.
If the File Prefix field is left blank, the date of the run will be used as the file
prefix.
2-14
SOFTmax PRO for Lmax User’s Manual
Chapter 2: Installation
Append Date
Enabling the checkbox for Append Date will cause the date to be included in
the automatic file name for the saved data file. For example, using the file prefix “Data,” the first file saved on January 31, 2000, would have the name
“Data 01/31/2000 1.”
Autoprint
Checking this box will enable automatic printing of a report after each plate is
read. This report will contain information from each section that is designated
to be included in the report (the default is for all sections to be included).
For more information on reports, and including or excluding sections, see
Chapter 3, “SOFTmax PRO for Lmax Overview.”
Assays Folder
The Assays menu is used to choose the folder that will contain protocol files
you wish to access most often. After installation of SOFTmax PRO for Lmax,
the protocol files shown under the Assays menu will be the basic protocols
shipped with the software. Other folders may be installed with SOFTmax
PRO for Lmax that contain different protocol files for other applications—you
may select one of these folders instead, if desired, or create a new one of your
own.
To change the default folder, choose Assays and then choose Set Folder... .
A dialog box will appear, asking you to choose the folder or directory containing the protocol files you wish to be shown in the Assays menu. Select one
of the other folders within the SOFTmax PRO for Lmax directory/folder or, if
you have other protocol files in a different location, choose that location and
then click [Select].
NOTE: If you do not see any files in the Assays menu or if the files shown
are not correct, it may be that another or previous version of SOFTmax PRO was not uninstalled prior to installation of the current version. This can cause SOFTmax PRO for Lmax to default to using the
old directory for assay files rather than the directory associated with
the most current program version. Follow the instructions given
above to choose the correct folder for the default assays folder.
SOFTmax PRO for Lmax User’s Manual
2-15
Chapter 2: Installation
2-16
SOFTmax PRO for Lmax User’s Manual
Chapter 3: SOFTmax PRO for Lmax Overview
Introduction . . . . . . . . . . . . . . . . . . . . . . . . . . . . . . . . . . . . . . . . . . . . . 3-3
The SOFTmax PRO for Lmax Window . . . . . . . . . . . . . . . . . . . . . . 3-3
Window Size . . . . . . . . . . . . . . . . . . . . . . . . . . . . . . . . . . . . . . . . . . . . 3-5
Status Bar . . . . . . . . . . . . . . . . . . . . . . . . . . . . . . . . . . . . . . . . . . . . . . . 3-6
Experiments and Sections . . . . . . . . . . . . . . . . . . . . . . . . . . . . . . . . . 3-7
Experiments. . . . . . . . . . . . . . . . . . . . . . . . . . . . . . . . . . . . . . 3-7
Sections . . . . . . . . . . . . . . . . . . . . . . . . . . . . . . . . . . . . . . . . . 3-8
Notes Section. . . . . . . . . . . . . . . . . . . . . . . . . . . . . . . . . . . . 3-12
Plate Section . . . . . . . . . . . . . . . . . . . . . . . . . . . . . . . . . . . . 3-13
Group Section . . . . . . . . . . . . . . . . . . . . . . . . . . . . . . . . . . . 3-15
Graph Section . . . . . . . . . . . . . . . . . . . . . . . . . . . . . . . . . . . 3-17
Instrument Settings. . . . . . . . . . . . . . . . . . . . . . . . . . . . . . . . . . . . . . 3-19
Menus and Commands . . . . . . . . . . . . . . . . . . . . . . . . . . . . . . . . . . 3-19
Interprocess Messaging . . . . . . . . . . . . . . . . . . . . . . . . . . . . . . . . . . 3-33
Chapter 3: SOFTmax PRO for Lmax Overview
3-2
SOFTmax PRO for Lmax User’s Manual
Chapter 3: SOFTmax PRO for Lmax Overview
Introduction
This chapter presents a general description of the features and use of SOFTmax PRO for Lmax. It describes:
• the parts of the SOFTmax PRO for Lmax window, including experiments
and sections;
• the menus and tool bars found within the SOFTmax PRO for Lmax program;
• the basic steps required to perform a reading (complete information regarding reading using SOFTmax PRO for Lmax can be found in Chapter 4,
“Reading Microplates”); and
• the basic types of data analysis (detailed information regarding data analysis can be found in Chapter 5, “Displaying and Analyzing Data”).
SOFTmax PRO for Lmax employs standard Macintosh and Windows conventions for using menus, dialog boxes, windows, and the mouse. This manual
assumes that you are familiar with the basic operation of your computer.
While some general instructions are given here, and many of the terms used
in SOFTmax PRO for Lmax are defined in Chapter 1, “Glossary of Terms,” if
you need additional assistance regarding the basic use of your computer,
please review the documentation accompanying it.
The SOFTmax PRO for Lmax Window
When you start SOFTmax PRO for Lmax, a title screen will appear, showing
the information entered during registration, along with the SOFTmax PRO
for Lmax version, the instrument type (if connected), the ROM version
installed in the instrument (if available), and copyright information.
Figure 3.1: SOFTmax PRO for Lmax Title Screen.
SOFTmax PRO for Lmax User’s Manual
3-3
Chapter 3: SOFTmax PRO for Lmax Overview
After a few seconds, the title screen will be replaced by an untitled SOFTmax
PRO for Lmax window. Figure 3.2 below shows an example default protocol
screen for the PC.
The SOFTmax PRO for Lmax screen contains these major elements:
• A menu and status bar located at the top of the screen;
• An untitled window showing an experiment containing various sections,
depending upon the configuration of the default protocol used and the type
of instrument chosen in the Preferences or connected to the computer.
The menu and status bars are always visible while you are using SOFTmax
PRO for Lmax, no matter where you are within the program.
Title Bar
Status
Bar
Experiment
Section
Tool Bar
Menu Bar
Minimize Button
Maximize
Button
Close
Box
Scroll
Arrow
Notes
Section
Open/
Close
Triangle
Indicator
Plate
Section
Data
Display
Tool
Bar
Instrument
Settings
Box
Vertical
Scroll
Bar
Figure 3.2: SOFTmax PRO for Lmax Screen and Window for the PC (Windows).
3-4
SOFTmax PRO for Lmax User’s Manual
Chapter 3: SOFTmax PRO for Lmax Overview
Window Size
You may change the size of the window shown on the Macintosh by dragging
the size box (at the bottom right corner of the window) in any direction. You
can expand the window to the full size of the screen by clicking the zoom box
(in the upper right corner of the window). If you extend the bottom edge of
the window beyond the last section or the right edge beyond the edge of the
sections, the intervening space will be gray. To resize the window again, drag
the size box to a different position or click the zoom box again. Clicking the
zoom box will restore the previous window size.
NOTE: If you move the SOFTmax PRO for Lmax window such that the title
bar is under the status bar, you will have to hide the status bar before
you can move the window to see the title bar again.
You may change the size of the window shown in Windows by dragging the
side, bottom, or corner of the window (when the cursor changes into a double-headed arrow). You can expand the window to the full size of the screen
by clicking the Maximize button in the upper right corner of the window. If
you extend the bottom edge of the window beyond the last section or the
right edge beyond the edge of the sections, the intervening space will be gray.
You can also reduce the window to an icon by clicking the Minimize button in
the upper right corner of the window. When the window is shown as an icon,
it is still functional; double clicking the icon will restore the window to its previous size. Other options are available for resizing windows—refer to the documentation that came with your Windows software for more information.
NOTE: The width of the experiment and sections shown in the window is
constrained by the width set for the printed page size. The dimensions and orientation of the printed page (and, consequently, the display size) may be changed by selecting either Page Setup...
(Macintosh) or Print Setup... (Windows) from the File menu.
SOFTmax PRO for Lmax User’s Manual
3-5
Chapter 3: SOFTmax PRO for Lmax Overview
Status Bar
Near the top of the SOFTmax PRO for Lmax window is a status bar that starts
with an icon representing the Lmax instrument (see Figure 3.3).
Current
Chamber
Instrument Temperature
Display
Icon
Click
to start
a reading
Incubator
Button
Cover Plate
Status Setting
Figure 3.3: Status Bar
NOTE: The status bar can be hidden from view by selecting Hide Status
from the View menu. Selecting Show Status from the view menu will
restore it to view.
The status bar shows the following items (from left to right):
Instrument icon. An icon such as that shown at the left indicates that the Lmax
is communicating properly with the computer. If an “X” appears on top of the
icon, the computer is not making proper contact with the Lmax.
NOTE: Double-clicking the Lmax icon will open the Preferences dialog box.
Temperature display. A small window after the Lmax icon shows the current
temperature within the microplate chamber in degrees Celsius.
The [Read] button. If a single Plate section has been created in the experiment
window, clicking the [Read] button starts the reading. This reading is based
on the settings chosen in the Instrument Settings dialog box (refer to “Instrument Setup”) for the plate.
If more than one Plate section has been created in the experiment window and
no Plate section is currently active, clicking the [Read] button opens a dialog
box asking you to select which plate to read. If a Plate section is active when
you click the [Read] button, that section is read automatically.
The Incubator button. Clicking this button causes the “Incubator” dialog box
to appear, allowing you to set and regulate the temperature of the microplate
chamber. The temperature setting can be left at the default or can be specified
by typing a different value in the box.
NOTE: The incubator setting is independent of the protocol being run. Running an assay does not automatically set the temperature set point.
After a reading, however, the temperature set point, range, and average temperature are recorded in the saved file.
Cover status. This icon displays the status of the cover over the microplate tray
of the Lmax (closed or open). You must close the lid prior to reading a microplate.
3-6
SOFTmax PRO for Lmax User’s Manual
Chapter 3: SOFTmax PRO for Lmax Overview
96- or 384-well plate setting display. This icon shows whether or not a microplate is present in the reading chamber and also if the Lmax is currently set to
read 96-well or 384-well plates (when no plate is present, an “X” appears over
the icon as shown). The Lmax requires that two changes be made when
switching from reading one plate size to the other: you must physically reconfigure the position of the Lmax read head and you must change the software
setting for the plate size in the SOFTmax PRO for Lmax Control menu. Selecting the 384-well plate size in the Instrument Settings without configuring that
setting in the Control menu will produce an error.
Experiments and Sections
Experiments
Each SOFTmax PRO for Lmax file contains at least one experiment (and can
contain more than one). Within an experiment are one or more sections (discussed below). Experiments define a naming scope for the sections within
them and provide you with quick access to different types of information
without opening or referring to multiple files.
An experiment can be selected by clicking its tool bar (the area that shows the
experiment name) with the mouse. Selecting an experiment causes its tool bar
to change from light gray to darker gray and the experiment title to be shown
in boldface type. Selecting is different from activating an experiment. Selecting
an experiment allows you to perform actions on the entire experiment (such
as deleting or duplicating it). Multiple experiments can be selected by holding
down the Shift key while clicking the individual tool bars of the experiments.
A single click anywhere within an inactive experiment activates it. Activating
an experiment allows you to add new sections to it or to perform other operations within that experiment. (With sections, however, selecting and activating
are identical functions. Clicking anywhere within an inactive section activates
and selects it.)
Creating a new experiment by choosing either New or Duplicate from the Edit
menu creates an identical copy of the experiment (excluding data). The new
experiment retains the same name as the original, with the word “Copy”
appended when you choose to Duplicate (e.g., the duplication of “Expt1” produces “Expt1 Copy”) and an increment of number when you choose New
(e.g., “Expt1” becomes “Expt2”).
An experiment can be deleted if it is no longer needed. The Delete command
in the Edit menu changes depending upon which experiment is active. For
example, if the experiment titled “Experiment #1” is active, the Edit menu
will show Delete Experiment #1. Using the Macintosh, you can also delete
the selected experiment by pressing -; within Windows, you can press
CTRL+-. Take care when deleting experiments that they do not contain information you wish to save.
You may also choose to delete multiple experiments simultaneously by holding down the Shift key and activating the tool bars of the experiments you
wish to delete. Having done this, the Edit menu will now show Delete Selection instead of Delete Experiment.
SOFTmax PRO for Lmax User’s Manual
3-7
Chapter 3: SOFTmax PRO for Lmax Overview
You can add new sections to the active experiment using the New Section
command under the Edit menu.
Sections
SOFTmax PRO for Lmax contains four types of sections: Notes, Plate, Group,
and Graph. A brief synopsis of these sections is given below.
Notes sections are used to record information pertaining to the experiment.
You can enter text in this section as you desire; in addition, you can create
summaries containing formulas for displaying reduced data. Text in Notes
sections can be formatted (font, size, and style any way you choose).
Each Plate section shows a grid of cells which corresponds to the wells of the
microplate. To the right of or underneath this grid is a box showing the current
instrument settings (except incubator settings, which are always shown at the
bottom of the Plate section after data is acquired). In the Plate section, you define a template to be used for analysis, determine the instrument settings,
choose how the data will be displayed, and define the type of reduction (if
any) that will be performed on the raw data received from the instrument.
Group sections are created automatically when groups are defined in the
Template Editor. The example shown at left is for a group named “Standard.”
Protocol files generally contain default groups; you can create others as needed. Each Group section contains default columns of data which can also be
changed, if desired. Within a Group section, you can resize columns, modify
existing columns to use different analysis formulas, add columns containing
new formulas, and/or add one or more summaries at the bottom of the section.
Graph sections are used to plot information from groups (defined in the Template Editor). Values associated with the X- or Y-axes depend on the type of
group selected for graphing. More about Graph sections can be found in
Chapter 5, “Displaying and Analyzing Data.”
General Information about Sections
Sections are either active or inactive. Multiple sections can be active at the
same time although it is typical to have only one active section. The tool bar of
an active section is dark gray. Inactive sections are color coded to make it easier to discern a section’s type:
Inactive Experiment or Section . . . . . . . Color
Experiment . . . . . . . . . . . . . . . . . . . . . . . . .
Plate . . . . . . . . . . . . . . . . . . . . . . . . . . . . . . .
Notes . . . . . . . . . . . . . . . . . . . . . . . . . . . . . .
Group. . . . . . . . . . . . . . . . . . . . . . . . . . . . . .
Graph. . . . . . . . . . . . . . . . . . . . . . . . . . . . . .
Gray
Purple
Yellow
Pink
Blue
Clicking anywhere in an inactive section makes it active. Selecting an experiment deactivates any individual section within it that may have been active
and vice versa. Activating a section also activates the experiment containing
that section. To activate multiple sections at the same time, hold down the
Shift key and click in the tool bars of the sections you wish to activate. Doing
this allows you to move, copy, duplicate, print, and delete multiple sections
simultaneously.
3-8
SOFTmax PRO for Lmax User’s Manual
Chapter 3: SOFTmax PRO for Lmax Overview
The last item (farthest right) in the SOFTmax PRO for Lmax menu bar
changes to reflect the section type that is currently active. If a Plate section is
active, for example, the last menu item will be Plate. If an experiment is
selected, this menu will not be shown.
New Plate, Notes, or Graph sections can be created whenever you need them
and more than one of each type of section can exist in a single SOFTmax PRO
for Lmax experiment. (Group sections are created automatically when you
define new groups in the Template Editor or may be created with the
Duplicate command.)
A section can be deleted if it is no longer needed. The Delete command in the
Edit menu changes depending upon which section is active. For example, if
the section titled “Plate #1” is active, the Edit menu will show Delete Plate
#1. Using the Macintosh, you can also delete the active section by pressing
-; within Windows, you can press CTRL+-. Take care when deleting sections
that they do not contain information you wish to save. You may also delete
multiple sections simultaneously by making them active—the Delete command in the Edit menu will change to show Delete Selection.
NOTE: Deleting a Group section automatically deletes references to that
group from the Template. See Chapter 4, “Reading Microplates,” for
more information.
Section tool bars contain buttons and pull-down menus. Buttons in the tool
bar are only enabled when that section is active (the section does not need to
be open). Menu equivalents exist for most tool bar functions. Figure 3.4 shows
the active tool bar from a Graph section.
Figure 3.4: Tool Bar from an Active Graph Section
If you scroll the window vertically so that part of an open/active section is
hidden, its tool bar “sticks” to the top of the window (See Figure 3.5). This feature prevents the active tool bar from becoming unavailable if you are viewing the bottom of a section that is longer than the size of the window. When
the next section scrolls to the top of the window, its tool bar replaces the previous one but is not active, even if the section is open. If you scroll back so that
even a small part of the previous section is visible, its tool bar returns to the
top of the window.
SOFTmax PRO for Lmax User’s Manual
3-9
Chapter 3: SOFTmax PRO for Lmax Overview
Active
Tool Bar
Active/Open
Section
Scrolling
Upward
Figure 3.5: Example of a Tool Bar “Sticking” to the Top of the Window.
Opening and Closing Sections
Newly created experiments and sections are initially shown in their full-size
(open) form. You can close them, however, to show just their tool bars, if
desired. Sections that are created automatically by SOFTmax PRO for Lmax
may be shown initially either open or closed, depending on the default protocol file in use.
To open or close a single section within SOFTmax PRO for Lmax, click its
indicator located in the top left corner of the tool bar. When an experiment or
section is closed, the indicator points to the right ( ); when open, the indicator points down ( ). Figure 3.6 shows an open experiment containing three
sections—the first two are closed, the last is open.
Closed
Open
Figure 3.6: Closed and Open Sections. The Notes#1 and Plate#1 sections are closed;
the Plate#2 section is open.
To open or close multiple sections within an experiment (or multiple experiments in a file) simultaneously, use the Expand and Minimize commands in
the View menu. Selecting Minimize (M for Macintosh; CTRL+M for Windows)
will close all sections (leaving experiments open) to show only section title
bars. Selecting Expand (E; CTRL+E) will open all sections.
NOTE: If you close or minimize an experiment, the tool bars in that experiment will be hidden (see Figure 3.7). If all sections are presently
expanded, the Expand command is dimmed (unavailable).
3-10
SOFTmax PRO for Lmax User’s Manual
Chapter 3: SOFTmax PRO for Lmax Overview
Figure 3.7: Result of Minimizing an Experiment (Tool Bars Hidden)
You may also open a section in a separate window. Double-clicking the section icon (in the tool bar) or selecting New Window from the active section
menu (either Plate, Graph, Notes, or Group) causes the currently active section to open as a separate window (a copy of the tool bar still remains in the
original experiment, but the section is closed; clicking the closed section
places the new window behind the main window (the original section
remains closed). Clicking on the triangle in the section tool bar closes the new
window and causes the section in the experiment to open (and closing the
separate window opens the section within the experiment again). All of the
tool bar options applicable to the section are available in the separate window
(except the triangle indicator).
Figure 3.8: Separate Section Window
SOFTmax PRO for Lmax User’s Manual
3-11
Chapter 3: SOFTmax PRO for Lmax Overview
Notes Section
Tool Bar
Body
Figure 3.9: Example Notes Section, Named “Results.”
The Notes section is used to record information that pertains to the experiment. You can enter text of any kind and add summaries containing reduction
formulas.
The Notes section is divided into two areas:
• The tool bar
• The body
You may create multiple Notes sections within the same experiment.
The tool bar contains the following items (shown with their tool bar or mouse
equivalents). These menu items and buttons are active only when a Notes section is active.
Table 3.1: Notes Section Menu Commands and Tool Bar Buttons
Menu Command/
Mouse Equivalent
Notes section icon
Opens the Notes section
in a new window
Name of Notes section
Opens the Section dialog box
New Window in the
Notes menu
Opens the section in a
new window
Section Name in the
Notes menu
Opens the Section Name
dialog box
Create Summary in the
Notes menu
Opens the Calculation
dialog box, allowing you
to create a summary
Edit Summary in the
Notes menu or double-
click the summary
(pointer changes to double-headed arrow)
3-12
Description
Tool Bar Button
(double-click)
(double-click)
Opens the Calculation
dialog box, allowing you
to edit the summary
Show/Hide Formulas in
the Notes menu
Shows/hides the calculations used to derive
summaries
Printer icon
Includes/excludes section from printed report
SOFTmax PRO for Lmax User’s Manual
Chapter 3: SOFTmax PRO for Lmax Overview
Plate Section
Tool Bar
Data Display
Instrument Settings
Reduction Settings
Figure 3.10: Plate Section.
The Plate section is used to collect data from the instrument, define how the
data is displayed, and what the initial reduction of the data will be. In addition, the Template Editor in the Plate section is used to create a “map” of the
contents of the microplate.
Choosing a particular function or command in the Plate section can be done
in several ways. You can use the mouse to click on a button, choose a command from one of the drop-down menus in the menu bar, or press a keystroke combination to activate a command or function.
The Plate section is divided into four areas:
• Tool bar
• Data display (shown in a microplate grid format)
• Instrument settings, shown to the right of or below the data display,
depending on the plate type and printer settings
• Reduction settings, shown to the right of or below the data display, depending on the plate type and printer settings
When the grid in the Plate section shows colors, this means that a template
has been defined for this Plate section. Each group defined in the template has
a different color (the icon of the corresponding group table will have the same
color).
If your experiment requires multiple plates, you can create as many Plate sections as needed.
The Plate menu contains the items shown in Table 3.2 (shown with their tool
bar or mouse equivalents). These menu items and buttons are active only
when a Plate section is active.
SOFTmax PRO for Lmax User’s Manual
3-13
Chapter 3: SOFTmax PRO for Lmax Overview
Table 3.2: Plate Section Menu Commands and Tool Bar Buttons
Menu Command/
Mouse Equivalent
Description
Plate section icon
Opens the Plate section in a new window
Name of Plate section
Opens the Section dialog box
Instrument Setup... in the Control
Opens the Instrument Settings dialog box for this
plate
menu
Opens the Template dialog box allowing you to
create or edit the template
Reduction... in the Plate menu
Opens the Reduction dialog box containing
reduction settings
Double-click in a single well or
when several wells are selected;
Graph in the Plate menu
Enlarges selected well(s) to a Well Graph display
(kinetic mode only); choosing Graph again
returns to regular display (toggle)
Display... in the Plate menu
Opens the Display dialog box containing display
choices
Mask in the Plate menu
Masks the selected wells
Printer icon
Includes/excludes section from printed report
Section Name... in the Plate menu
Opens the Section dialog box, allowing you to
rename the section
New Window in the Plate menu
Opens the section in a new window
Copy Template in the Plate menu
Copies the template, allowing it to be pasted to
another Plate section
Paste Template in the Plate menu
Pastes a previously copied template to a new
Plate section
Export Template in the Plate
Import Template in the Plate
menu
3-14
(double-click)
(double-click)
Template... in the Plate menu
menu
Tool Bar
Button
Opens the Export Template to... dialog, allowing
you to export a template to an ASCII text file
Opens the Import Template to... dialog, allowing
you to import a template from an ASCII text file
SOFTmax PRO for Lmax User’s Manual
Chapter 3: SOFTmax PRO for Lmax Overview
Group Section
Tool Bar
Body
Figure 3.11: Group Section (example shown prior to collecting data)
Group sections are created automatically when you create or select groups for
the experiment in the Template Editor. A Group section is a table which
shows all of the information for a particular group. A group is a set of associated samples which have been created in the Template. Depending on the
default assay chosen, certain group types (such as Standard or Unknown)
may have been created; you can create others as required. Group sections may
also be created by duplicating existing Group sections.
The Group section is divided into three areas:
• The tool bar
• The body of the Group table
• The summaries
The Group menu contains the following items (shown with their tool bar or
mouse equivalents). These menu items and buttons are active only when a
Group section is active.
Table 3.3: Group Section Menu Commands and Tool Bar Buttons
Menu Command/
Mouse Equivalent
Description
New Window in the
Group menu
Opens the Group section in
a new window
Name of Group section
Opens the Group settings
dialog box
Group Settings in the
Group menu
Opens the Group Settings
dialog box
Create Summary in
the Group menu
Opens the Calculation dialog box, allowing you to
create a summary
Create Column in the
Group menu
Opens the Calculation dialog box, allowing you to
create a column
SOFTmax PRO for Lmax User’s Manual
Tool Bar Button
(double-click)
(double-click)
3-15
Chapter 3: SOFTmax PRO for Lmax Overview
Table 3.3: Group Section Menu Commands and Tool Bar Buttons
Menu Command/
Mouse Equivalent
Edit Summary in the
Group menu or dou-
ble-click the summary
(pointer changes to
double-headed arrow)
Edit Column in the
Group menu or dou-
ble-click the column
Show/Hide Formulas
in the Group menu
Autosize in the Group
menu
3-16
Description
Tool Bar Button
Opens the Calculation dialog box, allowing you to
edit the summary
Opens the Calculation dialog box, allowing you to
edit the column
Shows/hides the formulas
used in columns and summaries
Enlarges or reduces column size to fit the largest
piece of text
Hide/Show All in the
Group menu
Hides one or more selected
columns or shows all columns that were hidden
Hide Replicates in the
Group menu
Hides data from all replicates
Printer icon
Includes/excludes section
from printed report
SOFTmax PRO for Lmax User’s Manual
Chapter 3: SOFTmax PRO for Lmax Overview
Graph Section
Tool Bar
Body
Plot Information
Figure 3.12: Graph Section (example shown before data collection)
To create a graph section, choose New Graph from the Experiment menu. The
Plots dialog box opens automatically and a default plot called “Plot#1” is
selected. The plot will default to the first group available in the experiment.
Once a graph has been created, new plots can be added and deleted, the axes
can be customized, and the size (displayed area) of the graph can be changed.
Grid lines can be enabled or disabled (default is enabled). Graphs may be displayed as bar graphs or scatter plots.
The Graph section is divided into three areas:
• The tool bar
• The body of the Graph section
• Plots information below the graph
You may create more than one Graph section within an experiment. Plots in
the Graph section must be defined from groups within the same experiment
section as the graph, with one exception: if you duplicate an experiment that
contains data in the Plate section and has a plot defined in a Graph section,
that plot will remain in the duplicated Graph section (and new plots may be
added).
SOFTmax PRO for Lmax User’s Manual
3-17
Chapter 3: SOFTmax PRO for Lmax Overview
The Graph menu contains the following items (shown with their tool bar or
mouse equivalents). These menu items and buttons are active only when a
Graph section is active.
Table 3.4: Graph Section Menu Commands and Tool Bar Buttons
Menu Command/
Mouse Equivalent
Description
New Window in the
Graph menu
Opens the Graph section in
a new window
Name of Graph section
Opens the Section dialog
box
Graph Settings in the
Graph menu
Opens the Graph Settings
dialog box
Tool Bar Button
(double-click)
(double-click)
Drop-down menu allows
you to choose a curve fit
X Axis... in the Graph
menu
Y Axis... in the Graph
menu
3-18
Opens the X Axis Settings
dialog box
Opens the Y Axis Settings
dialog box
Printer icon
Includes/excludes section
from printed report
Graph Options in the
Graph menu
Opens the Graph Options
dialog box
Export Graph in the
Graph menu
Opens the Export Graph
As... dialog box
SOFTmax PRO for Lmax User’s Manual
Chapter 3: SOFTmax PRO for Lmax Overview
Instrument Settings
You must specify the type of reading to be performed prior to actually reading a microplate.
Instrument settings allow you to choose a read mode (endpoint, dual read,
long kinetics, or fast kinetics), timing for a kinetic run, and so on.
Complete information regarding instrument settings can be found in
Chapter 4, “Reading Microplates.”
Menus and Commands
The menu bar for SOFTmax PRO for Lmax is located at the top of the window
(just beneath the title bar).
.
Figure 3.13: Menu Bar (Macintosh menu top, Windows menu bottom)
You may access SOFTmax PRO tools and features in several ways: menus,
tool bars, dialog boxes, and keystrokes. Figure 3.14 shows all of the menu
items that are available in SOFTmax PRO for Lmax.
When menu items are unavailable, they are dimmed (shown as gray rather
than black)—available choices depend on the action you are performing with
the software. An ellipsis (three dots) following a menu item indicates that
choosing this item will bring up a dialog box. Menu items followed by a triangle are hierarchical menus: choosing such an item causes a submenu to
appear to the right of the original item. Certain menu items can also be chosen
by pressing keys on the keyboard.
Within Windows, menu items contain an underlined letter in their names.
Pressing the ALT key will activate the menu bar; pressing a letter key that corresponds to the underlined letter of a menu name will then activate that
menu. Subsequent menu items can be activated (chosen) by simply pressing
the underlined letter in their names (you do not need to press ALT again). For
example, to open a file from within SOFTmax PRO for Lmax using the keyboard shortcut, you would press ALT, F, O which will first activate the menu
bar, then select the File menu, then choose Open from the File menu.
When available, a shortcut key combination will be shown to the right of the
command in the menu. On the Macintosh, begin by pressing and holding
down the command () key followed by the key shown in the shortcut. Windows users should press and hold the control (CTRL) key followed by the key
shown in the shortcut.
Some menus are divided into groups of items that perform related functions.
Dividers are shows as thin, horizontal lines between menu items.
File. Items in this menu relate to entire SOFTmax PRO for Lmax files. Com-
mands to open, print, apply password protection, and save files are located
here.
SOFTmax PRO for Lmax User’s Manual
3-19
Chapter 3: SOFTmax PRO for Lmax Overview
Edit. This menu contains features for changing items within SOFTmax PRO
for Lmax. Commands to select, copy/paste, delete and duplicate items are
located here. This menu also contains the Preferences command, which
allows you to set options regarding printing, communication with the Lmax,
and saving files.
View. Choices regarding what is shown and how it is shown are available
here. The last section in this menu provides a navigational tool, allowing you
to choose the particular section you would like to view (a section chosen in
this manner will open if it was closed and will be brought into view within
the window).
Experiment. Choices in this menu allow you to create new sections within the
current experiment, as well as to create a completely new experiment.
Control. Items in this menu allow you to set up and activate Lmax functions.
Assays. This menu allows you to choose the folder containing the protocols
you have saved and shows those protocols below the divider, making it easy
to open one or more of them. A second level of folders can be stored within
the Assays folder and will appear on the Assays menu, allowing you to separate protocols further, as desired.
Notes/Plate/Group/Graph. The name of this menu item changes to reflect the
section type that is currently active. If a Plate section is active, for example, the
last menu item will be Plate. An active Graph section causes this menu to
show Graph. If an experiment is selected, this menu will not be shown.
Window. Selections in this menu allow you to position the windows or icons
on your desktop in different ways.
Apple. Displays the SOFTmax PRO for Lmax version, registration informa-
tion, ROM version (if available from the instrument), and copyright information.
Additionally, a number of buttons are available in different sections of the
SOFTmax PRO for Lmax experiment and section tool bars. Clicking these buttons accomplishes many of the same actions as choosing menu items.
3-20
SOFTmax PRO for Lmax User’s Manual
Chapter 3: SOFTmax PRO for Lmax Overview
Keyboard
Shortcuts
Ellipsis (...)
indicates that
choosing this
command will
open a dialog box
Menu
Title
Dimmed
Command
Figure 3.14: SOFTmax PRO for Lmax Menus (Windows version)
SOFTmax PRO for Lmax User’s Manual
3-21
Chapter 3: SOFTmax PRO for Lmax Overview
Apple Menu
About SOFTmax PRO for Lmax
(Macintosh only) Displays the SOFTmax PRO for Lmax version, registration
information, ROM version (if available from the instrument), and copyright
information. If an instrument is connected to the Macintosh running SOFTmax PRO for Lmax, the instrument type will also be displayed. You will need
to know this information if you call for technical support. Other items in the
Apple menu depend on the settings of your Macintosh.
File Menu
New... (N; CTRL+N)—Opens a new file window, allowing you to begin a new
or different data file. Information from each SOFTmax PRO for Lmax
window (which can consist of one or more experiments with their
sub-sections) is saved to a separate file.
Open... (O; CTRL+O)—Opens an existing SOFTmax PRO for Lmax file (or an
older SOFTmax file). When you choose Open from the File menu, a di-
alog box appears. To open a file from the list of available files, doubleclick the filename to be opened, or click once on the filename and then
click the [Open] button.
Close (W; CTRL+W)—Closes the front-most (active) window. If you have only
one file open, this file will be closed. If you have changed the file in
any way since it was opened, a dialog box will open asking if you want
to save the file before closing. (This menu item is dimmed if no window is open.)
Save (S; CTRL+S)—Saves the active window to a file. The active file name is
shown at the top of the status window (protocol files are always
shown as “Untitled”). To save the file in a different folder/subdirectory or under a different name, use Save As.... If the file has not yet been
saved and given a name (is “Untitled”), the Save As... dialog box will
appear and you will be asked to name the file. (This menu item is
dimmed if the file has already been saved and no changes have been
made.)
Save As...—Saves a file with a new file name or into a new folder or subdirec-
tory. See Chapter 6, “Saving Files Manually,” for more information
about using the Save As... command for saving files.
Import/Export...—Import brings tab-delimited ASCII text file information
into SOFTmax PRO for Lmax and Export creates a file of Plate section
and/or Group table section data. All information from SOFTmax PRO
for Lmax can be saved as tab-delimited ASCII (or text) format, which
is suitable for importing into word processing or spreadsheet programs.
After choosing Import, a dialog box will appear asking you to choose
the file you wish to import. Files to be imported must contain specific
header information. For more information on importing files into
SOFTmax PRO for Lmax, see “Exporting/ Importing Information” on
page 6-16.
3-22
SOFTmax PRO for Lmax User’s Manual
Chapter 3: SOFTmax PRO for Lmax Overview
After choosing Export, a dialog box will appear, asking you to name
the file and choose a location where the file should reside. In addition,
the dialog box will ask you to choose which sections should be exported (you can choose to export all or some Plate or Group table sections).
The data that is exported out of the Plate section will be the same data
currently displayed in that Plate section: either raw or reduced data.
One additional parameter that affects export function is located under
Preferences in the Edit menu. You may choose to export the data in
plate format (8 × 12 array of numbers for a 96-well plate, for example)
or in time format (a single line or row). You may also choose for the
exported file to be created with or without labels.
Set Password—Allows you to enable password protection for the file to pro-
tect it from unauthorized or unintentional changes.
Page Setup/Print Setup—You should access this command after you select a
different printer in the Chooser (Macintosh), if you choose a different
printer using Windows, or if you want to use a different paper size or
printing option. Choosing Page Setup/Print Setup opens a dialog box
with various options for printing. More about this function can be
found in the documentation that accompanies your computer and/or
printer.
NOTE: The Page Setup/Print Setup command also controls how SOFTmax
PRO for Lmax sections are displayed on your monitor (the width of
the display corresponds to the width of the page size).
Print (Section name/Selection)—Allows you to print just the active section(s).
Print... (P; CTRL+P)—With the Macintosh, choose this command and then
click either “Print all” or “Print report.” Print all sends all sections to
the printer in the order they appear in the window. Print report sends
those sections selected to be in the report to the printer in the order
they appear in the window. From Windows, choose Print and then
specify a page range or leave the default to print all pages.
NOTE: Make sure you have selected the correct printer prior to choosing
one of the Print options in the File menu. If you start to print and discover the wrong printer is selected, choose [Cancel] to exit from the
Print dialog box, select the correct printer (using the Chooser or the
Print Setup command), and then repeat the printing process.
Quit (Q; CTRL+Q)—Closes SOFTmax PRO for Lmax as well as any SOFTmax
PRO for Lmax files you may have open. If you have open files that
have changed and have not yet been saved, a dialog box will ask if you
want to save them before quitting.
SOFTmax PRO for Lmax User’s Manual
3-23
Chapter 3: SOFTmax PRO for Lmax Overview
Edit Menu
Undo (Z; CTRL+Z)—Restores the last text operation to the condition that exist-
ed before the editing was done (used primarily when entering text in
Notes sections). This menu item is dimmed if no actions have been
taken or if undoing the last action is not possible.
Cut (X; CTRL+X)—Removes highlighted information (text or data) from the
document and stores it on the clipboard so it can be pasted elsewhere.
(This menu item is dimmed if no selection has been made or if the selection cannot be cut.)
Copy (C; CTRL+C)—Copies selected (highlighted) text or data and stores it on
the clipboard so it can be pasted elsewhere. (This menu item is
dimmed if no selection has been made or if the selection cannot be
copied.)
Parts of an experiment can be copied within the same experiment or
to another application using the Copy and Paste commands. You may
also use this command to copy information from SOFTmax PRO for
Lmax into other programs.
Paste (V; CTRL+V)—Pastes information from the clipboard just to the right of
the insertion point in the document. Can also be used to import tabdelimited data into SOFTmax PRO for Lmax. (This menu item is
dimmed if nothing has been copied to the clipboard.)
Clear—Clears or erases highlighted text (or data) without storing it on the clip-
board. (This menu item is dimmed if nothing has been selected.) You
can remove one or more columns from a Group table, or text or formulas from a Notes section, by highlighting the column or text/formula
and then choosing Clear from the Edit menu. Columns and text or formulas can also be removed by highlighting them and pressing the Delete key.
Select All (A; CTRL+A)—The Select All command can be used in Notes, Plate,
and Group sections when a section is active (it is not available in
Graph sections).
In a Notes section, if no summaries are present, it will select all text. If
summaries are present at the top or bottom of the Notes section, this
command will select all text but not the summaries (which must be selected individually). If the text is broken up by summaries, this command will select the largest block of text that it can (bounded by
summaries).
In a Plate section, this command will select all wells, if one or more
wells in the grid array has already been selected. If no wells have been
selected, this command will be dimmed.
In a Group section, this command will select all columns in the group
table but will not include any summaries at the bottom of the group
table (summaries must be selected individually).
Delete Section/Selection ( – ; CTRL+ -)—Deletes the currently active sec-
tion(s) or experiment(s). A warning dialog box will appear asking if
you really want to delete the section(s) or experiment(s).
Duplicate Section/Experiment—Creates new section(s) or experiment(s) that
are exactly like the active section(s) or experiment(s)and positions the
duplicated selection(s) after the currently active section(s). The names
3-24
SOFTmax PRO for Lmax User’s Manual
Chapter 3: SOFTmax PRO for Lmax Overview
of the new section(s) or experiment(s) will have the word “Copy” appended to their name(s). For example, if you duplicate a section
named “Plate#1,” the duplicate section will be called “Plate#1Copy.”
Subsequent duplications will append an incremented number after
the name (e.g., “Plate#1Copy#2”). For more information about this
command and what is included when a section is duplicated, see “Duplicate and New” on page 6-24.
Text Style... (T; CTRL+T)—Allows you to change the attributes of selected text.
(This command is dimmed if no text has been selected.)
Preferences... (double-click the instrument icon)—Through the Preferences
dialog box, you can choose settings for the following options:
• Serial port connection (modem port or printer port for the Macintosh; COM1 or COM2 for the PC) that will be used to connect to the
Lmax. A third option, “Neither,” should be used when no instrument is connected to the computer.
• Export format (Time versus Plate, and whether or not to include
labels).
• Whether or not files will be saved automatically and the location
where saved files will be stored (Autosave).
• Whether or not reports should be printed automatically (Autoprint).
Suspend Recalculation—Stops SOFTmax PRO for Lmax from performing cal-
culations based on changes you make to the settings or other program
information. This command is used most often when you want to
make a number of changes to the settings without having to wait
while the results of each change are recalculated.
Recalculate Now (=; CTRL+=)—Causes SOFTmax PRO for Lmax to recalcu-
late data based on the current settings. This command is used most often when you have suspended automatic recalculation.
SOFTmax PRO for Lmax User’s Manual
3-25
Chapter 3: SOFTmax PRO for Lmax Overview
View Menu
The View menu provides three commands: Minimize (M; CTRL+M), Expand
(E; CTRL+E), and Hide Status. In addition to these choices, the names of the
experiments appear at the bottom of the menu (sections within experiments
are shown as submenus), allowing you to go to a specific experiment or section within an experiment by choosing the item. If the section was closed,
selecting it from the View menu will open and activate it. The currently active
section is shown in the menu with a checkmark next to it.
Minimize (M; CTRL+M)—If you select Minimize while a section within an ex-
periment is active, the sections within that experiment are minimized.
If you choose Minimize while an experiment tool bar is active, all experiments will be minimized (sections within are hidden and only the
experiment tool bars are visible).
Expand (E; CTRL+E)—If you select Expand while a section within an experi-
ment is active, the sections within that experiment are expanded. If
you choose Expand while an experiment tool bar is active, all sections
within all experiments become visible (the sections may be minimized
or expanded).
Hide Status/Show Status—Hides or displays the status bar.
Experiment Menu
The Experiment menu provides five commands: New, New Notes, New Plate,
and New Graph.
New—Creates a new experiment directly following the active experiment (the
new experiment then becomes the active experiment). All sections
shown in the experiment that was active when this command is chosen are duplicated in the new experiment.
New Notes—Creates a new Notes section below the active section.
New Plate—Creates a new Plate section below the active section. The new
Plate section will be a copy of the active Plate section or, if no Plate section currently exists, the new Plate section will use SOFTmax PRO for
Lmax default settings.
New Graph—Creates a new Graph section below the active section and brings
up the Plots dialog box, allowing you to select the graph options.
3-26
SOFTmax PRO for Lmax User’s Manual
Chapter 3: SOFTmax PRO for Lmax Overview
Control Menu
Instrument Setup...—This command is available only if a Plate section is active. Choosing Instrument Setup opens the Instrument Settings dialog
box which allows you to enter the mode for the run (endpoint, dual
read, or kinetic) and the settings for pre-read blanking, strips, timing
for kinetic runs, and plate type.
Button Equivalent:
in the Plate section tool bar.
Read—In a single plate experiment, the Read command reads the plate imme-
diately. If no Plate section is active in an experiment containing multiple Plate sections, the Read command displays a dialog box asking
you to select which Plate section to read. The default Plate section, selected by pressing the Return key, is chosen on these criteria:
• The selected Plate section, if one is selected.
• The next unread Plate section.
• The first plate, if all have been read.
Once a reading is in progress, menu items are no longer available until
the reading is finished.
Button Equivalent:
in the Status bar.
Incubator—Allows you to turn the incubator on or off. When on, you can en-
ter a setting for regulation of the temperature in the microplate chamber.
Button Equivalent:
in the Status bar.
Wash Injectors—Performs a manual wash of either the P or M injector, or both,
for a specified number of injections (default is 30). Choosing this option causes a dialog box to appear which contains a note that reminds
you to change the reagent bottles, if necessary. Choose the settings
you desire and click the [Wash] button to start the wash process.
Prime Injectors—After changing reagents, you should prime the lines to re-
move any air that may be present and to ensure that the lines are filled
with the new reagent. Choosing this menu option opens a dialog box
that allows you to prime the P or M injector line, or both. You can
choose the number of injections to perform to prime the line (the default is 7). The dialog box reminds you to change reagent bottles, if
necessary, prior to starting the priming procedure.
Reverse Injectors—Choosing this menu option allows you to send fluid from
the lines back into the reagent bottle (for example, to preserve costly
reagents). You can set this option for as many “injections” as desired
(default is 7) through either the P or M injector, or both.
Set Instrument to Read 384 (96) wells ... —One of two settings that need to be
changed in the SOFTmax PRO for Lmax software in order to switch
from 96- to 384-well capability and vice versa (the other setting is
found in the Instrument Settings parameters). Additionally, a hardware reconfiguration must be made to change from one plate size to
the other. See the Lmax User’s Manual for more information.
SOFTmax PRO for Lmax User’s Manual
3-27
Chapter 3: SOFTmax PRO for Lmax Overview
Move to Service Position ... —Moves the read head to the service position, al-
lowing you to perform service-related activities such as changing the
injector tips. More about such functions is included in the Lmax User’s
Manual.
Assays Menu
Set Folder...—Allows you to select a folder or subdirectory containing com-
monly used protocol files. In addition to any protocol files residing
within this folder (which will be listed below the dividing line and
may be opened by clicking them), an additional level of subfolders (if
any) will be shown below a center division. Protocol files can be used
repeatedly (for specific types of assays, for example). These files can
be named in any way you choose.
Folder name(s) after dividing line—Choosing any of these folders will open a
submenu showing protocol files residing in this subfolder. Select one
of the protocol files to open it.
File name(s) after dividing line—The files that appear here are protocol files
that reside within the folder determined using the Set Folder... command. You can quickly open and use one of these protocol files by selecting it from the Assays menu.
Plate Menu
This menu item changes to show Plate, Notes, Graph, or Group, depending
on the type of section that is currently active. If no section is active, this menu
item does not appear.
Template...—Opens the Template Editor.
The Template Editor allows you to describe the samples that are in the
wells, thus providing the link between the raw data and the analysis
groups. You can create new groups in the template or assign wells to
already established groups.
If your experiment contains multiple Plate sections, the template for
each Plate section must be defined using the Template Editor in that
section. You can create a new template or modify an existing one using
the Template Editor.
NOTE: Each Plate section requires that a template be created in order to
identify groups within that plate. However, two or more Plate sections may use the same template, or the same groups may be used in
different templates.
After groups are defined in the template and you return to the Plate
section, the data display will show the group areas in different colors.
Button Equivalent:
in the Plate section tool bar.
Reduction...—Opens the Reduction dialog box. Options available in the Re-
duction dialog box depend on the type of reading performed (endpoint, dual read, or kinetic). The Reduction dialog box is used for
initial reduction of the data collected from the microplate reader. The
luminescence information collected is reduced to a single number per
3-28
SOFTmax PRO for Lmax User’s Manual
Chapter 3: SOFTmax PRO for Lmax Overview
well. More information regarding reduction options can be found in
Chapter 5, “Displaying and Analyzing Data.”
Button Equivalent:
in the Plate section tool bar.
Display...—Opens the Display dialog box. Allows you to decide how the infor-
mation in the Plate section will be displayed. More information regarding display options can be found in Chapter 5, “Displaying and
Analyzing Data.”
Button Equivalent:
in the Plate section tool bar.
Graph...—The Well Graph commandcan be activated both during and after
data acquisition with a kinetic reading. You can get a “close up” view
of the plot shown in one or more wells by first selecting the well(s) and
then choosing the Graph... command. (This command is dimmed if the
instrument settings are for an endpoint reading or if no well in the
Plate display has been selected.)
Button Equivalent:
in the Plate section tool bar.
Mask—Allows you to “hide” certain wells so that they will not be taken into
account when performing analyses. (This command is dimmed if no
data has been acquired or if no wells in the plate have been selected.)
Button Equivalent:
in the Plate section tool bar.
Copy Template—While a Plate section is open and active, choosing this com-
mand allows you to copy the template from this Plate section to the
Clipboard, allowing you to paste it into a different Plate section (in the
same or in a different experiment or into a Plate section in another
SOFTmax PRO for Lmax file).
Paste Template—If you have copied a template from a Plate section, you can
then create or activate/open another Plate section and choose Paste
Template. In this way, you can use the same template for more than
one Plate section or you can modify the pasted template as desired.
If you are pasting a template into a new experiment and groups from
the source template do not exist in the destination experiment, pasting
the template will create them. Existing groups of the same name will
not be changed by the pasting process. For example, if the template being copied contains the groups “Standards” and “Unknown,” and the
group “Standards” already exists in the destination experiment, the
group “Unknown” will be created but all information regarding the
group “Standards” in the destination experiment will remain unchanged. If you copy and paste the template with the same experiment, no new groups are created. Group names can be edited in the
pasted template (these changes will be reflected in the original template also).
Export Template—Opens the Export Template to... dialog, allowing you to ex-
port a template to an ASCII text file.
Import Template—Opens the Import Template to... dialog, allowing you to
import a template from an ASCII text file.
Section Name...—Allows you to change the name of the Plate section.
Mouse Equivalent: double-click the name of the Plate (
the Plate section tool bar (to the right of the Plate section icon).
SOFTmax PRO for Lmax User’s Manual
)in
3-29
Chapter 3: SOFTmax PRO for Lmax Overview
New Window—Opens the active section in a separate window.
Mouse Equivalent: double-click the
bar.
icon in the Plate section tool
Notes Menu
This menu item changes to show Plate, Notes, Graph, or Group, depending
on the type of section that is currently active. If no section is active, this menu
item does not appear.
Create Summary...—When the Notes section is active, choosing Create Summary opens a dialog box allowing you to give a title to a new summa-
ry and then enter a formula to be used for the summary.
Button Equivalent:
in the Notes section.
Edit Summary—If you have created a summary and need to change it, you can
do so by first highlighting the summary you wish to edit and then
choosing Edit Summary. (This command is dimmed if you have not
yet created a summary or if the summary has not been selected.) The
dialog box then appears showing the name and formula.
Mouse Equivalent: Double-clicking the summary performs the same
function.
Button Equivalent:
in the Notes section.
Show Formulas—Choosing this command shows the formulas associated with
the summaries you have created in the Notes section. After choosing
Show Formulas, the menu name changes to Hide Formulas. (This command is dimmed if you have not created any summaries.)
Section Name...—Allows you to change the name of the Notes section.
Mouse Equivalent: double-click the name of the Notes section
(
)to the right of the Notes section icon.
New Window—Opens the active section in a separate window.
Mouse Equivalent: double-click the
icon in the Notes section.
Graph Menu
This menu item changes to show Plate, Notes, Graph, or Group, depending
on the type of section that is currently active. If no section is active, this menu
item does not appear.
Graph Options...—You can select from three types of graphs: Scatter (with
symbols plotted and/or the points connected), Cluster Bar, or Stack
Bar and you can set the height of the graph to be something other than
the default percentage (100%). The font used for the title, legend,
and/or axes can be changed and/or modified in size and style. Plots
can be added, deleted, or edited. Editing plots allows you to change
the plot name, its source (from which experiment and group), as well
3-30
SOFTmax PRO for Lmax User’s Manual
Chapter 3: SOFTmax PRO for Lmax Overview
as the items to be plotted (for example, concentration vs. values).
Button Equivalent:
in the Graph section.
X-axis...—Sets the X-axis parameters (tick marks, scale, label, gridlines, and
autorange).
Button Equivalent:
in the Graph section.
Y-axis...—Sets the Y-axis parameters (tick marks, scale, label, gridlines, and
autorange).
Button Equivalent:
in the Graph section.
Section Name...—Allows you to change the name of the Graph section.
Mouse Equivalent: double-click the name of the Graph section
(
)to the right of the Graph section icon.
Export Graph—Creates a file containing a picture of the graph with a filename
of your choice. On the Macintosh, the graphic is in PICT format; in
Windows, the graphic is in EMF (Enhanced MetaFile) format.
New Window—Opens the active section in a separate window.
Mouse Equivalent: double-click the
icon in the Graph section.
Group Menu
This menu item changes to show Plate, Notes, Graph, or Group, depending
on the type of section that is currently active. If no section is active, this menu
item does not appear.
Create Column—If a Group section is currently active, you can add a column
to the display by choosing this command. If no columns are highlighted, the column will be added at the end of the group. If you select a
column first, the new column will be added to the right of the highlighted column.
Button Equivalent:
in the Group section.
Create Summary—Allows you to create a summary and enter a formula for
this summary for the Group. Summaries appear at the bottom of the
group table.
Button Equivalent:
in the Group section.
Edit Column—Selecting a column makes this command active. Choosing Edit
Column allows you to change the formula associated with the column
and to change the column name.
Mouse Equivalent: Double-clicking the column performs the same
function.
Button Equivalent:
in the Group section.
Edit Summary—Allows you to edit the formula associated with the summary,
as well as to change the summary name. (This command is dimmed if
a summary has not yet been created.) First highlight the summary and
then select this command.
Mouse Equivalent: Double-clicking the summary performs the same
function.
Button Equivalent:
SOFTmax PRO for Lmax User’s Manual
in the Group section.
3-31
Chapter 3: SOFTmax PRO for Lmax Overview
Autosize—Choosing this command expands or shrinks the width of selected
columns to accommodate the largest piece of text in the column.
Mouse Equivalent: Double-clicking the line to the right of the column
heading performs the same function.
Hide—Hides the selected column from view. (This command is dimmed if a
column has not been selected.)
Mouse Equivalent: Dragging the line to the right of the column heading until it is on top of the line to the left of the column performs the
same function.
Hide Replicates—Hides data for all replicates (if any) from view.
Show All—Shows all columns or replicates that were hidden previously.
Show Formulas—Causes a new row to appear beneath the headings of each
column showing the formulas used to determine the data in the columns. After choosing this command, the menu name changes to Hide
Formulas.
Group Settings—Opens the Group Settings dialog box, allowing you to re-
name a group and/or change the sample or group descriptors used, as
well as to modify the units used with each descriptor.
Mouse Equivalent: double-click the name of the Group section
(
)to the right of the Group section icon.
New Window—Opens the active section in a separate window.
Mouse Equivalent: double-click the
icon in the Graph section.
Window Menu
Tile—If you have several windows open, choosing the Tile command will re-
size and arrange all open windows so that they are all visible at the
same time (generally side by side).
Cascade—If you have several windows open, choosing the Cascade command
will resize and layer the open windows so that each title bar will be
visible.
Arrange Icons—If you have several files open but reduced to icons, choosing
the Arrange Icons command will move all icons to the bottom of the
SOFTmax PRO for Lmax window and put them in order.
Beneath the line will appear the names of all open files within SOFTmax PRO
for Lmax. The active file will have a checkmark next to it. Choosing one of the
file names shown here will cause that file to come to the forefront of the screen
(and will restore the file to its previous size if it had been minimized).
Help Menu—Windows
Contents—Displays the contents of the Help screens, allowing you to choose
from the listed topics. Clicking a topic opens the help screen associated with it.
Index—Shows the alphabetical listing of all items that can be viewed within
the Help function. Clicking a topic opens the help screen associated
with it.
3-32
SOFTmax PRO for Lmax User’s Manual
Chapter 3: SOFTmax PRO for Lmax Overview
Using Help—Allows you to choose from an indexed list of topics or to search
for the type of help you’re looking for.
About SOFTmax PRO for Lmax—Brings up the About screen (splash screen)
which gives the serial number, ROM version, and the instrument type
connected to the computer, as well as the software version for SOFTmax PRO for Lmax.
Help Menu—Macintosh
About Help...—Brings up a dialog box explaining how to use the Apple Guide
which gives detailed information about the help function on the Macintosh.
Show/Hide Balloons—Depending upon whether or not you have balloon help
turned on or off, this menu presents the choice to reverse the setting.
SOFTmax PRO Help...—Opens the help section devoted to SOFTmax PRO for
Lmax. Items are presented in alphabetical order.
Formula Help...—Opens the formula help section which provides information
about how to use formulas, including formula examples.
Interprocess Messaging
(This feature is available on the Windows Operating System only)
Many operations found in SOFTmax PRO for Lmax can be controlled by
other Windows applications by means of an ASCII string-based messaging
system. Commands are available for opening and saving files, controlling
instruments, selecting sections, exporting data from Plate and Group sections,
and importing Templates. The commands for interprocess messaging are
described in Appendix A, “SOFTmax PRO for Lmax Remote
Command Language,” along with examples for programming these commands.
SOFTmax PRO for Lmax User’s Manual
3-33
Chapter 3: SOFTmax PRO for Lmax Overview
3-34
SOFTmax PRO for Lmax User’s Manual
Chapter 4: Reading Microplates
Introduction . . . . . . . . . . . . . . . . . . . . . . . . . . . . . . . . . . . . . . . . . . . . . 4-3
Instrument Settings. . . . . . . . . . . . . . . . . . . . . . . . . . . . . . . . . . . . . . . 4-4
Instrument Settings Options . . . . . . . . . . . . . . . . . . . . . . . . 4-9
Template Editor. . . . . . . . . . . . . . . . . . . . . . . . . . . . . . . . . . . . . . . . . 4-13
Selecting Wells in the Template Editor . . . . . . . . . . . . . . 4-14
The Template Editor Tool Bar . . . . . . . . . . . . . . . . . . . . . 4-15
Blanking . . . . . . . . . . . . . . . . . . . . . . . . . . . . . . . . . . . . . . . . 4-24
Copying and Pasting Templates . . . . . . . . . . . . . . . . . . . 4-27
Reading a Microplate . . . . . . . . . . . . . . . . . . . . . . . . . . . . . . . . . . . . 4-29
Chapter 4: Reading Microplates
4-2
SOFTmax PRO for Lmax User’s Manual
Chapter 4: Reading Microplates
Introduction
Reading a microplate using SOFTmax PRO for Lmax is a three-part process:
• Prepare the software to collect data;
• Prepare the microplate(s) to be read; and
• Read the microplate(s).
Before reading a microplate, you must create the Plate section(s) and define
the instrument settings for the reading. Instrument Settings must be defined
prior to collecting data and may NOT be changed after data is collected. In
addition, it is recommended that you define a template, the reduction parameters, and display parameters prior to reading the microplate, as these parameters determine how data is displayed and analyzed, but these last
parameters may be set up and/or modified after data collection.
A typical process for preparing, collecting, and analyzing data is as follows:
1) Start SOFTmax PRO for Lmax.
2) Create Plate section(s) as needed.
3) Define instrument settings (use the button in the Plate section tool bar or the
command in the Control menu).
4) Define the template, reduction parameters, and display parameters.
5) Prepare the microplate to be read and place it in the Lmax.
6) Initiate the reading.
7) Save the data file.
8) Modify the template, reduction parameters, or display parameters as you
wish them to be (or, if you didn’t set them up in Step 4, do so now).
9) Save the data file.
10) Analyze the data using the Group section tables and Graph sections.
11) Save the data file when you are finished.
This chapter discusses how to define instrument settings, create a template,
and initiate a reading. Data analysis is covered in Chapter 5, “Displaying and
Analyzing Data.”
SOFTmax PRO for Lmax User’s Manual
4-3
Chapter 4: Reading Microplates
Instrument Settings
You must specify the instrument settings prior to actually reading a microplate. These settings include:
• The read mode—endpoint, dual read, long kinetics, or fast kinetics.
• Timing for kinetic runs
• Plate type: number of wells
• Blanking (pre-read plate)
• Wells to be read
• Integration time
Settings for the reading are made in the Instrument Settings dialog box, which
can be accessed three ways:
1) Choose Instrument Setup... from the Control menu;
2) Click the [Setup] button in the tool bar of the active, expanded Plate section;
or
3) Double-click anywhere in the settings box (located to the right of the well
grid) in the active, expanded Plate section.
NOTE: You may create more than one Plate section in a single experiment,
and the instrument settings associated with each Plate section can be
different. Instrument Setup... can only be chosen while a Plate section
is active, and the settings you choose will affect only that section. A
new Plate section that is created in an experiment that contains an
active Plate section will contain the same instrument settings found
in the previously active section. The settings for the new section can
be modified as desired.
Table 4.1 lists all possible instrument settings choices based on instrument type.
When you have defined the instrument settings, click the [OK] button to close
the Instrument Settings dialog box. After closing, a summary of the instrument
settings will appear in the box to the right of the data display in the Plate section. The Lmax will use these settings to read the plate.
Table 4.1: Features Available in the Instrument Settings Dialog Box
Endpoint
Dual Read
Fast Kinetics
Long Kinetic
Integration
Time
PreRead
Plate
◆
◆
Injection:
P and/or M
Injection
Injector
Volume
PostInjection
Delay
Injection
Wells
(P & M
Injector)
Wells
to Read
Run
Time
Number
of Reads
per Well
Plate
Type
◆
◆
◆
◆
◆
◆
◆
◆
◆
◆
◆
◆
◆
◆
◆
◆
◆
◆
◆
◆
◆
◆
◆
◆
◆
◆
◆
◆
◆
◆
NOTE: Incubator control is an instrument setup parameter that is not found
in the Instrument Settings dialog box.
4-4
SOFTmax PRO for Lmax User’s Manual
Chapter 4: Reading Microplates
Endpoint Mode
Figure 4.1: Instrument Settings Dialog Boxes for an Endpoint Reading
SOFTmax PRO for Lmax User’s Manual
4-5
Chapter 4: Reading Microplates
Dual Read Mode
Figure 4.2: Instrument Settings Dialog Boxes for a Dual Read
4-6
SOFTmax PRO for Lmax User’s Manual
Chapter 4: Reading Microplates
Long Kinetics Mode
Figure 4.3: Instrument Settings Dialog Boxes for a Long KineticsReading
SOFTmax PRO for Lmax User’s Manual
4-7
Chapter 4: Reading Microplates
Fast Kinetics Mode
Figure 4.4: Instrument Settings Dialog Boxes for a Fast Kinetics Reading
4-8
SOFTmax PRO for Lmax User’s Manual
Chapter 4: Reading Microplates
Instrument Settings Options
Read Mode
Choices for the read mode are endpoint, dual read, long kinetics, or fast kinetics. To select a read mode, click the appropriate icon in the Instrument Settings dialog box.
Endpoint
A single integration of samples in 96- or 384-well plates with two injections
possible, if desired, in any or all wells of a 96-well plate (no injection possible
in 384-well plates). The minimum integration time is 0.1 second. A pre-read of
the microplate may be made before injection of buffer or reagent and/or reading of the samples. The signal is integrated for each well over a user-selectable
reading time (maximum 5000 seconds). You can program a delay after each
injection, if desired (up to 1000 seconds with a minimum of 1.6 seconds for
the P injection), and you can read all or only some of the wells in the plate.
Values are reported as relative luminescence units (RLU); the default reduced
value is !MValue.
Read Mode
Buttons
Figure 4.5: Instrument Settings for an Endpoint Reading.
Dual Read
Also an endpoint reading, this mode is designed to perform two separate
integrations, one after each of two possible injections in any or all wells of a
96-well microplate (no injection possible in a 384-well plate). Integration
times for both readings must be the same (minimum integration time is 0.1
second; maximum is 1000 seconds). You may program a delay after each
injection of up to 1000 seconds (a minimum of 1.6 seconds for the P injector),
and you can read all or only some of the wells in the plate. Pre-reading of the
microplate is not possible with this mode. Values are reported as relative
luminescence units (RLU); the default reduced value is !MValue.
SOFTmax PRO for Lmax User’s Manual
4-9
Chapter 4: Reading Microplates
Read Mode
Buttons
Figure 4.6: Instrument Settings for a Dual Reading.
Long Kinetics
Reads all of the selected wells of a 96- or 384-well microplate and then repeats
this process for as many readings as are specified in the Instrument Settings.
One or two injections can be made in any or all wells of a 96-well plate at the
beginning of the reading (no injection possible in 384-well plates). The default
reduced values calculated for long kinetics data are Vmax per Sec (RLU/Sec),
Vmax, Time to Vmax (seconds), Onset Time (seconds), Time at Minimum,
Time at Maximum, Time at 1/2 Maximum, Slope, and Area Under Curve. An
important application for this mode is cellular luminescence.
Number of
Readings
Calculated from
the Run Time
and Interval
Figure 4.7: Instrument Settings for a Long Kinetics Reading.
Timing—Enter the total kinetic run time and the time interval between readings. A default value will be shown for the run time; to change this value,
click in the box. Up and down arrows will appear, enabling you to increase or
decrease the value shown. Highlight the hours, minutes, or seconds shown
4-10
SOFTmax PRO for Lmax User’s Manual
Chapter 4: Reading Microplates
and then click the up or down arrow until the desired value is reached. Alternatively, you can type over an existing value using the keyboard.
After choosing a total run time and an interval between readings, the total
number of readings that will result is shown below the run time. If you set the
interval time to be shorter than the instrument’s minimum read interval, the
program will alert you with a warning message.
Fast Kinetics
Repeated integrations are made for a specified number of data points, up to a
100-point maximum integration, in a single well of a 96- or 384-well microplate. This process is then repeated for each of the rest of the selected wells.
One or two injections can be made in each well of a 96-well plate at the start of
the integration (no injection possible in 384-well plates). Integration time can
be set from 1 to 100 seconds. Data is collected over time with readings taken
at regular intervals. The default reduced values calculated for kinetic data are
Vmax per Sec (RLU/Sec), Time to Vmax (seconds), Onset Time (seconds),
Time at Minimum, Time at Maximum, Time at 1/2 Maximum, Slope, and
Area Under Curve.
Figure 4.8: Instrument Settings for a Fast Kinetics Reading.
Plate Type
This setting determines the display of wells in the microplate—it should be
set to match the type and number of wells in the actual microplate that will be
read.
SOFTmax PRO for Lmax User’s Manual
4-11
Chapter 4: Reading Microplates
Figure 4.9: Plate Type Setting. Choose either 96-well or 384-well standard plates.
NOTE:
Changing the Plate Type within a Plate section causes well assignments stored in the previous template to be discarded. The groups
that were created previously remain, however, so you can select new
wells and simply apply existing groups to these wells.
NOTE:
Switching between 96- and 384-well plates requires a hardware
reconfiguration on the Lmax as well as the designation of Plate Type
in the software. Choosing a different plate type will cause a message
to appear on the screen reminding you that the physical setup must
be altered and that you must also choose an additional setting in the
Control menu to ensure that the proper hardware for that plate type
has been configured.
Wells to Read Selection
You may choose to read only certain wells in the microplate or to read the
entire plate. Partial-plate reading is available for all read modes; the time
required for readings may be significantly reduced using this setting if the
instrument does not have to read the entire plate.
To configure the settings for a partial-plate read, choose the Wells to Read setting.
Figure 4.10: Partial Plate Read (Wells to Read) Dialog Box with wells B2 through F9
Selected
Highlight the wells to be read. Wells must be contiguous but do not need to
start in any particular place. If you enable a partial-plate reading, only the
4-12
SOFTmax PRO for Lmax User’s Manual
Chapter 4: Reading Microplates
wells to be read will be visible in the data display, indicating that no data will
be collected for the other wells (all wells will be present in the Template Editor, however).
Template Editor
The Template Editor is used to describe the location of samples in the wells of
the microplate, providing the link between the raw data and the analysis
groups. The Template Editor is used to create a template which provides
SOFTmax PRO for Lmax with a map of what is in the microplate.
When you first open the Template Editor for a new Plate section, the grid or
display is empty. The number of wells shown depends upon the type of plate
selected in the Instrument Settings. After selecting wells, you can assign
groups and indicate the types of samples they will contain.
Depending upon the default protocol you are using, certain group names
(and associated sample descriptions) may have been created. You can use
these predefined groups and/or create new groups to suit your needs. When
creating new groups, you may enter any name you wish. Once entered, this
name will be available for use in that experiment thereafter. New groups can
be created independently from selecting or assigning any wells in the Template Editor.
Each well designated as being part of a group has associated with it a group
name, a sample name (or replicate ID), a sample descriptor (optional), and a
default column format (group type, such as Standards, for example). When a
group is applied to selected wells, the group name is displayed in bold type
over the wells and the wells bear the same color.
Clear
Button
Edit
Button
Sample
Drop-Down List
Series
Button
Assign
Button
Template
Editor
Tool Bar
Group
Drop-Down
List
Sample
Descriptor
Field
Microplate
Map
Figure 4.11: Template Editor Dialog Box
SOFTmax PRO for Lmax User’s Manual
4-13
Chapter 4: Reading Microplates
Groups are always visible, both in the Template and in the data display of the
Plate section. Even though they are grouped, single wells are still selectable in
either the Template Editor or the data display.
Samples and groups may exist across multiple Plate sections as well as within
a single Plate section.
Each template is built upon a hierarchy as follows: the template is composed
of samples and groups. A set of one or more replicate wells makes up a sample. A set of related samples forms a group. For example, you may have a
group named Standards that consists of seven samples named STD01, STD02
... STD07. Group names may be up to 32 characters long, while sample names
may be 300+ characters long. Samples may be assigned one at a time using
the [Assign] button or several at the same time using the [Series] button.
If you create a group in the Template Editor but do not assign any wells to the
group, a section for that group will still be created automatically when you
close the template. You can remove the group (both its section in the window
and its group name in the template) by making that Group section active and
choosing Delete Groupname (where “Groupname” is the name assigned to
that group in the template) from the Edit menu. Using the Macintosh, you can
also delete the selected Group by pressing -; within Windows, you can
press CTRL+-. Note that deleting the wells assigned to a group from the template does not delete the corresponding Group name from the drop-down list. The
only way to remove a group name from this list in the Template Editor is to
delete the corresponding Group section from the experiment.
Selecting Wells in the Template Editor
In the Template Editor for a Plate section, you can select one or more wells by
clicking or dragging on the grid. Multiple (contiguous) wells can be selected
by dragging across them. Non-contiguous selections can be made by holding
down the Shift key and clicking individual wells. Clicking a row label will
select the entire row; clicking a column label will select the entire column.
Contiguous columns or rows (1-12 or A-H, for a 96-well plate, for example)
can also be selected by dragging. Non-contiguous columns or rows can be
selected by holding the (command) key on the Macintosh or the CTRL key in
Windows and clicking in labels.
• Double-clicking anywhere within a group will select the entire group.
• To deselect all wells quickly, click in the empty border around the Template.
• When you leave the Template Editor (by clicking the [OK] button), the
Plate section will show the boundaries of the groups created in the template. Group labels and sample descriptors will not be visible—you can see
them by holding down the Ctrl+Shift keys. When you release the key(s), the
original view of the Plate section will return.
4-14
SOFTmax PRO for Lmax User’s Manual
Chapter 4: Reading Microplates
The Template Editor Tool Bar
The tool bar will appear differently depending upon what type of group is
selected in the Group drop-down list. The following illustration shows how
the tool bar will appear under various circumstances.
A group is selected that does not contain sample
descriptor information (such as Unknowns column type).
A group is selected for which a concentration has been
defined (such as Standards column type).
A group is selected for which a dilution factor is defined
(such as UnknownsDilution column type).
Figure 4.12: The Appearance of the Template Editor Tool Bar under Different
Circumstances
The tool bar is divided into three areas: the Group area, the Sample area, and
the Assign area.
The Group Area
The Group area contains the Group drop-down list which allows you to
assign wells to existing groups, create new groups, or modify (using the
[Edit] button) existing groups. In addition, it contains the [Clear] button
which allows you to clear well assignments in the template.
Group Drop-Down List
This drop-down list consists of two areas, divided by a horizontal gray line.
The two items below the gray line (Blank and New) are always available.
Items above the gray line are custom groups that may be created as you wish.
The Group drop-down list will appear differently depending upon the custom groups that have been created (by default or by the user). The figure
below shows two different instances of the appearance of the Group list.
SOFTmax PRO for Lmax User’s Manual
4-15
Chapter 4: Reading Microplates
No custom
groups created
Example of custom
groups created by
a user
Figure 4.13: The Group Drop-Down List
NOTE: Depending on the default template used when opening
SOFTmax PRO for Lmax version 1.0, initially no groups may appear
above the gray line. As you create new groups, they will be positioned above the line.
• Blank—Creates a plate blank in the Plate section. Note: the name “blank” is
reserved for use by the SOFTmax PRO for Lmax program and should not
be used when creating custom groups.
• New—Creates a new group. The Group Settings dialog box will appear (see
Figure 4.14) showing default settings. This dialog box allows you to define
the name for a group of related samples, what type of descriptor will be
associated with these samples, and the initial column format for the Group
section. Whenever a new group is created (whether or not wells are selected
in the template), a Group section (table) will also be created. To delete a
group, you must delete the Group section. Simply clearing a group from the
Template Editor will remove the assignment of wells to that group name, but
the name will still show in the group pull-down menu and the Group section will still exist.
Figure 4.14: Group Settings Dialog Box Using Default Settings
4-16
SOFTmax PRO for Lmax User’s Manual
Chapter 4: Reading Microplates
Name: Use either the default name, “Group#X,” where “X” is an integer that
is initially set to “1” and increments (i.e., “1,” “2,” “3,” etc.) as other groups
are created, or enter a custom name (up to 32 characters in length).
In the Sample Descriptor area of the Group Settings dialog box, you can
enable the application of the sample descriptor, if appropriate by clicking the
checkbox. You may also choose the units used for the sample descriptor by
selecting an option from the Units drop-down list or by typing the units you
wish to use into the list box.
The Sample Descriptor is automatically enabled when either the Standards or
Unknowns(Dilution) column format (see below) is selected. The descriptor
defaults to Concentration with the Standards column format and to Dilution
with the Unknowns(Dilution) column format. The Sample Descriptor may
also be used for time or fraction number information.
NOTE: No sample descriptor is assigned automatically for the Basic or
Unknowns column format. You may assign a sample descriptor to
these column formats manually but, if you choose to do this, the
information will not appear automatically in the Group section. To
see it, you will need to create a new column containing the formula
!Sampledescriptor. For more information about creating columns, see
“Adding Columns” on page 5-26.
Column Format defines the default column types that will be created for a
new group or shows the original column format setting that was used to create the group you are editing.
Four selections are offered: Basic, Standard, Unknowns, and Unknowns
(Dilution). Different types of columns will be created for a new group, or
changed in an existing group, depending on which of these column format
settings you select. Table 4.2 shows the default columns created with each
selection type.
NOTE: If you are creating a new group for unknowns that have a dilution
factor, use the Unknowns(dilution) column format as a base rather
than the Unknowns group included in the default protocol.
SOFTmax PRO for Lmax User’s Manual
4-17
Chapter 4: Reading Microplates
.
Table 4.2: Columns Created and Their Formulas
Basic
Standard
Unknown
Unknown(Dilution)
Name
Sample
Sample
Sample
Sample
Formula
!SampleNames
!SampleNames
!SampleNames
!SampleNames
Name
Wells
Wells
Wells
Wells
Formula
!WellIDs
!WellIDs
!WellIDs
!WellIDs
Name
Sample#
Concentration
Values
Values
Formula
Index
!Concentration*
!WellValues
!WellValues
Name
Values
Values
R (Outside Standard
Range)
R (Outside Standard
Range)
Formula
!WellValues
!WellValues
If(Values)>=‘MinStd@
Standards’ and
Values<=‘MaxStd@Standards’,
“”,“R”
If(Values)>=‘MinStd@
Standards’ and Values<=
‘MaxStd@Standards’,
“”,“R”
Name
Mean Value
MeanValue
Result
Result
Formula
Average(Values)
Average(Values)
InterpX(STD@StandardCurve,Values)
InterpX(STD@StandardCurve,Values)
Name
Std.Dev.
MeanResult
MeanResult
Formula
Stdev(Values)
Average(Result)
Average(Result)
Name
CV%
Std.Dev.
Std.Dev.
Formula
Cv(Values)
Stdev(Result)
Stdev(Result)
Name
CV%
CV%
Formula
Cv(Result)
Cv(Result)
Name
Dilution
Formula
!Factor*
Name
Adj.Result
Formula
MeanResult*!Factor
* !Concentration, !Factor, and !SampleDescriptor return identical information.
4-18
SOFTmax PRO for Lmax User’s Manual
Chapter 4: Reading Microplates
The [Edit] Button
When you click the [Edit] button, the Group Settings dialog box will appear,
reflecting the settings for the active group (currently visible in the group dropdown list). If you wish to edit a group that is not currently active, first choose
the group from the drop-down list and then click the [Edit] button. The figure below shows the Group Settings dialog box for the active group called
“Patient#1.”
Name of Group
Sample Descriptor
Units for Sample Descriptor
Column Format
Setting
Choices are:
Figure 4.15: Group Settings Dialog Box for the Group Named “Patient#1”
The name, sample descriptors, and column format can be changed for the
group that you are editing.
When you edit a group, you will notice that the information shown for the
Column Format in the Group Settings dialog box changes to show the name
of the original group used to define the group columns (see Figure 4.16).
When you are editing Group
Settings (rather than creating
a new group), the word
“original” precedes the
Column Format.
Figure 4.16: Groups Settings Dialog Box Showing Original Column Format
SOFTmax PRO for Lmax User’s Manual
4-19
Chapter 4: Reading Microplates
! CAUTION: Changing the column format setting will cause the columns
in the group to revert to their original defaults as shown in Table 4.2 on
page 4-18. If you have added columns or changed column information
within the existing section for the group you are editing, these changes
will be removed.
The [Clear] Button
Allows you to deselect, or clear, wells in the map of the microplate. Highlight
the wells you wish to clear and then click the [Clear] button. Data for cleared
wells will no longer be shown in the data display.
The Sample Area
The Sample area contains the Sample drop-down list and sample descriptor
values (active if defined in the Group Settings dialog box or if assigned automatically by SOFTmax PRO for Lmax).
Sample Name or ID
Sample Descriptor
Figure 4.17: Modifying Sample Names and Descriptor Values in the Template Editor
! CAUTION: When selecting wells to change sample names or descriptors, be sure all wells are replicates of the same sample and group or
that you want them to become replicates of the same sample and
group. SOFTmax PRO for Lmax does not prohibit selecting individual wells from different samples and/or groups, for example, and
changing their descriptions—and they will change to become the same.
Sample Drop-Down List
The sample drop-down list consists of two areas divided by a horizontal gray
line. Before other sample names have been defined, a single, pre-defined
name (“BL”) appears below the gray line (the sample name “BL” is the name
reserved by SOFTmax PRO for Lmax for group-associated blanks). The item
above the gray line is the sample ready to be or currently being assigned.
After being assigned, it will be shown below “BL” below the gray line.
Figure 4.18: The Sample Drop-Down List. When this list first appears, the only selection shown below the dividing line is “BL”; the active sample name that is ready to be
assigned appears above the line.
When samples are assigned to a group, the default name is the first 3 letters of
the group name followed by a number. For a group called “Standard,” for
example, the default sample names would be Sta01, Sta02, Sta03, and so on.
4-20
SOFTmax PRO for Lmax User’s Manual
Chapter 4: Reading Microplates
Sample names can be 300+ characters long; however, only the first five or six
characters will be displayed in the template and in the Plate section.
NOTE: You can type a sample name directly into the box next to the arrow
for the drop-down list by highlighting and typing over the existing
sample name. If one or more wells were highlighted, typing a different name will replace the sample name shown in the template with
the name you have typed and, if the name is new, will add this name
to those that can be chosen in the drop-down list.
When wells have been selected in the template and sample names have been
defined, the sample menu will look like the one below. The checkmark indicates the sample that is currently being named.
Figure 4.19: Sample Drop-Down List—Sample Names Defined and Wells Selected
Sample Descriptor Field
The field associated with the sample descriptor only appears in the Template
Editor tool bar if the group column type that has been selected requires this
type of information. Generally the information entered in this field is a dilution or concentration. Position the cursor in this field and enter a number. The
label and units assigned to the sample descriptor in the Group Settings dialog
box are shown on either side of the field.
Assign Area
The Assign area contains the [Series] and [Assign] buttons.
Figure 4.20: Assign Area of the Template Editor Tool Bar
Assign Button and Function
Click this button to apply a sample name to one or more wells that have been
selected in the template. You may also perform this operation by using the
Enter key on your keyboard.
Series Button and Function
This button is used to define several samples as a series, allowing you to easily
enter incremental sample descriptors (for example, dilutions or concentrations) and sample names to the template as long as the increment can be
expressed as a mathematical operation.
Replicate Samples and Samples in a Series
You can assign the same group or sample definition (same sample name and
description within a group) to multiple wells to create replicates. For example,
you might want to read standards in replicate to ensure that anomalies can be
excluded prior to generating a standard curve. Replicates can be created
using the [Assign] button or with the series function.
SOFTmax PRO for Lmax User’s Manual
4-21
Chapter 4: Reading Microplates
Creating a series is faster than assigning replicates individually. The series
option can be used as long as the replicate values conform to a pattern that
can be described by a mathematical operator (multiply by 2 or add 5, for
example).
A series is defined in one direction (starting from left, right, top, or bottom)
and therefore samples must be arranged sequentially in either ascending or
descending order.
To create a series, do the following:
1) In the Template Editor, highlight the wells to be part of the series. The wells
must be in the shape of a rectangle.
Series
Button
Group Name
Pull-Down
Menu
Sample
Name
Box and
Units
Selected Wells
Figure 4.21: Template with Wells Selected for a Series
2) Click the [Series] button to open the Series dialog box.
Figure 4.22: Series Dialog Box
3) Specify the name of the first sample in the series in the box (or accept the default provided by SOFTmax PRO for Lmax). Subsequent replicates use this
name as a base and either increment the number within the name or append a
number to it. In the example above, the sample name provided by SOFTmax
PRO for Lmax describes the first sample (“01”) in a group named “Standard,”
here shortened to “Sta.”
4) The information shown in the box labeled Sample Descriptor is derived from
the information entered in the Group Settings dialog box. If the information for
4-22
SOFTmax PRO for Lmax User’s Manual
Chapter 4: Reading Microplates
sample descriptor or units is not correct, you may change it here. If you did not
already do so, specify the starting value for the first sample in the series. Values
for subsequent samples are calculated from this starting value.
5) Choose the operator for the series (+, -, *, or /) from the Step by: drop-down
list. Enter the starting value for the series in the Starting value: box. The increment is entered in the box to the right of the Step by: box and below the Starting value: box. Figure 4.22 shows a starting value of “.5” with the operator
being division (“/”) and the increment being “2.” Thus the series will start
with a value of “.5” and divide each subsequent sample by 2 to produce the
following series values: .5, .25, .125, etc.
6) You must assign a fill direction (from the top, bottom, left, or right—to describe how the series will fill the wells) and a number of replicates. Various options are diagrammed in Figure 4.23 using a 4 ×4 block of wells (for more
information about replicates, see “Replicate Samples and Samples in a Series”
on page 4-21). The maximum number of replicates depends on the selection of
wells: if you are filling down from the top, for example, and you have chosen
a block of wells that is 4 wells wide by 8 wells high, the maximum number of
replicates will be four; with the same block of wells selected, filling from the
left would allow eight replicates. If the number of replicates you choose does
not divide evenly into the number of rows or columns you select, depending
on the filling direction, the remaining wells that cannot contain replicates will
be labeled as additional individual wells in the series. For example, if you fill
a block of 4 x 4 wells from the top, and choose three replicates, then the first
three columns will contain the replicates and the last column will contain the
additional wells in the series (see the last diagram in Figure 4.23). This replicate feature allows you to quickly define the number of replicates and, in cases
where the series has more samples than a single row or column, to name them
simultaneously. To create a series with all 96 samples, highlight all the wells in
the plate, select the fill direction, and set the replicates to 1.
Fill from Top (one replicate)
Fill from Bottom (one replicate)
Fill from Right (four replicates)
Fill from Left (two replicates)
Fill from Top (three replicates)
Figure 4.23: Fill Options and Replicate Settings
SOFTmax PRO for Lmax User’s Manual
4-23
Chapter 4: Reading Microplates
7) Click [OK] to save the series and close the dialog box. While still in the Template Editor, you can view the value assigned to any well by clicking that well.
The value will be displayed at the top of the Template Editor. Holding down
the Ctrl+Shift keys (both Mac and PC) will display the values for all wells.
NOTE: Sometimes you may wish the names of a series of samples to increment but may not have a concentration or dilution factor that you
wish to enter, or you want the concentration or dilution factor to
remain constant. This can be done using the [Series] button, setting
the starting value to 1 or another constant value, and either multiplying by 1 or dividing by 1. In this way, the names will increment but
the value of concentration or dilution will not change. If you don’t
have a concentration or dilution factor, simply deselect the sample
descriptor checkbox if it is selected.
NOTE: If sample names are set to increment automatically using the Series
function, be aware that SOFTmax PRO for Lmax will automatically
truncate the sample name to three or four characters, including the
incrementing number if the sample name starts with letters. If the
sample name is entirely numeric, it will not be truncated. If sample
names are very long, and they must be kept long for reference, you
will have to set up your replicates manually and will not be able to
use the series function.
Blanking
Blanking (Pre-Read Plate)
The blanking selection found in the Instrument Settings dialog box for
enpoint mode (only) is known as pre-read plate blanking, but pre-reading the
plate is only one of five types of blanking available in SOFTmax PRO. Understanding the differences between the types of blanking functions will enable
you to choose the type of blanking that is appropriate for your assay. Note
that all types of blanks can be used in combination and have cumulative
effects. Pre-read plate blanking for endpoint mode is discussed here; for a
description of the other types of blanking that are available and how these
blanks work in combination, see “Blanking” on page 4-24.
Figure 4.24: Pre-Read Plate Blanking Section of the Instrument Settings Dialog Box
(Endpoint Mode Only)
4-24
SOFTmax PRO for Lmax User’s Manual
Chapter 4: Reading Microplates
The purpose of pre-read plate blanking is to correct for well-to-well
variability. The pre-read values will be stored in the data file and the
individual well values collected during the pre-reading of the plate will be subtracted
from the individual well values obtained during the actual reading of samples.
Pre-read blanking may be turned off in the Reduction dialog box (click on the
[Reduction] button) so the data may be seen with and without pre-read
blanking subtracted. This option is only available within the Reduction dialog
box if pre-read blanking was chosen in the Instrument Settings for endpoint
mode.
NOTE: Molecular Devices recommends that you fill the wells of the preread plate with appropriate buffer.
Other Types of Blanks
In addition to the pre-read plate blanking selection found in the Instrument
Settings dialog box, other types of blanking are available in SOFTmax PRO
for Lmax and these others can be used with other read modes. Understanding
the differences between the types of blanking functions will enable you to
choose the type of blanking that is appropriate for your reading. Note that
blanks can be used in combination and have cumulative effects.
The other types of blanking besides pre-read plate blanks that are defined in
SOFTmax PRO for Lmax are:
• Plate blanks
• Group-associated blanks
Plate Blanks
Wells can be assigned to a “Blank” group in the Template Editor. Unlike preread plate blanks, the average value of all the wells in a plate blank group is subtracted from all individual well values obtained during the reading of microplates. Plate Blank subtraction may be turned off in the Reduction dialog box
so that the data may be seen with or without plate blank subtraction.
NOTE: Plate blanks are only subtracted from wells on the same plate to
which they are assigned. The checkbox for Plate Blank subtraction
only appears in the Reduction dialog box after data has been collected.
For kinetic data, the blank value is averaged and subtracted on a point-bypoint basis. The example below shows a graphic representation of original
and average plate blank data, followed by the resulting data with average
subtracted.
SOFTmax PRO for Lmax User’s Manual
4-25
Chapter 4: Reading Microplates
RLU
RLU
RLU
Time
Sample Well
Time
Time
Average of Blank Wells
Blank-Subtracted
Sample Well
Figure 4.25: Graphic Representation of Plate Blank Subtraction
Group-Associated Blanks
Blank wells can be assigned within any group (other than the “Blank” group)
in the Template Editor. The average reduced value of the blank wells within that
group will be subtracted from individual reduced values within that group only. This
blanking function uses the reduced number (example: !Lm1-!Lm2, Vmax,
etc.) only—it does not subtract on a point-by-point basis. When a group blank
has been assigned, it is automatically subtracted. To see the reduced number
without the group blank subtracted, mask the group blank wells.
Group blanks apply to all wells in a group and thus may be subtracted from
wells in more than one Plate section.
Blanks in Combination
It is possible to use the blanking functions in combination. For example, you
could perform plate blanking and also include blank wells within certain
groups. The effects of the different blanking functions are cumulative, so it is
important to understand the function of each before using both types of
blanking in a single assay. Plate blanking is applied to the raw data acquired
from the instrument whereas group-associated blanks are applied to the
reduced number. Group-associated blank subtraction is only visible in the
Plate section when the reduced number is displayed. Figure 4.26 shows plate
blanks and group-associated blanks in the Template Editor.
4-26
SOFTmax PRO for Lmax User’s Manual
Chapter 4: Reading Microplates
Blank Group
(Plate Blank)
Group-Associated
Blank Wells
Figure 4.26: Template Editor Showing Plate Blank and Group-Associated
Blank Wells
In the figure above, note that the plate blank in the upper left appears as a
separate group named “Blank” and individual samples within this group are
named “BL.” The group-associated blank wells, shown in the upper right, are
not a separate group—the samples, also named “BL,” are contained within
the boundaries of the large group called “Unknowns” and are the same color
as that group.
NOTE: In order to save changes you have made to the template in the Windows version of the Template Editor, be sure to click the [OK] button
to close the window rather than clicking the Control Menu box. Clicking the Control Menu box (located in the upper left of the window)
performs the same function as the [Cancel] button: the window will
close but any changes you have made to the template will not be
saved.
Copying and Pasting Templates
Copying Complete Template Information
Two template actions—Copy and Paste—can only be activated from the Plate
menu (when a Plate section is active) rather than from the Template Editor. If
you have created a template in a Plate section and wish to use it in another
Plate section, you may copy that template and paste it into the new section.
The results of copying and pasting a template depend upon whether the
action is performed within the same experiment or between experiment sections.
Copying and Pasting within the Same Experiment Section
To copy a template, make the section containing that template active and
choose Copy Template from the Plate menu (the menu name changes to
reflect the type of active section). Then activate the destination Plate section
and choose Paste Template from the Plate menu.
SOFTmax PRO for Lmax User’s Manual
4-27
Chapter 4: Reading Microplates
Figure 4.27: Copy Template and Paste Template Commands in the Plate Menu
The group names and sample names of the pasted template are identical to
those of the source template. In effect, the destination template is considered
an extension of the original template and all wells on the destination plate are
considered replicates of the wells on the source plate (same group and sample
names). Any changes made to the template on the destination plate will also
be made on the source plate. Data from the two Plate sectionss will be analyzed
together.
Copying and Pasting between Different Experiment Sections
To copy a template, make the section containing that template active and
choose Copy Template from the Plate menu (the menu name changes to
reflect the type of active section). Then activate the destination Plate section
and choose Paste Template from the Plate menu.
The group names and sample names of the pasted template will be identical
to those of the source template but, since they are in different experiments, the
full name will be different (for example: group@experiment#2 instead of
group@experiment#1). Any changes made to the template of the destination
Plate section will not affect the source section. Data from the two Plate sections
will not be analyzed together.
Copying and Pasting Template Regions
Contiguous regions of templates can be copied and pasted to other regions of
templates (within the same or to a different experiment). All template settings
are pasted into the new template except the group name: the new group is
given the name “Group#X” where X is the next greater number than that
used already for group names.
To copy a region of a template, highlight the region and then select Copy from
the Edit menu or press C (Macintosh) or CTRL-C (Windows). Only the highlighted wells will be copied.
To paste the region into another area of a template, highlight the region and
select Paste from the Edit menu or press V (Macintosh) or CTRL-V (Windows).
Only the highlighted wells will have template information pasted into them.
Data is pasted using row priority: all wells in a row of highlighted wells have
information pasted into them before proceeding to the next row, from left to
right. If fewer wells are highlighted for pasting than were copied, the data
4-28
SOFTmax PRO for Lmax User’s Manual
Chapter 4: Reading Microplates
will be pasted until all paste-highlighted wells are filled. If more wells are
highlighted for pasting than were highlighted for copying, the extra wells are
left empty.
NOTE: If you try to paste template information between Plate sections having different plate format settings, an error will result. Plates must be
of the same type to copy and paste template information.
Reading a Microplate
When you read a microplate using an Lmax, the information sent by the
instrument to SOFTmax PRO for Lmax is luminescence data which is the
measurement of light given off by a chemical or biochemical reaction.
You can start a reading at any time after defining instrument settings. It is not
necessary to define groups and assign wells within the Template Editor first.
The values received from the Lmax are raw luminescence readings and are
not affected by settings in the Template Editor. Only instrument settings must
be defined prior to reading a microplate.
To start a reading, insert the prepared microplate in the drawer and then click
the [Read] button in the status bar or choose Read from the Command menu.
If you have created more than one Plate section, and no Plate section is active,
choosing the Read command will cause a dialog box to appear asking you to
choose which section to read (see Figure 4.28). Select the correct section and
then click [OK] to close the dialog box. If a Plate section is active, choosing the
Read command will read that plate.
Figure 4.28: Select Section Dialog Box
If you select a Plate section that already contains data and choose to Read
again, an alert appears, asking you to confirm replacing data in the destination plate (see Figure 4.29). If you select [Replace], the reading will proceed
and the previous data will be replaced with new data.
Figure 4.29: Alert Regarding Replacing Data for Plate Section
After beginning a reading, the status bar will show the actions that are occurring in the Lmax, along with a box showing the elapsed time for each action
SOFTmax PRO for Lmax User’s Manual
4-29
Chapter 4: Reading Microplates
in minutes and seconds. The [Read] button will change to [Stop], allowing
you to terminate a reading, if necessary. An example of the appearance of the
status bar at the start of a kinetic reading is shown below.
Figure 4.30: Status Bar during a Long Kinetics Reading
The values read by the Lmax will appear in the data display of the Plate section as they are received (in real time). Depending upon the read mode (endpoint, dual read, or kinetic), the plate type, and the display options selected,
the data display will show one or more numbers or plots.
You can enlarge the display of one or more wells while a kinetic reading is in
progress. Double-click a single well to enlarge its display to a Well Graph or
hold the Shift key while selecting more than one well, and then choose
Graph... from the Plate menu or click the graph button on the tool bar to display the data from multiple wells in one enlarged Well Graph. The data in the
enlarged Well Graph will update to show new data points as they are
received from the Lmax.
Other choices and settings within SOFTmax PRO for Lmax affect the way in
which data is displayed—the type of reduction, specific time settings, and
more. These settings are discussed in Chapter 5, “Displaying and Analyzing
Data.”
4-30
SOFTmax PRO for Lmax User’s Manual
Chapter 5: Displaying and Analyzing Data
Introduction . . . . . . . . . . . . . . . . . . . . . . . . . . . . . . . . . . . . . . . . . . . . . 5-3
Initial Data Display and Reduction . . . . . . . . . . . . . . . . . . . . . . . . . 5-4
The Data Display . . . . . . . . . . . . . . . . . . . . . . . . . . . . . . . . . . . . . . . . 5-4
The Display Dialog Box . . . . . . . . . . . . . . . . . . . . . . . . . . . . 5-5
Well Graphs of Kinetic Wells . . . . . . . . . . . . . . . . . . . . . . 5-12
Masking Wells . . . . . . . . . . . . . . . . . . . . . . . . . . . . . . . . . 5-15
Data Reduction . . . . . . . . . . . . . . . . . . . . . . . . . . . . . . . . . . . . . . . . . 5-16
Endpoint . . . . . . . . . . . . . . . . . . . . . . . . . . . . . . . . . . . . . . . 5-18
Dual Read . . . . . . . . . . . . . . . . . . . . . . . . . . . . . . . . . . . . . . 5-18
Long and Fast Kinetics . . . . . . . . . . . . . . . . . . . . . . . . . . . 5-18
Custom Reduction Formulas . . . . . . . . . . . . . . . . . . . . . . 5-21
Recalculation Options . . . . . . . . . . . . . . . . . . . . . . . . . . . . 5-22
Displaying Data in Group, Graph, and Notes Sections . . . . . . . 5-22
Group Sections . . . . . . . . . . . . . . . . . . . . . . . . . . . . . . . . . . 5-22
Notes Sections . . . . . . . . . . . . . . . . . . . . . . . . . . . . . . . . . . . 5-28
Graph Section . . . . . . . . . . . . . . . . . . . . . . . . . . . . . . . . . . . 5-28
Formulas in SOFTmax PRO for Lmax . . . . . . . . . . . . . . . . . . . . . . 5-46
Chapter 5: Displaying and Analyzing Data
5-2
SOFTmax PRO for Lmax User’s Manual
Chapter 5: Displaying and Analyzing Data
Introduction
Initial display and reduction of the data received from the Lmax is performed
in the Plate section in which the data has been collected. Display and reduction parameters can be set up either prior to collecting data or after data has
been collected. The display and reduction parameters may be modified at any
time.
Data analysis and the display of analyzed data is also performed in the Group
sections (created when wells are assigned to groups in the Template Editor)
and the Graph section(s).
Notes sections may be used in conjunction with any other section to provide
text commentary and/or a summation of data through the use of summaries.
Notes sections are used most commonly to provide an introduction to or summary of results for a data file.
All data files have a minimum of one Plate section containing data. Multiple
Plate sections may be present. Most files will have a template and Group,
Graph, and Notes sections. However, depending upon the assay and how
you wish to report the data, only some of these sections may need to be
present in a file. Some simple assays allow you to calculate concentration in
the Plate section. In such an example, Group and Graph sections would be
necessary only if you wished to display the data graphically.
Standards and unknowns are defined in a template. Unknowns are then interpolated from a standard curve. The following diagram shows the relationship
between the different sections in SOFTmax PRO for Lmax:
Standard
Group Table
Reduced Number
from Plate
Reported Here
Plate
with Template
Initial Data
from
Lmax
Graph Section
Unknowns
Group Table
Plots Created with
Information from
Standards
Group Table
Reduced Number
from Plate
Reported Here
Interpolated Values
(Results)
Reported from
Graph Section
Figure 5.1: Relationship of Sections
This chapter discusses the initial display and reduction of data in the Plate
section first, followed by display and data analysis in the Group, Graph, and
Notes sections.
SOFTmax PRO for Lmax User’s Manual
5-3
Chapter 5: Displaying and Analyzing Data
Initial Data Display and Reduction
The manner in which data is displayed in a Plate section depends on the type
of reading that was performed (endpoint, dual read, long kinetics or fast
kinetics), but can be customized by choices made in the data display and
reduction settings. Depending on the type of reading performed, display
options include:
• Number or plot displays for RLU (relative luminescence units), with or
without reduced number.
NOTE: The number format (use of commas or periods in numeric notation)
chosen for the computer operating system in general is reflected in
the way that SOFTmax PRO for Lmax displays data.
• Number, Plot, Threshold, Ranged, or Grayscale (with or without reduced
number)
• If you have chosen 384-well plates from the Instrument Settings, you can
display the wells in different ways: Normal, Vertical, Rotated, Large, or
Interleaved.
Default displays are shown automatically unless you choose a different display option.
Reduction options allow you to display the raw data received from the Lmax
in a reduced (analyzed) form. Which reduction options are available depend
on the read mode; custom settings, using formulas you create, are available
for all read modes and read types.
Reduction settings do not affect the raw data but simply cause it to be displayed differently, allowing you to change reduction settings without affecting the raw data from the plate reading in any way.
Custom reduction formulas require the use of accessors and operators that
are understood by SOFTmax PRO for Lmax. Information regarding custom
formulas can be found in the Formula Reference Guide.
The Data Display
After a plate has been read, the information sent from the Lmax is shown in
the data display in the active Plate section. The default display for data from
endpoint readings for the Lmax is raw RLU numeric values. Data from kinetics readings is displayed in plots format as raw RLU values with respect to
time. While a kinetic reading is in progress, the display updates dynamically
to show the data collected so far.
All choices except those defined in the Instrument Settings affect only the
manner in which the data is displayed—the raw data is not changed—permitting you to optimize the display after data is collected.
NOTE: Data reduction changes the way in which data is displayed and also
affects the values used in calculations within SOFTmax PRO for
Lmax. While the raw values remain unchanged, calculations will use
reduced values, if any, and are, therefore, affected by settings chosen
in the Reduction dialog box. For more information, see “Data Reduction” on page 5-16.
5-4
SOFTmax PRO for Lmax User’s Manual
Chapter 5: Displaying and Analyzing Data
The Display Dialog Box
Before or after a plate has been read, you can click the [Display] button to
open the Display dialog box which allows you to change the way the data is
presented. Choices available in this dialog box depend on whether a Plate section is currently active and which read mode you have chosen (for example,
the choice for “Plots” is not shown if endpoint mode is selected). Figure 5.2
shows the default Display dialog boxes for the different read modes.
The Display dialog box is divided into two parts (left and right): the default
display, “Raw RLU,” is shown to the left of a dividing line; the choices for
reduced data displays are shown to the right of the dividing line. Note: data
reduction itself is performed separately; settings here simply determine how
the reduced data will be displayed in the Plate section.
The dialog boxes below show the default display choices for the three modes:
raw RLU values (numbers) for endpoint; raw RLU values (numbers) for dual
read; the change in raw RLU values over time displayed as a plot for both
long and fast kinetics. Other choices available in this dialog box include displaying the data as a single reduced value (number), in threshold, ranged, or
gray scale formats, or any combination of display choices with the reduced
number (the reduced number display choice cannot be used with the reduced
number checkbox).
SOFTmax PRO for Lmax User’s Manual
5-5
Chapter 5: Displaying and Analyzing Data
Endpoint
Reduced
Display
Choices
Raw RLU
(defau lt)
Dual Read
Raw Data
Plot RLU
vs.
Time
(default)
Reduced
Display
Choices
Long and Fast Kinetics
Raw Data
Plot RLU
vs.
Time
(default)
Reduced
Display
Choices
Figure 5.2: Endpoint, Dual Read, and Long and Fast Kinetics Display Dialog Boxes.
Data in the Plate section is displayed in a grid array (microplate format). With
all plates other than 384-well plates, the display is always shown as a standard microplate, with well A1 in the top left corner. If you are reading
384-well plates, additional display options can be chosen to make the display
of data clearer:
• Normal: shows the data in standard left-to-right format, with well A1 in the
upper left corner. Columns 1 through 24 are along the top and rows A
through P are shown from top to bottom. The wells are smaller and data is
shown with fewer digits (less precision).
5-6
SOFTmax PRO for Lmax User’s Manual
Chapter 5: Displaying and Analyzing Data
• Vertical: the plate is shown in the same orientation as Normal except that
columns 1 through 12 (all rows) are shown above columns 13 through 24
(all rows).
SOFTmax PRO for Lmax User’s Manual
5-7
Chapter 5: Displaying and Analyzing Data
• Rotated: Same as the Normal view except that it is rotated 90 degrees clockwise (well A1 is in the upper right corner).
• Large: Same as the Normal view except larger. This display can be seen in
its entirety only if you have the page size set for legal paper (8.5 x 14 inches)
in landscape orientation (set this in Page Setup or Preferences under the File
menu). In the example below, the display is shown as it appears if you do
not change the page size from letter-size to legal.
5-8
SOFTmax PRO for Lmax User’s Manual
Chapter 5: Displaying and Analyzing Data
• Interleaved: In this display, the wells are shown in a format that “skips”
every other well as follows: all odd columns and rows begin in the upper
left corner of the plate display and are followed by all even columns and
rows. So well A1 is still in the upper left corner, but it is followed horizontally by well A3, A5, ... A23, A2, A4, etc., and vertically by well C1, E1, ... O1,
B1, D1, etc. This display is most useful when the 384-well plate is composed
of 4 daughter plates of 96 wells each.
Reduced Number
The reduced number is based on the settings defined in the Reduction dialog
box. It is a combination of plate blank subtraction and/or endpoint reduction
or kinetic reduction. The information acquired from the microplate reader is
reduced to a single number or value. The reduced number will be reported in
the Group section when a template has been defined.
To view by reduced number alone, select the Number option (the first choice
to the right of the default, just after the dividing line); to see a reduced number as well as another type of display, click the box next to the option that says
“With reduced number” in the lower left of the dialog box to enable it. Changing the reduction parameters after choosing a reduced data display mode will
cause the display to update accordingly. More information about reduction
formulas and how to customize them follows later in this chapter.
Threshold, Ranged, and Gray Scale
To display Threshold, Ranged, or Gray Scale data, high and low values must
be entered. When you choose one of these display options, SOFTmax PRO
for Lmax provides default values for the high and low limits by means of an
autoranging function (encompassing all the data from lowest to highest
value). You can change the high and low limits by highlighting the existing
value and entering a new value. An example of the Display dialog box for a
kinetic reading with the Threshold display option chosen is shown in
Figure 5.3.
SOFTmax PRO for Lmax User’s Manual
5-9
Chapter 5: Displaying and Analyzing Data
Low/High
Limit Boxes
Figure 5.3: Display Dialog Box for Long Kinetics Threshold Display
Threshold
The Threshold display shows the raw data as a plus (+) for values above the
high limit, an asterisk (*) for values within the limits, and a minus (-) for values below the low limit. Figure 5.4 shows an endpoint reading displayed
using the Threshold option along with the reduced number.
Figure 5.4: Endpoint Data Displayed as Threshold with Reduced Number
Ranged
When the Ranged display is chosen, raw data that falls between the high and
low limits is assigned proportionally to integer values from 0 through 9. Values above the high limit are displayed as a plus (+) and values below the low
limit are displayed as a minus (-). Figure 5.5 shows reduced kinetic data displayed in Ranged format.
5-10
SOFTmax PRO for Lmax User’s Manual
Chapter 5: Displaying and Analyzing Data
Figure 5.5: Fast Kinetics Data (Reduced) Displayed as Ranged
Gray Scale
The Gray Scale option presents the raw data in eight shades of gray, changing
from light (for values less than or equal to the low limit) to dark (for values
greater than or equal to the high limit). Figure 5.6 shows reduced endpoint
data displayed as Gray Scale.
Figure 5.6: Endpoint Data (Reduced) Displayed as Gray Scale
SOFTmax PRO for Lmax User’s Manual
5-11
Chapter 5: Displaying and Analyzing Data
Well Graphs of Kinetic Wells
You can enlarge the display of the wells shown with either long or fast
kinetics mode to get a close-up view of the data. This is done by either doubleclicking the particular well in the data display or by selecting the well and then
clicking the Well Graph button in the Plate section tool bar.
Well Graphs plot the data for the individual wells in a microplate and show
the well ID and reduction information, including the goodness of fit (R^2
value), if appropriate. The default display for the X-axis shows time; RLU is
displayed on the Y-axis.
Positioning the cursor within a Well Graph shows X and Y values for the cursor location, allowing you to determine more precisely the location of data
points.
Well Graph Options
Along the bottom of each Well Graph dialog box are eight buttons that perform the following functions:
• [Print]
Opens the Print dialog box.
• [Reduction]
Opens the Reduction dialog box.
By default, the ranges on the enlarged plot are set to the limits defined in
the Reduction dialog box, and the information included near the bottom of
the window is based on the reduction settings currently in use. You may
change these settings (type of reduction used, minimum and maximum
RLU limits, lag time and end time, and number of Vmax Points). More
information about the reduction options can be found later in this chapter.
NOTE: Changes to the reduction settings made within well graphs will be
applied to all wells in the Plate section. When viewing Raw data, you
can scale the graph to see data outside the reduction limits [line(s) are
included on the graph indicating the limits and the area outside of
them will be shaded slightly]. This view should assist you in determining the best limits for the reduced data.
•
Show Raw/Show Reduced button
This button toggles the Well Graph between views of raw and reduced
data. When the Well Graph is opened, the initial view depends on the Display settings for the Plate section. If raw data is being displayed in the Plate,
the initial view in the Well Graph will be raw data and the button will be set
to “Show Reduced.” If reduced data is being displayed in the Plate section,
the initial view in the Well Graph will be reduced data and the button will
be set to “Show Raw.”
•
Scale to Data/Scale to Limits button
This button toggles between a view of the data within the reduction limits
and a view of the entire data set. Switching between these views helps to
5-12
SOFTmax PRO for Lmax User’s Manual
Chapter 5: Displaying and Analyzing Data
visualize how the limit settings affect data reduction. If raw data is being
viewed in the Plate section, the display in the Well Graph is set initially to
show the plot scaled to the reduction limits. If reduced data is being viewed
in the Plate section, the Well Graph display is set initially to show the plot
scaled to the data.
NOTE:
•
If you are viewing raw data and click the [Scale to Limits] or [Scale
to Data] button, only the display of raw data in the Well Graph will
be affected (the button will not affect the view of reduced data). The
same is true if you click this button while viewing reduced data. To
produce comparable scaling of both raw and reduced displays, this
button must be set to either Scale to Limits or Scale to Data for both
raw and reduced views of the Well Graph.
Graph Options button
Opens the Well Graph Options dialog box which allows you enable or disable connected points or plotted symbols the graph.
Figure 5.7: Graph Options Dialog
•
X-Axis Settings button
•
Y-Axis Settings button
Opens the Well Graph Axis Settings dialog box for the particular axis,
allowing you to set Auto Range parameters, choose the minimum and maximum values for the selected axis, cause the axis to be auto-ranged, add or
remove gridlines, and add or remove axis tick marks. When a Well Graph is
opened, the default settings are to show the reduction limits for that axis
with Auto Ranging off and gridlines and tick marks selected. Only the Well
Graph being viewed is affected by changes in these dialog boxes.
• [Done]
Closes the Well Graph dialog box.
SOFTmax PRO for Lmax User’s Manual
5-13
Chapter 5: Displaying and Analyzing Data
Figure 5.8: Well Graph for a Single Fast Kinetics Microplate Well (Raw Data)
Multiple wells from the same Plate section can be graphed together in one
enlarged window. Select the well in the data display (hold the Shift key if you
are selecting non-contiguous wells) and then click the Graph button or double-click in one of the selected wells.
Figure 5.9: Well Graph for Three Fast Kinetic Wells of a Microplate (Raw Data)
The choices you make for viewing the data in the Plate section also affect the
way the Well Graph appears. Figures 5.8 and 5.9 show Well Graphs for raw
data displays. If you display one of the reduced options (reduced number,
Threshold, Ranged, or Gray Scale), the Well Graph will show the plot with an
indicator of the reduced value and will include the word “Reduced” in the
window title.
5-14
SOFTmax PRO for Lmax User’s Manual
Chapter 5: Displaying and Analyzing Data
Zoom Box
You can enlarge the Well Graph even further by clicking the zoom box in the
upper right-hand corner of the window (the center box of three in the upper
right corner in Windows). Clicking the zoom box once will cause the window
to fill the total display on your monitor; clicking the zoom box again will
return the window to its previous size.
Size Box
Clicking and dragging the size box located in the lower-right corner
(Macintosh) or clicking and dragging the lower right corner of the window
(Windows) allows you to make the Well Graph any size desired.
Printing the Well Graph
You can print the Well Graph window, if desired, by clicking the [Print]
button at the bottom left corner of the dialog box.
NOTE: If you enlarge the Well Graph to greater than 12 inches, Molecular
Devices does not recommend printing it since the graph will not fit
on an 8.5- by 11-inch page and the printout will be truncated.
Masking Wells
If you find data in certain wells (outliers) that should be excluded from the
calculations to be performed by data reduction, you can mask these wells.
Select the well(s) to be masked and then click the Mask button in the Plate
section tool bar or choose Mask... from the Plate menu. Masked wells are
shown with an overlay of diagonal lines and are marked with the word
“Masked.”
The masking function can be used as a “what if?” tool. For example, you
could suppress or enable certain functional groups within the experiment.
Suppose you have included a group blank in the template and want to see the
data with and without the blank. Masking the group blank wells would suppress the blanking function; unmasking them would enable it again.
Masked
Wells
Figure 5.10: Masked Wells
SOFTmax PRO for Lmax User’s Manual
5-15
Chapter 5: Displaying and Analyzing Data
To remove masking from one or more wells, highlight the masked well(s) and
click the Mask button in the Plate section tool bar (toggles masking on and
off) or choose Mask... from the Plate menu again. The diagonal lines covering
those wells (and masking function) will be removed.
Data Reduction
Raw data received from the Lmax can be displayed in an analyzed (or
reduced) form. The reduction process within SOFTmax PRO for Lmax is
based on formulas that reduce the raw data to show a single number for each
well. Further analysis of this reduced number then takes place in the Group
and Graph sections.
SOFTmax PRO for Lmax performs calculations hierarchically when reducing
the luminescence information collected from the instrument. Calculations in
the Plate section are performed in the order shown below. If an option has
either not been selected in the Instrument Settings dialog box or has not been
defined in the template and/or Reduction dialog boxes, SOFTmax PRO for
Lmax starts/continues with the next listed calculation.
1) Plate blank subtraction
2)
Endpoint or kinetic reduction
3)
Group blank subtraction
You can access the Reduction dialog box in several ways: by clicking the
[Reduction] button in the tool bar of the active Plate section, by
choosing Reduction from the Plate menu, or by clicking the [Reduction] button in the Well Graph display. The appearance of the Reduction dialog box
will be different depending on the type of read mode you have chosen, and
the options you have chosen in the Instrument Settings dialog box. Figure 5.11
shows the Reduction dialog box for endpoint, dual read, and kinetic modes,
along with the default reductions for each of those modes.
5-16
SOFTmax PRO for Lmax User’s Manual
Chapter 5: Displaying and Analyzing Data
Reduction Dialog Boxes
Default
Reductions
Endpoint
Dual Read
Long Kinetics
and
Fast Kinetics
Figure 5.11: Reduction Dialog Boxes for All Read Modes.
SOFTmax PRO for Lmax User’s Manual
5-17
Chapter 5: Displaying and Analyzing Data
All of the read modes offer one or more predefined choices for reduction. The
predefined reductions are described below under the appropriate read mode
heading. In addition, with any read mode, you can create a custom reduction
formula to better suit your needs. Since all custom reduction formulas are
defined the same way, regardless of read mode, they are described together
after the individual read mode sections.
Endpoint
The default reduction for endpoint readings is !MValue. You can also choose
Custom in order to create a different reduction formula.
Dual Read
The default reduction for dual readings is !MValue. Other reductions available from the pop-up menu are !PValue, !MValue/!PValue, !PValue/!MValue,
!MValue-!PValue, and !PValue-!MValue. You can also choose Custom in order
to create a different reduction formula.
Long and Fast Kinetics
The default reduction for kinetic readings is !MValue. If you do not wish to
use the default reduction, you can choose Custom and create a different
reduction formula.
Kinetic Limits
The Limits settings for the display of kinetic data are MaxRLU, MinRLU, Lag
Time, and End Time.
NOTE: The display of RLU values is shown relative to the first point measured for each well. Negative kinetic values decrease with time, and
limits should be set accordingly (below 0) to view negative kinetic
data.
Limits define the data that will be viewed and included in data reduction,
but do not affect data collection. If you alter a limit to show less data,
you can always display the “hidden” data again by changing the
limit.
MaxRLU
The limit for the maximum value you wish to report. Any values from the
reading that are above this limit will not be shown and will be excluded from
data reduction. The default is 20,000 for RLU.
The MaxRLU reduction parameter can be used to exclude the non-linear portion of the reaction from data analysis. This type of data reduction is most
useful in reactions where the initial portion of the data is linear. You might
also adjust the End Time setting to remove a non-linear portion after a certain
time point in the reaction. Using MaxRLU allows the use of the maximum
number of linear points to calculate the slope of the line and, thus, to determine the rate for each well.
5-18
SOFTmax PRO for Lmax User’s Manual
Chapter 5: Displaying and Analyzing Data
MinRLU
The limit for the minimum value you wish to report. Any values from the
reading that are under this limit will not be shown and will be excluded from
data reduction. The default is 0 RLU. To display negative kinetics, the value
should be set below 0 (zero).
Lag Time
Specifies how many initial data points are excluded from the calculation of
Vmax Rate. Lag Time truncates the data used in the calculation. It does not
prevent data from being collected. The kinetic plots will not display the data
collected prior to the set Lag Time. The value for Lag Time can be changed
after the plate is read. The default is 0.
End Time
This setting specifies the time at which you wish to stop showing data in the
display. Any values occurring after this limit will not be reported in the display. The default setting is the total assay time. The value for end time may
not be greater than the total assay time.
Absolute Values
This setting causes the plots shown in the data display to be drawn at their
absolute RLU as opposed to the default (with the box unchecked) which offsets the first point to the (0,0) coordinate. Enabling Absolute Values may cause
some data points that do not fall within the default limits for the plots to “disappear.” To see more data, yet still display absolute values, increase the limits
for MinRLU and/or MaxRLU found in the Reduction dialog box (Figure
5.12).
RLU
Limits
Figure 5.12: Limits in Reduction Dialog Box
If you increase the MaxRLU setting to be at least as large as the largest luminescence value expected, most or all of the data plots should appear in the
data display.
Kinetics Reduction
The default kinetics reduction is Vmax (units per sec). Other reductions available from the pop-up menu are Vmax, Time to Vmax, Onset Time, Time at
Minimum, Time at Maximum, Time at 1/2 Maximum, Slope, Area Under
Curve, or you can choose Custom and create a different reduction formula.
SOFTmax PRO for Lmax User’s Manual
5-19
Chapter 5: Displaying and Analyzing Data
Vmax and Vmax(units per sec)
The maximum slope of the kinetic display of relative luminescence units versus time. The default value displayed is in units/second, where units are relative luminescence units (RLU). The rate is calculated with the use of Vmax
Points (see below) which determines the number of contiguous points over
which Vmax is calculated. The number of Vmax Points defaults to the maximum taken during the reading; you can change this number in the Reduction
dialog box if desired.
NOTE: Vmax = Vmax/sec • 60,000
A linear regression is performed to determine the slope of the line using the
equation:
y = m*X + B
where m is the slope of the line.
The reaction rate is reported in units/sec.
Time to Vmax
This is an alternative method for analyzing non-linear kinetic reactions which
reports the elapsed time until the maximum reaction rate is reached rather
than reporting the maximum rate itself. Used in conjunction with Vmax
Points, Time to Vmax is the time to the midpoint of the line defined by Vmax
Points and used to calculate Vmax. This elapsed time data is useful for applications including coagulation chemistry where the changing concentration of
the reagents does not change Vmax, but rather will change the time at which
the reaction reaches the maximum rate.
Onset Time
This is another method for analyzing non-linear kinetic reactions. Onset Time
reports the time required for a kinetic reaction to change by a specified
amount of luminescence (onset RLU above the initial RLU reading for the
well).
Time at Minimum
This setting reports the time at the minimum RLU that falls within the reduction limits.
Time at Maximum
This setting reports the time at the maximum RLU that falls within the reduction limits.
Time at 1/2 Maximum
This setting reports the time at the half of the maximum RLU that falls within
the reduction limits. To calculate this reduction, SOFTmax PRO for Lmax first
determines the kinetic point (within the reduction limits) that has the maximum signal level. It then scans the kinetic plot from left to right until it finds
two points having signals that bracket half of that value. A linear interpolation between these two points is used to estimate the Time at 1/2 Maximum.
5-20
SOFTmax PRO for Lmax User’s Manual
Chapter 5: Displaying and Analyzing Data
Slope
This setting determines the slope of the combined plot (i.e., the slope of the
line using linear regression). This setting uses all visible timepoints in the
reduction window.
Area Under Curve
This reduction estimates the area under the curve as defined by the data plots
in wells (within the reduction limits). The data plots are treated as a series of
trapezoids with vertices at successive data points and at the X-axis coordinates of the data points. The areas defined by each of the trapezoids are then
computed and summed.
Custom Reduction Formulas
If the predefined reduction formulas do not meet your needs, you can create
one or more different reduction formulas for any or all read modes (endpoint,
dual read, or kinetic). Choosing “Custom” from any of the menus or dialog
boxes causes a Formula button to appear (an example of this button in an
endpoint Reduction dialog box is shown in Figure 5.13).
Formula
Button
Figure 5.13: “Custom” Selected Showing Formula Button (Endpoint)
Clicking the Formula button opens the Calculation dialog box in which you
can name and define a new reduction formula.
Figure 5.14: Calculation Dialog Box (Endpoint)
When you finish your entry in the Calculation dialog box and click [OK], the
formula you have entered then appears to the right of the word “Custom”
and becomes the default selection for the Custom option. You may subsequently edit this formula or enter a new one by clicking the Formula button
again. For a full discussion of custom formulas, see the Formula Reference
Guide.
SOFTmax PRO for Lmax User’s Manual
5-21
Chapter 5: Displaying and Analyzing Data
Recalculation Options
By default, SOFTmax PRO for Lmax performs continuous recalculation of the
data when you read plates, create or change formulas, and so on. At certain
times, it would be useful to disable the recalculation feature so that you can
make alterations to the experiment without waiting for individual recalculations to be completed. Two commands are available in the Edit menu that
allow you to modify the way in which SOFTmax PRO for Lmax performs
recalculation: Suspend Recalculation and Recalculate Now ( =; CTRL+=).
Choosing Suspend Recalculation disables the automatic recalculation feature
of the program and places a checkmark to the left of the command in the
menu to indicate that it has been selected. While this function is enabled, no
recalculation will occur, regardless of what you may change, add, or delete
from the experiment. This is especially useful when creating or changing column formulas within Group sections, for example, as it can speed up the process greatly.
When recalculation has been suspended, you may wish to see the results of
the changes you have made but may still not wish to enable continuous recalculation. Choosing Recalculate Now ( =; CTRL+=) from the Edit menu will
cause SOFTmax PRO for Lmax to examine all elements of the experiment and
perform complete recalculation of the data. Choosing this command does not
enable continuous recalculation but simply causes the program to perform
recalculation once.
To return to continuous recalculation, choose Suspend Recalculation again.
The checkmark next to the command will disappear, indicating that the
function is no longer in use.
NOTE: Recalculate Now ( =; CTRL+=) can be used to see intermediate
results during long kinetic readings. At any time, you can choose
Suspend Recalculation to delay calculations until a later time.
Displaying Data in Group, Graph, and Notes Sections
Group Sections
The manner in which data is displayed in a Group section depends on the
type of reading that was performed (endpoint, dual read, or kinetic), but can
be customized by choices made in the data display, reduction settings, and
the Edit menu.
• Resizing/hiding columns
• Adding/deleting columns
• Showing/editing column formulas
• Adding/editing summaries
• Changing text style
Default displays for Group sections are shown automatically unless you
choose a different display option.
The particular font to be used in a Group section table, as well as its size and
style, can be changed by first selecting one or more columns in the Group sec5-22
SOFTmax PRO for Lmax User’s Manual
Chapter 5: Displaying and Analyzing Data
tion table and then choosing the Text command from the Edit menu and making the desired choices from the dialog box that appears.
Settings from the Plate Section Affect Data Display in Group Section Tables
Reduction options in the Plate section allow you to display the raw data
received from the Lmax in a reduced (analyzed) form. Which reduction
options are available depend on the read mode used and reduction settings
chosen. Reduced number from the Plate section is displayed in the Values column of the Group section tables by default.
Reduction settings do not affect the raw data but simply cause it to be displayed differently. You can change reduction settings without affecting the
raw data from the plate reading in any way.
Custom reduction formulas require the use of accessors and operators that
are understood by SOFTmax PRO for Lmax. A list of these accessors and
operators is given at the end of this chapter.
Resizing and Hiding Columns
The columns in a Group section can be resized in several ways. One of the
simplest is to drag the line dividing the columns to another position (moving
it horizontally). When you point to a line between columns, the cursor
changes to a double arrow with a vertical line through it, showing that it is
ready to move left or right (see Figure 5.15).
Double-headed
arrow cursor
Figure 5.15: Cursor Positioned on a Line between Columns
Reducing Column Size and Hiding Columns
You can reduce a column to a size smaller than the width of its title, in which
case the title will not be completely visible. You can also hide a column by
reducing its size completely (drag one edge of the column on top of the other)
or by selecting that column and choosing Hide from the Group menu.
NOTE: If you hide a column in this way and then wish to view it again, use
the Show All command in the Group menu. All columns that were
hidden will again be visible. There is no way to show only one hidden
column.
SOFTmax PRO for Lmax User’s Manual
5-23
Chapter 5: Displaying and Analyzing Data
Enlarging Column Size
You can enlarge the width of columns to any size. Increasing the size of columns may make the width of the Group section increase beyond the page
width boundary. If this occurs, the columns will “disappear” off the edge of
the screen but are really still there. To bring these columns back into view,
reduce the width of the columns that are still visible until the others reappear.
Divider being
dragged to the
left
Figure 5.16: Dragging a Column Divider Line
NOTE: If the width of a section extends beyond the page width boundary,
the portion that is not visible will not be printed.
To size two or more columns to the same width, highlight those columns and
then drag one of the dividing lines to the desired width. The width of all highlighted columns will be sized the same as the column to the left of the dividing line you are moving.
Columns can also be resized to the minimum amount of space required by
choosing Autosize from the Group menu. By highlighting the entire table or
individual columns and then choosing Autosize, the amount of space each
column requires will be reduced to the minimum size required by the largest
piece of text in that column.
Double-clicking the line dividing two columns causes the single column to
the left of the divider to be sized according to the largest amount of text in
that column.
Showing and Editing Existing Column Formulas
When group sections are first created, the formulas used to calculate the data
are not displayed.
These formulas can be shown (until you choose to hide them again) by making a Group section active and then choosing Show Formulas from the Group
menu. (Note that the command in the menu changes to Hide Formulas after
they are shown.)
5-24
SOFTmax PRO for Lmax User’s Manual
Chapter 5: Displaying and Analyzing Data
Show Formulas Command
Figure 5.17: The “Show Formulas” Command in the Group Menu
Choosing this option causes an additional row to appear (beneath the heading for each column) which shows the formula used to calculate the data in
each column. To see formulas briefly, hold down the shift and control (Ctrl)
keys.
Formulas
Figure 5.18: Formulas Shown in Group Columns
Modifying Column Formulas
To modify the formula for an existing column, double-click the column or
click the column once and then click the formula button in the section tool bar.
The dialog box associated with the column formula will open, allowing you
to edit the formula (and the name) associated with the column.
SOFTmax PRO for Lmax User’s Manual
5-25
Chapter 5: Displaying and Analyzing Data
Create Column Button
Create Summary Button
Formula Button
Figure 5.19: Formula Button Activated and Column Formulas Shown
For a complete discussion of custom formulas, see the accompanying Formula
Reference Guide.
Adding Columns
You can add a new column to a Group section by clicking the Create Column
button in the Group tool bar or by choosing Create Column from the Group
menu which will open the Column Formula dialog box.
Figure 5.20: Column Formula Dialog Box
In the Column Formula dialog box, you can change the name of the new column (from the default which simply lists the column by number) to reflect the
data that it will contain.
If no existing column is selected when you click the Create Column button,
the new column will be created to the right of all existing ones. If you select
(highlight) a column and then add a new column, it will be positioned to the
right of the one you selected. If the table is currently as wide as the sheet of
paper specified in Page Setup when a new column is added, the columns will
“disappear” off the right side of the window but are still there. To bring these
columns back into view, resize visible columns smaller.
New columns can contain references to other columns, both in the current
section or in a different one within the same experiment. For example, if you
wanted to subtract the mean values in one group from those in another, you
5-26
SOFTmax PRO for Lmax User’s Manual
Chapter 5: Displaying and Analyzing Data
could create a new column (in either group) to do this. If the two groups were
named “Group 1” and “Group 2,” for example, and both groups contained a
column entitled “Mean,” you could create a column within “Group 1” that
would subtract the mean values in “Group 2” from those in “Group 1.”
The column formula needed to do this would be:
Mean-Mean@Group2
Numerous possibilities exist for creating and editing column formulas to display the data you desire. For a complete discussion of formulas and operators, see the accompanying Formula Reference Guide.
NOTE: To delete a column, highlight it and press the Delete key or choose
Cut from the Edit menu.
Adding or Editing a Summary in a Group Section
To add a summary at the bottom of a Group section, click the Create Summary button in the tool bar or choose Create Summary from the Group menu.
The Calculation dialog box will appear, allowing you to change the name of
the summary or hide the name, if desired, as well as to enter a description of
the summary and to create a formula for it (including the number of decimal
places for the result, if appropriate). Double-clicking an existing summary
causes the same dialog box to appear, allowing you to modify summary information.
Figure 5.21: Calculation Dialog Box
Information entered in this dialog box will be placed at the bottom of the
Group section as follows:
Name = Description
Formula Result
You can click the checkbox next to Hide Name which will change the way the
summary appears to show:
Description
Formula Result
NOTE: The name assigned to a summary is important since you can reference the summary by name in other formulas (building one upon
another). The summary name can be referenced even if it is hidden.
If you wish to see the formulas associated with summaries without calling up
the Calculation dialog box for each one, you can choose Show Formulas from
the Group menu. To see these formulas only briefly, hold down the shift and
control (Ctrl) keys while that Group section is active. The summaries will
“expand” to show the complete formula along with the title. They will
resume their previous appearance when you release the option key.
SOFTmax PRO for Lmax User’s Manual
5-27
Chapter 5: Displaying and Analyzing Data
Summaries in Group sections can be moved horizontally, if desired, by dragging them left or right. When you position the pointer over a Group summary, the cursor changes to show a double-headed horizontal arrow. Clicking
once highlights the summary; dragging and then releasing the summary
leaves it in the position where the mouse button was released.
To have summaries line up with particular columns in the Group, hold down
the control (Ctrl) key while dragging the summary. When you release the control (Ctrl) key, the summary will “snap back” so that it begins flush to the left
side of the column under which it was released. Each summary can be positioned in a different place in the Group section, if desired.
NOTE: To delete a summary, highlight it and press the Delete key or choose
Cut from the Edit menu. A summary can also be copied or cut and
then pasted in a different location.
You can also change the format of the text in Group section columns and/or
summaries. By selecting the column or summary and then choosing Edit and
then Text Style (Ctrl+T), you can change the font, size, and/or style of the
text.
Notes Sections
The Notes section allows you to enter text describing the experiment and one
or more summary lines that contain formulas. To create a summary, click the
Create Summary button in the tool bar or choose Create Summary... from the
Notes menu.
The Calculation dialog box that appears (see Figure 5.21) allows you to enter
a description of the summary, accept the default title for the summary, change
it, or hide it, and to enter a formula (including the number of decimal places
the reduction should show, if appropriate). Detailed information regarding
operators and accessors can be found at the end of this chapter.
If you wish to see the formulas associated with the summaries without calling
up the Calculation dialog box for each one, you can choose Show Formulas
from the Notes menu. To see these formulas only briefly, hold down the shift
and control (Ctrl) keys while that Notes section is active. The summaries will
“expand” to show the complete formula along with the other summary information. They will resume their previous appearance when you release the
option key.
Graph Section
The Plot#X Dialog Box
Whenever you create a new Graph section or add a plot to an existing graph,
the Plot#X dialog box opens automatically (“X” starts with “1” and increments each time a new plot is added to a Graph section). In this dialog box,
you can rename the plot, assign specific information to be plotted on the Xand Y- axes, and choose which icon and color will be used. If you rename the
plot, the title of the dialog box will change to show the new plot name.
All groups that have been created or assigned within the file are listed on the
left side of the “Source:” field in the Plot#X dialog box. The first group in the
file is automatically selected. Other groups can be selected by highlighting
them. When a group is selected, the pull-down menus in the X-axis and Y-axis
5-28
SOFTmax PRO for Lmax User’s Manual
Chapter 5: Displaying and Analyzing Data
subfields change to show the group columns that are available for graphing.
Group columns can be assigned for both the values to be plotted and any
error bars to be included for both axes.
Summaries and user-defined formulas can also be graphed. Pushing the
button for either the X-axis or Y-axis opens a dialog box which allows you to
enter formulas. To plot a summary, enter the summary name in this dialog
box. Formulas can be plotted for comparison with other data. For example, if
the data is assumed to follow a specific model, the model formula can be
entered as a plot and then the data can be chosen for another plot within the
same graph. You can also use this feature to plot kinetic data in Graph sections. For example, to plot kinetic data from well A1 in a Graph section, you
can enter the formula !A1Lm1 for the Y-Axis and the !TimeRun accessor for
the X-axis. The entered formulas are also shown in the “Source:” field of this
dialog box.
The size, color, and style of the icon used for a plot can be selected on the right
side of this dialog box. Four sizes, nine colors, and nine styles are available
from drop-down menus.
The Graph Options Dialog Box
The Graph Options dialog box allows you to change the name of the Graph
section, change the height of a graph, select the type of graph to be displayed,
change the fonts used on the title, legend, and axes, access the Plot#X dialog
box for editing plots, entering new plots, and/or to delete plots. This dialog
box is opened after pressing [OK] in the Plot#X dialog box when a new
Graph section is being created. This dialog can also be accessed by pressing
the Graph Options button
on the Graph section toolbar or by choosing
Graph Options from the Graph menu.
Scatter plots, cluster bar charts and stack bar charts can be created. Error bars
can be used with all graph types. You can also choose whether to connect the
points and/or plot the symbols in the graph.
In the “Plots:” field of this dialog box, each of the plots that have been created
for this Graph section are listed. Choosing any of these plots provides an indication of the data to be used for the X- and Y- axis data points and error bars
on the right side of this field. Plots can be deleted by highlighting the plot
name and clicking the [Delete] button. Clicking on the [New] button opens
the Plot#X dialog box, allowing you to create a new plot for the graph. Existing plots can be edited by highlighting the plot name and clicking on the
[Edit] button which opens the Plot#X dialog box containing all the information for the selected plot.
When creating a new Graph section, the Graph Options dialog box opens
after pressing either [OK] or [Cancel] in the Plot#X dialog. The new Graph
section is not created, however, until you press [OK] in the Graph Options
dialog box.
SOFTmax PRO for Lmax User’s Manual
5-29
Chapter 5: Displaying and Analyzing Data
Name of the plot
(you can change this)
Fonts options
box
Chart options box
Delete... [plot] button
New... [plot] button
X and Y axis
labels
Edit... [plot] button
Plot name and symbol
X and Y
error bar
description
Figure 5.22: Graph Options Dialog Box
Creating Multiple Plots
SOFTmax PRO for Lmax makes it possible to create multiple plots within a
simple graph. Each plot will represent data from a group that has been created in the Template Editor or data from a summary or custom formula. You
may plot data from any group or from several groups on a graph, even if the
groups are in separate experiments. It is possible, for example, to plot multiple dilution series of an unknown, to graph together a series of patient samples, or to plot several controls that are run over time against one another.
Following is a summary of the steps required to create multiple plots within a
single graph, after which is an example that provides more detail.
Multiple Plots Step Summary
• Create all required groups in the Template Editor.
• Read the microplate to obtain data.
• Create a graph section.
• Add plots to the graph and choose the group and the X and Y values to be
shown for each plot.
Example of Creating Multiple Plots
This example shows how six groups, all of which are Standards, were plotted
on the same graph.
1)
5-30
Groups are created in the Template Editor. For this example, eight groups are
created: GA(h), GA(native), G5A(h), G5A(native), plec2(h), plec2(native),
CHOMO6(h), and CHOMO6(native).
SOFTmax PRO for Lmax User’s Manual
Chapter 5: Displaying and Analyzing Data
Figure 5.23: Standards and Unknowns Groups Created
2)
These Group sections are created using the Basic column format which, by
default, generates columns for values, concentration, and mean values. The
example below shows the Group section for GA(native).
Figure 5.24: GA(native) Group Section
3)
A new Graph section is created by selecting New Graph from the Experiment
menu. This causes the Plots dialog box to open automatically. Clicking [OK]
opens the Graph Options dialog box which allows you to choose the graph
type, modify the fonts used for the graph, and so on. Choices should be made
as follows: GA(native) for the group to be plotted, the concentration of
GA(native) for the X-axis, and values of GA(native) for the Y-axis. No error
bars are added.
SOFTmax PRO for Lmax User’s Manual
5-31
Chapter 5: Displaying and Analyzing Data
Figure 5.25: Graph Options Dialog Box
4)
A second plot is added to this graph by clicking the [New] button in the
Graph Options dialog box. After clicking [New], a dialog labeled Plot #2 is
opened. Choose GA(h) for the group, and change the X- and Y-axes to show
concentration and values, respectively, for GA(h).
Figure 5.26: Graph Options Dialog Box with Second Plot Added for GA(h)
5)
5-32
This process is repeated for a the rest of the Group plots, in this order:
Plot#3 (G5A(native): Concentration vs Values)
Plot#4 (G5A(h): Concentration vs Values)
Plot#5 (plec2(native): Concentration vs Values)
Plot#6 (plec2(h): Concentration vs Values)
Plot#7 (CHOMO6(native): Concentration vs Values)
Plot#8 (CHOMO6(h): Concentration vs Values)
SOFTmax PRO for Lmax User’s Manual
Chapter 5: Displaying and Analyzing Data
6)
Now that all plots information is complete, clicking [OK] in the Graph
Option dialog box will close it, and the resulting graph will show the eight
plots created.
Figure 5.27: Graph Displaying Eight Plots
You can add as many plots to a graph as you wish, and these can be of the
same or different types of groups. If you create a graph and later wish to add
one or more plots to it, click the Graph Options button (
) on the Graph
section tool bar and then click the [New] button. This will cause the Plots dialog box to reappear, allowing you to add or modify the plot information.
SOFTmax PRO for Lmax User’s Manual
5-33
Chapter 5: Displaying and Analyzing Data
Error Bars
When data is displayed as a scatter or bar graph, you can choose to display
error bars for the plot of the data for the X- and/or Y-axis. Error bars are lines
that extend beyond a plotted value in either or both directions and graphically represent some amount of error in plotted data.
Error Bars
Figure 5.28: Plot Showing Error Bars
Choices for displaying error bars relative to a particular axis are the same as
those available for displaying data on that axis: any column from that group
that contains numerical information (not columns with text). To display error
bars, click and hold the box next to “Error Bars” in the Plot#X dialog and drag
to select one of the choices in the menu. To disable error bars, choose “No
Error” for the X- and/or Y-axis.
Error bars show both positive and negative error. Depending on the range settings for the graph, portions of the error bars may not be visible.
Curve Fitting
When you first create a graph of the data, it does not have a fit associated with
it. The graph might appear something like this:
5-34
SOFTmax PRO for Lmax User’s Manual
Chapter 5: Displaying and Analyzing Data
No Fit selected
Figure 5.29: Graph with No Fit
You can fit any plot to one of nine curve-fitting algorithms: Linear, Semi-Log,
Log-Log, Quadratic, 4-Parameter (logistic), Log-Logit, Point-to-Point, Exponential, and Cubic Spline. These selections are shown in the Fits pop-up menu
in the Graph section toolbar (click on the box next to “Fit”).
Typically, a standard curve refers to the curve fitted to the plot of concentration versus mean value for the Standard group.
Once you have selected a Fit type, SOFTmax PRO for Lmax determines the
parameter values that best fit the data. The function with these parameters is
then drawn on the graph. Ideally, the type of fit used should be determined
by the underlying chemistry of the assay and could be set before data is read.
NOTE: A good discussion of curve fitting appears in “Data Analysis and
Quality Control of Assays: A Practical Primer” by R. P. Channing
Rogers in Practical Immuno Assay, edited by Wilfrid R. Butt (published
by Marcel Dekker, Inc., New York, 1984).
When a fit is chosen, the Graph section is updated to show the coefficients
describing the fit when applicable. These values are displayed in the legend at
the bottom of the graph. Figures 5.30 through 5.37 show the same graph with
the different fit algorithms applied. Note that the legend information changes
(along with the formula for the fit) at the bottom of each Graph section for
each different fit.
NOTE: All plots on a graph must have the same type of fit.
When a curve fit is chosen, the values for the coefficients of the equation (A, B,
C, etc.) will be shown as will the square of the correlation coefficient (R^2).
The correlation coefficient describes how well a change in x values correlates
with a change in the y values. Please see “Judging a Good Curve Fit” on page
5-43 for more information. The R^2 value should only be used for curve fits
having linear axes.
Linear
The linear function fits the best straight line to the data. The equation for this
fit has the form of:
Y = A + (B * X)
SOFTmax PRO for Lmax User’s Manual
5-35
Chapter 5: Displaying and Analyzing Data
where A is the y-intercept of the line and B is the slope. A linear fit should be
used whenever the values appear to lie on or scattered around a straight line.
This equation is shown on the screen as:
y = A + Bx
A linear fit should be used whenever the standard values appear to lie on or
are scattered around a straight line. Figure Figure 5.30 shows an example of a
linear fit.
Figure 5.30: Graph with Linear Fit (simulated data)
Semi-Log
The semi-log function fits the best straight line to a set of data for log(X) plotted against Y. The resulting curve displayed will be a straight line with the Xaxis drawn in logarithmic scale. The equation for a semi-log fit is:
Y = A + [B * log10(X)]
and is shown on the screen as:
y = A + B * log(x)
where A is the y-intercept of the line and B is the slope (note: log in this equation is the common or base-10 logarithm).
5-36
SOFTmax PRO for Lmax User’s Manual
Chapter 5: Displaying and Analyzing Data
Figure 5.31: Graph with Semi-Log Fit (simulated data)
Log-Log
The log-log function fits the best straight line to the set of data which consists
of the logarithm of the readings on the Y-axis (the response) and the logarithm
of the dose on the X-axis. The resulting display will be a straight line with
both axes drawn in logarithmic scale. The equation for the log-log fit is:
log10(Y) = A + [B * log10(X)]
and is shown on the screen as:
log(y) = A + B * log(x)
where A is the log10Y-intercept of the line for log10(X) = 0 and B is the slope
(note: log in this equation is the common or base-10 logarithm).
SOFTmax PRO for Lmax User’s Manual
5-37
Chapter 5: Displaying and Analyzing Data
Figure 5.32: Graph with Log-Log Fit (simulated data)
Quadratic
The quadratic function fits the best parabola to the data. The parabola is a
curved line based on the equation:
y = A + (B * x) + (C * x2)
which is shown on the screen as:
y = A + B*x + C*x^2
where A is the intercept, B is the slope of the curve at the intercept, and C is
the measure of the curvature of the parabola.
The quadratic fit is most appropriate when the standard curve has a tendency
to curve up or down. An example of a quadratic fit is shown in Figure 5.33.
5-38
SOFTmax PRO for Lmax User’s Manual
Chapter 5: Displaying and Analyzing Data
Figure 5.33: Graph with Quadratic Fit (simulated data)
4-Parameter Logistic and Log-Logit
If the standard curve has a sigmoidal shape when plotted on the semi-log
axes, it may be appropriate to use either the log-logit or 4-parameter fit. Both
fits are based on the equation:
A–D
y = ----------------------- + D
x B
1 + ( ---- )
C
where D is the Y-value corresponding to the asymptote (i.e., the flat part of the
curve) at high values of the X-axis and A is the Y-value corresponding to the
asymptote at low values of the X-axis. The coefficient C is the X-value corresponding to the midpoint between A and D. The coefficient B describes how
rapidly the curve makes its transition from the asymptotes in the center of the
curve. A large value of B describes a sharper transition. Typically, B has a
magnitude of about 1.
Both the log-logit and 4-parameter equations are shown on the screen as:
y = (A - D) / (1 + (x / C) ^ B) + D
SOFTmax PRO for Lmax User’s Manual
5-39
Chapter 5: Displaying and Analyzing Data
Figure 5.34: Graph with 4-Parameter Fit (simulated data)
Figure 5.35: Graph with Log-Logit Fit (simulated data)
Some publications show the log-logit equation in another form:
y
log 10 ----------- = b x – b log 10 c
1–y
where
y–A
y = -------------D–A
x = log 10 x
A different algebraic expression of these is:
A–D
y = ---------------------------B + D
1 – (x ⁄ C)
5-40
SOFTmax PRO for Lmax User’s Manual
Chapter 5: Displaying and Analyzing Data
The difference between the log-logit fit and the 4-parameter fit are in the way
the coefficients A and D are calculated. For the log-logit method, the standard
values for the lowest and highest values of x are used. The corresponding y
values are assigned to A and D, respectively. Based on these fixed values for A
and D, the algorithm then computes values for B and C. This technique works
well if there are standard points along the upper and lower asymptotes. If this
is not true, the log-logit fit should be avoided in favor of the 4-parameter
logistic.
In SOFTmax PRO for Lmax 2.x, the 4-parameter logistic curve fit uses 2000
iterations. If the fit does not converge in this number of iterations, the program will report a fit error.
NOTE: The curve-fitting algorithm for the 4-parameter equation was based
on the Levenberg-Marquardt Method. Discussion of this method can
be found in Numerical Recipes in C: The Art of Scientific Computing by
William H. Press, Brian P. Flannery, Saul A Teukolski, and William T.
Vetterling, published by Cambridge University Press, New York,
1988.
Point-to-Point
A linear equation is fit to each pair of data points. Fit parameters are not
given. The point-to-point curve fit is a linear fit composed of pieces that
assume a linear relationship between each pair of data points. The line segment defined by each pair is used to interpolate data between those points.
Since there are multiple line segments, fit parameters are not shown on the
graph.
Figure 5.36: Graph with Point-to-Point Fit
SOFTmax PRO for Lmax User’s Manual
5-41
Chapter 5: Displaying and Analyzing Data
Cubic Spline
This curve fit generates a fit to a cubic equation between each pair of data
points. The general form of a cubic equation is:
y = A + Bx + Cx2 + Dx3
The equations are computed with the requirement that the first and second
derivatives of the equations are continuous throughout the range of the data.
As multiple curve fits are performed with this routine, fit parameters are not
shown with the graph.
Figure 5.37: Graph with Cubic Spline Fit
Exponential
The exponential function used to generate this curve fit is:
y = A + B * (1 - exp^(-x / C))
Figure 5.38: Graph with Exponential Fit (simulated data)
5-42
SOFTmax PRO for Lmax User’s Manual
Chapter 5: Displaying and Analyzing Data
NOTE: SOFTmax PRO for Lmax does not plot samples with descriptor values of zero (0) on a log axis. Curve fits affected by this are the semilog, log-log, log-logit, and 4-parameter curve fits.
Minimum Number of Standards
The number of standards used in a standard curve depends on the particular
curve fit selected and on the judgment of the operator. The table below gives
the minimum number of standards required mathematically by each of the
curve fitting algorithms.
Table 5.1: Minimum Number of Standards Required for Curve Fits
Curve
Minimum Number of Standards
Linear
2
Quadratic
3
Semi-Log
2
Log-Log
2
Log-Logit
4
4-Parameter
4
Point-to-Point
2
Exponential
3
Cubic Spline
4
For optimal results, you should always exceed the minimum number of standards required for any given fit.
There are other requirements on the standards for the log-logit and 4-parameter logistic curves. The fits for the 4-parameter logistic curve are based on the
assumption that the curve has a high and a low asymptote and a certain
“steepness” for the linear portion around the inflection point between the
asymptotes. If a sufficient number of points do not define the inflection point
and the asymptotes, you will receive a “no fit” error message or an inappropriate fit. For best results, make sure that the 4-parameter fit is appropriate for
your assay and that the entire range of the assay is represented in your standards.
If your standards do not clearly define both a high and low asymptote, the
spline fit may be more appropriate for your assay.
Judging a Good Curve Fit
The correlation coefficient is also known as the goodness of fit value because
it shows how good a fit exists between the computer curve and the standard
data points. It measures the degree to which the points fall on the computer
curve and may give an indication as to what residuals are to be expected. The
correlation coefficient is popularly known as R and is between -1 and 1, inclusive. When the data points lie on a perfectly straight line with negative slope,
then R = -1. If the correlation coefficient is not suitably close to 1 or -1 (a perSOFTmax PRO for Lmax User’s Manual
5-43
Chapter 5: Displaying and Analyzing Data
fect fit), you can simply apply one of the other types of curves without having
to reread the plate.
For nonlinear curve fits, SOFTmax PRO for Lmax performs transformations
that cause the curve to become more linear. The correlation coefficients are
derived from that transformed data. Because of this, you should be cautious
about using correlation coefficients as an indicator of goodness of fit. Do not
let this single value for goodness of fit sway your intuition about which fit is
best. Some curve fits may seemingly give a good fit (e.g., fit values close to 1)
but, when inspected by eye, show a poor fit along a major portion of the plot.
Graph Options
Graphs can be customized further through the Graph Options dialog box
which is accessed by choosing Graph Type... from the Graph menu or by clicking the Graph button (
)in the section tool bar.
Figure 5.39: Graph Options Dialog Box
The default options are shown in Figure 5.39, but you can alter these as
desired: you may change the font and type size used for the title, legend,
and/or axes of the graph, and you can choose the color and type of symbol
used on a scatter graph to show the plot. The graphs shown in preceding Figures reflect the default graph options. Connecting the points of a scatter graph
can be useful in determining the closeness of the fit. Figure 5.40, below, shows
a scatter graph with points connected compared to a linear fit.
NOTE: The Connect Points option connects the points in order of appearance by sample name—not the appearance of points from left to right
on the graph.
5-44
SOFTmax PRO for Lmax User’s Manual
Chapter 5: Displaying and Analyzing Data
Graph Options Button
X- and
Y-Axis
Buttons
Figure 5.40: Scatter Graph with Points Connected (Linear Fit Applied)
Other options in this dialog box allow you to plot the data as a bar graph with
data shown in clusters or stacked. Figure 5.41 shows both of these bar graph
options.
Cluster Bar Graph
Stack Bar Graph
Figure 5.41: Bar Graphs—Cluster and Stack
NOTE: Bar graph options for multiple plot graphs are only available when
each plot contains the same number of data points and has matching
X-axis coordinates.
NOTE: When choosing the Connect Points option, the order in which points
are connected is sample name dependent.
SOFTmax PRO for Lmax User’s Manual
5-45
Chapter 5: Displaying and Analyzing Data
Axes Options
Double-clicking either graph axis, clicking the X-axis or Y-axis button in the
Graph section toolbar, or selecting either X-axis... or Y-axis... from the Graph
menu opens a dialog box concerning the configuration of that axis. Figure
5.42 shows the dialog box for the X-axis.
Figure 5.42: X-Axis Dialog Box
The default settings are shown in the Figure above. You can change these as
desired for either or both axes.
Axis Settings
Enabling the Auto-range option causes the graph to be drawn such that all
data points are shown (by automatically adjusting the minimum and maximum range settings to encompass the data). You can disable the Auto-range
function by clicking the checkbox or by changing either or both values for the
Min and/or Max settings.
Formulas in SOFTmax PRO for Lmax
You can enter custom calculations in several places within SOFTmax PRO for
Lmax to provide the information you desire:
• In Plate sections, you can specify formulas to be used for reduction.
• In the Group table sections, you can view and edit the formulas associated
with the various columns or create new columns containing new formulas.
The data shown in columns from one group can relate to or contain information derived from columns in another group. You can also create summaries which consist of formulas and text.
• Notes sections allow you to enter summaries which consist of formulas and
related text.
Use of formulas is described in detail in a separate manual, The SOFTmax
PRO for Lmax Formula Guide.
5-46
SOFTmax PRO for Lmax User’s Manual
Chapter 6: File Management and Printing
File Creation and Management. . . . . . . . . . . . . . . . . . . . . . . . . . . . . 6-3
Default Protocol . . . . . . . . . . . . . . . . . . . . . . . . . . . . . . . . . . 6-3
Locating Protocol and Data Files . . . . . . . . . . . . . . . . . . . . 6-4
Creating New Files. . . . . . . . . . . . . . . . . . . . . . . . . . . . . . . . 6-4
Opening Files . . . . . . . . . . . . . . . . . . . . . . . . . . . . . . . . . . . . 6-6
Saving Files Manually . . . . . . . . . . . . . . . . . . . . . . . . . . . . . 6-9
Autosave . . . . . . . . . . . . . . . . . . . . . . . . . . . . . . . . . . . . . . . . 6-9
Printing. . . . . . . . . . . . . . . . . . . . . . . . . . . . . . . . . . . . . . . . . . . . . . . . 6-11
The Printed Report . . . . . . . . . . . . . . . . . . . . . . . . . . . . . . . 6-12
Customizing the Report . . . . . . . . . . . . . . . . . . . . . . . . . . 6-12
The Print Dialog Box . . . . . . . . . . . . . . . . . . . . . . . . . . . . . 6-14
Exporting/ Importing Information . . . . . . . . . . . . . . . . . . . . . . . . 6-16
Exporting Data for Later Reimport . . . . . . . . . . . . . . . . . 6-16
Exporting Data—General Information . . . . . . . . . . . . . . 6-16
Importing Data from Outside of
SOFTmax PRO for Lmax . . . . . . . . . . . . . . . . . . . . . . 6-20
Importing and Exporting Templates . . . . . . . . . . . . . . . . 6-20
Exporting Graphs . . . . . . . . . . . . . . . . . . . . . . . . . . . . 6-21
Copying and Pasting . . . . . . . . . . . . . . . . . . . . . . . . . . . . . 6-21
Password Protection . . . . . . . . . . . . . . . . . . . . . . . . . . . . . . . . . . . . . 6-25
Setting and Changing a Password . . . . . . . . . . . . . . . . . . 6-26
Chapter 6: File Management and Printing
6-2
SOFTmax PRO for Lmax User’s Manual
Chapter 6: File Management and Printing
File Creation and Management
During routine use of SOFTmax PRO for Lmax, you will create, open, and
save numerous files. You may wish to create file folders that will make it easy
to locate particular files. It is also important to understand the way in which
SOFTmax PRO for Lmax finds and uses default protocol files to enable certain
assay options automatically.
When you install SOFTmax PRO for Lmax, certain files and folders/directories are created on your computer’s hard disk. One of these files is known as
the “Default Protocol” (so named on the Macintosh; called “DEFAULT.LPR”
in Windows). The Default Protocol file is automatically used as a “template”
for new files you create. You can, however, create one or more different “template” protocol files.
Default Protocol
When first installed, SOFTmax PRO for Lmax looks for the Default Protocol
file in the same folder or subdirectory as the SOFTmax PRO for Lmax program file. You can instruct SOFTmax PRO for Lmax to look in a different location, however, through the Assays menu. Suppose, for example, that you
create a folder/subdirectory called “MYASSAYS” and that you create a new
protocol file (called “Default Protocol” or “DEFAULT.LPR”) within this
folder. The Assays menu shows two sections: at the top, a command entitled
Set Folder..., which allows you to choose the folder within which SOFTmax
PRO for Lmax will look to find the Default Protocol file when creating a new
experiment. At the bottom of this menu, beneath the dividing line, is a list of
all protocol files contained in the currently chosen folder.
Figure 6.1: Example Assays Menu
To have SOFTmax PRO for Lmax look in a different folder for the Default Protocol file, choose Set Folder.... A dialog box will open, allowing you to locate
and set a different default folder.
SOFTmax PRO for Lmax User’s Manual
6-3
Chapter 6: File Management and Printing
Figure 6.2: Set Folder Dialog Box—Macintosh and PC
Select the folder you wish to use and then click the large button at the bottom
(Mac) or right (Windows) of the dialog box to set this folder as the default.
NOTE: Molecular Devices recommends that you have only one default
protocol.
Opening Other Protocol Files
The bottom half of the Assays menu provides a “shortcut” for opening other
protocol files contained in the set folder. These usually consist of protocols
you or others create for repeated use. To choose a different protocol file, click
the protocol file you wish to use. An untitled copy of that protocol file will
open in a new window.
Locating Protocol and Data Files
You may find it useful to create separate folders/subdirectories within which
to store the data files that SOFTmax PRO for Lmax creates. In addition, you
may want to create and save various protocol files for use as “templates” for
later readings. In a multi-user environment, it might be helpful to create a
folder/subdirectory for each SOFTmax PRO for Lmax user or to create separate folders/subdirectories for different types of experiments. We recommend
that you consider the way in which you will organize your files before creating too many of them—otherwise you may find that locating a particular file
among the many that fill your hard disk difficult and/or time consuming.
NOTE: Creating new folders or subdirectories must be done outside of
SOFTmax PRO for Lmax (using the Finder for Macintosh or the File
Manager or Windows Explorer within Windows, for example).
Creating New Files
Selecting New (N; CTRL+N) from the File menu causes a new, untitled file to
open, creating a new window on the screen. The initial contents of this window are based on the default protocol file chosen in the Preferences dialog
box.
NOTE: You can create and/or open more than one SOFTmax PRO for Lmax
file at a time. Subsequently opened files will appear in separate windows in a cascading, diagonal order.
6-4
SOFTmax PRO for Lmax User’s Manual
Chapter 6: File Management and Printing
New files can be saved as protocol files at any time, either before or after data
is acquired. To create a new protocol file, enter all the instrument settings for
the reading and then choose Save or Save as... from the File menu. The dialog
box that appears presents the option of saving a file as either a protocol or a
data file (the default). On the Macintosh, click the option button next to “Protocol” and enter a name for the file in the text box (type over “Untitled”).
In Windows, choose the appropriate format from the list in the box under the
heading, “Save File as Type:.” Also remember to choose the folder or subdirectory in which to save this file. When you have entered all the information,
click [Save] or [OK].
NOTE: If you are creating a protocol file from a file containing data, first
save the file as a data file (if you wish to save the data) and then perform a second save as a protocol file. Data will not be saved with a
protocol file.
Protocol files are stationery pad files—when you choose to open a protocol
file, you are actually presented with a copy of the file, which appears as an
untitled file.
Choose the
location for the
new file here
Enter a name
for the new
Protocol file here
File type
option buttons
Figure 6.3: Save as... Dialog Box—Macintosh
Choose the
location for the
new file here
Enter a name
for the new
Protocol file here
File type choices
Figure 6.4: Save as... Dialog Box—Windows
SOFTmax PRO for Lmax User’s Manual
6-5
Chapter 6: File Management and Printing
Opening Files
You can open a SOFTmax PRO for Lmax file by selecting Open... (O; CTRL+O)
from the File menu within SOFTmax PRO for Lmax or by double-clicking on
the file name or icon when you are in the Finder (Macintosh) or in the File
Manager (Windows). Note that you can open SOFTmax PRO for Lmax files
using either platform regardless of whether they were created using Macintosh or Windows (see “Cross-Platform Files,” below, for more information).
Opening SOFTmax/SOFTmax PRO for Lmax Files (Earlier Versions)
SOFTmax PRO for Lmax allows you to open files from previous versions of
SOFTmax PRO for Lmax as well as from SOFTmax. From within SOFTmax
PRO for Lmax, select the Open ( O; CTRL+O) command from the File menu.
The file will open and will function in the same way as a SOFTmax PRO for
Lmax file. If you wish, you can save the file in SOFTmax PRO for Lmax format by selecting Save As... from the File menu. If you do not change the name
of the file and save it to the same location, a message box will appear, asking
whether or not you want to replace the existing SOFTmax file with the new
SOFTmax PRO for Lmax version. If you do not, you can either choose a different location or rename the file.
NOTE: While SOFTmax files can be opened using SOFTmax PRO for Lmax,
two items do not translate completely across the programs: sample
blanks and auto range limits (in graph sections). The data for sample
blanks obtained using SOFTmax will be available when these files are
opened in SOFTmax PRO for Lmax, but no calculations are performed automatically using this data. Auto range limits are not available when SOFTmax files are opened using SOFTmax PRO for Lmax,
so limits for the display of information in graphs must be entered
manually.
Cross-Platform Files
If you have SOFTmax or SOFTmax PRO for Lmax files that were created on a
platform other than the one you are currently using, you can transfer these
files to your computer and use them, provided you have the required software and/or hardware to do so.
Transferring Macintosh Files to the PC
Third-party software is available for the Windows-compatible PC that allows
the PC to read Macintosh-formatteed 3-1/2-inch disks. However, if you need
to transfer files between Macintosh and PC platforms and do not have such
software, you can use PC disks with both platforms since the Macintosh will
be able to read them. Macintosh computers are equipped with software that
allows you to “read” and transfer files from PC disks. If you are using System
7.5 or later, you will need to make sure that File Exchange is available in the
Control Panels. The process of using File Exchange is described below.
1) If you have not yet enabled File Exchange on your Macintosh, select Control
Panels from the Apple () menu. From within the Control Panels, choose the
Extensions Manager and turn File Exchange on by placing a checkmark next
to it. Restart your computer—File Exchange will now be enabled.
2) Rename the Macintosh files you wish to transfer to PC disks so that their
names have appended the proper 3-letter extension preceded by a period.
6-6
SOFTmax PRO for Lmax User’s Manual
Chapter 6: File Management and Printing
Table 6.1, found later in this chapter, lists the three-letter extensions that are
associated with data and protocol files from SOFTmax and SOFTmax PRO.
3) Insert a PC-formatted disk into the Macintosh floppy drive. It will appear as
an icon on the Macintosh desktop.
4) Drag the files (renamed with 3-letter file extensions) onto the IBM disk icon to
copy the files to the disk. Drag the disk to the trash to eject it.
NOTE: Certain special characters will not translate accurately across platforms. Characters that are created on the Macintosh using the option
key, such as ®, ©, °C, ™, or • (bullet character) for example, will be
shown on the PC as other letters or characters. Also, if you align items
using spaces, these may or may not align when viewed on a different
platform since fonts on the different platforms have different character widths.
Transferring PC Files to a Macintosh
Third-party software is available for the Windows-compatible PC that allows
the PC to read Macintosh 3-1/2-inch disks. However, if you need to transfer
files between Macintosh and PC platforms and do not have such software for
the Windows-compatible PC, you can use PC disks for both platforms since
the Macintosh will be able to read them. Macintosh computers are equipped
with software that allows you to “read” and transfer files from PC disks. If
you are using System 7.5 or later, you will need to make sure that File
Exchange is available in the Control Panels.
1) If you have not yet enabled File Exchange on your Macintosh, select Control
Panels from the Apple () menu. From within the Control Panels, choose the
Extensions Manager and turn File Exchange on by placing a checkmark next
to it. Restart your computer—File Exchange will be enabled.
2) Choose File Exchange from the Control Panels. A dialog box like the one
below will appear.
Figure 6.5: PC Exchange Dialog Box
3) In this dialog box, click [Add...]. This will cause a second dialog box to
appear.
SOFTmax PRO for Lmax User’s Manual
6-7
Chapter 6: File Management and Printing
Figure 6.6: Add Mapping Dialog Box
4) In order to allow the Macintosh to automatically recognize protocol and data
files of PC origin as SOFTmax PRO for Lmax files, you need to enter the associated three-letter extensions that correspond to these files in the File
Exchange Add Mapping dialog box. The table below lists the type of file and
its corresponding extension that should be entered in the dialog box.
Table 6.1: PC File Name Extensions and Macintosh Document Types
for Use with File Exchange
3-Letter
Extension
Macintosh
Document Type
SOFTmax PRO for Lmax
Protocol File
.LPR
sPFd
SOFTmax PRO for Lmax
Data File
.LDA
SPFd
Type of File
For example, if you will be working with SOFTmax PRO for Lmax protocol
files created on the PC, enter .LPR in the box under “Extension . [_____]”
5) Then click the application icon (currently shown as “File Type ???” in the center of the box under “Application Program.” From the menu choices, navigate
to the folder where the SOFTmax PRO for Lmax application resides. Highlighting this application will enable the Macintosh to start SOFTmax PRO for
Lmax and read the corresponding protocol file whenever you double-click a
PC file bearing the “.LPR” extension. Also select the appropriate Macintosh
document type (shown in the table above). Clicking [OK] causes this dialog
box to close and updates the earlier dialog box to show the extension and
associated program you just entered.
6) Repeat steps 3 through 5 for other PC file name extensions with which you
will be working.
6-8
SOFTmax PRO for Lmax User’s Manual
Chapter 6: File Management and Printing
Saving Files Manually
SOFTmax PRO for Lmax provides several ways to save files manually. If the
current file has not been saved (is “Untitled”), it can be saved under any
name. If you have opened and modified an existing file, you can save it under
the same name (overwriting the old information) or under a different name.
You can also save the file in the same or in a different location on your hard
disk (in a different folder or subdirectory).
Saving Files under the Same Name
If you have made changes to a file and want to save these changes, thereby
updating the same file, select Save (S; CTRL+S) or Save As... from the File
menu. If you select Save (S; CTRL+S), the current version of the file will
replace the old one (without notification). If you select Save As..., an alert box
will appear, asking if you want to replace the previous file by that name. If
you are intentionally replacing the file, click [Replace] or [Yes]. The new
information will be written over the old information under the same file
name.
Saving Files under a Different Name or in a Different Folder
If you have made changes to a file and want to save these changes as a new
file, or if you wish to save the file to a different location, select Save As... from
the File menu. A dialog box will open allowing you to enter a new name
and/or a new location for the file. To choose a different location for the file,
use the pull-down menu at the top of the dialog box to select a different
folder. To change the name, overtype the existing file name. Click [OK] when
you have entered all the necessary information and you are ready to save the
file.
Autosave
SOFTmax PRO for Lmax can be configured to save a copy of your data file
automatically (Autosave) after a reading. This function is enabled in the Preferences dialog box (choose Preferences... from the Edit menu).
SOFTmax PRO for Lmax User’s Manual
6-9
Chapter 6: File Management and Printing
Figure 6.7: Preferences Dialog Box
When you enable the Autosave function (by clicking its checkbox in the Preferences dialog box), the textbox below it becomes active, allowing you to
accept or change the default location for saving data files. The default location
is the folder containing the SOFTmax PRO for Lmax program. You may
accept the default file prefix or change it to another prefix of your choice. For
example, you may wish to use a prefix that is specific for a certain group of
experiments or one of several users. You may also choose the file type for the
Autosaved file (SOFTmax PRO for Lmax file or ASCII text file), choose to
append the date to the autosaved file name, and, if you select the Text file
option, you can then choose either the “Create a new file” or “Append to file”
option.
NOTE: When Autosave is enabled in SOFTmax PRO for Lmax file mode
within files containing multiple experiment sections, each experiment
section will be autosaved to a separate file.
6-10
SOFTmax PRO for Lmax User’s Manual
Chapter 6: File Management and Printing
Printing
Five printing options are available for an experiment:
1) You can print a report at any time by choosing Print... ( P; CTRL+P)
from the File menu. You can determine which sections (or whether all
sections) will be printed in this report (see “The Printed Report,” below).
2) A copy of the template can be printed while you are in the Template Editor by clicking the [Print] button in the bottom left corner.
3) A report can be printed automatically at the end of a reading. To enable
this function, choose Preferences... from the Edit menu and select “Autoprint.”
4) You can print the active section or selection. This option is available
within the File menu. If only one section is selected, the name shown in
the menu will reflect the name of the active section. For example, if the
active section is named “Plate #1,” the topmost print command in the
File menu would be Print ‘Plate #1’.... If more than one section is selected, the menu will show Print Selection. You can select multiple sections
to be printed by holding down the Shift key and clicking on the section
tool bars to make them active.
5) Enlarged displays (well graphs) of kinetic data can be printed by clicking the [Print] button in the Well Graph window. The size of the printout is dependent on the size of the well graph.
NOTE: If you enlarge the well graph to greater than 12 inches, the printout
will be truncated.
Regardless of which print option you select, make sure the printer is connected properly to the computer and that it is turned on prior to sending the
print request.
If Autoprint is enabled, make sure the printer is connected and that it is
turned on prior to starting a reading.
If you are using a Macintosh, you can check the Chooser for the currently
selected (connected) printer.
If you are using Windows, you can select a printer by choosing Print Setup
from the File menu. In the Print Setup dialog box, choose the default printer
or select from any other printers have been configured for use with Windows.
See your Windows documentation for further information.
SOFTmax PRO for Lmax User’s Manual
6-11
Chapter 6: File Management and Printing
The Printed Report
You can create customized reports by including or excluding experiments and
individual sections, changing the order in which sections will print, and adding text describing each experiment in Notes sections. You can also create
summaries (consisting of reduction formulas and associated text) in Notes
and Group sections. The size and content of Group sections can also be
changed.
Including or Excluding Sections
When sections are created, they default to being included in the printed
report. You can exclude sections from printing by clicking the print setting
button on the tool bar of that section (it is a toggle, so it will change from
enabled
to disabled
or vice versa).
Changing the print setting option for the experiment will change the state of
all sections within that experiment. Changing the print setting option for one
or more sections within an experiment will cause the print setting button for
the experiment to change to reflect an “undecided” status with regard to the
sections within it (
). Toggling the experiment’s print setting button will
override any changes made to individual sections and set all of them to
printing.
When Print is chosen from the File menu, selecting Print All will override the
print settings made to sections or experiments.
Customizing the Report
In addition to choosing which sections will print in the report by toggling
their print status, you can choose to print all items in a file or to print only the
report from the dialog box that appears when you choose Print from the File
menu.
Figure 6.8: Print Dialog Box
6-12
SOFTmax PRO for Lmax User’s Manual
Chapter 6: File Management and Printing
Other options regarding the appearance of the printed report can be chosen in
this dialog box: you can add text to be included in the header on every page
of the report (maximum of 100 characters in a single row), and you can
include or exclude the experiment title (the name of the experiment in the file)
as well as the name(s) of sections, and you can include the date and time of
printing, as well as add page numbers to the report which are printed at the
bottom right corner of each page. These are all enabled, by default, until you
disable them by clicking in the box with the checkmark next to each option
(which will deselect that option).
NOTE: If a Notes section is longer than can be printed on one page, a line
may be cut off (not printed) at the bottom of the first page. To fix this
problem, insert a carriage return in the appropriate place (above the
page break) in the Notes section and print again.
Changing the Section Order
When sections are created (either automatically by SOFTmax PRO for Lmax
or by you), their order may not be optimal for either viewing or printing. The
order of sections in the window determines how they will print in the report,
and you may find that changing the order of sections makes it easier to view
the data.
When you create a new section, it is positioned directly after the currently
active section. To change the order of a section, first make it active by clicking
on it, then click in its tool bar and drag it to a new position (on top of the section or section tool bar you want it to precede). Sections may be open or
closed during this procedure.
Changing the Text Format
The text in Notes and Group sections can be formatted to change its appearance. The Format Text dialog box, accessible by choosing Text Style... (T;
CTRL+T) from the Edit menu, provides a number of different options (see
Figure 6.9).
Figure 6.9: Format Text Dialog Box (Macintosh)
First highlight the text you wish to format. Then choose Text Style...
(T; CTRL+T) and select the options you wish to apply to the selected text. You
can click on the [Apply] button to see the result of the selections you have
made, allowing you to select more or different options before finally setting
the options by clicking on [OK].
SOFTmax PRO for Lmax User’s Manual
6-13
Chapter 6: File Management and Printing
The Print Dialog Box
Choosing any of the Print... commands brings up a dialog box. The contents
of this box will vary depending upon the type of printer you have selected or
the particular printing option you have chosen, but the basic elements are the
same. The dialog boxes shown below represent those displayed when you
choose the Print... command from the Macintosh and from Windows.
Figure 6.10: Print Dialog Box for the Macintosh
You can choose to print all of the sections, regardless of whether they are
included in the report, by clicking the option button next to “Print all” at the
bottom left of the Print dialog box.
6-14
SOFTmax PRO for Lmax User’s Manual
Chapter 6: File Management and Printing
Figure 6.11: Print Dialog Box for Windows (Epson Stylus 800 Shown)
NOTE: If more than one printer is available to your computer, make sure
you select the desired printer prior to selecting one of the Print
options in the File menu. If you start to print and discover the wrong
printer is selected, choose [Cancel] to exit from the Print dialog box.
Select the correct printer (using the Chooser for the Macintosh or the
Print Setup dialog box for Windows) and then repeat the print process.
Additional information regarding the general print functions available in
these dialog boxes can be found in the documentation that accompanies your
computer and/or printer.
SOFTmax PRO for Lmax User’s Manual
6-15
Chapter 6: File Management and Printing
Exporting/ Importing Information
Exporting Data for Later Reimport
If you are exporting data so that you can manipulate it using another
program and then reimport it into SOFTmax PRO for Lmax, the data must be
displayed as raw data (without a reduced number) prior to being exported.
Follow the steps below to ensure that the exported data will be able to be
reimported properly into SOFTmax PRO for Lmax. Complete instructions
regarding how to perform each of these steps can be found in the following
section.
1) Check that the correct plate format and export options are specified in the
Preferences dialog box.
2) Make the Plate section from which you wish to export data the active section
(click somewhere in it or on its toolbar).
3) Check that the reduction settings are as you wish them to be by clicking the
[Reduction] button on the Plate section toolbar.
4) Click on the [Display] button and verify that the display settings are set to
show raw data without a reduced number.
5) Choose Export from the File menu and save the exported data to a file on
your computer.
Exporting Data—General Information
The Export... command (a sub-menu of Import/Export located in the File
menu) creates a file of data from one or more Plate sections and/or Group
table sections within a SOFTmax PRO for Lmax file. The type of data that is
exported depends upon three things:
1) Selections made in the Preferences dialog box regarding the export format.
Choose Preferences from the Edit menu. Within the Preferences dialog box
that appears, select the format for data export that you prefer: for Plate sections, you can choose either time-based, which produces a linear format for
the data, or plate-based, which exports data in a matrix format corresponding
to a microplate grid. You also must choose whether or not to include labels
with the exported data.1 Click [OK] to close the dialog box.
Export
Format
Selection
Figure 6.12: Choosing an Export Format from the Preferences Dialog Box
NOTE: The preference settings chosen above also affect the copying and
pasting of data and Autosaving to ASCII text.
1.
6-16
Including labels will affect all data that is exported, but doing so is most noticeable with Group section
data, since the column headings in the Group table will be shown, as will any other calculated data in summaries, etc. Labels included with Plate sections show “1-12” headers for 96-well Plate section data represented as an 8 x 12 matrix; 384-well plate data will show “1-24” headers.
SOFTmax PRO for Lmax User’s Manual
Chapter 6: File Management and Printing
2) Display options chosen for the Plate section section.
Whether raw or reduced data will be exported depends upon the display
options. If raw data is displayed, raw data will be exported; if reduced data is
displayed, this reduced data will be exported.
Open the Plate section section from which you will be exporting data. Click
the [Display] button in the tool bar of the Plate section to access the Display
dialog box. Choose the elements of the display settings that match the data
you would like to export: raw or reduced data, with or without number, and
so on. When finished selecting display preferences, click [OK] to close the
dialog box.
Figure 6.13: Display Dialog Box
NOTE: When exporting data as tab-delimited ASCII text, all reduced displays will be exported as numbers, regardless of how the data is
shown in SOFTmax PRO for Lmax. Choosing Grayscale, Ranged, or
Threshold will export the same information as the reduced number
display. Choosing “with number” will also not affect the exported
data, since only the raw number is exported when raw numbers are
displayed and only the reduced number will be exported when
reduced data is displayed.
3) Choices made in the Export dialog box.
After choosing Export... from the File menu, a dialog box will appear, asking
you to choose which sections you wish to export. You can choose to export
Plate sections (all or selected) and/or Group sections (all or selected). After
choosing a name for the exported data file, click [OK] to save the exported
data.
SOFTmax PRO for Lmax User’s Manual
6-17
Chapter 6: File Management and Printing
Figure 6.14: Export Dialog Box
Exported tab-delimited ASCII data files have a minimum of five lines and, in
most cases, will be considerably longer. The first line of an exported ASCII
data file includes one field indicating the number of data sets in the file. This
single field includes the text "##BLOCKS=" followed by a number that equals
the number of data sets.
The second line of a file for a Plate section includes 19 fields that provide all of
the information needed to determine the type of test that was run to measure
the first data set. The table following describes each of these fields.
6-18
SOFTmax PRO for Lmax User’s Manual
Chapter 6: File Management and Printing
Table 6.2: ASCII Data File Fields and Descriptors
Field
Field Entry
Description
1
Section kind
Plate:
2
Section name
Defined in Section dialog
3
Export version
1 (2 if there are headers)
4
Export format
PlateFormat or TimeFormat, set in Preferences
5
Read mode
Endpoint, dual read, long kinetics, or fast kinetics
6
Data mode
Luminescence
7
Data type
Raw or Reduced
8
Pre-read included
TRUE or FALSE
9
Kinetic points
Reduced plates and endpoint plates = 1
Kinetic plates: number of reads
10
Kinetic read time
Kinetic read time in seconds; otherwise blank field
11
Kinetic interval
Kinetic read interval in seconds; otherwise blank field
12
Blank field
13
Blank field
14
Blank field
15
Number of wavelengths read
1 for endpoint and kinetics; 2 for dual read
16
Wavelengths used
Always All
17
First column read
First column read (1 to max)
18
Number of columns
Last column read (1 to max)
19
Number of wells
Number of wells in a plate (96 or 384)
The information for the first plate section is provided in the lines following
the descriptors. The number of lines of data depend on the export format and
the type of test that is run. A minimum of one line of data is exported when
the Time format is used with an endpoint read.
NOTE: The temperature at the time of the reading will appear before the
first data point in the reading.
The second line of a file for a Group table section includes fields that correspond to the number and types of columns found in that section (they are
labeled as the table is labeled and look very much like the table itself.
Following the data, a blank line is included and then a line with a single termination field: ~End.
Each subsequent data set in the file includes the lines described above, a
blank line, and a line with the termination field.
SOFTmax PRO for Lmax User’s Manual
6-19
Chapter 6: File Management and Printing
Importing Data from Outside of SOFTmax PRO for Lmax
SOFTmax PRO for Lmax imports data in tab-delimited ASCII text format,
allowing you to import data collected by a non-Molecular Devices instrument
into SOFTmax PRO for Lmax. Note that only plate data can be imported.
Selecting Import... from the Import/Export menu under File causes the
Import dialog box to appear.
Figure 6.15: Import Dialog Box
Choose the file you wish to import and click the [Import] button. Note that data
to be imported must contain the appropriate header information. A new experiment is
created in the open SOFTmax PRO for Lmax file for the imported data. New
Plate sections are created for each data set within the file. Plate pre-read data
can also be imported. Note that the time/date stamp for a section containing
imported data shows “imported data” rather than a date or time.
Importing and Exporting Templates
Template information, saved as an ASCII text file, can be exported from Plate
sections and can also be imported into such sections. A template file consists
of seven columns of data that are separated by tabs. Each line of the file provides information for one well in a plate.
When template information is exported, the information for well A1 is written into the first line of the file, information for well A2 is written to the second line of the file, and so on, until a line has been created in the export file for
each well in a plate. If no template information exists for a well in a plate, that
line is left blank. The ASCII file terminates with the string “~End”.
The order for importing template information must match the export order.
Similarly, blank lines in the file are assigned to a well, providing a well with
no template setting.
Table 6.3 describes the data that is included in each column of the ASCII template file.
6-20
SOFTmax PRO for Lmax User’s Manual
Chapter 6: File Management and Printing
Table 6.3: ASCII Template File Columns and Descriptions
Column
Column Entry
Description
1
Group name
Assigned in the Group Settings dialog box. If this field is missing, the rest of the
line is ignored. Any text string can be entered in this field.
2
Column format
Assigned in the Group Settings dialog box. Four text strings are supported in
SOFTmax PRO for Lmax: Basic, Standards, Unknowns, and Unknowns[Dilution].
Blank groups have a Basic column format. If this field is empty, the Basic column
format is assigned.
3
Sample name
The sample name is set in the “Sample:” field of the Template Editor dialog box. If
this field is left blank, no sample name will be assigned to the well, although the
sample name will be included in the group.
4
Number of
descriptors
0 for Unknown column formats; 1 for other column formats.
5
Descriptor units
Assigned in the Group Settings dialog box. Supported strings are unit/ml, mg/ml,
ug/ml, ng/ml, mg, ng, and ml. If this column is left blank, unit/ml is assigned.
6
Sample
descriptor
Assigned in the Group Settings dialog box. Any text string can be entered in this
field or it may be left blank.
7
Descriptor value
Assigned in the Series dialog box. Can be set to any number or left blank.
Exporting Graphs
Graphs from Graph sections and Well Graphs can be exported in PICT format
(Macintosh) and EMF format (Enhanced MetaFile in Windows). Graph sections can be exported by choosing Export Graph from the Graph menu. Well
Graphs can be exported by choosing Export Graph from the Plots menu that
appears when a Well Graph is opened.
Copying and Pasting
Parts of an experiment can be copied within a SOFTmax PRO for Lmax file, to
or from another SOFTmax PRO for Lmax file, or to or from another program
using the Copy and Paste commands. Plate section data and text and summaries in Notes sections can be copied and pasted to other sections within the
same or a different experiment within SOFTmax PRO for Lmax or to other
programs. Virtually any ASCII-formatted text can be copied and pasted into a
Notes section. A graph can be copied and the resulting picture pasted into
another application. Template information can be copied and pasted from one
part of a template to another (within the same or to different templates and
from one experiment to another).
Plate Section Data and Templates
Copying and Pasting
within SOFTmax PRO
for Lmax
Data can be copied from one Plate section to another within SOFTmax PRO
for Lmax. Make the source section active by clicking on it and then choose
Copy (C; CTRL+C) from the Edit menu. Create a new section, if necessary, and
make the destination section active. Choose Paste (V; CTRL+V) from the Edit
menu to paste the data into this section.
SOFTmax PRO for Lmax User’s Manual
6-21
Chapter 6: File Management and Printing
NOTE: When copying Plate sections, all well data is copied. It is not possible to copy and paste the data from only certain wells. Even if you
select only one well prior to choosing the Copy (C; CTRL+C) command, all plate data will be copied and pasting will replace all data in
the destination plate.
If the Instrument Settings of the target section do not match the settings from
the section being copied, the Instrument Settings for the target section will be
updated appropriately to match.
Templates can also be copied from one Plate section to another within SOFTmax PRO for Lmax. However, the effects of this action depend on whether
you are pasting the template to another section in the same experiment from
which it was copied or to a section in a different experiment. Pasting a template to a section in the same experiment from which it was copied is useful
for cross-plate analyses since corresponding wells in each plate will be
assigned to the same group and sample.
Pasting a template to a section in a different experiment will create new
groups in that experiment if those groups have not been created previously in
that experiment. If you are pasting templates between experiments, and
groups from the source template do not exist in the destination experiment,
pasting a template will create them. Existing groups of the same name will
not be changed by the pasting process. For example, if the template being
copied contains the groups “Standard” and “Unknown,” and the group
“Standard” already exists in the destination experiment, the group
“Unknown” will be created but all information regarding the group “Standard” in the destination experiment will remain unchanged.
Experiments define a naming scope for the sections within them, which is
especially important for Group sections: it allows you to have identical
groups (name and column format) within two or more different experiments
in the same file. Having multiple experiments in the same file also provides
you with quick access to different types of information without having to
open or refer to multiple files.
Copying from Other
Programs
6-22
Plate section data and Notes section text can be copied from programs other
than SOFTmax PRO for Lmax and pasted into a Plate section or Notes section.
For Plate section data, the format of the copied information must match the
Instrument Settings of the target Plate section and the settings chosen in the
Export Format in the Preferences. Pre-read data cannot be pasted into a Plate
section. If there is a mismatch between the data to be pasted and the target sec-
SOFTmax PRO for Lmax User’s Manual
Chapter 6: File Management and Printing
tion, SOFTmax PRO for Lmax will attempt to paste the data, but if it cannot do
so, an error message will result (an example of such an error message for a Plate
section is shown in Figure 6.16). After data is pasted into a Plate section, the
information to the right of the display will show “imported data.”
Figure 6.16: Error Message Generated When Pasting Mismatched Data
NOTE: If you have created a template for a Plate section prior to pasting
data, numbers will be shown only in the group(s) you have created in
the template. Data in other wells will not be reported (but will be
available if you alter the template). Clearing the template or assigning groups to all wells in the plate will show the complete data set.
Copying to
Other Programs
Plate section, Group table section, and Notes section data can be copied from
SOFTmax PRO for Lmax and pasted into another program that will accept the
data (such as a spreadsheet or word processing program). No copy or paste
features are available for Graph sections or Well Graphs, but these graphs can
be exported as either PICT or EMF files (see “Exporting Graphs” on page 6-21
for more information).
Group Columns
You can copy a Group column and paste it within another Group in the same
experiment or into a Group of another experiment. The data included in the
pasted columns will be appropriate for the target group.
Highlight the column, select Copy (C; CTRL+C) from the Edit menu; then activate the section into which you want to paste the column and select Paste
(V; CTRL+V) from the Edit menu. If you highlight a column in the destination
section, the column you are pasting will appear to the right of the highlighted
column. Otherwise it will be appended to the right of all existing columns.
Columns and summaries in Group sections can also be copied and pasted to
other programs. Data from other programs cannot be pasted into Group sections within SOFTmax PRO for Lmax, however.
Copying Formulas and Summaries
Formulas are used in Group columns, custom reductions, and summaries.
Sometimes it is useful to copy an existing formula, column, or summary from
one area of the program to another, or from one experiment to another, rather
than taking time to recreate it. Summaries can also be copied and pasted within
SOFTmax PRO for Lmax. After pasting, both formulas and summaries can be
edited.
SOFTmax PRO for Lmax User’s Manual
6-23
Chapter 6: File Management and Printing
NOTE: Contiguous column formulas may be copied and pasted together.
Summaries must be copied and pasted individually.
To copy a formula or summary, highlight it and then select Copy (C; CTRL+C)
from the Edit menu. Activate the area or section in which you would like to
paste it; if necessary, with a formula, access the particular dialog box into which
it will be pasted. After placing the cursor in the correct location and highlighting
any existing information to overwrite it, select Paste (V; CTRL+V) from the Edit
menu. The pasted formula or summary will appear in the new location.
Formulas and summaries can be deleted by highlighting them and pressing
the Delete key or choosing Cut from the Edit menu.
Duplicate and New
Duplicate
All sections and even complete experiments can be duplicated by making the
section or experiment active and then selecting Duplicate from the Edit menu.
All of the information in the section or experiment (including data) is copied to
the newly created section or experiment. The name of the new section or experiment is the same as that of the original with the addition of the word “Copy”
(e.g., “OldName Copy”). Duplicated sections are created at the end of the experiment. Duplicated experiments are created beneath the other experiments.
Group section tables can also be duplicated. When a Group table is duplicated, its name is added to the Template Editor’s list of group names (but the
group is not assigned to any wells).
Graph sections that are duplicated include all settings for plots, fit, etc.
Notes sections are duplicated exactly, including any summaries and all text.
New
New sections and new experiments can be created by selecting New from the
Section or Experiment menu. If an existing section or experiment is active
when this command is chosen, all of the information in the section or experiment (except data) is copied to the newly created section or experiment. The
name of the new section or experiment is the same as that of the original with
the addition of an incrementing number (e.g., “OldName#2”). A new section
is created immediately below the active section. A new experiment is created
immediately below the active experiment.
New Group section tables can also be created but are devoid of any data.
New Graph sections include all settings for plots, fit, etc., but contain no data.
New Notes sections are exact copies of the active Notes section, including any
summaries and all text (same as duplicated Notes sections except for the
name).
6-24
SOFTmax PRO for Lmax User’s Manual
Chapter 6: File Management and Printing
Table 6.4: New vs. Duplicate within an Experiment
New
Duplicate
Notes
Section
Empty Notes section.
Replicates text and summaries from source
Notes section.
Plate
Section
Replicates Instrument Setup, Reduction,
and Display parameters from last Plate
section created (if no Plate section exists,
default values are used).
Replicates Instrument Setup, Reduction, and
Display parameters from last Plate section created.
Graph
Section
Creates a new Graph section with default
settings and asks for plot information.
Replicates all Graph settings, including any
plots that were defined in the source Graph
section.
Group
Section
Not available
Creates a replicate of the source Group section
table. The new group will be in the template
Group drop-down menu but no wells will be
assigned to this group.
Password Protection
Individual protocol and/or data files can be protected by adding a password
to them. When a protocol file is password protected, you may read data into
the file but you may not change the file in any other way. When a data file is
password protected, you may view the file but are unable to change it. The
correct password must be entered to make changes to the files.
The table below shows the various actions that are protected when a password is assigned to a SOFTmax PRO for Lmax file.
SOFTmax PRO for Lmax User’s Manual
6-25
Chapter 6: File Management and Printing
Table 6.5: Actions Protected by Password
Menus
Tool Bar
Buttons
Dialog Boxes
Others
File>Page Setup
Read*
Summary
Moving a formula in a Notes
section
File>Import
Instrument Setup
Resizing columns in a Group
File>Save As...
Template Editor
Moving sections and experiments
Edit>Undo
Reduction
Typing in sections (Notes and
Plate)
Edit>Cut
Display
Edit>Paste
Mask Well
Edit>Clear
New Column
Edit>Delete Section
Edit Formula
Edit>Duplicate Section
Plots
Edit>New Experiment
Graph Options
Edit>New Section
X-Axis/Y-Axis
Edit>Text Style
All Section Settings
Control>Instrument Setup
Notes (all items)
Plate (all items)
Group (all items)
Graph (all items)
* Only if data exists in the section.
Setting and Changing a Password
Choosing Set Password... from the File menu causes the Password dialog to
appear. If the active document is already password protected, the menu command changes to Change Password... .
Figure 6.17: Set Password Dialog Box. Left, no password set previously; right, with
previously set password.
This dialog appears differently depending upon whether or not you are setting a password for the first time or if you are changing/removing an existing
password. If you have not previously set a password, the dialog box will
appear like that on the left of Figure 6.17. To set a password, type it in both
6-26
SOFTmax PRO for Lmax User’s Manual
Chapter 6: File Management and Printing
boxes (first to set it and then to confirm it). After password protection is
enabled, a “locked” icon will appear on the right side of the status bar (
).
When changing or removing a password, the dialog box will appear as shown
on the right of Figure 6.17. Before you can change or remove the password, you
are required to enter the old password in the top text box. After entering the old
password, checking the box next to “Remove Password” and typing nothing in
the rest of the boxes will clear the password from the file when you click [OK].
As with all password protection, be sure to choose a password that you will
be able to remember, since the file will be locked to changes of nearly any
kind should you forget it. If you try to perform an unauthorized action on a
protected file, a dialog box will appear asking you to enter the password.
Figure 6.18: Password Required Dialog Box
When this dialog box appears, you must enter the password in order to continue with the action you have chosen.
If you do not remove password protection prior to trying to change the file,
every attempt to change the file will result in this dialog box appearing. This
repeat prompting can be stopped by enabling the Suspend Password option
(click the box to check it).
! CAUTION: SOFTmax PRO for Lmax provides no hidden commands
that will override password protection. If you are concerned that you
might forget your password, write it down and store it in a safe place
for future reference.
SOFTmax PRO for Lmax User’s Manual
6-27
Chapter 6: File Management and Printing
6-28
SOFTmax PRO for Lmax User’s Manual
Chapter 7
Tutorial
Introduction . . . . . . . . . . . . . . . . . . . . . . . . . . . . . . . . . . . . 7-3
Hard and Soft Parameters . . . . . . . . . . . . . . . . . . 7-3
Description of the Assay Example . . . . . . . . . . . 7-4
Define the Protocol . . . . . . . . . . . . . . . . . . . . . . . . . . . . . . 7-4
Start SOFTmax PRO for Lmax and Open the
Tutorial File. . . . . . . . . . . . . . . . . . . . . . . . . . . . . . . . . 7-5
Define the Instrument Settings . . . . . . . . . . . . . . . . . . . . 7-6
Define the Template . . . . . . . . . . . . . . . . . . . . . . . . . . . . 7-11
Set the Display Parameters . . . . . . . . . . . . . . . . . . . . . . 7-17
Save the Protocol . . . . . . . . . . . . . . . . . . . . . . . . . . . . . . . 7-18
“Read” the Plate . . . . . . . . . . . . . . . . . . . . . . . . . . . . . . . 7-19
Data Analysis—Group Sections . . . . . . . . . . . . . . . . . . 7-21
Data Analysis—Standard Curve. . . . . . . . . . . . . . . . . . 7-29
Print a Report. . . . . . . . . . . . . . . . . . . . . . . . . . . . . . . . . . 7-31
Chapter 7: Tutorial
7-2
SOFTmax PRO User’s Manual
Chapter 7: Tutorial
Introduction
The “hands-on” written tutorial included in this chapter is designed to take
you through the basic features of the SOFTmax PRO for Lmax program while
creating and running a simulated quantitative endpoint assay. We suggest
that you read and follow the steps in this “hands-on” tutorial before using
SOFTmax PRO for Lmax for the first time. Going through this tutorial will
help you learn to use the basic features quickly. To learn more about SOFTmax PRO for Lmax, you will want to read through Chapter 3, “SOFTmax
PRO for Lmax Overview,” Chapter 4, “Reading Microplates,” and the introduction to the Formula Reference Guide.
NOTE: If you have not yet installed SOFTmax PRO for Lmax, refer to Chapter 2, “Installation,” and follow the steps to install the software before
continuing with this tutorial.
Hard and Soft Parameters
The only settings that must be defined before reading a microplate are the
instrument settings (found in the Instrument Setup dialog box). These settings tell the instrument what conditions should be in place in order to collect
data. They include the read mode (endpoint, dual read, long kinetics, and fast
kinetics), the wells to read, any injections required, and so on. These settings,
called “hard” parameters, define the conditions under which the data is
obtained. Once a microplate has been read, the instrument settings cannot be
changed without deleting the data.
“Soft” parameters include the template definition, data reduction, and data
display settings. These parameters can be defined prior to reading a microplate, but they are applied only after the plate is read and can be changed at
any time.
In this tutorial, you will build a complete protocol that will include both hard
and soft parameters. You will save the completed protocol file prior to collecting data.
This tutorial has been written specifically for use with the Lmax
Microplate Luminometer.
A synopsis of the steps you will take during this tutorial is given below.
NOTE:
1.
2.
3.
4.
5.
6.
7.
8.
9.
10.
SOFTmax PRO User’s Manual
Create a new file
Instrument setup
Template setup
Set reduction parameters
Set display parameters
Save the protocol
Read the plate (start the simulator and then open the Tutorial file)
Analyze data—Standard Curve
Analyze data—Standard section
Print the report
7-3
Chapter 7: Tutorial
Description of the Assay Example
Following are the details about the quantitative assay settings we will use to
create a protocol file using SOFTmax PRO for Lmax.
Type of Assay:
Endpoint, quantitative assay with Standards and
Unknowns (with and without dilution factor)
Standards in pg/µL: 500.0, 250.0, 125.0, 62.5, 31.3, 15.6, and 7.8
(each standard run in triplicate)
Blanks:
Group-associated blanks (with Standards), in triplicate
Integration:
1 second
Injection:
P injector; volume: 100 µL; delay: 3 seconds
Standard Curve Fit:
Linear
Reduction:
Default (!MValue)
Define the Protocol
The following steps will guide you through the process of creating a protocol
file for a quantitative assay. Reading an actual plate will not be required—
data will be acquired using a simulator program that is part of SOFTmax PRO
for Lmax.
7-4
SOFTmax PRO User’s Manual
Chapter 7: Tutorial
Step 1: Start SOFTmax PRO for Lmax and Open the Tutorial
File
Double-click the SOFTmax PRO for Lmax icon to start the program.Choose
Tutorial.lpr from the Assays menu. You should see a new file labeled “Untitled” which should resemble the one shown below.
Figure 7.1: Tutorial File (Blank) with Notes #1 and Plate#1 Sections Open
SOFTmax PRO User’s Manual
7-5
Chapter 7: Tutorial
Step 2: Define the Instrument Settings
Click on the Plate#1 section to make it active and then click the [Setup] button to open the Instrument Settings dialog box. The option button next to
“Endpoint” at the top is automatically selected; no change is required. On the
left side of this dialog box are main section headings, followed by descriptions of the current settings for those headings. The right side of the dialog
box shows the options available for the selected heading on the left. The first
section, “Integration and Pre-read” is selected automatically, showing that the
Integration Time is set to the default of 1 second and Pre-Read plate is disabled. These settings are fine for this assay.
Figure 7.2: Instrument Settings Dialog Box—Integration and Pre-read Section Open
7-6
SOFTmax PRO User’s Manual
Chapter 7: Tutorial
Click the next heading on the left side, “Injection and Delay.” The Instrument
Settings window should look like the following.
Figure 7.3: Instrument Settings Dialog Box—Injection and Delay Section Open
SOFTmax PRO User’s Manual
7-7
Chapter 7: Tutorial
Click in the checkbox next to P-Injection to enable it. Drag over the default
volume (25 µL) to highlight this value and overtype it with the new volume of
100 µL. Highlight the default of 1.9 seconds for the delay and enter the new
value of 3 seconds. Leave M-injection disabled.
The Instrument Settings dialog box should now look like this:
Figure 7.4: Instrument Settings Dialog Box—Injection and Delay Section Revised
7-8
SOFTmax PRO User’s Manual
Chapter 7: Tutorial
Since the entire plate will be read and that is the default setting, you do not
need to do anything to the “Wells To Read” section.
You do need to define the wells that will be injected by the P-injector, however. Click on the “Injection Wells” heading on the left side of the dialog box
to open that section on the right. The default shows no wells selected and the
P-injector enabled as shown below.
Figure 7.5: Instrument Settings Dialog Box—Injection Wells Section Open with
P Injector Enabled
SOFTmax PRO User’s Manual
7-9
Chapter 7: Tutorial
You can click individual wells or click and drag across groups of contiguous
wells to enable injection within them. Note that the wells you select for the Pinjector will be shown with a red half-circle—if the M injector were enabled,
its wells would be shown with blue half-circles on the other side of the wells.
Wells can be selected in any order; if you select an incorrect well by mistake,
click it again to deselect it. Select wells as shown in the following figure:
Figure 7.6: Instrument Settings Dialog Box—Injection Wells Selected
The wells you have selected are now also shown on the left side of the dialog
box beneath the “Injection Wells” heading.
You do not need to change the default setting of 96-Well Standard for the
Plate Type.
The settings are now complete. Click [OK] to accept the settings as shown
and close the dialog box.
7-10
SOFTmax PRO User’s Manual
Chapter 7: Tutorial
Step 3: Define the Template
A)
Click the [Template] button in the Plate section tool bar. This will open the
Template Editor, showing all wells empty. Drag the mouse (or shift-click) to
select the first three columns of wells, 1 through 3. These wells will be defined
as Standards for the assay. Click the Group pull-down menu. Because no
groups have been created yet (Blank is all that is available), you will have to
create a new one. Choose New... .
Group
Pull-down
Menu
Figure 7.7: Template with Three Columns of Wells Selected and New Group Being
Created
B)
The Group Settings dialog box will appear, allowing you to name the new
group and select the appropriate information for it. Name the new group
“Standards” and choose the “Standards” Column Format. Doing this automatically enables the Sample Descriptor and enters the default units,
“µg/mL.” The tutorial assay uses “pg/µL,” however, so you will need to
change this. Clicking on the arrow next to units shows all possible options—
but “pg/µL” is not among them. You must enter it manually by overtyping
the value in the box. When you are done entering information, the Group
Settings dialog box should appear like the one on the right, below.
Figure 7.8: Instrument Settings Dialog Box. Left shows initial settings; right shows
settings after entering information for the new group, Standards.
SOFTmax PRO User’s Manual
7-11
Chapter 7: Tutorial
Click [OK] to close the dialog box and apply the Standards group to the wells
you had selected in the template. It should now look like this:
Figure 7.9: Template with Standards Assigned.
C)
The first three wells in row A are to be designated as a group-associated blank
within the Standards group. To do this, first click on the template somewhere
other than on the Standards group and then highlight wells A1 through A3.
Click the arrow to the right of the Sample descriptor in the upper middle of
the Template. From the drop-down menu, choose “BL.” The template should
look like this:
Figure 7.10: Template with Group-Associated Blank Included with Standards.
D)
7-12
The Standards entered into the template are currently all the same. However,
this assay requires the use of standards with different concentrations, run in
SOFTmax PRO User’s Manual
Chapter 7: Tutorial
triplicate. The easiest way to start setting this up is to create a “series” by first
highlighting the remaining Standards wells and then clicking the [Series]
button in the upper right of the Template Editor. In the dialog box that
appears, leave the default values for the First Sample name (Std01) and Sample Descriptor (Concentration in pg/µL). Choose to have this series start from
the bottom and enter 500 for the starting value, choose the function “/” and
enter 2 for the increment of the series. These choices will cause the series of
wells you have selected to be assigned concentrations of 500, 250, 125, 62.5,
31.25, 15.625, and 7.813 pg/µL, respectively, in triplicate from the bottom up.
The choices you have made should look like this:
Figure 7.11: Series Dialog Box
Click the [OK] button to close the dialog box and return to the Template Editor. The wells you selected should now be assigned the values entered for the
series. You can check the concentrations assigned to these wells by pressing
and holding the CTRL+Shift keys.
Figure 7.12: Template with CTRL+Shift Keys Depressed
SOFTmax PRO User’s Manual
7-13
Chapter 7: Tutorial
E)
This tutorial assay uses two groups of unknown samples, one with and one
without dilution. Each unknown is run in triplicate.
Start by highlighting wells A4 through C5. Select “New” from the Group
menu and enter “Unknowns” for the name, Unknowns for the Column Format, and then click [OK]. The selected wells will now show the default first
sample name for the Unknowns group, “Un01.” The template should look
like the one below.
Figure 7.13: First Unknowns Added to the Template
F)
7-14
These unknowns need to be identified with different sample names. The
shortcut to doing this is to make them a series but change only the name. To
do this, click the [Series] button and, in the dialog that results, leave all settings as they are but enable the Sample Descriptor section by clicking in the
checkbox. Leave the information in this section as it is (starting with 1 and
dividing by 1). This will not change the group in any way except to increment
the name of each sample from left to right. When finished, click [OK] to close
the dialog box. The template should now look like this:
SOFTmax PRO User’s Manual
Chapter 7: Tutorial
Figure 7.14: Unknowns Changed to a Series
G)
The next group to add is the Unknowns with Dilution. Highlight wells E5
through G9. Choose “New” from the Group menu and, in the Group Settings
dialog box, enter the name “Unk w/Dilution,” choose the Unknowns(dilution) Column Format, and enter pg/µL for the units. The Group Settings dialog
box should look like the one below. When all settings have been entered, click
[OK] to close the dialog box.
Figure 7.15: Group Settings Dialog Box for Unknowns with Dilution
H)
These Unknowns with Dilution need to have names that reflect distinct samples run in triplicate and they also need to all show a dilution factor of 10.
Choose the [Series] button again and, in the dialog box that appears, enter
“10” for the starting dilution. Leave the rest of the settings in this dialog box
as they are (the series will progress from left to right and will divide the starting concentration by 1). Clicking [OK] will update the template so that all
wells in the Unknowns with Dilution now show a dilution factor of 10 and
sample names increment from left to right in replicates of 3 as shown below.
SOFTmax PRO User’s Manual
7-15
Chapter 7: Tutorial
Figure 7.16: Template Complete
I)
The template is now complete. Click the [OK] button to accept the entries and
close the Template Editor. The outlines of the groups you have defined in the
Template Editor will now be shown in the Plate section.
Figure 7.17: The Plate Section Showing Template Group Boundaries
7-16
SOFTmax PRO User’s Manual
Chapter 7: Tutorial
Step 4: Set the Display Parameters
Click the [Display] button to open the Display dialog box.
Figure 7.18: Display Dialog Box (Endpoint)
The default display for Endpoint readings is raw RLU. This tutorial example
displays reduced data as a number. To do this, click the [Reduced] button at
the top of the dialog box and then choose “Number” from the choices that
appear:
Figure 7.19: Display Dialog Box after Choosing Reduced and Clicking the Display
Choices Drop Down Menu
Click [OK] to close the dialog box.
SOFTmax PRO User’s Manual
7-17
Chapter 7: Tutorial
Step 5: Save the Protocol
Choose Save from the File menu. Because the file has not been saved before
and is not named, the Save As... dialog box will open.
Figure 7.20: Save As... Dialog Box—Macintosh
Figure 7.21: Save As... Dialog Box—Windows
On the Macintosh, click the option button next to “Protocol File.” In Windows, click in the box under “Save File as Type:” and choose “Pro for Lmax
Protocols (*.lpr).” Type Tutorial (the name for the file) in the text box (highlighted over “Untitled”). Then click [Save] to place a copy of the protocol file
to the hard disk.
NOTE: The title bar of the window will still show “Untitled” rather than
“Tutorial” after saving. This does not mean the protocol has not been
saved. When you create a protocol file, SOFTmax PRO for Lmax saves
a copy of the current file under that file name but does not display the
name on the screen. Protocol files are saved as template files (on the
Macintosh, these are known as stationery files). When you open a pro-
7-18
SOFTmax PRO User’s Manual
Chapter 7: Tutorial
tocol file, an “Untitled” window appears, containing all the protocol
information saved previously, so that you can collect data and save
the resulting data file under a different name.
Congratulations! You have just created your first SOFTmax PRO for Lmax
protocol file. Now would be the time to read the plate and then save the data
file. In this tutorial example, however, you will not perform an actual plate
reading but will use a simulator program built into SOFTmax PRO for Lmax
to generate “data” that you will manipulate as if it had been obtained from an
actual reading.
Note that the Default Protocol which ships with SOFTmax PRO for Lmax contains a template and display parameters that are equivalent to the protocol
file you just created in this tutorial example.
Step 6: “Read” the Plate
If you were reading an actual microplate at this time, you would prepare the
microplate as it is defined in the Template Editor. (Before an actual reading,
you might find it helpful to print a copy of the template to assist in properly
filling the plate: from the Template Editor, click the [Print] button in the
lower left corner.) You would then place the filled microplate in the drawer of
the MAXline instrument. Since we are using a simulator, you don’t need to
load anything in the instrument. To enable the simulator, open the Preferences (choose Edit > Preferences) and then click on the instrument type
shown in the lower left corner of the dialog box. A menu will appear, offering
a choice of instrument or simulator. Choose Simulator (see the figure below).
Figure 7.22: Simulator Choice in the Preferences Dialog Box
When the simulator is active, the instrument icon in the upper left corner of
the window will be blue instead of orange. With the simulator active, click the
[Read] button in the status bar at the top of the screen to initiate the simulated reading.
Values will appear in the data display in the Plate section as if they were
being read by the Lmax. When the simulated reading is complete, the plate
section should look similar to the one below.
SOFTmax PRO User’s Manual
7-19
Chapter 7: Tutorial
Figure 7.23: Plate Section with Simulated Data
The display for each well that is defined by a group boundary shows a raw
RLU value displayed in a reduced form as a number. The reduction formula
is shown at the bottom of the display: “Wavelength Combination: !MValue.”
In this part of the tutorial, you will display the data in various other reduced
formats.
A)
Click the [Display] button again to open the Display dialog box. Earlier in
this tutorial, we chose to display the data as a reduced number. The other display choices for endpoint data are Threshold, Ranged, and Grayscale. You can
experiment more with the various display options, if desired, at a later point.
For now, choose “Grayscale” from the drop-down menu. The dialog box will
update to show the low and high limits for grayscale display values (which
are automatically set to the minimum and maximum data values).
High and Low
Limit Settings
Figure 7.24: Display Dialog Box Updated with Low and High Limit Settings
7-20
SOFTmax PRO User’s Manual
Chapter 7: Tutorial
Click [OK]. The dialog box will close, and the data display in the Plate section
will update to show the data represented by shades of gray as shown in Figure 7.25.
Figure 7.25: Plate Display with Data Displayed as Gray Scale
Step 7: Data Analysis—Group Sections
Group sections are created automatically by SOFTmax PRO for Lmax when
you define groups in the Template Editor. The content of Group sections
changes depending on the wells that are assigned to these groups in the Template Editor. Before a plate is read, these sections show no data for the wells.
After a reading, Group sections contain information about the values for the
wells contained within the groups.
SOFTmax PRO User’s Manual
7-21
Chapter 7: Tutorial
Scroll down until the Standards Group is visible. It should look like this:
Figure 7.26: The Group Section for Standards
The columns in this group are set up as follows, from left to right:
• Sample: the seven sample names assigned for the Standards group.
• Concentration: the concentrations assigned to each sample in the template.
• Wells: The wells that are assigned for each sample in triplicate in the
template.
• Values: raw RLU values obtained for each sample.
• MeanValue: the mean of data from the Value column for each sample.
• StdDev: standard deviation for each sample value.
• CV%: coefficient variation percent for each sample value.
In the following part of this tutorial, you will view formulas associated with
columns and summaries, resize individual columns, autosize all the columns,
add a column, and hide replicates.
7-22
SOFTmax PRO User’s Manual
Chapter 7: Tutorial
A)
Viewing Formulas. To view the formulas associated with all columns in the
Standards Group section, hold down the CTRL+Shift keys while the
Standards group is active. Another row will appear beneath the column titles,
showing the formula for each column. Depending on the size of the column,
all or only part of each formula may be shown.
Figure 7.27: A Portion of the Standard Group Section with Formulas Shown
(by Pressing the CTRL+Shift Keys)
If column formulas are long, as in this tutorial example, they may be seen in
their entirety in the default column size. To see the complete formula for a particular column, click once on a column to highlight it. The formula for that column will be shown in the tool bar.
Figure 7.28: Standards Group Section with Formula Shown for Highlighted
Column (MeanValue). Click the
button to modify or change a formula.
SOFTmax PRO User’s Manual
7-23
Chapter 7: Tutorial
B)
Resize and then Autosize a Column. Position the pointer on the line dividing
the columns named “Concentration” and “Wells.” The pointer will change to
a double-headed arrow. Click and drag the line dividing these columns to the
right. Figure 7.29 shows these actions and the resulting wider Concentration
column.
DoubleHeaded
Arrow
Pointer
Dividing
Line
Dragging
Right
Resulting
Column is
Wider
Figure 7.29: Sizing the Concentration Column Wider
To shrink this column to the minimum size needed to display the complete
title, click once in the Concentration column to highlight it. Then choose
Autosize from the Group menu. The column will be reduced in width as
shown in Figure 7.30.
NOTE: Several columns can be Autosized at one time by highlighting
(dragging across) multiple columns in the Group and then choosing
Autosize.
7-24
SOFTmax PRO User’s Manual
Chapter 7: Tutorial
Before
After
Figure 7.30: Columns Before and After Autosize
C)
Add a Column. The columns that are created by default with various Group
sections may not always meet all the needs of a particular experiment. You
can add a column to any Group section and define the purpose of this column
in your data analysis. By default, new columns are added to the right of any
selected (highlighted) column or, if no columns are selected, after the last column in the Group.
To add a new column to the right side of the Standards Group, make sure this
section is active. Then deselect any highlighted columns by clicking outside
the column area. Click the Create Column button (
) or choose Create
Column from the Group menu. A dialog box will open, asking you to enter
information for the new column.
Figure 7.31: Calculation Dialog Box
SOFTmax PRO User’s Manual
7-25
Chapter 7: Tutorial
In this tutorial example, the new column will show the maximum value
obtained for each sample. Type over the default column name, entering
MaxValue in the box next to “Name.” Now enter Max(Values) in the box next
to “Formula” and click [OK]. (Be sure to enter the formula exactly as shown.)
The dialog box will close and a new column will be shown at the right of the
previous columns, showing the maximum value obtained for each sample.
Figure 7.32: New MaxValue Column Appended to Standards Section
D)
Create an “If” Statement in a Column Formula. An “If” statement in a formula defines a condition that, if found to be true, causes a certain result and,
if not true, causes a different result. The basic structure of an If statement is:
An “If” statement in a formula defines a condition that, if found to be true,
causes a certain result and, if not true, causes a different result. The basic
structure of an If statement is:
If (condition,result1,result2)
We are going to create an If statement (formula) within the Unknowns section
that will compare data from the Values column in that section against calculations found in the Standards section. Here’s the formula we will create:
If(Values>=MinStd@Standards and Values<=MaxStd@Standards,””,”Outlier”)
This statement says that, if the data shown in the Values column (of the
Unknowns section) is greater than or equal to the calculation of “MinStd”
found in the Standards group section and less than or equal to the calculation
of “MaxStd” found in the Standards group section, then show nothing (signified by two quotation marks with nothing between them); otherwise show
the word “Outlier.”
Looking at the Standards section, you will not immediately see the MinStd or
MaxStd calculations used by this If statement. They are there, but their names
7-26
SOFTmax PRO User’s Manual
Chapter 7: Tutorial
are hidden. Look at the bottom of the Standards section and you will see two
summaries as shown in the following figure.
Figure 7.33: Summaries in the Standards Section
Double-click the first summary, “Smallest standard value”. A Calculation dialog box will appear:
Figure 7.34: Calculation Dialog Box from Summary in Standards Section
This dialog box contains a checkbox for “Hide Name” which is currently
enabled. Unchecking the box will allow you to view the name of the summary to the left of its text in the Standards section.
The formulas for MinStd and MaxStd are:
Min(MeanValue)
Max(MeanValue)
The MeanValue column is derived from the average of the well values found
in the Values column (the Standard replicates). The minimum and maximum
values from the MeanValue column in the Standards group are used to create
the summaries, and the summary formulas are used to determine our “Outliers.” Such a formula might be useful in finding points that might be better
masked (not used in the calculations), for example.
Basic information regarding formulas and the information they can contain
can be found in Chapter 5, “Displaying and Analyzing Data.” For a complete
discussion of writing formulas in SOFTmax PRO for Lmax, as well as detailed
SOFTmax PRO User’s Manual
7-27
Chapter 7: Tutorial
examples of formulas and customized protocols, refer to the Formula Reference
Guide.
E)
Hide Replicates. While the Standards section is active, choose Hide Replicates from the Group menu. The display before and after hiding replicates is
shown in Figure 7.35.
Standards
Section
Showing
Replicates
(Default)
After
Hiding
Replicates
Figure 7.35: Standard Section Before and After Hide Replicates
More information about modifying group sections can be found in Chapter 5,
“Displaying and Analyzing Data.”
7-28
SOFTmax PRO User’s Manual
Chapter 7: Tutorial
Step 8: Data Analysis—Standard Curve
The Default Protocol (which is the same as the protocol file created in this
tutorial example) contains the predefined groups Standards, Unknowns, and
Unk w/dilution. In addition, it contains a graph section which has been created to display a standard curve. If you have not already done so, open the
Default Protocol (to create a new “Unknown” file) and, with the simulator
still running, click the [Read] button to gather simulated data.
Scroll down within the SOFTmax PRO for Lmax window until you see the
section tool bar for “Std graph.” This section is closed; click the indicator on
the left side of the tool bar to open it. This graph contains a single plot as
shown in Figure 7.36.
Figure 7.36: Standard Curve Graph Section—Linear Fit Applied. Note that this simulated data does not work well with this linear curve fit.
This graph is set to show pg/well on the X-axis and mean value (RLU) on the
Y-axis. A linear fit has been applied to this data but, because the simulated data
is not accurate, the fit is not good. If you were to try to find a good fit for this
data, you could apply other curve fits by clicking in the box next to “Fit:” in the
Graph section toolbar and making a different fit selection. Try some of them, as
you wish. The figure below shows the result of applying a 4-parameter curve to
this simulated data for a much closer fit.
SOFTmax PRO User’s Manual
7-29
Chapter 7: Tutorial
Figure 7.37: Standard Curve Graph Section with 4-Parameter Fit Applied
You can also display the data in a bar-graph or another format by clicking the
graph options button
which opens a dialog box like that shown in the following figure.
Figure 7.38: Graph Options Dialog Box
This dialog box allows you to rename the graph, choose the type of graph that
will be shown, and to format the text used in the graph. You can add or remove
plots (click the [New] or [Delete] buttons) and you can also edit existing plots.
See Chapter 5, “Graph Section,” for more information regarding the graphing
options that are available.
7-30
SOFTmax PRO User’s Manual
Chapter 7: Tutorial
Step 9: Print a Report
SOFTmax PRO for Lmax allows you to print several types of information. In
addition to printing a copy of the template, you can print the active section,
the sections that have been designated to be included in the report, or all sections.
The default setting in SOFTmax PRO for Lmax is for all sections to be
included in the report. You can exclude sections from printing as described in
Chapter 6, “File Management and Printing.” Otherwise, choosing Print...
from the File menu and choosing “Print report” will print all of the sections
that are designated to be included in the report, regardless of whether or not
they are open.
A standard Print dialog box will appear (the appearance of this box depends
upon the type of computer and printer you are using). Select the appropriate
settings for your printer and then click [Print] or [OK].
Figure 7.39: Print Dialog Box for Macintosh
SOFTmax PRO User’s Manual
7-31
Chapter 7: Tutorial
Figure 7.40: Print Dialog Box for Windows (Epson Stylus 800 Shown)
You have completed this tutorial!—but SOFTmax PRO for Lmax has many other
features that you will find useful. The next chapter describes in detail items
only briefly discussed up to this point and will provide information regarding
customizing and using the rest of the features of SOFTmax PRO for Lmax.
7-32
SOFTmax PRO User’s Manual
Chapter 8: Troubleshooting
Introduction . . . . . . . . . . . . . . . . . . . . . . . . . . . . . . . . . . . . . . . . . . . . . 8-3
Message Boxes and Alerts . . . . . . . . . . . . . . . . . . . . . . . . . . . . . . . . . 8-3
One or More Points Lost Message . . . . . . . . . . . . . . . . . . . 8-4
Error Message Boxes . . . . . . . . . . . . . . . . . . . . . . . . . . . . . . . . . . . . . 8-4
Communication Problems . . . . . . . . . . . . . . . . . . . . . . . . . . . . . . . . . 8-5
Macintosh Cable Connections . . . . . . . . . . . . . . . . . . . . . . 8-8
PC Cable Connections . . . . . . . . . . . . . . . . . . . . . . . . . . . . . 8-9
Display Problems . . . . . . . . . . . . . . . . . . . . . . . . . . . . . . . . . . . . . . . 8-10
Printing Problems . . . . . . . . . . . . . . . . . . . . . . . . . . . . . . . . . . . . . . . 8-10
General Problems . . . . . . . . . . . . . . . . . . . . . . . . . . . . . . . . . . . . . . . 8-11
Chapter 8: Troubleshooting
8-2
SOFTmax PRO for Lmax User’s Manual
Chapter 8: Troubleshooting
Introduction
When alerts, message boxes, or error boxes appear while you are using SOFTmax PRO for Lmax, they usually contain information describing the situation.
In some circumstances, however, the information may not be complete
enough to indicate what you should do to remedy the problem. At other
times, errors may occur that are not directly associated with SOFTmax PRO
for Lmax but affect its operation. The information in this chapter is provided
to assist you if an error occurs for which you do not have a solution or if you
don’t know the source of a problem.
This chapter presents general information regarding problems you may
encounter first, followed by specific types of problems grouped by kind: display issues, printing errors, etc. Within each group is general information
regarding such problems, sometimes followed by a table containing specific
problems and their suggested remedies. If you encounter a problem during
operation of SOFTmax PRO for Lmax, first check to see if a table is associated
with that type of problem and see if a remedy is listed there. When remedies
require more space than the table can allow, a reference to a numbered text
section will be listed in the table. Refer to that text section (by number)
beneath the table to learn more about solving the problem.
If you need additional assistance or if you encounter a problem with SOFTmax PRO for Lmax that is not listed here, in the U.S., call Molecular Devices
Technical Services group at 1-800-635-5577; elsewhere, call your local representative. For problems with an instrument that do not relate to the use of
SOFTmax PRO for Lmax, please see the instrument manual for more information.
Message Boxes and Alerts
Message boxes typically appear to inform you that the action you are
attempting needs adjustment in some way. Message boxes contain only an
[OK] button that you can click to remove the message after you have read the
information.
Alerts inform you that the action you are about to take will have consequences that may not be reversible or may make a significant change within
the program. Alerts are indicated by an alert symbol ( ! ); typically, alerts do
not prohibit an action but warn you about a condition that may cause a problem.
One common example of an alert occurs when you are defining instrument
settings for a kinetic assay and the read interval is too short. The message
might look like this:
Figure 8.1: Example of an Alert Message
SOFTmax PRO for Lmax User’s Manual
8-3
Chapter 8: Troubleshooting
One or More Points Lost Message
A problem may exist with the instrument or the computer, or a communication problem may exist between the instrument and the computer. This error
message means that no signal was recorded in a given well (for an endpoint
reading) or at one or more timepoints for a given well (for a kinetic run). The
instrument sent a placeholder (“NAN” — stands for “Not A Number”) in lieu
of a number and continued to collect data.
Depending on the type of assay(s) conducted, it may be very easy or difficult
to see which wells were not read. During an endpoint reading, it might be
quite easy to spot a missed data point; finding one during a long kinetics
reading might be quite difficult, however. Follow the instructions below for
the type of reading that was performed when the error occurred in order to
assist you in finding lost data points.
Lost Data with an Endpoint Reading
If you get such an error message during an endpoint reading, try displaying
raw signal and visibly inspect the plate data for missing read points.
Lost Data with a Kinetics Reading
If the error occurs during a kinetics run, access the Reduction dialog box (click
the [Reduction] button) for the plate section that was read. Choose “Custom” for the reduction and then click the formula button that appears (
)
to bring up the Calculation dialog box. For the kinetic reduction, enter the formula !numpointsread and then close the dialog box. In the Plate section, set the
display (click the [Display] button) to raw data plot with reduced number.
Compare the number shown in the Plate display with the number of Vmax
Points listed at the right-hand side of the Plate section. The numbers should
be the same. If a time point was not collected in a well, the Plate display number will be lower.
Error Message Boxes
Error boxes contain a stop graphic (
) and text explaining the error, if the
software can report it. Some errors are not recoverable and require that you
perform the action or assay again. Others, such as an obstruction of the
drawer of the microplate reader, report the problem and allow you to correct
it and then proceed with the assay.
8-4
SOFTmax PRO for Lmax User’s Manual
Chapter 8: Troubleshooting
You have attempted to paste values from an external file containing ASCII
tab-delimited data into a Plate section, but the number of fields of data that
you have copied does not match those required by the setup of that Plate section.
The format of the copied information must match the Instrument Settings of
the target Plate section and the settings chosen in the Export Format in the
Preferences. Check that all the required fields are present and that you have
highlighted all of these fields prior to copying the data and try pasting again.
Communication Problems
Symptom
Possible Cause/Solution
The instrument icon shown
in the upper left corner of the
SOFTmax PRO for Lmax
window has an “X” through
it
1) Is the Lmax turned on?
2) If the icon also has the words “No port selected” through it along
with an “X,” open the Preferences and select the proper communications port (setting should agree with the physical port to which the
cable from the instrument is connected to the computer).
3) Quit SOFTmax PRO for Lmax, turn off power to both the computer
and the instrument. Check that cable connections between the
instrument and computer are secure. Turn both machines on again
and restart SOFTmax PRO for Lmax. If an “X” still appears over the
icon, it may be that you are using the wrong type of cable. See
“Communication #1” (following) for more information.
The Macintosh computer has
only one serial port and can’t
connect to an Lmax and
printer at the same time.
You can purchase a serial switch that will allow you to choose between
communication with the Lmax or the printer. See “Communication #2”
(following) for more information.
Communication #1
Instrument Icon Shown with an “X”
If the instrument icon shown in the upper left corner of the SOFTmax PRO for
Lmax window has an “X” through it, check whether the Lmax is turned on. If
it is, then check the SOFTmax PRO for Lmax Preferences settings (see Setting
Preferences below) to ensure that the proper communications port (modem or
printer for the Macintosh; COM1 or COM 2 for the PC) is selected. This setting should agree with the physical port to which the cable from the instrument is connected to the computer. If the port setting is correct, the
instrument is on, and communication is still not functioning properly, quit
SOFTmax PRO for Lmax, turn off power to both the computer and the Lmax,
and check that the cable connections between the instrument and computer
SOFTmax PRO for Lmax User’s Manual
8-5
Chapter 8: Troubleshooting
are secure. Turn both machines on again and restart SOFTmax PRO for Lmax.
If an “X” still appears over the icon, it may be that you are using the wrong
type of cable.
Communication #2
Macintosh Computers Having a Single Serial Port
Some Macintosh computers have only a single 8-pin DIN serial port which
serves as both the printer and modem port. Please check to see if your model
is listed as compatible hardware on the SOFTmax PRO for Macintosh Version
System Requirements and Compatible Hardware sheet. If your computer is not
listed, the performance of SOFTmax PRO for Lmax version 3.0 for Macintosh
cannot be guaranteed when using this model.
When running SOFTmax PRO for Lmax, the single serial port Macintosh can
either communicate with the Lmax or print through the single serial port, but
both printer and instrument cannot remain connected to the serial port at the
same time. To avoid uncabling the instrument in order to attach the printer,
you must either print across a network using the ethernet port of the computer, or the instrument and printer can be connected to an A/B switch box
(one 8-pin DIN input port with two 8-pin DIN output ports) available from
MacWarehouse (1/800/255-6227, part number BND0199, Din-8 A/B switch
box). This switch box can then be attached to the single serial port of the computer. The A/B switch of the switch box is used to physically switch the connection between the instrument and the printer. Because of the limitations of
the single serial port Macintosh, the Autoprint feature of SOFTmax PRO for
Lmax cannot be used unless you use the ethernet port of the computer for
printing.
To print from SOFTmax PRO for Lmax for Macintosh using the single serial
port Macintosh, connect to an AppleTalk-compatible printer such as the
Hewlett-Packard DeskWriter C or 550C using an AppleTalk cable connection
and the AppleTalk printer driver. Serial printers such as the Apple StyleWriter
which use an Apple
8-pin DIN to 8-pin DIN peripheral cable and a serial printer driver cannot be
used with SOFTmax PRO for Lmax for Macintosh on a Macintosh with a single serial port.
Configuration for Reading
The computer, SOFTmax PRO for Lmax for Macintosh, and switch box must
be configured as follows in order to establish communication with the Lmax:
AppleTalk Inactive in the Chooser dialog, serial port set to modem in the
SOFTmax PRO for Lmax Preferences dialog, and the switch box set to communicate with the Lmax (to access the Chooser or Preferences dialogs, refer to
“To Switch from Printing to Reading,” below).
Configuration for Printing
The computer, SOFTmax PRO for Lmax for Macintosh, and switch box must
be configured as follows in order to print from SOFTmax PRO for Lmax:
AppleTalk active in the Chooser dialog, serial port set to modem in the SOFTmax PRO for Lmax Preferences dialog, and the switch box set to communicate with the printer (to access the Chooser or Preferences dialogs, refer to “To
Switch from Reading to Printing,” below).
8-6
SOFTmax PRO for Lmax User’s Manual
Chapter 8: Troubleshooting
Connecting to the Switch Box
These instructions are for connecting to the A/B switch box available from
MacWarehouse (800-255-6227, part number BND0199, DIN-8 A/B switch
box).
1) Attach one end of the 8-pin DIN to 8-pin DIN serial cable provided with the
switch box to the single 8-pin DIN serial port of the computer.
2) Attach the other end of the cable to the input port (I/O) of the A/B switch
box.
3) Attach one end of the 8-pin DIN to 8-pin DIN serial cable provided in the
SOFTmax PRO for Lmax software package to one of the two output ports (A
or B) of the A/B switch box.
4) Attach the other end of the cable to the Lmax.
5) Attach one end of the 8-pin DIN to 8-pin DIN AppleTalk cable to the remaining output port of the switch box.
6) Attach the other end of the cable to the AppleTalk printer.
7) Place a note on the top of the switch box indicating the identity of each output
port.
To Switch from Reading to Printing
1) Configure the computer, SOFTmax PRO for Lmax, and the switch box as
described above for reading a microplate.
2) Read the microplate.
3) Set the switch box to communicate with the printer.
4) Quit SOFTmax PRO for Lmax.
5) In the Finder, select Chooser from the Apple menu to bring up the Chooser
dialog.
6) Set AppleTalk to active.
7) In the box on the left side of the Chooser dialog, choose the AppleTalk driver
for the printer. The printer name should appear in the box on the right side of
Chooser dialog.
8) Close the Chooser dialog.
9) Start SOFTmax PRO for Lmax.
10) Print the desired sections.
SOFTmax PRO for Lmax User’s Manual
8-7
Chapter 8: Troubleshooting
To Switch from Printing to Reading
1) Configure the computer, SOFTmax PRO for Lmax, and the switch box as
described above for printing.
2) Print the desired sections.
3) Select Chooser from the Apple menu to bring up the Chooser dialog.
4) Set AppleTalk to Inactive.
5) Set the switch box to communicate with the instrument.
6) Select Preferences from the Edit menu.
7) Without changing any settings, click OK.
8) Read the microplate.
Macintosh Cable Connections
For an Lmax connected to a Macintosh, one end of the cable should end with an
8-pin DIN connector. This connector is small and round and should be connected to either the modem or printer port of the Macintosh.
Printer
Modem
Figure 8.2: 8-Pin Din Connection to Macintosh Computer
If you are connecting the Macintosh to an Lmax, the other end of the cable
should also be an 8-pin DIN connector.
Figure 8.3: 8-Pin DIN to 8-Pin DIN Serial Cable
You should use a double-shielded, straight-through serial cable. If you are
unsure of the quality of the cable you are using, Molecular Devices suggests
that you purchase a cable of known quality and try the connection again.
8-8
SOFTmax PRO for Lmax User’s Manual
Chapter 8: Troubleshooting
PC Cable Connections
The connector required to attach to your PC will depend upon the type of
serial port(s) available on your computer. Typically, at least one 9-pin or 25pin serial port is available on a PC; most have two, which are known as
COM1 and COM2, respectively. The connector for your computer may be a
9pin or 25-pin connector (or you can use an adapter that converts from 9-pins
to 25-pins—see Figure 8.4).
25-pin
9-pin to 25-pin
adapter
25-pin
25-pin
9-pin
Figure 8.4: 25-Pin DIN to 25-Pin or 9-Pin Serial Cable
The cable itself should be a double-shielded, straight-through serial cable. If
you are unsure of the quality of the cable you are using, Molecular Devices
suggests that you purchase a cable of known quality and try the connection
again.
SOFTmax PRO for Lmax User’s Manual
8-9
Chapter 8: Troubleshooting
Display Problems
Symptom
Possible Cause/Solution
A large Group section table
becomes gray or disappears.
You are attempting to display more than 2500 data points in a group.
1) From the View menu, choose Minimize. Delete the large Group
table; then create a new, smaller table.
2) If this does not work, from the View menu, select the large group;
then choose Delete groupname from the Edit menu. Save the file;
close the file; reopen the file.
Checkbox for Plate blank
subtraction in the reduction
dialog box is not visible.
This option is not visible until after data has been collected.
Y-axis units on a graph (either
Well Graph or Graph section)
are repeated.
This can occur when the range on the Y-axis is very small. Increase the
height of the Y-axis.
Text appears “too large” for
wells in plate on Windows
platform.
In the Windows Control Panel, check the settings for Display. Ensure
that you are using “small fonts.”
General display problems in
Windows
Change the video display settings to 16-bit and high color, or better.
Printing Problems
Symptom
Possible Cause/Solution
Text in the header field of the
print dialog box “disappears”
if you press the return or
enter key.
The text is still there but is not visible. It will print. If you click in the
box and drag the mouse to the left, it will reappear.
The Notes section is longer
than one page. The bottom
line of the first page and the
top line of the second page
are partially printed.
Insert a linefeed into the Notes section at the appropriate place.
8-10
SOFTmax PRO for Lmax User’s Manual
Chapter 8: Troubleshooting
General Problems
Insufficient Memory in a Macintosh
If errors occur while using SOFTmax PRO for Lmax for the Macintosh, it may
be that the amount of memory allocated for the program is insufficient. Two
items need to be checked: the amount of memory your Macintosh has available for use, and the amount of memory allocated to SOFTmax PRO for
Lmax.
To see the amount of memory available within the Macintosh, first quit all
open applications, then go to the Finder, and choose About This Macintosh...
from the Apple ( ) menu.
The information box that opens will list the amount of memory used by the
System file and the amount of memory remaining (under the heading, “Largest unused block”) that can be assigned to applications (such as SOFTmax
PRO for Lmax). The amount of memory available should be equal to or
greater than minimum amount required by SOFTmax PRO for Lmax.
Figure 8.5: About This Macintosh Dialog Box
If you open many files simultaneously, or if you open SOFTmax PRO for
Lmax while other applications are open in the background, memory errors
can occur. Also, if you make a kinetic run with a large number of data points,
you may not have enough memory with a typical allocation. SOFTmax PRO
for Lmax requires a minimum of 7223K (over 7 megabytes) of memory to run,
but this is not optimal. The preferred size is 8223K (over 8 megabytes) or
larger. Try increasing the amount of memory allocated to the program. To do
this, quit SOFTmax PRO for Lmax (if it is running). Then highlight the SOFTmax PRO for Lmax program icon (click it once), and then choose Get Info (I)
from the File menu. The dialog box that opens lists suggested and minimum
memory allocations (see Figure 8.6).
SOFTmax PRO for Lmax User’s Manual
8-11
Chapter 8: Troubleshooting
Figure 8.6: SOFTmax PRO for Lmax Info Dialog Box
Enter a larger amount of memory in the box next to “Suggested size”—the
amount you enter may be limited by the total amount of memory available.
The next time you start SOFTmax PRO for Lmax, it will use the larger memory size you have allocated. You may also enter a different number into either
the minimum or preferred size boxes. It is suggested that you do not reduce
the number in the “Minimum size” box (you may increase it, however). The
“Preferred size” can be as large as you wish, depending on the amount of
memory available.
8-12
SOFTmax PRO for Lmax User’s Manual
Appendix A SOFTmax PRO for Lmax Remote
Command Language
Introduction . . . . . . . . . . . . . . . . . . . . . . . . . . . . . . . . . . . . . . . . . . . . . A-3
SOFTmax PRO for Lmax Responses . . . . . . . . . . . . . . . . . . . . . . . . A-3
SOFTmax PRO for Lmax Commands . . . . . . . . . . . . . . . . . . . . . . . A-4
Visual Basic (Excel Macro) Example . . . . . . . . . . . . . . . . . A-7
MFC C++ Interface to SOFTmax PRO for Lmax Remote
Commands that Return Values . . . . . . . . . . . . . . . . . . A-8
Appendix A: SOFTmax PRO for Lmax Remote Command Language
A-2
SOFTmax PRO for Lmax User’s Manual
Appendix A: SOFTmax PRO for Lmax Remote Command Language
Introduction
SOFTmax PRO for Lmax can be controlled by other Windows applications by
means of a simple ASCII string-based messaging system. A command string
such as “Read” or ”SaveAs:myFile” is sent to SOFTmax PRO for Lmax which
then parses and executes the command.
Interprocess communication is implemented by using the Windows SendMessage/PostMessage system. When SOFTmax PRO for Lmax starts up, it
uses RegisterWindowMessage to register a unique message tag. Other applications can retrieve this message tag by using the same mechanism:
smaxMsg=RegisterWindowMessage(“SOFTMaxPROMsg”);
ASCII commands are sent to SOFTmax PRO for Lmax using the WM_SETTEXT
message, a special message used for interprocess Windows messages because
it allows character strings from the address space of one process to be
accessed (read-only) by a process running in another address space.
All messages must be sent to the SOFTmax PRO for Lmax main window. To
get the proper HWND:
hwnd = FindWindow(“SOFTMaxPROMainWnd”, “SOFTmax PRO for Lmax”);
Finally to send the message:
SendMessage(hwnd,WM_SETTEXT,smaxMsg,(LPARAM)myCmd);
Notes:
• The smaxMsg tag MUST be sent as the wParam so that SOFTmax PRO for
Lmax knows this is an external command and not a Windows generated
message.
• The tag and hwnd should be checked for non-zero values before sending
the message.
• Opening and/or closing the Lmax chamber cover must be done manually
and so cannot be automated by means of interprocess messaging.
SOFTmax PRO for Lmax Responses
Most commands that are sent to SOFTmax PRO for Lmax are just that: commands that tell SOFTmax PRO for Lmax to do something. However, a few
SOFTmax PRO for Lmax commands respond with ASCII results. Examples
are “ReturnStatus” and “ReturnData”.
Two response modes are available. In the first mode, SOFTmax PRO for Lmax
responds by putting the requested information on the clipboard. The data can
then be pasted into other applications, such as into Excel spreadsheets. For
many other applications, however, the clipboard mechanism is not appropriate for retrieving data from SOFTmax PRO for Lmax. Because of this, SOFTmax PRO for Lmax can also send the response strings back in a separate
message, using the MFC C++ WinProc. This mechanism is discussed in detail
later in the Appendix.
SOFTmax PRO for Lmax User’s Manual
A-3
Appendix A: SOFTmax PRO for Lmax Remote Command Language
SOFTmax PRO for Lmax Commands
SOFTmax PRO for Lmax commands are single words. If parameters are
required with the command, a colon is used between the command and the
parameters.
Close
Close the current document.
! CAUTION: If the data has not been saved, the document is closed anyway with no user warning.
Copy
This is equivalent to pressing CTRL-C or selecting Copy from the Edit menu.
Notes:
• If a plate section has just been read or is the only selected section, the plate
data will be copied to the clipboard.
• The data copied will follow the display settings for the current plate (normally Raw Data).
• Other sections such as Groups can also be copied. The SelectAll command
should be used first.
ExportAs:XXX
Tell SOFTmax PRO for Lmax to export data in the standard SOFTmax PRO
for Lmax format.
ImportTemplate:XXX
Have SOFTmax PRO for Lmax import a template file. The file should comply
with SOFTmax PRO for Lmax’s template file format. A plate section should
be selected prior to importing a template.
NameCurSection
This (re)names the current selected section. If no section is selected, nothing
happens.
Notes:
• This command is used typically to identify different plates in an automated
environment.
• The data copied will follow the display settings for the current plate (normally Raw Data).
Example:
“NameCurSection:Plate#002345”
A-4
SOFTmax PRO for Lmax User’s Manual
Appendix A: SOFTmax PRO for Lmax Remote Command Language
New
Have SOFTmax PRO for Lmax send a New command. This creates a new document and reads in the values contained in the “Default Protocol.lpr” protocol file.
OpenAssay:XXX
Have SOFTmax PRO for Lmax open a protocol file. The file should be in
SOFTmax PRO for Lmax’s Assays folder which is set using the Assays menu.
Protocols can also be stored in subdirectories of the Assays folder.
Notes:
• Only protocol files can be opened.
• SOFTmax PRO for Lmax will append .lpr to any filename passed in.
• If the file is not found, SOFTmax PRO for Lmax does nothing.
Examples:
“OpenAssay:myFile”
“OpenAssay:\mySubDirectory\myFile”
Read
Select a plate section and send SOFTmax PRO for Lmax a read command.
Notes:
• If more than one plate section exists in the current document, the first
selected plate will be read. If no plate is selected, the first plate after the currently selected section will be read. If nothing is selected, the first plate in
the document will be read (typical case).
• If the plate already has data, the data will be overwritten without confirmation.
• If Autosave is turned on, the document will be saved normally after the
read is complete.
• Pre-reads of plates should not be performed.
ReturnData
This command is used to ask SOFTmax PRO for Lmax to send back the data
from the currently selected plate. Generally this is used to send the data
directly to the caller instead of using the clipboard.
In the Visual Basic or Excel environments, this command functions like the
SOFTmax PRO for Lmax “Copy” command if a plate is the currently selected
section.
ReturnStatus
This command sends back the current instrument status. The status is an
ASCII string that has information about the instrument type and version,
whether the instrument is busy or idle, its current temperature, and the state
of its drawer. The exact format of this response depends on the type of instrument in use.
SOFTmax PRO for Lmax User’s Manual
A-5
Appendix A: SOFTmax PRO for Lmax Remote Command Language
ReturnTiming
This command sends back the number of seconds that it would take to read
the current plate. For multi-plate documents, the plate used is chosen in the
same way as described in the “Read” command above.
SaveAs:XXX
Have SOFTmax PRO for Lmax save the current document file. The file will be
saved in the current SOFTmax PRO for Lmax Autosave directory which is set
in the Preferences dialog accessed through the Edit menu. Data files can also
be saved to subdirectories of the Autosave directory.
Notes:
• SOFTmax PRO for Lmax will append .lda to any filename passed in to it.
• If a file with the same name already exists, SOFTmax PRO for Lmax will
automatically overwrite the file with NO warning.
• If the subdirectory does not exist, the file will not be saved.
Examples:
“SaveAs:myFile”
“SaveAs:\mySubDirectory\myFile”
SelectAll
This is equivalent to pressing CTRL-A or choosing Select All from the Edit
menu. This can be used to select data in group tables for copying (not needed
for copying plate data).
SelectSect
Select a section by name. This can be useful for multi-plate protocols or for
selecting Group tables for copying.
Examples:
“SelectSect:Plate#0023499”
“SelectSect:Group#1”
SelectSectNum
Select a section by its order in the document. This can be useful for multiplate protocols or for selecting Group tables for copying.
Example:
“SelectSectNum:3 ”
SetTemp:XX.X
Send a command to set the current instrument incubator temperature.
Stop
Send SOFTmax PRO for Lmax a command to stop reading. This is equivalent
to pressing the Stop button on the SOFTmax PRO for Lmax tool bar. This
should be sent before any Close or Quit command if there is a possibility that
the instrument is still reading.
A-6
SOFTmax PRO for Lmax User’s Manual
Appendix A: SOFTmax PRO for Lmax Remote Command Language
Quit
Tell SOFTmax PRO for Lmax to close all documents and Quit.
! CAUTION: If the data has not been saved, the application quits anyway
with no user warning.
Visual Basic (Excel Macro) Example
' First some housekeeping code:
Private Declare Function FindWindow Lib “user32” Alias _
“FindWindowA” (ByVal lpClassName As String, _
ByVal lpWindowName As String) As Long
Private Declare Function SendMessage Lib “user32” Alias _
“SendMessageA” (ByVal hWnd As Long, ByVal wMsg As Long, _
ByVal wParam As Long, _
ByVal lParam As String) As Long
Private Declare Function RegisterWindowMessage Lib “user32” Alias _
“RegisterWindowMessageA” (ByVal mgsName As String) As Long
'----------------------------------------------------------------------------Const WM_SETTEXT = 12 ' define a windows message value
Function SendMsgToPRO(ByVal msgStr As String) As Long
hWnd = FindWindow(“SOFTMaxPROMainWnd”, “SOFTmax PRO for Lmax”)
If hWnd = 0 Then ' one beep means Pro is not running.
Beep
Else
' Pro is running so use the SendMessage API
softmaxMsg = RegisterWindowMessage(“SOFTMaxPROMsg”)
If softmaxMsg = 0 Then
' This version of PRO does not understand external msgs
Beep
Beep
Else
SendMessage(hWnd, WM_SETTEXT, softmaxMsg, msgStr)
End If
End If
End Function
'----------------------------------------------------------------------------' This is an example of how to use the above routine
SOFTmax PRO for Lmax User’s Manual
A-7
Appendix A: SOFTmax PRO for Lmax Remote Command Language
Sub SendNewMsgToPRO()
SendMsgToPRO (“New”)
End Sub
MFC C++ Interface to SOFTmax PRO for Lmax Remote Commands that Return Values
Some SOFTmax PRO for Lmax IPC commands return values. By default they
put the data in the clipboard, but optionally they will use the
WM_COPYDATA mechanism to return data directly to the caller.
In order to have the SOFTmax PRO for Lmax response returned in this fashion, the commands must be sent using WM_COPYDATA so that SOFTmax
PRO for Lmax knows what to send the response to.
SOFTmax PRO for Lmax will then reply with another WM_COPYDATA message that contains the response.
MFC Example Code:
long cmdStr;
CString cmdStr;
smaxMsg=RegisterWindowMessage(“SOFTMaxPROMsg”);
cd.dwData=(DWORD)GetSafeHwnd();; // pass our hwnd for return messages
cd.cbData=cmdStr.GetLength()+1; // add one for /0
cd.lpData=cmdStr.GetBuffer(0);
::SendMessage(hwnd,WM_COPYDATA,smaxMsg,(LPARAM)&cd);
Later, SOFTmax PRO for Lmax will reply with a WM_COPYDATA message. To get it in
MFC, create a routine like this:
BOOL XXXXXXX::OnCopyData(CWPropWnd, COPYDATASTRUCT* pCopyDataStruct){
UINTmsgTag;
CString aStr;
msgTag=RegisterWindowMessage(“SOFTMaxPROReplyMsg”); // get tag
if (pCopyDataStruct->dwData==msgTag) {
aStr= pCopyDataStruct->lpData,pCopyDataStruct->cbData);
// do whatever
return(TRUE);
} else {
return(FALSE); // message is for someone else
}
}
A-8
SOFTmax PRO for Lmax User’s Manual
Numerics
4-Parameter (curve fit) 5-39
A
About SOFTmax PRO for Lmax 3-22
Absolute values 5-19
Active 1-11, 3-7, 3-8, 3-9, 3-20, 3-22, 3-23, 3-24, 3-26,
3-30
Alerts 8-3
ANSI Character Set 1-11
AppleTalk 2-3, 8-6, 8-7, 8-8
Area Under Curve 1-11, 4-10, 4-11, 5-19, 5-21
ASCII
Character Set 1-11
file 1-14, 1-15, 2-14, 3-14, 3-22, 3-29
string-based messaging 3-33
Assays
folder 2-15, 3-20, 6-3, 6-4, A-5
menu 2-15, 3-20, 3-28, 6-3, 6-4, A-5
Autoprint 2-15, 3-25, 6-11, 8-6
Preferences setting 2-11
Autosave 1-11, 2-12, 2-14, 3-25, 6-9, 6-10, A-5
Append to File 2-14
Create New File 2-14
directory A-6
file prefix 2-14
Preferences setting 2-11
Autosize (command) 3-16, 3-32, 5-24, 7-22, 7-24
B
Blanking 1-11, 1-21, 4-24, 4-25
blanks in combination 4-26
group-associated blanks 1-11, 4-26
plate blank 1-11, 4-25, 8-10
pre-read plate blank 1-11, 3-27, 4-24
C
Cable connections 2-11, 8-5
Macintosh 2-3, 8-6, 8-8
PC 1-18, 1-20, 2-4, 8-9
Calculation
dialog box 3-12, 3-15, 5-21, 5-27, 5-28
hierarchical 5-16
Checkbox 1-12
Chooser 2-3, 3-23, 6-11, 6-15, 8-6, 8-7, 8-8
Clear
button 4-13, 4-15, 4-20
Clear (command) 1-12, 3-24
Close (command) 3-22, A-6
SOFTmax PRO for Lmax User’s Manual
Column
adding 5-22, 5-26
adding/deleting 3-24, 5-26
Autosize 3-16, 3-32, 5-24, 7-24
copy/paste 6-23
Create (command) 3-31
creating new 3-15
deleting 5-22, 5-27
editing 3-16, 3-31, 5-22, 5-24, 5-25
enlarge 5-24
format 4-17
formulas 5-27
copy/paste 6-23
editing 5-24
modifying 5-25
hiding 3-32, 5-22, 5-23
reference to other 5-26
resizing 5-22, 5-23
showing 3-32
showing formulas 5-22
showing/hiding formulas 3-16
text format 5-28
Communication
instrument icon 2-10
ports—Preferences setting 2-11
problems 8-5
serial port 2-11
Connect Points 5-44
Control menu box (Windows) 1-12
Copy 1-12, 6-21
command 3-24, 6-21
formulas 6-23
Group columns 6-23
Plate data 6-21
template 6-21
Create Column (command) 3-31, 5-26
Create Summary (command) 3-30, 3-31, 5-27, 5-28
Cross-platform files 6-6
Cubic Spline (curve fit) 1-12, 5-42
Curve fit 1-13, 5-34, 5-35
4-Parameter 5-39
Cubic Spline 1-12, 5-42
Exponential 1-14, 5-42
judging a good fit 5-43
Linear 1-16, 5-35
Log-Log 5-37
Log-Logit 1-16, 5-39
minimum number of standards 5-43
Point-to-Point 1-19, 5-41
Quadratic 1-19, 5-38
Semi-Log 1-20, 5-35, 5-36
I-1
Custom formulas 5-46
reduction 5-21
Cut 1-13
Cut (command) 3-24
D
Data
exporting 6-16, 6-20
importing 6-20
Data display 1-13, 4-30, 5-3, 5-4, 5-22, 7-19
Gray Scale 5-9, 5-11
Group section 5-22
limits 5-9
Ranged 5-9, 5-10
reduced number 5-9
Threshold 5-9, 5-10
well graph 4-30, 5-12
Data file 1-13, 5-3, 6-5
locating 6-4
Data points 5-19, 5-43, 5-46, 8-10
one or more points lost 8-4
Data reduction 5-16
calculation, hierarchical 5-16
Default protocol 1-13, 6-3
Delete (command) 3-7, 3-9, 4-14
Delete Section (command) 3-24
Desktop 1-13
Dialog box 1-13
Dilution factor 1-13
Dimmed 1-13
Display
command 3-29
default settings 5-5
dialog box 5-5
options 6-17
parameters 5-3
problems 8-10
reduced number 5-9
Dual Read 1-3, 5-18
display defaults 5-5
Duplicate 6-24
Duplicate (command) 1-14
E
Edit Column (command) 3-31
Edit Summary (command) 3-30, 3-31
End Time 5-19
Endpoint 1-3, 4-9, 5-18
display defaults 5-5
reduction 5-18
Enlarged well graphs 5-12
Error bars 5-34
I-2
Error messages 8-4
pasted text 8-5
Experiment
active 3-7, 3-26
menu 3-26
section 3-7
Exponential (curve fit) 1-14, 5-42
Export 6-20
command 3-22, 6-16
data 6-20
format 2-12
Preferences setting 2-11, 6-16
F
Fast kinetics 1-4
File
autosaving 6-9
creating 6-3, 6-4
cross-platform 6-6
data 6-4, 6-5
management 6-3, 6-4
menu 3-22
protocol 6-4, 6-5
saving 6-9, 7-18
saving manually 6-9
stationery 7-18
Format text 6-13
Formula 5-46
column 5-27
copy 6-23
custom 5-46
custom reduction 5-21
editing 5-24
help 1-7
plot 5-29
summary 5-27
Formula (button) 5-21
G
Glossary of Terms 1-11
Graph 5-28
command 3-29
connect points 5-44
copying 6-21
curve fit 5-34, 5-35
error bars 5-34
formulas 5-29
options 5-44
standard curve 7-29
summary 5-29
Graph menu 3-30
SOFTmax PRO for Lmax User’s Manual
Graph section 3-8, 3-17, 5-28, 5-35
curve fit 5-34, 5-35
menu commands/buttons 3-18
plots 5-35
Graph Settings 3-31
Graph Type (command) 3-30, 5-44
Graphing wells 5-12
Gray Scale display 5-9, 5-11
Group 3-8, 3-15, 7-21
boundaries 4-14
columns 7-22
adding 5-26
copy 6-23
formulas 5-24, 5-27
paste 6-23
customizing 3-8
sample descriptor 4-22
sample name 4-22
series 4-23
Template Editor 4-13
text format 6-13
Group menu 3-31
Group section 5-22
menu commands/buttons 3-15
Group Settings (command) 3-32
Group Settings (dialog box)
assign area 4-21
sample area 4-20
sample descriptor 4-17
Group-associated blanks 1-11, 4-25, 4-26
H
Help 1-7, 1-8
formula 1-7
search function (Windows) 1-9
Hide (command) 3-32, 5-23
Hide Formulas (command) 5-24
Hide Replicates (command) 3-32
Highlight 1-15
I
Icon, instrument 2-10
Importing data 6-20
Incubator (command) 3-27
Incubator button 3-6
Installation 2-7
Instrument settings 3-19, 4-4, 7-6
mode 4-9
summary 4-4
Instrument Setup (command) 3-27
SOFTmax PRO for Lmax User’s Manual
K
Kinetics 4-10, 4-11, 5-18
display defaults 5-5
interval 4-10
limits 5-18
negative OD values 5-18
reduction 5-18, 5-19
run time 4-10
Kinetics limits 5-18
L
Lag Time 5-19
Large Display 1-16
Lid display 3-6
Limits
data display 5-9
MaxRLU 5-18
Linear (curve fit) 1-16, 5-35
Log-Log (curve fit) 5-37
Log-Logit (curve fit) 1-16, 5-39
Long kinetics 1-4
Luminescence 1-17
M
Macintosh
computer 2-5
software 2-7
Mask 5-15
button 5-15
wells 5-15
Mask (command) 3-29, 5-15
Maximize button 1-17
MaxRLU 1-17, 5-18
Memory, insufficient (Macintosh) 8-11
Menu
Assay 3-28
bar 3-4
Experiment 3-26
File 3-22
Graph 3-30
Group 3-31
Notes 3-30
Plate 3-28
View 3-26
Message boxes 8-3
Minimize (command) 3-26
Minimize button 1-17
MinRLU 1-17, 5-19
Modem port 2-11
Molecular Devices Technical Service 8-3
I-3
N
New (command) 3-22, 6-4
New Window (command) 3-30, 3-31, 3-32
Non-Volatile RAM (NVRAM) 1-17, 1-18
Normal Display 1-17
Notes menu 3-30
Notes section 3-8, 3-12, 5-28
text format 6-13
Notes Settings (command) 3-30
NVRAM 1-18
O
Onset Time 4-10, 4-11, 5-20
Open (command) 3-22, 6-6
Option button (radio button) 1-18
P
Page Setup (command) 3-5, 3-23, 5-26
Parallel Port (Windows) 1-18
Partial plate read 4-12
Password protection 3-23, 6-25
changing 6-26
setting 6-26
Paste 1-12, 6-21
command 3-24, 6-21
Group columns 6-23
Plate blanks 1-11, 4-25
Plate menu 3-28
Plate section 3-8, 3-13, 5-4
data display 4-30, 5-4, 7-19
instrument settings
summary 4-4
menu commands/buttons 3-14
reduction options 5-4
Plate Settings (command) 3-29
Plots 5-28, 5-35
command 5-28
Point-to-Point (curve fit) 1-19, 5-41
Port 1-19
Preferences 2-11
command 3-25, 6-9
Pre-read plate blanks 1-11, 4-24, 4-25
Print (command) 3-23, 6-14
Print Section (command) 3-23
Printing 6-11
Autoprint 6-11
options 6-11
problems 8-10
report 6-11, 6-12, 7-31
including/excluding sections 6-12
section 6-11
order 6-12
I-4
setup 6-11
template 6-11
well graph 5-15, 6-11
Protocol file 6-4, 6-5
Default 1-13, 6-3
locating 6-4
saving 7-18
Q
Quadratic (curve fit) 1-19, 5-38
Quit (command) 3-23
R
Radio button (option button) 1-18
RAM (Random Access Memory) 1-19
Ranged display 5-9, 5-10
Read 4-29, 7-19
button 3-6
command 3-27, 4-29
entire plate 4-12
microplate 4-29
mode 4-9
Dual Read 1-3
Endpoint 1-3, 4-9
Fast kinetics 1-4
Long kinetics 1-4
partial plate 4-12
strips 4-12
Recalculate Now (command) 3-25, 5-22
Recalculation options 5-22
Reduced Number (display) 5-9
Reduction 5-4, 5-16
command 3-28
custom formula 5-21
defaults 5-18, 5-19
kinetic 5-19
options 5-4
parameters 5-3
Registration dialog box 2-8
Replicates 4-21
Report 6-12
customizing 6-12
default setting 7-31
printing 6-11, 6-12, 7-31
including/excluding sections 6-12
RLU values, absolute 5-19
S
Sample descriptor 4-17
Save (command) 3-22, 6-5, 6-9, 7-18
Save As (command) 3-22, 6-5, 6-9
Saving files manually 6-9
SOFTmax PRO for Lmax User’s Manual
Scroll 1-20
Scroll bar 3-9
Section 3-8
active 1-11, 3-8, 3-9, 3-20, 3-23, 3-24, 3-26, 3-30
changing order 6-13
creating 3-9
deleting 3-7, 3-9
Graph 3-8, 3-17, 5-28, 5-35
curve fit 5-34, 5-35
options 5-44
plots 5-35
Group 3-8, 3-15, 5-22, 7-21
columns 7-22
customizing 3-8
text format 6-13
inactive 3-8
Notes 3-8, 3-12, 5-28
text format 6-13
opening/closing 3-10
order 6-13
Plate 3-8, 3-13
printing order 6-12
relationship 5-3
Standard Curve 7-29
tool bar 3-9
Select All (command) 3-24
Semi-Log (curve fit) 1-20, 5-35, 5-36
Serial port 1-20, 2-11, 8-5
Series 4-21, 4-23
replicates 4-21
Show All (command) 3-32, 5-23
Show Formulas (command) 3-30, 3-32, 5-24, 5-27, 528
Size box 5-15
Slope 1-20, 5-21
Specifications
Macintosh computer requirements 2-5
Windows-compatible computer 2-6
Standard curve 5-43, 7-29
Standards, minimum number 5-43
Stationery file 7-18
Status bar 3-4, 3-6, 4-29, 4-30
Summary 5-27, 5-28
adding/editing 5-22, 5-27
aligning 5-28
formula 5-27
line up with column 5-28
moving 5-28
plot 5-29
Suspend Recalculation (command) 3-25, 5-22
SOFTmax PRO for Lmax User’s Manual
T
Temperature display 3-6, 3-7
Template 3-8, 4-14
clear 1-12, 6-23
command 3-28
copy/paste 4-27, 6-21
groups 4-13, 4-14
hierarchy 4-14
import/export 6-20
samples 4-14
selecting wells 4-14
series 4-21
fill direction 4-23
Template Editor 3-28, 4-13, 4-14, 7-11
Group area 4-15
tool bar 4-15
Text, format 6-13
Text Style (command) 3-25, 6-13
Threshold display 5-9, 5-10
Time at Half Maximum 1-21, 5-20
Time at Maximum 1-21, 5-20
Time at Minimum 1-21, 5-20
Time to Vmax 4-10, 4-11, 5-20
Title Bar 1-21
Title screen 2-9, 3-3
Tool bar 3-9
Troubleshooting: Technical Services 1-10
U
Undo (command) 1-21, 3-24
Uninstall 2-8
V
Vertical Display 1-21
View menu 3-26
Vmax (kinetic reduction) 5-20
Vmax Points 5-12, 5-20
W
Well graph 5-12, 5-15
printing 5-15, 6-11
Wells
graphing 5-12
masking 5-15
selecting in template 4-14
Window
active 1-11, 3-22, 3-30
Page Setup command 3-5
scroll bar 3-9
size 3-5, 3-10
sizing 5-15
Windows-compatible computer requirements 2-6
I-5
X
X-axis (command) 3-31, 5-46
Y
Y-axis (command) 3-31, 5-46
Z
Zoom box 5-15
I-6
SOFTmax PRO for Lmax User’s Manual