1
US007721262B2
(12) United States Patent
(10) Patent No.:
Reinhardt
(45) Date of Patent:
(54)
SYSTEM, METHODS AND APPARATUS FOR
MARKUP LANGUAGE DEBUGGING
(75)
Inventor.
7,251,809 132*
2002/0120918 A1*
2002/0120919 A1*
Holger Reinhardt BerhMDE)
’
Corporation, Armonk, NY (US)
Notice:
Subject to any disclaimer, the term of this
patent is extended or adjusted under 35
May 18, 2010
7/2007 Barclay e181. ............ .. 717/128
8/2002 AiZenbud-Reshefetal. 717/127
8/2002 AiZenbud-Reshefet al. 717/127
2003/0056198 A1*
3/2003 Al-AZZaWe etal.
717/127
2003/0070030 A1*
4/2003
710/309
2003/0196192 A1 *
2004/0199526 A1 *
(73) Assignee: International Business Machines
(*)
US 7,721,262 B2
Smith et a1. ......... ..
10/2003 Barclay et a1.
10/2004 Nishikawa et a1.
2006/0031466 A1 *
2/2006
2006/0265689 A1 *
11/2006
Kovach
717/128
707/100
............. ..
709/224
Kuznetsov et a1. ........ .. 717/117
* Cited by examiner
U.S.C. 154(b) by 1142 days.
Primary ExamineriWei Y Zhen
Assistant ExamineriYuntao Guo
(74) Attorney, Agent, or Firm4Chapin IP Law, LLC
(21) APP1~ NOJ 11/346-1135
(22) F1 d
F b 2 2006
1e
:
e
(65)
.
,
(57)
Prior Publication Data
US 2006/0259898 A1
Nov, 163 2006
A system, apparatus and method process data by identifying
a processing pipeline de?ning a series of markup language
processing steps. The system inserts at least one debugging
Related US. Application Data
(60)
(51)
ABSTRACT
step into the processing pipeline. The debugging step(s)
Provlslonal apphcanon NO' 60/649’189’ ?led on Feb'
2’ 2005'
Int CL
G06F 9/44
(200601)
de?ne processing to collect debug data associated With appli
cation of the markup language processing steps to markup
language data to be processed by the processing pipeline. The
system executes the series of markup language processing
steps, including the debugging step(s), upon input markup
(2;)
( )
Cl}
.... ... ....
.....
.................. ..
1e 0 1, a?“ glatlqon earcl """"
See app lcanon e or Comp ete Seam
(56)
language data as a transaction‘ Execution of the debugging
"
lstory'
step(s) captures the debug data for at least one of the series of
markup language processing steps in the processing pipeline.
References Cited
The debug data alloWs analysis of operation of the markup
language processing steps of the processing pipeline on the
input markup language dam
US. PATENT DOCUMENTS
6,748,583 B2 *
6/2004 AiZenbud-Reshef et al. 717/127
6,817,010 B2 * 11/2004 AiZenbud-Reshef et a1. 7 17/ 127
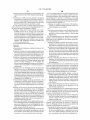
23 Claims, 6 Drawing Sheets
I
u
\1o8
103 104
V
m COMPUTERIZED DEVICE
50 DEBUG CONTROLLER
105-1
105.2
+
m
185-1
185-2
COMM.
PIPE.
PIPE.
|NT_
STEP
STEP
105-m
1B5-N
Q Q Q
TO NETWORK
PIPE.
-> (OR OTHER
STEP
PROCESS)
+
V
E
->
TRIGGER
EVENTS
V
22
—>
TRIGGER
m DEBUG
EVENT
DETECTOR
DATA
2Q
‘ CONTROL
101
NETWORK
SERVICE
US. Patent
May 18, 2010
Sheet 1 of6
US 7,721,262 B2
? Configure XML Firewall Service
401
/
"‘
1 7O \
G)
Main
,,
Prube
XML
. .. Firewall
_
Service
[fhgél? [ Cancel 1 5 [325114111 3 [ Llieul Lug ] [
View objem status‘
I Multistep Probe
Q on Q) off I
402
Q'Transaction riisml'ur
25
K’‘_403
mg
Y
1
1m
COMPUTER SYSTEM
l/O INTERFACE
111\
12.
m
MEMORY
PROCESSOR
140-1
MARKUP
APPLICATION
140-1 MARKUP
PROCESS
@ DEBUG
?g DEBUG
PROCESS
PROCESS
116
1013
DATABASE
E
4
COMM. INTERFACE
I
I
FIG. 1
I
210
US. Patent
May 18, 2010
Sheet 3 of6
US 7,721,262 B2
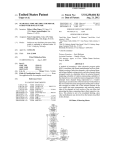
200
IDENTIFY A PROCESSING PIPELINE DEFINING A SERIES OF MARKUP LANGUAGE
PROCESSING STEPS
201
INSERT AT LEAST ONE DEBUGGING STEP INTO THE PROCESSING PIPELINE, THE AT
LEAST ONE DEBUGGING STEP DEFINING PROCESSING TO COLLECT DEBUG DATA
ASSOCIATED WITH APPLICATION OF THE MARKUP LANGUAGE PROCESSING STEPS
TO MARKUP LANGUAGE DATA TO BE PROCESSED BY THE PROCESSING PIPELINE
202
EXECUTE THE SERIES OF MARKUP LANGUAGE PROCESSING STEPS, INCLUDING THE
AT LEAST ONE DEBUGGING STEP, UPON INPUT MARKUP LANGUAGE DATA AS A
TRANSACTION, EXECUTION OF THE AT LEAST ONE DEBUGGING STEP CAPTURING
THE DEBUG DATA FOR AT LEAST ONE OF THE SERIES OF MARKUP LANGUAGE
PROCESSING STEPS IN THE PROCESSING PIPELINE, THE DEBUG DATA ALLOWING
ANALYSIS OF OPERATION OF THE MARKUP LANGUAGE PROCESSING STEPS OF THE
PROCESSING PIPELINE ON THE INPUT MARKUP LANGUAGE DATA
FIG. 3
US. Patent
May 18, 2010
Sheet 4 of6
US 7,721,262 B2
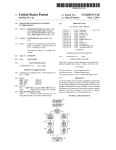
300
IDENTIFY A PROCESSING PIPELINE DEFINING A SERIES OF MARKUP LANGUAGE
PROCESSING STEPS
301
RENDER, VIAA GRAPHICAL USER INTERFACE, AN SELECT ION OF MARKUP
LANGUAGE PROCESSING SERVICES FOR WHICH DEBUGGING CAN BE
ENABLED
I
302
RECEIVE A SELECTION OF A MARKUP LANGUAGE PROCESSING SERVICE FOR
WHICH DEBUGGING IS TO BE ENABLED, THE SELECTED MARKUP LANGUAGE
PROCESSING SERVICE DEFINING A RESPECTIVE PROCESSING PIPELINE OF
MARKUP LANGUAGE PROCESSING STEPS
I
303
RECEIVE A TRANSACTION HISTORY COUNT IDENTIFYING A NUMBER OF
TRANSACTIONS FOR WHICH TO COLLECT DEBUG DATA FROM APPLICATION
OF THE PROCESSING PIPELINE TO INPUT MARKUP LANGUAGE DATA
TO STEP 304
FIG. 4
US. Patent
May 18, 2010
Sheet 5 of6
US 7,721,262 B2
FROM STEP 303
I
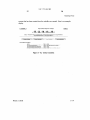
304
INSERT AT LEAST ONE DEBUGGING STEP INTO THE PROCESSING PIPELINE, THE AT LEAST
ONE DEBUGGING STEP DEFINING PROCESSING TO COLLECT DEBUG DATA ASSOCIATED
WITH APPLICATION OF THE MARKUP LANGUAGE PROCESSING STEPS TO MARKUP
LANGUAGE DATA TO BE PROCESSED BY THE PROCESSING PIPELINE
305
IDENTIFY A CONFIGURATION ASSOCIATED WITH THE SELECTED MARKUP LANGUAGE
PROCESSING SERVICE FOR WHICH DEBUGGING IS TO BE ENABLED
306
FOR EACH MARKUP LANGUAGE PROCESSING STEP DEFINED IN THE
CONFIGURATION, INSERT A DEBUG STEP INTO THE CONFIGURATION, THE
DEBUG STEP CAPTURING A SNAPSHOT OF DEBUG DATA ASSOCIATED WITH
THAT MARKUP LANGUAGE PROCESSING STEP
307
INSERT A FIRST DEBUG STEP BEFORE THE FIRST STEP IN THE
CONFIGURATION, THE FIRST DEBUG STEP, UPON EXECUTION, CAPTURING
A SNAPSHOT OF INPUT DATA ASSOCIATED WITH THE FIRST STEP
I
308
INSERT A SUCCESSIVE DEBUG STEP AFTER EACH SUCCESSIVE STEP IN THE
SERIES OF STEPS DEFINED IN THE CONFIGURATION OTHER THAN THE LAST
STEP, EACH SUCCESSIVE DEBUG STEP, UPON EXECUTION, CAPTURING A
SNAP SHOT OF OUTPUT DATA PROCESSED BY THE FORMER STEP IN THE
CONFIGURATION, AND CAPTURING A SNAPSHOT OF INPUT DATA
ASSOCIATED WITH THE NEXT STEP IN THE CONFIGURATION
I
309
INSERT A FINAL DEBUG STEP AFTER THE LAST STEP IN THE
CONFIGURATION, THE FINAL DEBUG STEP, UPON EXECUTION, CAPTURING
A SNAP SHOT OF OUTPUT DATA PROCESSED BY THE LAST STEP IN THE
CONFIGURATION
TO STEP 310
5
US. Patent
May 18, 2010
Sheet 6 of6
US 7,721,262 B2
FROM STEP 309
V
31 O
EXECUTE THE SERIES OF MARKUP LANGUAGE PROCESSING STEPS, INCLUDING THE AT LEAST
ONE DEBUGGING STEP, UPON INPUT MARKUP LANGUAGE DATA AS A TRANSACTION,
EXECUTION OF THE AT LEAST ONE DEBUGGING STEP CAPTURING THE DEBUG DATA FOR AT
LEAST ONE OF THE SERIES OF MARKUP LANGUAGE PROCESSING STEPS IN THE PROCESSING
PIPELINE, THE DEBUG DATA ALLOWING ANALYSIS OF OPERATION OF THE MARKUP LANGUAGE
PROCESSING STEPS OF THE PROCESSING PIPELINE ON THE INPUT MARKUP LANGUAGE DATA
311
RECEIVE AN IDENTIFICATION OF A TRIGGER EVENT THAT INDICATES A CONDITION UPON
WHICH TO SAVE DEBUG DATA ASSOCIATED WITH A TRANSACTION
V
312
RECEIVE INPUT MARKUP LANGUAGE DATA AS A TRANSACTION
V
313
APPLY THE PROCESSING PIPELINE DEFINING A SERIES OF MARKUP LANGUAGE
PROCESSING STEPS TO THE INPUT MARKUP LANGUAGE DATA, APPLICATION OF THE
PROCESSING PIPELINE INCLUDING OPERATING THE FIRST DEBUG STEP, EACH SUCCESSIVE
DEBUG STEP, AND THE FINAL DEBUG STEP TO CAPTURE INPUT AND OUTPUT DATA AS
DEBUG DATA FOR EACH STEP
314
INSERT THE FIRST DEBUG STEP, EACH SUCCESSIVE DEBUG STEP, AND THE FINAL DEBUG
STEP INTO THE PROCESSING PIPELINE IN REAL-TIME, DURING EXECUTING THE SERIES OF
MARKUP LANGUAGE PROCESSING STEPS
V
1
DURING EXECUTION OF AT LEAST ONE5 05F THE DEBUGGING STEPS, ENGAGE A
MESSAGING PROTOCOL TO TRANSFER AT LEAST A PORTION OF THE DEBUG DATA TO A
CONTROL SERVICE AND HALTING EXECUTION OF THE DEBUG STEP, AND THE
TRANSACTION, UNTIL THE CONTROL SERVICE INDICATES, VIA THE MESSAGING
PROTOCOL, THAT THE HALTED DEBUG STEP CAN PROCEED TO ALLOW THE
TRANSACTION TO CONTINUE PROCESSING
V
316
DETECT THE TRIGGER EVENT DURING PROCESSING OF A TRANSACTION AND IN
RESPONSE, INDICATING THAT THE DEBUG DATA COLLECTED FROM EXECUTION OF THE
DEBUG STEPS ASSOCIATED WITH THE TRANSACTION IS TO BE POST-PROCESSED AND
NOT DISCARDED
V
317
STORE DEBUG DATA FOR EACH STEP COLLECTIVELY AS A DEBUG RECORD ASSOCIATED
WITH THE TRANSACTION FOR THE INPUT MARKUP LANGUAGE DATA
AND / OR
318
USE A MESSAGING PROTOCOL TO TRANSFER THE DEBUG DATA TO AN EXTERNAL
SERVER FOR POST-PROCESSING
FIG. 6
US 7,72l,262 B2
1
2
SYSTEM, METHODS AND APPARATUS FOR
MARKUP LANGUAGE DEBUGGING
access to the encoded data. In addition, other XML-related
technologies such as XPath and the eXtensible Stylesheet
Transformation Language (XSLT) alloW a developer of an
XML-aWare softWare application to de?ne transformations
CROSS REFERENCE TO RELATED
APPLICATIONS
of XML encoded data from one data format to another. Exten
sible Stylesheet Transformations @(SLT) is a language origi
nally intended for converting, or transforming, documents
Written in XML into other formats, including HTML and
This application claims the bene?t of the ?ling date of US.
Provisional patent application No. 60/649,189, entitled
“MULTISTEP PROBE DEBUGGER” ?led Feb. 2, 2005, that
other XML vocabularies. XSLT uses an XSL document to
transform an XML document from one format to another. A
shares co-inventorship and co-pendancy herewith. The entire
teachings, ?gures and contents of this pending Provisional
application are hereby incorporated by reference herein.
schema is a description in a meta-language specifying the
acceptable syntax or structure of an XML document. A
schema document is used to validate an XML document and
BACKGROUND OF THE INVENTION
guarantee that its syntax is correct. Several schema languages
exist. A ?lter is one or more XPath expressions (Which may
optionally be contained in an XSLT document or other con
trol structure) used to extract data from an XML document.
This data can be used to produce a decision on the accept
Computer systems and computerized devices operate soft
Ware programs that exchange data in a variety of different
data formats. As an example, conventional computer pro
grams can format messages and data in a markup language
data format such as the eXtensible Markup Language (XML)
20
data format that encodes data in a platform independent man
ner to alloW different computer systems to share the XML
veri?es the input document based on semantic or other con
tent (transformed or not transformed) not typically related to
syntax, and so differs from a schema validation in this Way.
encoded data. The softWare industry commonly refers to data
encoded in the XML data format as an XML document.
SoftWare developers have created many different programs
that are capable of performing a various processing opera
ability of the input XML document based on an arbitrary set
of criteria as expressed in the query expressions. A ?lter
An XSLT document can be used to transform an XML
25
tions on XML documents. XML is a text-based language that
document, and also to schema validate the XML document at
the same time using a schema speci?ed in the XML document
(or other out-of-band mechanism). As an example, a devel
requires signi?cant processing resources to encode and
oper that creates an XML-aWare application (e.g., for use on
decode and otherWise process the data since XML is not in a
native machine or processor format.
As an example of conventional XML processing, in a con
ventional Web services architecture, a server computer sys
tem can provide access to processing functionality using a
Web services interface that is de?ned in a machine-readable
a Web services server platform) can create an XSLT transfor
interface description, such as Web Services Description Lan
guage (WSDL). A particular service expressed or described
in WSDL can provide some prede?ned and speci?c process
30
apply such an XSLT transformation to the XML-encoded
data to convert this data, for example, from XML to HTML
35
ing functionality. Other computer systems (e.g., other serv
ers) that Want to access Web service functionality can discover
and invoke the Web service offered by the Web services server
mation to convert XML encoded data to HTML encoded data.
A Web server process that receives XML encoded data can
and the server can return this data to the client thus alloWing
the client broWser to render the XML-encoded data as HTML
Within a Web broWser.
If data security is a concern When performing transactions
of XML encoded data betWeen computer systems, conven
tional standards and common practices have emerged to alloW
40
a Web server to use some of the above XML processing tools
by submitting requests for the service to the Web services
(e.g., DOM, SAX, etc.) to perform XML processing such as
server using XML data encoded in a remote method invoca
digital signature validation, encryption, and decryption upon
tion protocol such as the Simple Object Access Protocol
(SOAP). A requesting computer system can transfer XML/
XML encoded data. Other data messages, such as email mes
SOAP requests to the Web services server providing the Web
sages, can be encoded in XML and softWare developers have
45
to parse and process XML encoded email. Generally then,
there are a variety of different processing operations that
service over HTTP (or over secure HTTP, knoWn as HTTPS).
When a server receives an invocation of a Web service via an
XML message or stream of messages encoded using SOAP/
HTTP, the Web services server decodes and processes the
XML encoded data, performs the Web service processing
(i.e., the application processing) on the decoded data, and can
softWare programs can apply to XML encoded data.
50
BRIEF SUMMARY OF THE INVENTION
Conventional mechanisms and techniques for the develop
formulate an XML/SOAP/HTTP response. The server then
returns the response to the requesting computer system (i.e.,
ment of softWare programs or hardWare devices that process
a client or another server) in XML format via HTTP. The
XML/SOAP/HTTP Web services computing paradigm thus
created XML-based email message processing applications
55
XML data suffer from a de?ciency in that such conventional
systems do not provide an ef?cient method, mechanism or
alloWs distributed computing servers to share processing
functionality With other computers, such as other servers
tool to debug processing operations or steps performed on
XML data. In particular, processing operations performed on
and/ or clients, using XML encoded data.
XML data tend to be step-by-step operations. As an example,
Conventional XML processing technologies embedded
Within a Web server alloW the Web server to interpret and
an XML/ SOAP message may include a SOAP header, an
60
process the XML-encoded data in a variety of Ways. Several
conventional XML technologies alloW a softWare application
To process such an incoming XML/ SOAP message, an XML
processing device or softWare program may have to perform
various processing steps such as SOAP header validation,
to access (e.g., extract) XML-encoded data for application
processing purposes. As an example, a server can use XML
softWare processing technologies such as the Document
Object Model (DOM) or Simple Application programming
interface for XML (SAX) to parse XML documents to gain
XML encoded digital signature, and a SOAP message body.
65
XML signature validation, and SOAP message body extrac
tion. Each of these steps typically receives some input, per
forms some focused processing on this input, and produces
some output. During development of XML processing soft
US 7,721,262 B2
3
4
ware (or hardware or ?rmware to perform such processing),
conventional debuggers do not exist to allow the developer to
control execution of the XML processing in a step-by-step
manner. Additionally, no conventional debugger tool exists to
The debug data allows analysis of operation of the markup
language processing steps of the processing pipeline on the
allow the developer to inspect the inputs and outputs of each
processing step in an XML processing pipeline. As an
computerized device, network device, workstation, handheld
input markup language data.
Other embodiments of the invention include any type of
example, embodiments disclosed herein are based in part on
the observation that it would be bene?cial to, for example, run
or laptop computer, or the like con?gured with software and/
or circuitry (e.g., a processor) to process any or all of the
operations disclosed herein. In other words, a computerized
a stylesheet that captures all input/output contexts of process
device or a dedicated XML processor or network device that
ing steps and makes them available for developer inspection,
but no conventional debugger exists providing this capability.
is programmed or con?gured to operate as explained herein is
considered an embodiment of the invention.
Other embodiments of the invention that are disclosed
Embodiments disclosed herein signi?cantly overcome
such de?ciencies and provide mechanisms and techniques to
“mix in” additional processing steps into user-speci?ed mul
tistep rules related to XML processing systems via a markup
language debugger. As an example, using the system dis
closed herein, a developer is able to provide debug steps for a
markup language processing pipeline that operate to:
Run a (set of) stylesheets before other processing;
Run a (set of) stylesheets after all other processing;
Run a (set of) stylesheets between processing steps.
20
As a more speci?c example, the system disclosed herein
structures) arranged or encoded on a computer readable
provides the addition of WSDM-style monitoring by operat
ing debug steps before and after application of WSDM pro
cessing pipeline steps to collect statistics and send debug data
herein include software programs to perform the steps and
operations summarized above and disclosed in detail below.
One such embodiment comprises a computer program prod
uct that has a computer-readable medium including computer
program logic encoded thereon that, when performed in a
computerized device having a coupling of a memory and a
processor and a display, programs the processor to perform
the operations disclosed herein. Such arrangements are typi
cally provided as software, code and/ or other data (e.g., data
medium such as an optical medium (e.g., CD-ROM), ?oppy
or hard disk or other a medium such as ?rmware or microcode
25 in one or more ROM or RAM or PROM chips or as an
to a management station (and external post-processing ser
Application Speci?c Integrated Circuit (ASIC). The software
vice). The system allows the user to inject the debug steps
or ?rmware or other such con?gurations can be installed onto
between processing steps of a processing pipeline con?gured
a computerized device to cause the computerized device to
within an XML processing system.
perform the techniques explained herein.
Conventional techniques for analysis and examination of
30
XML or other markup language transaction processing cur
rently provide a poor solution by explicitly requiring devel
opers to hard-code custom rules for processing XML trans
actions to view associated or related data. This is cumbersome
to encode and often results in debug data appearing in a user
35
data. Additionally, such conventional debugging techniques
that require manual modi?cation to the processing pipeline
could easily cause errors. As an example, if a user deletes the
“pre” processing, but doesn’t remove the “post” processing,
errors may result.
40
In contrast, the technology disclosed herein provides a
multistep probe debugger that provides an IDE-like interface
45
50
analyze the data in real-time (i.e. during each step of pipeline
execution) before the others steps in the pipeline operate.
More speci?cally, embodiments disclosed herein provide
55
series of markup language processing steps. The debug pro
60
accordance with one example embodiment.
FIG. 2 is an example architecture of a debug process in
accordance with one example con?guration.
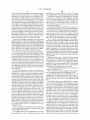
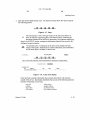
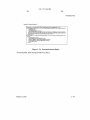
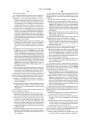
FIG. 3 is a ?ow chart of high level processing steps that the
rations disclosed herein.
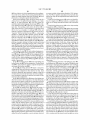
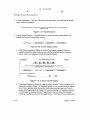
FIGS. 4 through 6 are a ?ow chart of processing steps that
a debug process performs to collect debug data from a markup
language processing pipeline in accordance with example
con?gurations.
process executes the series of markup language processing
steps, including the debugging step(s), upon input markup
markup language processing steps in the processing pipeline.
invention.
FIG. 1 is a block diagram of a computerized device con
debug process performs in accordance with example con?gu
of the markup language processing steps to markup language
data to be processed by the processing pipeline. The debug
language data as a transaction. Execution of the debugging
step(s) captures the debug data for at least one of the series of
sarily to scale, with emphasis instead being placed upon
illustrating the embodiments, principles and concepts of the
?gured with a markup application and debug process in
cess inserts at least one debug (or debugging) step into the
processing pipeline. The at least one debugging step de?nes
processing to collect debug data associated with application
particular description of embodiments of the invention, as
illustrated in the accompanying drawings and ?gures in
which like reference characters refer to the same parts
throughout the different views. The drawings are not neces
pleted, or the pipeline processing can be suspended in real
methods and apparatus and systems for processing data that
include a debug process. One con?guration, the debug-pro
cess operates by identifying a processing pipeline de?ning a
BRIEF DESCRIPTION OF THE SEVERAL
VIEWS OF THE DRAWINGS
of the invention will be apparent from the following more
collect and analyze the data after the transaction has com
time in (i.e., after) each step and a user or other processing can
operating in a device for markup language processing.
Example embodiments of the invention may be implemented
within products and/or software applications manufactured
by International Business Machines Corporation (IBM) of
Armonk, N.Y., USA.
The foregoing and other objects, features and advantages
to an xml?rewall/stylepolicy. In one con?guration, the
debugger operates by analyzing a con?gured sequence of
transformations (i.e. an XML pipeline of processing steps)
and inserting probes or debug steps into the sequence to
collect input, processing, and output data. The debug steps
It is to be understoodthat the system of the invention can be
embodied strictly as a software program, as software and
hardware, or as hardware alone such as within a processor, or
within an operating system or a within a software application
DETAILED DESCRIPTION OF THE INVENTION
65
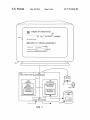
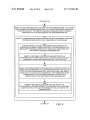
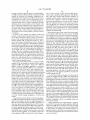
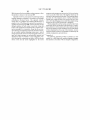
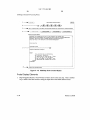
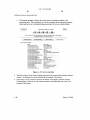
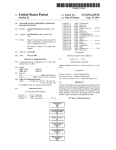
FIG. 1 is a block diagram illustrating example architecture
of a computerized device or system 110 that executes, runs,
US 7,721,262 B2
5
6
interprets, operates or otherwise performs a markup applica
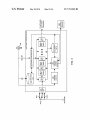
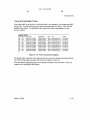
line to receive, as input, an XML document 105, and in a
tion 140 and process 141 that include a debug process 150
series of steps. The pipeline 251 progresses in steps 185 from
operable in accordance With example con?gurations dis
left to right and i) performs XML document validation; ii)
closed herein. The computer system 110 may be any type of
identi?es an XML signature Within the document; iii) vali
dates the XML signature; iv) removes the XML signature
from the document 105; and v) forWards the XML document
105 (after signature removal) to a post processing service.
The user 108 may have selected this particular processing
computerized device such as a data communications or net
Work device (eg sWitch, router, or dedicated markup lan
guage processing device), computer, Workstation, portable
computing device, console, laptop, netWork terminal or the
like. In a preferred con?guration, the computerized device
pipeline 251 for operation by activation of a markup language
processing service available from the markup application
110 is a dedicated netWork-based markup language process
ing device that processes markup language documents as
transactions, such as XML documents, to o?load XML pro
140, such as an XML ?reWall service, via interaction With the
graphical user interface 170.
cessing from servers or other computer systems in a netWork
environment.
During activation of this XML ?reWall service, the graphi
cal user interface 170 alloWs the user to activate the debug
As shoWn in this example, the computer system 110
process 150 to Work in conjunction With the processing pipe
line con?guration for that service. Activation of the debug
process 150 alloWs the debug process 150 to insert debugging
steps into the processing pipeline that are executed during a
includes an interconnection mechanism 111 such as a data
bus or other circuitry that couples a memory system 112, a
processor 113, an input/output interface 114, and a commu
nications interface 115. An input device 116 (e.g., one or
more user/developer controlled devices such as a keyboard,
20
mouse, etc.) couples to processor 113 through I/O interface
capturing all of transaction data related to application of steps
114 and enables a user 108 such as a netWork administrator to
in the processing pipeline to the input transaction markup
provide input commands and generally control the graphical
user interface 170 that the markup application 140 provides
on the display 130. Also in this example con?guration, a
database 125 stores con?guration and debug data 210 in
25
puter readable medium. The communications interface 115
enables the computer system 110 to communicate With other
cation by remote computer systems.
35
herein. The markup application 140-1 may be embodied as
softWare code such as data and/or logic instructions (e.g.,
code stored in the memory or on another computer readable
40
functionality according to different embodiments described
herein. During operation of the computer system 110, the
(such as a ?oppy disk), hard disk, electronic, magnetic, opti
50
cation 140-1 may also be stored in a memory system 112 such
as in ?rmWare, read only memory (ROM), or, as in this
55
example, as executable code in, for example, Random Access
Memory (RAM). In addition to these embodiments, it should
also be noted that other embodiments herein include the
execution of the markup application 140-1 in the processor
113 as the markup process 140-2 including the debug process
computerized device 110 at runtime. The debug process 150
is included in this processing and operates as explained herein
150. Those skilled in the art Will understand that the computer
system 110 may include other processes and/or softWare and
hardWare components, such as an operating system not
manner.
According to the general operation of the markup applica
60
transaction against a processing pipeline (see FIG. 2) con?g
ured Within the markup application 140. During application
of markup language processing operations Within the pro
shoWn in this example.
A display 130 need not be coupled directly to computer
system 110. For example, the markup application 140-1 and
debug process 150 can be executed on a remotely accessible
computerized netWork device via the netWork interface 115.
In this instance, the graphical user interface 170 may be
cessing pipeline, the debug process 150 is able to insert addi
tional debug steps to perform debug operations associated
performing logic instructions and/or data). The markup appli
cal or other computer readable medium. The markup appli
ing or executing Within or upon the processor 113 in the
tion 140 and debug process 150, the computer system 110 is
able to process input in the form of markup language data
105. The input markup language data 105 is processed as a
markup language data 105.
cation 140-1 may be stored on a computer readable medium
application 140-1 (or the entire application 140-1) perform
to provide markup language debugging in a step-by-step
Depending upon the con?guration, the debug process 150 can
either insert the debug steps 187 before application of the
processing pipeline or can insert such steps in real-time,
during invocation of the pipeline steps 187 on a transaction of
debug process 150 (i.e., in the form of un-executed or non
45
cation 140-1. Execution of markup application 140-1 in this
manner produces processing functionality in a markup pro
cess 140-2 that includes the processing of the debugger pro
cess 150. In other Words, the markup process 140-2 represents
one or more portions or runtime instances of the markup
by the markup application 140 as that markup application
operates against markup language data (or other data such as
binary data encoded Within the markup language data).
It is noted that example con?gurations disclosed herein
include the markup application 140-1 itself including the
processor 113 accesses the memory system 112 via the inter
connect 111 in order to launch, run, execute, interpret or
otherWise perform the logic instructions of the markup appli
step by step manner, speci?c processing applied Within each
step of the processing pipeline. Each debug step can capture,
for example, system variables, input data, output data and
other data related to each of the processing steps performed
supports functional debugging operations as explained
medium such as a removable disk) that supports processing
supplement the processing pipeline With additional debug
after the last step) in order to alloW a user 108 to examine, a
30
Work (not shoWn). This can alloW access to the markup appli
The memory system 112 is any type of computer readable
medium and in this example is encoded With the markup
application 140-1 that includes a debug process 150 that
language data 105. The debug process 150, as Will be
explained more fully herein, is thus able to augment or
steps inserted in betWeen each of the regular processing pipe
line steps (e.g., before the ?rst step, in betWeen each step, and
accordance With techniques described herein Within a com
devices (i.e., other netWork devices or computer) on a net
transaction (i.e., during application of steps in the processing
pipeline to XML input data 105). Each debug step alloWs
With the processing pipeline. As an example, suppose the
displayed locally to a user of the remote computer and execu
tion of the processing herein may be client-server based or
markup application 140 is con?gured With a processing pipe
remotely controlled.
65
US 7,72l,262 B2
7
8
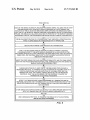
FIG. 2 illustrates an example architecture of the debug
process 150 as it interacts With an example markup language
pipeline step 185. The user can then alloW execution of the
pipeline to continue, step by step, and can vieW the processing
processing pipeline 251. In this example, the debug process
applied at each step 185 upon occurrence of the next debug
150 includes the debug controller 250, trigger events 255, a
step 187 (that debug step halting execution of the pipeline and
trigger event detector 257, and a control service 259. Gener
ally, the user 108 interacts 291 With the computeriZed device
110 to select a service con?guration 171 from a plurality of
engaging a messaging protocol 192 to transfer the debug data
210 to a the control server 259 (or to the debug controller 250)
alloWing the user to have step-by-step control.
available markup language processing services 170 operable
Further details of processing in accordance With example
Within the computeriZed device to process markup language
input data 105. Depending upon the selected service con?gu
ration 171, the markup application 140 Will instantiate or
apply the processing pipeline 251 that includes a number of
embodiments Will noW be explained With respect to the How
charts of processing steps that folloW.
FIG. 3 is a How chart of processing steps that a con?gura
tion of the debug process 150 operating in the markup appli
cation 140 performs to process markup language data 105 is
markup language processing steps 185 selected and arranged
service con?guration 171. Each markup language processing
a transaction Within the processing pipeline 251.
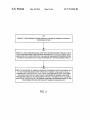
In step 200, the debug process 150 identi?es a processing
step 185 that is part of the processing pipeline 251 performs a
pipeline de?ning a series of markup language processing
in sequence, from left to right, according to the selected
speci?c operation on one or more portions of the input
steps 185. Identi?cation of the processing pipeline can take
markup language data 105. The collective set of steps 185
provides the selected service chosen by the user 108. Note
that there may be several different pipeline con?gurations
251 for a single service, and a particular pipeline (i.e. a
place When the user 108 selects a particular service to activate
Within the computer system 110 in order to apply the service
20
con?guration 171 associated With the user selected service to
input markup language data 105 as it passes through the
computer system 110.
particular arrangement of steps 185) may be chosen by the
markup application 140 based on certain criteria of the input
markup language data 105 during runtime. In each case hoW
In step 201, the debug process 150 inserts at least one
markup language data 105 and this sequence is referred to
debugging step into the processing pipeline 251. The debug
ging step(s) 187 de?ne processing to collect debug data 210
(eg next step input and previous step output and system
herein as the pipeline 251. Upon selection of a service con
variables and execution trace information) associated With
ever, some sequence of steps 185 are applied to the input
25
application of the markup language processing steps 185 to
?guration 171, the user 108 activates the debug controller 250
in order to insert debug steps 187 in betWeen the markup
language processing steps 185 Within the processing pipeline
30
251. The debug controller 250 can insert the debug steps 187
either in real-time during operation of the processing pipeline
steps 185 or during instantiation of the processing pipeline
251 in the computerized device 110.
Each debug step 187 operates to capture debug data 210 for
analysis by either the debug controller 250 or a remotely
located control service 259. Accordingly, upon receipt of
markup language processing steps 185, including the debug
35
guage processing steps 185 in the processing pipeline 251.
The debug data 210 alloWs analysis of operation of the
40
the input data 105. In betWeen each pipeline step 187 (or
before the ?rst, betWeen each middle step 185, and after the
last pipeline step), each debug step 187 captures a set of debug
formed as part of step 202 in real-time.
As an example, a debug step 187 betWeen tWo markup
45
captures input to the next markup language processing step.
conditions that must be met in order to save or store the debug
50
As an example, each debug step 187 can capture step context
including all or a part of an XML document 105, portions of
a parsed XML tree, a binary data block, an attachment (e. g. a
mime attachment) to the message 105, stylesheet parameters,
In other Words, the user 108 can de?ne speci?c trigger events
255 that the triggered event detector 257 must identify as
existing in order for the debug data 210 to be saved or pro
cessed for analysis of application of one of the processing
pipeline steps 185. In one con?guration then, the debug steps
language pipeline steps 185 captures output from the pro
ceeding pipeline markup language processing step 185, and
step-by-step mode, as Will be explained). The user 108 can
de?ned trigger events or conditions 255 that specify certain
data 210, or to transfer the debug data 210 to the remotely
operating control service 259 via a messaging protocol 192.
markup language processing steps 195 of the processing
pipeline on the input markup language data as Will be
explained more fully herein. Note that step 201 may be per
data 210 that, if certain trigger conditions 255 are met, is
eligible for post-processing analysis (or real-time analysis in
ging step(s) 187, upon input markup language data 105 as a
transaction. Execution of the debugging step(s) captures the
debug data 210 for at least one of the series of markup lan
each input markup language data document 105, that markup
language input data 105 is applied is a transaction to the
processing pipeline 251 and each steps 185 is performed on
markup language data 105 that has been or is to be processed
by the processing pipeline 251. Further details of this Will be
explained With respect the ?oWcharts in the ?gures that fol
loW.
In step 202, the debug process 150 executes the series of
global and/ or local variables (user de?ned for use by the
pipeline), as service intrinsic data such as system variables,
187 are executed for each transaction of markup language
client and peer identities, URL information, TCP/IP port
numbers and other protocol speci?c data, and the like. Addi
tionally, each debug step 187 betWeen tWo pipeline steps 185
input data 105, regardless if the debug data 210 they produce
can capture output of the proceeding step 185 such as an
is to be saved or analyZed. HoWever, only in situations upon
Which a triggered event 255 is detected by the triggered event
detector 257 is the debug data 210 saved for analysis. In an
traversed the XML programming language; ii) information
alternative con?guration, upon occurrence of a trigger event
255, the pipeline processing is halted in a debug step 187 and
the currently captured debug data 210 and control is trans
ferred to the control server 259 (or to the debug controller 250
if analysis in step by step mode is being performed locally on
55
execution trace of the step 185 indicating i) hoW that step
60
on XSLT extension functions used during processing in that
step 185 such as Which XSLT extension function Was called,
What that function’s inputs Were, and What the XSLT exten
sion function produced as output. The debug process can save
this debug data into a Zip ?le for subsequent post-processing
65 access.
the same computerized device 110) to alloW the user 108 to
Depending upon the con?guration, the multi-step debug
inspect the current debug data for the most recently applied
ger process 150 distinguishes betWeen tWo levels of granu
US 7,721,262 B2
10
steps 185, just as in step 200 above in FIG. 3. Details of
larity. The ?rst one is the sequence of user con?gured actions
de?ned Within the pipeline 151 as user de?ned steps 185 as
determined by the user selected service con?guration 171.
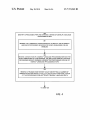
processing step 300 to be explained in steps 301 through 303.
In step 301, the debug process 150 renders, via a graphical
user interface, a selection of markup language processing
Those pipeline steps 185 can perform markup language trans
form actions, data and message routing actions, fetching
services for Which debugging can be enabled. Services that
can be activated in one con?guration include a multiprotocol
gateWay service, an XML ?reWall service, a Web proxy ser
vice, an XSL proxy service, an XSL coprocessor service, and
a Web application ?reWall.
In step 302, the debug process 150 receives a selection of a
resources, posting resources, authentication, and so forth. In
one con?guration, the debug process 150 controls the How of
information (i.e. capturing of context) betWeen those actions
or steps 185 by auto-inserting the debug steps 187 in real-time
in betWeen the user-con?gured pipeline steps 185. Those
inserted debug actions or steps 187 collect all useful opera
markup language processing service for Which debugging is
tional data (call and execution traces) from the prior ?nished
to be enabled. The selected markup language processing ser
processing step 185 as Well as the input parameters of the next
vice alloWs the user to matching criteria for matching mes
sages and rules to apply in the event of a match. Each rule
results in application of a sequence of steps 185 that de?ne the
processing step 185. In one con?guration, each debug step
187 sends the collected data to a prior con?gured passive or
active probe (server component) such as the control server
processing pipeline or sequence (e. g., a service con?guration
171 in FIG. 1) of markup language processing steps 185.
259 via a messaging protocol (e.g. XML/SOAP) 192.
If the control server 259 is operating as a passive probe then
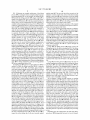
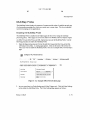
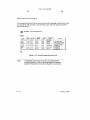
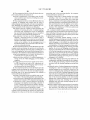
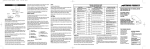
FIG. 1 includes an example screenshot of the graphical
the processing policy Will continue With the next pipeline step
185 and the process is repeated until all pipeline steps 185 and
user interface 170 in Which the user 108 has selected an XML
20
debug steps 187 are executed. The collected debug data 210 is
correlated using sequence and transaction identi?cations and
vieWing a “Probe Settings” tab and can elect to turn multi
stepped debugging on or off via radio button 402. Assume for
the user 108 is able to examine the transaction debug data 210
after completion of the pipeline, alloWing the user 108 to
broWse and analyZe stored debug data 210 afterWards.
In an alternative con?guration, the debug process 150 oper
ates as an active probe and inserts debug steps 187 in real-time
25
into the pipeline 251 and alloWs the user 108 to halt the
processing of the multi-step processing pipeline 251 on a per
debug step 187 basis as explained above. Furthermore, this
con?guration alloWs the user to, for example, change one or
more values of input parameters prior to continuing execution
of the next pipeline processing step 185 and alloWs for real
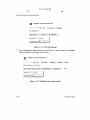
of transactions for Which to collect debug data 210 from
application of the processing pipeline 251 to input markup
language data 105. This transaction history count indicates
hoW many sets of debug data to save at one time.
After processing step 303, debug process processing con
tinues and step 304 in FIG. 5.
FIG. 5 is a ?owchart of processing that continues descrip
40
debugging step into the processing pipeline 251, just as in
tions. The debug process 150 collects line, instruction type,
debug data 210. The execution trace is collected by the debug
step 187 that folloWs execution of the pipeline step 185 that
executed the stylesheet instructions. The debug data 210 is
detailed enough to alloW the user 108 to folloW the execution
?oW after the stylesheet execution. Combined With an active
probe, the user 108 is able to physically execute one of the
45
service for Which debugging is to be enabled. Depending
upon the service selected by the user 108, a particular service
50
can receive a selection of an XSL proxy service, an XML
55
required or desired, and then return execution control back to
multi-step pipeline 251 and the next pipeline processing step
cessing policy that consists of a set of processing rules to be
60
FIGS. 4 through 6 are a single ?oW chart of processing
pipeline de?ning a series of markup language processing
included in that service. Each rule has a set of certain match
ing criteria that the user can establish. As an example, service
matching criteria can de?ne a particular URL upon Which
input markup language data 105 is posted upon. As another
steps that explain further details of the high-level processing
steps described above in FIG. 3.
In step 300, the debug process 150 identi?es a processing
?reWall service, an XSL coprocessor service, a Multi-proto
col gateWay service, a Web proxy service, or a Web applica
tion ?reWall service. Each service presents an application for
use of the computeriZed device 110 against input data 105. A
user 108 can con?gure a particular service to create a pro
185 is executed. In this manner, the system disclosed herein
ing. Further details Will noW be explained With a more
detailed ?oW chart.
con?guration 171 that de?nes Which particular processing
steps 185 are to be applied to the processing pipeline 251 is
inherently selected. As an example, the debug process 150
collected debug data 210 are handed over to the user 108, and
the user is able to step through the execution trace of the
enables step-by-step debugging of markup language process
step 201 in FIG. 3. Further details of processing step 304 Will
noW be explained With respect to steps 305 through 309
beloW.
In step 305, the debug process 150 identi?es a con?gura
tion associated With the selected markup language processing
pipeline processing steps 185, then execution control and
executed pipeline processing step 185, examine the collected
debug data 210, modify the input to the next step 185 if
tion of processing performed by the debug process 150.
In step 304, the debug process 150 inserts at least one
tion With the debug process 150 collects an execution trace of
each pipeline step 187 as it executes any stylesheet instruc
variable values, output generated, and so forth as part of the
Returning attention back to the ?owchart of processing
steps in FIG. 4, in step 303, the debug process 150 receives a
transaction history count (403 in FIG. 7) identifying a number
users 108 experiment With different markup language data
and modify input 105 during application of the steps 185 in
the pipeline 251.
In another con?guration, the other level of granularity
includes individual instructions Within one stylesheet. In this
this example that the user enables the multistep probe Which
activates the debugging process 150 to apply the processing
pipeline 251 that de?nes or includes processing steps 185 for
application of an XML ?reWall service to input markup lan
guage data 105.
30
time execution of these steps With the neW value. This lets
con?guration, a compiler (not shoWn) operating in conjunc
?reWall service 401 to be applied to input markup language
data transactions 105 (i.e., XML documents received by the
computeriZed device 110). In this ?gure, the user 108 is
65
example, service matching criteria can indicate a speci?c IP
address, protocol port number or other information upon
Which input data 105 is received. Each rule, if matched,
applies the service as a discrete number of N processing steps
US 7,721,262 B2
11
12
185, the collection of Which, depending upon the con?gura
tion of the service, de?ne the processing pipeline 251 to be
applied to markup language input data documents 105 each
as system variables, client and peer identities, URL informa
tion, TCP/IP port numbers and other protocol speci?c data,
and the like. Steps 311 through 318 illustrate further details of
processing.
processed as a transaction against the pipeline 251.
Based on the matching criteria, the device selects the rule
of the service to be applied (the rule de?ning a set of steps
185) for an input transaction 105. Once the system has
matched a input markup language data message 105 to a rule,
it has de?ned the steps 185 in that rule to be applied to that
input data. The matching criteria alloWs the device 110 to
apply certain services to some messages by selecting Which
In step 311, the debug process 150 receives an identi?ca
tion of a trigger event 255 that indicates a condition upon
Which to save debug data 210 associated With a transaction
105.
In step 312, the debug process 150 receives input markup
language data 105 as a transaction.
In step 313, the debug process 150 applies the processing
pipeline 251 de?ning a series of markup language processing
steps 185 to the input markup language data 105. Application
of the processing pipeline includes operating the ?rst debug
step, each successive debug step, and the ?nal debug step to
rule to run. As an example, if a message 105 arrives and
indicates a signature is included, then the services Will run a
“signature” rule that includes the steps 185 (i.e., a processing
pipeline) to validate the XML signature, remove the XML
signature, and transfer the message to another process (eg
capture input and output data as debug data 210 for each step.
Steps 314 through 318 illustrate details of processing.
In step 314, the debug process 150 inserts the ?rst debug
step, each successive debug step, and the ?nal debug step into
back onto a network). The user 108 can set up the order of the
rules for a particular service, and each rule de?nes a set of
steps 185 to be applied. Other examples of steps 185 include
printing a message, checking for illegal content, performing
20
schema validation, encrypting messages and so forth. The
steps 185 that make up a rule for particular service con?gu
ration 171 de?ne the various processing pipeline 251 that are
insertion of debug steps one by one as each pipeline step is
executed. In an alternative arrangement, the debug process
applied to input data 105 treated as a transaction across the set
of steps for the processing pipeline.
Accordingly, in step 306, for each markup language pro
cessing step 185 de?ned in the con?guration, the debug pro
25
150 inserts the ?rst debug step, each successive debug step,
and the ?nal debug step into the con?guration de?ning the
processing pipeline 251 prior to application and execution of
any markup language processing steps 185 in the processing
pipeline upon input markup language data. Thus the pipeline
cess 150 inserts a debug step 187 into the con?guration. The
debug steps 187 capture a snapshot of debug data 210 asso
ciated With that markup language processing step 185 (be
the processing pipeline in real-time, during executing the
series of markup language processing steps. This alloWs
With debug steps in this alternative con?guration is precon
30
?gured With debug steps (as opposed to inserting the debug
tWeen Which it is inserted). Steps 307 through 309 to illustrate
steps in real-time) to alloW faster execution of the pipeline and
details of processing.
debug steps.
In step 307, the debug process 150 inserts a ?rst debug step
before the ?rst step 185-1 in the con?guration. The ?rst debug
step 187-1, upon execution, captures a snapshot of input data
associated With the ?rst step 185-1.
In step 308, the debug process 150 inserts a successive
debug step 187 after each successive step in the series of steps
de?ned in the con?guration other than the last step. Each
successive debug step, upon execution, captures a snap shot
of output data processed by the former step in the con?gura
tion, and captures a snapshot of input data associated With the
next step in the con?guration.
In step 309, the debug process 150 inserts a ?nal debug step
after the last step in the con?guration. The ?nal debug step,
upon execution, captures a snap shot of output data processed
by the last step in the con?guration. In this manner, process
In step 315, during execution of the debugging steps 187,
35
least a portion of the debug data 210 to a control service 259
(e.g., operating remotely, or the debug controller 250 operat
ing locally) and halts execution of the debug step 187, and the
40
transaction, until the control service 259 indicates, via the
messaging protocol 192, that the halted debug step 187 can
proceed to alloW the transaction to continue processing to the
next step 185. In this manner, the control service 259 (or
debug controller 250) alloWs step-by-step control and analy
sis of the debug data before letting the steps in the pipeline
45
ing pipeline con?guration 251 is augmented or supplemented
With debug steps 187 that capture debug data 210.
In step 310, the debug process 150 executes the series of
the debug process 150 operates in a step-by-step probe mode
and engages a messaging protocol 192 (FIG. 2) to transfer at
50
markup language processing steps 185, including the debug
251 continue to process the transaction.
In step 316, the debug process 150 detects a trigger event
255 during processing of a transaction and in response, indi
cates that the debug data 210 collected from execution of the
debug steps associated With the transaction is to be post
processed and not discarded (or passed to the control service
259). This step may be performed before or after step 315.
ging step(s) 187, upon input markup language data 105 as a
Thus, trigger events can cause only some transactions to have
transaction. Execution of each debug step 187 betWeen tWo
their debug data 210 analyZed or stored.
In step 317, the debug process 150 stores debug data for
each step collectively as a debug record associated With the
transaction for the input markup language data 105. In one
con?guration, the debug process 150 saves all debug data in
records Within a Zip ?le for post-processing analysis.
In step 318, the debug process 150 uses a messaging pro
pipeline steps 185 (or after the last pipeline step 185) can
capture output of the proceeding pipeline step 185 such as an
i) an execution trace of the pipeline step 185 indicating hoW
55
that step traversed the XML programming language; ii) infor
mation on XSLT extension functions used during processing
in that step 185 such as Which XSLT extension functions Were
called, What the function inputs Were, and What the XSLT
extension function produced as output. Furthermore, execu
tion of a debug step 187 can also involve capturing debug step
input (or output) context including all or a part of an XML
document 105, portions of a parsed XML tree, a binary data
block, an attachment (eg a mime attachment) to the message
60
tocol to transfer the debug data 210 to an external server (e.g.
control service 259) for post-processing. This step thus oper
ates a debug server that receives the output of the debug step,
and saves the debug data 210 and transfers this data to a
65
remote location, alloWing external control of the computer
iZed device 110. This step can involve the externally operat
105, stylesheet parameters, global and/or local variables (user
ing controller service 259 that does not alloW pipeline execu
de?ned for use by the pipeline), as service intrinsic data such
tion to continue until the external control program or service
US 7,721,262 B2
13
14
259 is instructed by the user 108 or another program to allow
progresses and messages are sent/received. So for each action
a user can see the Whole state of the pipeline Which may be
the pipeline to advance to the next step 185.
Appendix A below is a user manual of a multi-step markup
language debugger con?gured in accordance With example
embodiments disclosed herein. This appendix includes
screen shots of a graphical user interface 170 that shoWs a
graphical vieW of the debug data captured from operation of
apipeline of processing steps 185.As shoWn, the user can step
through execution of each action in each rule. Along the
bottom of the graphical user interface 170 is a WindoW shoW
ing log messages for a transaction. Along the side are Win
doWs shoWing each multi step context and all of their contents,
all var://context variables (including system ones)iand all
changes dynamically as the user steps through the action. The
input and output messages are automatically captured and
displayed in their oWn WindoWs. In one con?guration, Win
doWs shoWing the routing and arp tables, With the relevant
chosen route and arp entries highlighted as the action
relevant for the transaction at that time. The multistep debug
ger pulls all of the disparate pieces of debug information
together into a single real-time vieW and gives the user a nice
Way to drive the debugging session rather than simply turning
features on/ off for given time periods or thresholds.
While con?gurations of the system and method have been
particularly shoWn and described With references to con?gu
rations thereof, it Will be understood by those skilled in the art
that various changes in form and details may be made therein
Without departing from the scope of the invention. Accord
ingly, the present invention is not intended to be limited by the
example con?gurations provided above.
Appendix A:
The folloWing Appendix provides an example of a user
manual for a multi-step probe markeup language debugger
that operates in accordance With one example con?guration.
US 7,721,262 B2
15
16
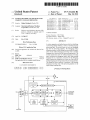
MultiStep Probe
MultiStep Probe
The MultiStep Probe displays the contents of contexts and the value of variables at each step
of a document processing rule, which may contain one or many steps. This is an invaluable
tool for developing service applications.
Enabling the MultiStep Probe
The MultiStep Probe is enabled on the Object pages for the service using the multistep
processing policy. These pages are covered in detail in the WebGUl Service Objects chapter.
An XML Firewall, XSL Proxy and XSL Coprocessor can use the MultiStep Probe. Use the
following procedure to enable the MultiStep Probe.
1. Open the Object menu area and click on the Edit XML Firewall, Edit XSL Proxy or Edit XSL
CoProcessor menu links. A catalog page appears. Click on the name of the service for
which you want to enable the~MultiStep Probe. Here is an example XML Firewall object
page.
i: Con?gure XML Firewall Service
XML Firewall Service : Encrypt [up]
GE LCar-ici] Delete 1 f View Log J F View Object Status 7 [ Multislep Probe
. l Admin State
3
% Local IP Address
0.0.017
i
% Cumments
i
@cnablod 0 disabled
.
*
.
[demo default document encrypt}
Figure 6 - 42. Example XML Firewall object page
2. In every case, there is a Probe Settings and a Probe Triggers tab. Click the Probe Settings
tab to enable the MultiStep Probe. The Probe Settings page appears as follows:
Release 3.2 Draft
US 7,721,262 B2
17
18
De?ning a Document Processing Policy
? Con?gure XML Firewall Service
jam
__ mm '
XML Flrewell Service
| Agelli [Cancel ] {EENQFE
Multistep Probe
l View Lnq ] [_ View om: Status
J
Oon @ off
1
Figure 6 - 43. Probe Settings page
3. Use the MultiStep Probe radio buttons to turn the Probe On. Then click Apply. The MultiStep
Probe button appears on the page, as shown here.
? Con?gure XML Firewall Service
h
XML Firewall Service : Encrypt [up] ,
Apply
Cancel I l Delete ] [ View Log ] [
Multistep Probe
.
View Object Status
] FMultistep Pruhe
1
m
Q on O of!
l
l
2, Transamcm Hictory
1D
Figure 6 - 44. MultiStep Probe button enabled
6 - 92
,
Release 3.2 Dra?
US 7,721,262 B2
19
20
MultiStep Probe
Using the MultiStep Probe
Send some traffic to the service for which the Probe is now enabled. (You can generate traffic
using cURL. See http://curl.haxx.se for more information about this utility.) Then click the
MultiStep Probe button. The MultiStep Probe Transaction History page appears in a new
browser window.
Figure 6 - 45. Probe transaction list display
The length of this transaction list is determined by the value of the Transaction History ?eld of
the Probe Settings page associated with the service (Figure 6-44 above).
Click the leftmost magnifying glass icon to display the details of the transaction. Here is an
example of the MultiStep Probe display:
Release 3.2 Dra?
6 - 93
US 7,721,262 B2
21
22
De?ning a Document Processing Policy
Input Content 'mrur of Step 1
[E]
2————-——> IPJEQIQMEPE’QPQ
3 ____> Step 1: Transform Anion: InputulNPUT, Transfomwlocal:I/?dentityZ.xsl, Output=temuvnr1. OutnutType=d=fault
4_—>
Context/loosen?
l [
ContextVariables
] [
Global Variables
] [ 'Service Variables 1
Content of context ‘INPUT’:
xmlns="hr.tp
(message x51zschemaLocaeimw?-mtp:l/uvu.
: lluvw. example . cum" mlns : xsi-"hccp
example: llvwu
. com message
. v3 . org/ZUDl/XHLSchema
. xml”
instance" xmlns : env="http : // schemes . xmlsoap . org/smap/envelope/ "
xmlna : dp-"http : l/wu. datapowe: . camlachemaslmanagcment">
<subject>lmporcanu<lsubject>
<body>
I'll look for you in old Honolulu,
San Francisco, Ashcabula,
Yer gonna have to leave me now, I know.
But I'll see you in the sky above,
In the tall grass, in the ones I love,
Yer gonna make me lonesome when you go.
6 __> Select to show formatted content
Figure 6 - 46. MultiStep Probe Content display
Probe Display Elements
1. Step Navigation Buttons. Press Previous or Next to move to the next step. This is another
way to achieve the same results as using the Input and Action Detail selector icons.
6 - 94
Release 3.2 Dra?
US 7,721,262 B2
23
24
MultiStep Probe
2. Input and Action Detail selector icons. The top line of icons follow the various steps of
the rule being probed.
Figure 6 - 47. Steps
v
The selected input. This is the input context to the action that follows it.
[)3]
Thus, the leftmost magnifying glass is the INPUT context, containing the
document submitted to the service for processing. The rightmost magnifying
, glass is the OUTPUT context, containg the information output by the service to the
con?gured output destination.
The selected action. Clicking any of the action icons changes the main
~[ , ;
display of the probe. Rather than the context information, trace information
for the action itself is available, as shown here.
Processing Step 1
@
?rlérltplgplé'l??ilpp
Step 1: Transform Action: 1nput=lNPUT, T,
‘
'
' /,""
“7215!, C .,
,.
1, Output‘l'ype-defeult
Call Trace
Execution trace:
seq
template
(no execution ‘trace available)
trace
T
Figure 6 - 48. Action trace display
Click Call Trace to display information about actions that interact with resources
outside of the service. Speci?cally, stylesheets that use any of the following extension
functions will produce a Call Trace.
soap-call
url-open
Release 3.2 Draft
radius-authen
'
netegrity-authen
ldap-authen
get—kerberos-ticket
dvoli-authen
ocsp-validate-certi?cate
_
.
6 - 95
US 7,721,262 B2
25
26
De?ning a Document Processing Policy
3. Context Information. This line of text details the input name, the action and the output
name. Here is an example:
Step 2: Set Variable Atxion: Context=tempvarl, Variable=varz/llncal/plainname, Value-snafu, ErrurMudo-abort,
-
.
OutputType=dafault
Figure 6 - 49. Step information
4. Context Display Buttons. Use these buttons to control the main context display. By
default, the Context Content button is active.
l
Comet/{Content
cnntextvariables
Globulllarioblesjl
Servicellariables
1
Figure 6 - 50. Context display buttons
21.
Click Context Variables to display the value of any context variables. These are
variables created by either a Setvar action or by the stylesheet used in a previous
action. Here is an example of a Context Variables display.
Input Context 'tempvan' of Step 5
[E
PEIQEQQQEIAP
Step 5: Transform Action: lnput-tempvarq,Transforrm-store:///enerypt.xsl, Output=OUTPUT,
StylesheetPerameters= , 0utnutType=default
[ ContextContentJ E
centtxtwrieaics
Global Variables
] [
Service Variables J
Variables in context 'tempvam':
name
type
\fergil?ogallplpinnramel
’
n
_
‘I
value
‘F'l'lq
Figure 6 - 51. Context variables display
b. Click Global Variables to display the value of global variables. Global variables can be
created in a number of ways. All variables created as “varzl/system/varname” appear
here. These variables persist beyond the multistep processing scope (see Contexts
section at the'beginning of this chapter for more information). All variables created as
"var://context/contextname/varname” appear here. You will notice that variables
created as “varz/llocal/varname” also appear here as“varzl/context/varname” for each
6 - 96
Release 3.2 Draft