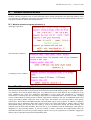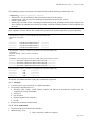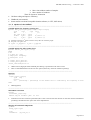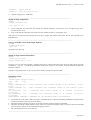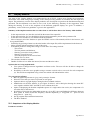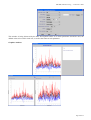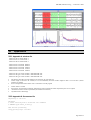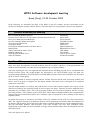
1
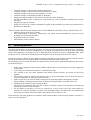
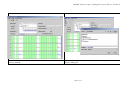
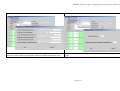
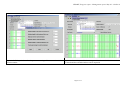
WP03 Software development meeting
Rome (Italy), 23-24 October 2002
In the following, we summarize the status of the WP03 on the H/V software and give the minutes of the
discussions during the meeting at INGV-Rome, 24 October 2002. List of participants is given in the Appendix.
I
Partners attending the meeting
Kuvvet Atakan & Bladimir Moreno
Ricardo Azzara, Fabrizio Cara Giovanna, Cultrera & Antonio Rovelli
Pierre-Yves Bard & Sylvette Bonnefoy
Jean-Luc Chatelain & Bertrand Guillier
Cécile Cornou &Donat Fäh
Anne-Marie Duval
Jozef Kristek, Miriam Kristekova & Peter Moczo
Martin Koller
Alberto Marcellin & Alberto Tento
Matthias Ohrnberger
Pedro Roquette & Paula Teves
Nikos Theodulidis
II
UiB-Bergen
INGV-Rome
LGIT-Grenoble
UJF/IRD-Grenoble
ETHZ-Zurich
CETE-Nice
GPISAS-Bratislava
RESONANCE-Geneva
CNR-Milano
UP-Potsdam
Costa ICTE/UL-Lisbon
ITSAK-Thessaloniki
Scientific synopsis
There were major developments on all four modules of the H/V software, which are: (i) Browsing Module, (ii)
Window Selection Module, (iii) Main Processing Module and, (iv) Display Module.
The work regarding the first, was organized and performed by the UiB-Bergen group also in coordination with
ICTE/UL-Lisbon group. The second module was developed by the LGIT-Grenoble group. The third was
organized and performed by the ETHZ-Zurich and CNR-Milano groups, whereas the last module was developed
by the ICTE/UL-Lisbon group.
The browsing module is already integrated with the window-selection and the main processing modules and
there is work in progress to integrate also the display module. This latter work is envisaged to be completed
within three weeks time.
The deliverable deadline is in January 2003 and the first version of the software together with a report will be
delivered according to the original plan and we do not expect any delays. There has also been additional work
performed by the WP02 group, where the processing module was tested and compared with the existing
processing routines. Three separate groups (CETE-Nice, INGV-Rome and IRD-Grenoble) have performed this
analysis and prepared individual reports and a summary report was prepared in the workshop in Nice during
September 2002.
In general, the progress is satisfactory and further actions are scheduled for the work to be done until January
2003. The suggested changes to the different modules will be implemented if feasible within the limitations of
the January 2003 deadline. Those suggestions that require significant additional work will be implemented later,
after the deliverable deadline. The developers of the four modules will write their individual reports
summarizing each module and will send them to Bergen (latest mid-November 2002) for integration into the
deliverable report.
The action points are as follows:
SESAME, Progress report – Management report: May 02 – October 02
•
•
•
•
•
•
•
•
Complete changes on the browsing module (B. Moreno)
Complete changes on the window selection module (P-Y. Bard)
Complete changes on the processing modules (A. Tento)
Complete changes on the display module (P. Roquette)
Integrate the display modules to the software (B. Moreno and P. Roquette)
Send the individual reports to Bergen for each module (by each responsible of module latest in midNov.2002)
Integrate the report (K.Atakan)
Prepare the CD for the software distribution together with installation procedure and instructions for
installation (P. Roquette)
After the January 2003 deliverable deadline, there will be additional work which will be performed. These are:
•
Extensive testing of the entire software
•
Final modifications (if necessary), following the test results and recommendations of the users (also
including the on-line help functions)
•
Preparation of the user manual
•
Dissemination of the software (WP12)
III
Browsing Module
The main functionalities of the browsing module was discussed and agreed upon during the Nice Workshop.
Following this, B. Moreno from the UiB-Bergen, has developed the preliminary version of the browsing module
and the main graphical user interface (GUI). A dedicated effort was made in Lisbon, in September 2002, when
B. Moreno and T. Utheim from UiB-Bergen worked together with P. Roquette from ICTE/UL-Lisbon.
During the meeting in Rome the main graphical interface and the browsing module, together with the window
processing and the main processing modules were demonstrated followed by a discussion.
Several suggestions were made and these are outlined below which will be implemented following the priority
list of the developers:
•
•
•
•
•
•
•
•
•
In the general parameter-setting dialog window add the choice of indicating where all the output files
should reside.
Overwriting of a file-name should have a confirmation prompt.
Give warning to the user when automatic and manual selected windows are mixed for processing
together.
Give warning to the user when several files for a site are processed together if one or more files does not
contain any automatic or manually selected windows.
Option to activate or de-activate all the warnings in the general parameter-setting dialog window.
Add availability of tracking the time when the main processing module is executed in the GUI.
Add filtering possibilities in the browsing module.
Add options for saturation check and low frequency transient removal in the parameter-setting dialog
window for window selection module.
Fix the number of windows to process for each file for a site in order to have the same number for
windows for each file. Should be set equal to the minimum number of windows that are automatically
selected by the window selection module among all the selected files for a site.
In the following, the main graphical user interface and the functionalities of the browsing module is shown by a
series of screen snap-shots:
Page 2 of 14
SESAME, Progress report – Management report: May 02 – October 02
Figure 1-1. The general layout of the Graphical User Interface (GUI) and the Figure 1-2. Creating a new project or opening an existing project is performed
Browsing Module.
through a dialog box.
Page 3 of 14
SESAME, Progress report – Management report: May 02 – October 02
Figure 1-3. General parameter settings are performed through a dialog window, Figure 1-4. Dialog window for parameter setting of the manual window selection
where the location of the input parameters and the executable programs are given.
routine.
Page 4 of 14
SESAME, Progress report – Management report: May 02 – October 02
Figure 1-5. Dialog window for the parameter setting of the automatic window Figure 1-6. General layout of the browsing module, where individual time series can
selection routine.
be viewed and the selected windows can be inspected.
Page 5 of 14
SESAME, WP03 meeting - 24 October 2002
IV
Window Selection Module
Window selection program seems to work efficiently and is already integrated to the browsing module. There
were basically two additional suggestions to be added, these concern the saturation of signals and the removal of
long-period transients. Details are described below:
IV.1 Window selection program (winselect_3)
Antitrigger algorithm
Anti-saturation condition
Avoiding too noisy windows
V
Main Processing Module
The main processing module is developed by the ETHZ-Zurich and CNR-Milano groups in a coordinated effort.
Two meetings were held in Milano during the 14-15 March and 18-19 April 2002 for the coordination of the
work. Otherwise the work was performed individually by each group and information is exchanged
electronically. Following the Nice workshop in April 2002, a concentrated effort was done to finish a working
version of the module for testing and use in WP02 experimental conditions. This was accomplished and the first
version was made available in the first week of July 2002. The module was used and tested by three groups
(CETE-Nice, INGV-Rome and IRD-Grenoble) and individual reports were prepared. In addition a summary
report was given in September 2002 (these reports will be part of the deliverable in January 2003). Further
development taking into account the test results as well as the discussions during the Rome meeting, will
continue until the deliverable deadline. This will also be in coordination with the UiB-Bergen with regard to
integration to the browsing module. It will be possible to make corrections and improvements after the
deliverable deadline, however, the possible changes will have to be given a priority have comments, suggestions
and the report of possible bugs until mid-September 2002.
Page 6 of 14
SESAME, WP03 meeting - 24 October 2002
The HVPROC program is developed in Fortran90 and runs with the following command line call:
> hvproc0_1 winfile parfile outfile
•
window.file : list of time histories and selected time window for the analysis
•
parameters.file : file with a section containing the parameters needed for the analysis
•
out.file : main output
•
defaults.file: file with a section containing the default setting of the parameters needed for the analysis (this
file is found to be redundant and will not be included, instead the default parameters will be hardwired in to
the code)
In the Appendix A-D the different files (window file, parameter file and the output files) are given separately.
C:\Sesame\Data> hvproc0_1 wind parameter.file output defaults.file
window file not found !
wind
>>>>>>>>>
>>>>>>>>>
>>>>>>>>>
>>>>>>>>>
CONTROLLED ERROR EXIT
CONTROLLED ERROR EXIT
CONTROLLED ERROR EXIT
CONTROLLED ERROR EXIT
<<<<<<<<<
<<<<<<<<<
<<<<<<<<<
<<<<<<<<<
C:\Sesame\Data> hvproc0_1 window.file parameter.file output.file defaults.file
WARNING
output file already exists: it will be overwritten
output.file
WARNING : NO instrument correction provided in the current software version
>>>>>>>>> WARNING MESSAGES HAVE BEEN ISSUED <<<<<<<<<
>>>>>>>>> WARNING MESSAGES HAVE BEEN ISSUED <<<<<<<<<
>>>>>>>>> WARNING MESSAGES HAVE BEEN ISSUED <<<<<<<<<
>>>>>>>>> WARNING MESSAGES HAVE BEEN ISSUED <<<<<<<<<
C:\Sesame\Data> hvproc0_1 window.file parameter.file output.file defaults.file
>>>>>>>>>
O.K.
<<<<<<<<<
>>>>>>>>>
O.K.
<<<<<<<<<
>>>>>>>>>
O.K.
<<<<<<<<<
>>>>>>>>>
O.K.
<<<<<<<<<
Æ Problem with Macintosh about reading the command line arguments
V.1.1 Platform
• 2 routines (up to now) are machine or compiler dependent
• successfully compiled and run on :
• Windows with Compaq Visual Fortran compiler and Microsoft PowerStation compiler (but this
compilers are already compatible)
• Linux g77
• Sun Æ INGV
• Digital (Digital Fortran compiler)
• No HP
• Some minor problems with Macintosh
V.1.2 To be implemented
• Conform the program to the decided standard
• Dimensioning : now
• Max. time history number of samples
Page 7 of 14
SESAME, WP03 meeting - 24 October 2002
•
•
•
• Max. time window number of samples
• Max. number of windows
Then Æ dynamical dimension
Uniform coding and improve efficiency
Handbook (user manual)
Some routines are taken from public domain software (i.e. FFT, GSE driver)
V.1.3 Options of the HVPROC
’’’’’’’’’’’’’’’’’’’’’’’’’’’’’’’’’’’’’’’’’’’’’’’’’’’’’’’’’’’’’’’’’’’’’’’’’’’’’’’’’’’’’’’’’’’’’’’’’’’’’’’’’’’’’’’’
possible options for frequency spacing are:
syntax: freq_spacing:<type>[:<arg1>:<arg2>:<arg3>]
type
arg1
arg2
arg3
fft
- (1)
fft_red f_min
f_max
linear
f_min
f_max
# points (2)
log
f_min
f_max
# points (2)
(1) FFT does not require 2N points in order to always have df=1/window_length
(2) IF f_min < df : f_min = df
IF f_max > F_Nyquist : f_max = F_Nyquist
’’’’’’’’’’’’’’’’’’’’’’’’’’’’’’’’’’’’’’’’’’’’’’’’’’’’’’’’’’’’’’’’’’’’’’’’’’’’’’’’’’’’’’’’’’’’’’’’’’’’’’’’’’’’’’’’’
possible options for offset removal are:
syntax: offset_rem:<type>[:<arg>]
# type:
# no
# r_mean all [win]
# high-pass: frequency
# band-pass: f1 f2
#
# offset_rem:r_mean:all
# offset_rem:r_mean:win
offset_rem:band-pass:1:10
•
•
Offset removal, high pass filter and band pass filtering is performed on the entire record.
Here it is decided that there will be one more option (mean only on the all windows separately)
’’’’’’’’’’’’’’’’’’’’’’’’’’’’’’’’’’’’’’’’’’’’’’’’’’’’’’’’’’’’’’’’’’’’’’’’’’’’’’’’’’’’’’’’’’’’’’’’’’’’’’’’’’’’’’’’’
tapering
syntax:
taper:<type>:[<arg1>]
type
arg1
boxcar cos
percentage : percentage of the window that is affected by the tapering on both
ends
•
Hanning (hann)
’’’’’’’’’’’’’’’’’’’’’’’’’’’’’’’’’’’’’’’’’’’’’’’’’’’’’’’’’’’’’’’’’’’’’’’’’’’’’’’’’’’’’’’’’’’’’’’’’’’’’’’’’’’’’’’’
instrument correction
syntax:
instrument_resp:<arg>
where arg is either 'yes' or 'no'
•
instrument correction cannot be performed (this is due to the fact that the decision on the SAF format excluded this
possibility) and therefore this option will not be implemented.
’’’’’’’’’’’’’’’’’’’’’’’’’’’’’’’’’’’’’’’’’’’’’’’’’’’’’’’’’’’’’’’’’’’’’’’’’’’’’’’’’’’’’’’’’’’’’’’’’’’’’’’’’’’’’’’’
merging of horizontal components
syntax:
merge_type:<type>
type
arithmetic
(H_ew+H_ns)/2
Page 8 of 14
SESAME, WP03 meeting - 24 October 2002
geometric
quadratic
•
sqrt(H_ew*H_ns)
sqrt((H_ew^2+H_ns^2)/2)
complex merging to be added later
’’’’’’’’’’’’’’’’’’’’’’’’’’’’’’’’’’’’’’’’’’’’’’’’’’’’’’’’’’’’’’’’’’’’’’’’’’’’’’’’’’’’’’’’’’’’’’’’’’’’’’’’’’’’’’’
output of single components
syntax:
single_component:<arg>
arg: 'yes' or 'no'
•
•
If yes is selected, the output file will contain the columns frequency, average H/V, error, average H_ns/V, error,
average H_ew/V, error
If no is selected, the output file will contain only the columns frequency, average H/V, error
This option was proposed with the purpose of having a simpler and smaller output files, but we have decided not to
implement this.
’’’’’’’’’’’’’’’’’’’’’’’’’’’’’’’’’’’’’’’’’’’’’’’’’’’’’’’’’’’’’’’’’’’’’’’’’’’’’’’’’’’’’’’’’’’’’’’’’’’’’’’’’’’’’’’’
average of the H/V ratios of the single windows
syntax:
average_type:<type>
type: log
No options here, only log
’’’’’’’’’’’’’’’’’’’’’’’’’’’’’’’’’’’’’’’’’’’’’’’’’’’’’’’’’’’’’’’’’’’’’’’’’’’’’’’’’’’’’’’’’’’’’’’’’’’’’’’’’’’’’’’’
output of single window information
syntax:
single_win_out:<arg>
arg is either 'yes' or 'no'
In case of 'yes', for each time window a separate output file is created. The name of the file is the base output file name
extended by '_win_###', ### indicating the number of the time window in the sequence of file#2. Each file contains the
following columns:
frequency, merged H/V, H/V ns, H/V ew, spectrum vertical, spectrum NS, spectrum EW
’’’’’’’’’’’’’’’’’’’’’’’’’’’’’’’’’’’’’’’’’’’’’’’’’’’’’’’’’’’’’’’’’’’’’’’’’’’’’’’’’’’’’’’’’’’’’’’’’’’’’’’’’’’’’’’
smoothing section
syntax:
smooth:<type>:[<arg1>[:<arg2>]]
type
arg1
arg2
none
linear bandwidth box : linear smoothing with constant weight in the interval
[f-bw/2
f+bw/2]
linear bandwidth tri : linear smoothing with triangular weight in the interval [f-bw/2
f+bw/2]
log percentage
box
: smoothing with constant weight in an interval [f/(1+p/100)
f*(1+p/100)]
log percentage
tri
: smoothing with triangular weight in an interval [f/(1+p/100)
f*(1+p/100)]
konno-ohmachi bandwidth : bandwidth for the smoothing window (see reference)
•
•
•
•
As pointed out by the tester, I did not properly considered the case when the smoothing bandwidth is shorter than df.
(results are unstable or the program even crashes)
When smooth:none and freq_spacing is not fft, the spectrum values are linearly interpolated.
When the smoothing window requires values of the raw spectrum outside the range 0-F_Nyquist, then the smoothed
spectrum will be restricted to the significant frequency interval.
The smoothed spectrum is not normalised
’’’’’’’’’’’’’’’’’’’’’’’’’’’’’’’’’’’’’’’’’’’’’’’’’’’’’’’’’’’’’’’’’’’’’’’’’’’’’’’’’’’’’’’’’’’’’’’’’’’’’’’’’’’’’’’
Page 9 of 14
SESAME, WP03 meeting - 24 October 2002
VI
Display Module
The status of the ‘Display Module’ was summarized by the ICTE/UL Lisbon group. During the preparations
interactions were made with groups working on the main processing module to coordinate the data input and
output. The preliminary version of the display modules were developed as agreed on the Potsdam meeting and
presented. The developments were done in Java code. In the following, summary of the suggestions made
during the meeting, as well as the snapshots of the different graphical displays are given. In addition, a
preliminary version of the user guidelines is given in the Appendix E.
Summary of the implementations that are either done or will be done before the January 2003 deadline:
•
•
•
•
•
•
•
•
•
In the output window (1a) the title used will be the name of the output file
In the output window (1a) we should show all processing parameters present in the parameter file
In the time series window (2) we should include the start time
Place a button in all of the windows to open the HTML version of the manual (will be in the browser, will
be a general HTML)
Possibility (by pressing a button) to show the header of the input file (will be implemented in the browser)
Show a legend with the meaning of each of the curves
It should be possible to change the settings of each chart. The settings include:
−
The colours
−
The line patterns and thickness
−
Showing (or not) the chart gridlines
−
Showing (or not) box axis
−
The font properties of the various fonts
−
Which curves to show
The windows should be resizable
Double click the axis to define the interval, the max and the min values
Options that are being implemented:
• User option to change between logarithmic and linear scales. The user will also be able to change the
limits in the scale
• Possibility to show the wave graphics using a common vertical scale or one scale for each component
(2). This will be accomplished using a check box which will link/unlink the scales
New suggestions in Rome:
• Save all graphical print-outs in ‘jpeg’ and ‘postscript’ formats
• Select the series that you want to represent in each graph
• Optional choices of graph displays among the three standard windows
• Modification on the Plot window #2 (see figure 1b below): add a third plot showing the mean-H/V
curve together with the NS/V and EW/V curves without the st.dev.
• Option of displaying the absolute amplitude spectra of a single entire time series (one component of a
waveform file) in the browser.
• Possibility of selecting two independent points on a given H/V curve and finding the difference between
these points in terms of both the frequency and the amplitude [i.e. freq.(point #1 – point #2) and
amp.(point #1 – point #2)]
• Set up program and installation instructions
• The three standard
VI.1 Snapshots of the Display Module:
Parameters window
Page 10 of 14
SESAME, WP03 meeting - 24 October 2002
This window is being discussed by the three development teams as to which parameters should be used, the
default values to be used in each case, as well as the limits of each parameter.
Graphics windows
Page 11 of 14
SESAME, WP03 meeting - 24 October 2002
VII
Appendixes
VII.1 Appendix A: window file
\Data\12311021.cts 80001 84000 3
..\Data\12311021.cts 81001 85000 3
.\Data\12311021.cts 82001 86000 3
..\Data\12311021.saf 104001 108000 2
..\Data\12311021.saf 105001 109000 2
..\Data\12311021.saf 106001 110000 2
..\Data\12311021.saf 107001 111000 2
..\Data\12311021.saf 108001 112000 2
..\Data\12311021.gse 130001 134000 1 EHZ EHN EHE TST
..\Data\12311021.gse 131001 135000 1 EHZ EHN EHE TST
..\Data\12311021.gse 132001 136000 1 EHZ EHN EHE TST
•
•
•
time histories must have the same sampling rate (otherwise Æ controlled exit)
window length is allowed to be variable (it is not recommended), the actual window length for FFT is set to the max. (shorter
windows are padded)
uncorrected specified window limits cause a controlled exit of the program
•
•
•
•
window limits in seconds
file with only one horizontal component Æ duplication of the available horizontal component by the user is required
instrument correction cannot be performed (no information in SAF file)
Cityshark header could change
VII.2 Appendix B: Parameters file
Beginning of the file
Anything
# lines starting with # character are comments
# KEWORD:type:value_1:value_2
### section processing
freq_spacing:log:0.1:25:800
Page 12 of 14
SESAME, WP03 meeting - 24 October 2002
offset_rem:high-pass:0.02
taper:cos:5
# instrument correction is not available
instrument_resp:no
smooth:konno-ohmachi:20
merge_type: geometric
single_component:no
average_type:log
single_win_out:no
### end processing
Outside the ### some further options not related to the processing may be added.
VII.3 Appendix C: Output file
### data used in the H/V ratio processing:
# ../Data/12311021.cts
80001
84000
# ../Data/12311021.cts
81001
85000
# ../Data/12311021.cts
82001
86000
# ../Data/12311021.cts
83001
87000
# ../Data/12311021.cts
84001
88000
# ../Data/12311021.cts
85001
89000
#
# parameters actually used in the processing
### section processing
# freq_spacing:log:0.1:25:800
# offset_rem:high-pass:0.02
# taper:cos:5
# instrument_resp:no
# smooth:konno-ohmachi:20
# merge_type: geometric
# single_component:no
# average_type:log
# single_win_out:no
### end processing
#-----------------------------# n_windows:
67
# n_freq_samples:
800
# freq
av_HV
ns_HV
ew_HV av_HV_logstd ns_HV_logstd ew_HV_logstd
0.1000000
2.166863 2.156196 2.177583 1.825516
1.930187
1.985633
0.1006934
•
2.156689
2.144270 2.169179 1.811655
1.915399
1.969796
Columns separated will not be separated by <tab>
VII.4 Appendix D: Output.file_win_xxx
### window used in the H/V ratio processing:
# ..\Data\12311021.gse
129001
133000 EHZ EHN EHE
#
# parameters actually used in the processing:
### section processing
# freq_spacing:log:0.1:25:800
# offset_rem:high-pass:0.02
# taper:cos:5
# instrument_resp:no
Page 13 of 14
SESAME, WP03 meeting - 24 October 2002
# smooth:konno-ohmachi:20
# merge_type: geometric
# single_component:no
# average_type:log
# single_win_out:yes
### end processing
#-----------------------------# n_freq_samples:
800
# freq : specvert : spec-ns : spec-ew : mergedHV :
ns_HV :
0.1000000 5468.083
2964.309 6106.855 0.7781001
0.1006934 5508.878
2938.143 6141.929 0.7711266
•
ew_H
0.5421113 1.116818
Meaning of spec-xx (no instrument correction). Please remember that the time-series is not corrected
VII.5 Appendix E: SESAME H/V Software Display Module User Guideline
In the following document a brief (preliminary) explanation is given about the help functions and the guideline of the ‘Display Module’
of the SESAME H/V Software. The complete documentation of the guidelines will be provided when the development is finalized.
Zoom In
To zoom in on a spectrum representation you should press the left mouse button and drag it to select the area that you want. When you
release the mouse button the chart will represent the area you selected.
If there are multiple linked charts – for example, the spectra for the NS, EW and Z components – all charts will zoom to the same region
at the same time.
Zoom Out
When you want to view the entire spectrum in the chart window just click the left mouse button on the chart. The chart will represent the
entire spectrum.
Selecting a window
Windows are represented as light green rectangles. When they are selected they change to dark pink rectangles.
To select a window just click the right mouse button over it.
Picking sample points
To know the value of a point just click over it with the center mouse button. The point will be marked with a yellow circle, and its
coordinates are on the right.
If the point isn’t the one you where trying to select use the arrow keys (left and right) to scroll the circle to the point you are looking for.
When you have selected the point you want you can record it’s coordinates by pressing the enter key. When you close (or change) the
window you will be prompted for the file name where you want your sample points stored.
Page 14 of 14