1
Project Number: SJB-SIMS SSiim mSSaatt EEdduuccaattiioonnaall PPrrooggrraam mD Deevveellooppm meenntt A Major Qualifying Project Report: submitted to the Faculty of WORCESTER POLYTECHNIC INSTITUTE in partial fulfillment of the requirements for the Degree of Bachelor of Science by Antonio Sangermano II [email protected] _________________________ Michael Kastanas [email protected] _________________________ Date: March 15, 2005 Patrick Kilroy [email protected] Fred Looft [email protected] Stephen Bitar [email protected] This document represents the work of WPI students. The opinions expressed in this report are not necessarily those of the Goddard Space Flight Center or the National Aeronautics and Space Administration. 100 Institute Road Worcester, MA 01609 1 Table of Contents Table of Figures ............................................................................................................................................ 5 1 Introduction................................................................................................................................................ 7 1.1 Project Description ............................................................................................................................. 7 1.2 Summary............................................................................................................................................. 7 2 Background ................................................................................................................................................ 8 2.1 NASA ................................................................................................................................................. 8 2.2 GSFC .................................................................................................................................................. 9 2.3 SimSat .............................................................................................................................................. 11 2.4 Prototype Development .................................................................................................................... 12 2.4.1 Previous Prototype – 2001 MQP Project................................................................................... 13 2.4.2 Current Prototype Status - 2003 MQP Project .......................................................................... 15 2.4.3 Summary ................................................................................................................................... 19 2.5 Balloon 1.0 ....................................................................................................................................... 19 2.5.1 Top Level System Description .................................................................................................. 20 2.5.2 Communications Subsystem ..................................................................................................... 20 2.5.3 Power Management................................................................................................................... 21 2.5.4 Flight Analysis and Results ....................................................................................................... 22 2.6 Amateur Radio and Packet Radio:.................................................................................................... 22 2.6.1 Terminal Node Controller ......................................................................................................... 22 2.6.2 AX.25 ........................................................................................................................................ 23 2.6.3 SAARP Protocol........................................................................................................................ 25 2.6.4 FCC Regulation......................................................................................................................... 26 2.7 Summary........................................................................................................................................... 26 3 Project Statement ..................................................................................................................................... 27 3.1 Project Modification ......................................................................................................................... 27 3.2 Primary Objectives and Tasks .......................................................................................................... 27 3.3 Secondary Objectives and Tasks ...................................................................................................... 28 3.4 Summary........................................................................................................................................... 29 4 Methodology ............................................................................................................................................ 30 4.1 “Birth to Launch” ............................................................................................................................. 30 4.2 Summary........................................................................................................................................... 31 5 Stanford CricketSat System ..................................................................................................................... 32 5.1 Flight Unit ........................................................................................................................................ 32 5.1.1 NTC Thermistor ........................................................................................................................ 33 2 5.1.2 Oscillator ................................................................................................................................... 33 5.1.3 Transmitter ................................................................................................................................ 34 5.1.4 Summary ................................................................................................................................... 35 5.2 Ground Station.................................................................................................................................. 36 5.2.1 Antenna ..................................................................................................................................... 36 5.2.2 Radio Receiver .......................................................................................................................... 37 5.2.3 Parallax Board of Education (BOE) .......................................................................................... 37 5.3 Results .............................................................................................................................................. 37 5.4 Summary........................................................................................................................................... 38 6 WPI CricketSat II+ .................................................................................................................................. 40 6.1 Design Requirements........................................................................................................................ 40 6.1.1 Flight Unit ................................................................................................................................. 40 6.1.2 Ground Station .......................................................................................................................... 41 6.1.3 Summary ................................................................................................................................... 41 6.2 Flight Unit ........................................................................................................................................ 42 6.2.1 Tone Generators ........................................................................................................................ 42 6.2.2 Audio Mixer .............................................................................................................................. 45 6.2.3 Voice Identifier.......................................................................................................................... 46 6.2.4 Audio Distribution..................................................................................................................... 47 6.2.5 Transmitter Interface ................................................................................................................. 49 6.3 Design of the Ground Station ........................................................................................................... 51 6.3.1 Receiver..................................................................................................................................... 52 6.3.2 Computer ................................................................................................................................... 53 6.3.3 Signal Analysis and Audio Recording Software ....................................................................... 53 6.4 Prototype Testing and Results .......................................................................................................... 54 6.5 Integration and Testing (I&T) .......................................................................................................... 56 6.5.1 Fabrication................................................................................................................................. 56 6.5.2 Assembly of the Flight Unit ...................................................................................................... 56 6.5.3 Assembly of the Ground Station ............................................................................................... 58 6.6 Calibration ........................................................................................................................................ 59 6.7 Summary........................................................................................................................................... 59 7 Test Flight of SimSat-1 ............................................................................................................................ 60 7.1 Facilities and Services ...................................................................................................................... 60 7.2 Purpose of the Test flights ................................................................................................................ 60 7.3 Packaging of SimSat-1A and SimSat-1B ......................................................................................... 61 7.4 Setup of the Ground Station ............................................................................................................. 62 3 7.5 Flight Delayed .................................................................................................................................. 62 7.6 Results of First Test Flight: SimSat-1A ........................................................................................... 63 7.7 Result of Second Test Flight: SimSat-1B......................................................................................... 65 7.8 Summary........................................................................................................................................... 67 8 SAARP Closure Status ............................................................................................................................ 69 8.1 Hardware .......................................................................................................................................... 69 8.1.1 Physical Connections ................................................................................................................ 69 8.1.2 Power System ............................................................................................................................ 69 8.1.3 Sensor I/O.................................................................................................................................. 70 8.2 Software............................................................................................................................................ 70 8.3 Testing and Results........................................................................................................................... 71 8.4 Summary........................................................................................................................................... 72 9 Discussion and Conclusions .................................................................................................................... 73 9.1 Requirements Analysis (CricketSat II+)........................................................................................... 73 9.1.1 Flight Unit ................................................................................................................................. 73 9.1.2 Ground Station .......................................................................................................................... 76 9.2 Secondary Goals Analysis (SAARP) ............................................................................................... 77 9.3 Future Work...................................................................................................................................... 78 9.3.1 CricketSat II+ ............................................................................................................................ 78 9.3.2 SAARP ...................................................................................................................................... 79 9.4 Conclusions ...................................................................................................................................... 79 Appendix A: CricketSat II+ Flight Unit Schematics .................................................................................. 81 Appendix B: Wallops Flight Facility Photographs ..................................................................................... 88 Appendix C: Sample Output of SAARP..................................................................................................... 89 Appendix D: Source Code for Data Acquisition Program.......................................................................... 90 4 Table of Figures Figure 1: Organization Chart of NASA ........................................................................................................ 9 Figure 2: GSFC Infrastructure .................................................................................................................... 10 Figure 3: The SimSat Flight Train .............................................................................................................. 12 Figure 4: System Block diagram of 2001 MQP.......................................................................................... 13 Figure 5: Picture of the completed, assembled system without casing....................................................... 14 Figure 6: Picture of the EZ-Compass.......................................................................................................... 14 Figure 7: Picture of the GPS receiver ......................................................................................................... 15 Figure 8: System Block Diagram................................................................................................................ 16 Figure 9: Completed SAARP System......................................................................................................... 17 Figure 10: Arbor EmCORE-i411 Flight Computer .................................................................................... 17 Figure 11: Garmin GPS-25-HVS Receiver................................................................................................. 18 Figure 12: EZ-Compass-3attitude sensor circuit ........................................................................................ 18 Figure 13: PCB Interface for analog sensors .............................................................................................. 19 Figure 14: Balloon V1.0 System Diagram.................................................................................................. 20 Figure 15: Balloon V1.0 Communication Subsystem Diagram.................................................................. 21 Figure 16: Flow diagram of a TNC............................................................................................................. 23 Figure 17: Layout Format for each AX.25 Frame ...................................................................................... 24 Figure 18: CricketSat Concept.................................................................................................................... 32 Figure 19: CricketSat Flight Unit Block Diagram ...................................................................................... 32 Figure 20: Resitive Characteristics of YSI44006 NTC Thermistor............................................................ 33 Figure 21: Astable Multivibrator ................................................................................................................ 34 Figure 22: CricketSat Flight Unit Schematic .............................................................................................. 35 Figure 23: Completed CricketSat Flight Unit ............................................................................................. 36 Figure 24: CricketSat Ground Station Block Diagram ............................................................................... 36 Figure 25: Miscount Zero Crossings (BOE) ............................................................................................... 38 Figure 26: CricketSat II+ Flight Unit Block Diagram ................................................................................ 42 Figure 27: Atomosphic Temperature Model............................................................................................... 43 Figure 28: Resistive Characteristics of YSI44006 NTC Thermistor .......................................................... 44 Figure 29: Frequency Temperature Relationship........................................................................................ 44 Figure 30: Audio Tone Generator Circuit................................................................................................... 45 Figure 31: Analog Mixer Circuit ................................................................................................................ 46 Figure 32: CricketSat II+ Audio Distribution Block Diagram.................................................................... 47 Figure 33: Audio Distribution Control Logic ............................................................................................. 48 5 Figure 34: Signal Conditioning for Transmitter Interface .......................................................................... 50 Figure 35: Microphone Interface for HTX-200 Radio................................................................................ 50 Figure 36: CricketSat II+ Interface for HTX-200 Radio ............................................................................ 51 Figure 37: CricketSat II+ Ground Station Block Diagram ......................................................................... 52 Figure 38: CricketSat II+ Flight Unit Proof of Concept ............................................................................. 54 Figure 39: Recoded Data from SpecLab..................................................................................................... 55 Figure 40: Completed CricketSat II+ Flight Units...................................................................................... 57 Figure 41: CricketSat II+ Assembled Ground Station ................................................................................ 58 Figure 42: Packaging CricketSat II+ Flight Unit ........................................................................................ 61 Figure 43: Spectrogram Plot of SimSat-1A ................................................................................................ 64 Figure 44: SimSat-1A Measured Outside Air Temperature ....................................................................... 65 Figure 45: Spectrogram Plot of SimSat-1B ................................................................................................ 66 Figure 46: SimSat-1B 3-D Flight Path........................................................................................................ 67 Figure 47: Sample Output from SAARP Analysis Software ...................................................................... 72 6 1 Introduction 1.1 Project Description The purpose of this project is to help continue the efforts of Pat Kilroy at NASA Goddard Space Flight Center with the development of the educational Simulated Satellite (SimSat) program for educating students. The final product of our project will provide students with an instrument to help them understand basic concepts of electronics, radio communication, and telemetry plus provide an understanding of the properties of the atmosphere. This report will present to the reader our overall approach and findings before, during and after the completion of this project. 1.2 Summary This report presents a detailed account of the methods used and the results of our project. The report is broken into chapters that focus on one specific aspect of the projects progress. Chapter 2 begins by presenting background knowledge that was necessary for us to complete our project and may be necessary for the reader to fully understand the report. Chapter 3 discusses the modification to our original project and explains the new project goals and objectives. Chapter 4 then describes the methods that we used to carry out our project. Chapter 5 presents the project’s concept and research into the Stanford CricketSat system. Conclusions drawn from this research were used to help design the WPI CricketSat II+ system. Chapter 6 describes the design requirements, concept, prototype, debugging, fabrication, I&T, and calibration of the WPI CricketSat II+ system. Chapter 7 then focuses on the results of our design through the evaluation of its performance during two test flights at Wallops Flight Facility. Chapter 8 discusses the development progress of our original proposed project which we continued to work on as secondary priority. And the report concludes in chapter 9 where the project outcomes are weighed against the project requirements set forth. Chapter 9 also gives insight to future MQP teams on areas of improvement to our designs. 7 2 Background This chapter presents the background knowledge that was necessary for us to complete our project and may be necessary for the reader to fully understand the project. Prior to developing specific project goals and objectives, we had to familiarize ourselves with the methods and results of past MQP projects related to the SimSat program as well as a comprehensive status of the current SAARP system that we would be developing further. 2.1 NASA NASA is known for its scientific and technological achievements in human space flight, aeronautics, space science, and space applications. The launch and success of Sputnik had created a nation wide panic because the Russians had space capabilities. As a result, the National Aeronautics and Space Administration (NASA) was formed on October 1, 1958 with the integration of the National Advisory Committee for Aeronautics (NACA) and some other organizations. When NASA first started, their goal was to ensure that the United States had a human presence in space. Today, NASA still continues to put humans into space, prolonging space travel with the creation of the Space station, but also produces satellites for the observation of earth and other planets near and far.1 The headquarters for NASA is located in Washington, DC and is currently being lead by Sean O'Keef and Frederick D. Gregory, the Deputy Administrator. NASA has 14 major centers and field facilities spread across the U.S. As you can see from Figure 1, NASA Goddard Flight Center is a major facility for the study of earth sciences. Additional agencies also involved in aeronautics or space research are NOAA Weather Satellites, Federal Aviation administration (FAA), and United States Strategic Command (USSC). 2 1 2 http://history.nasa.gov/brief.html http://www.nasa.gov/about/highlights/OrganizationIndex.html 8 Figure 1: Organization Chart of NASA3 2.2 GSFC The mission of the Goddard Space Flight Center [GSFC] is to expand knowledge of the Earth and space through observations from space. GSFC is responsible for developing, operating and analyzing data for space flight missions that are required for experiments. The National Oceanic and Atmospheric Administration (NOAA) are supported by GSFC in providing satellites for environmental data for forecasting and research. 4 NASA's Goddard Space Flight Center (GSFC) is located in Greenbelt, Maryland, just north of Washington D.C. The entire campus covers a total area of 1,270 acres and is the largest field center for the employment of science and engineers. The GSFC campus is organized into three sections, Main Campus, East Campus, and West Campus. The main campus holds 33 major buildings for research, development and office space. Most of these buildings are responsible for the development of spacecraft software, scientific instruments, and the spacecraft themselves. 5 3 http://www.hq.nasa.gov/hq/orgchart.htm http://www.gsfc.nasa.gov/indepth/about_facilities.html 5 http://history.nasa.gov/brief.html 4 The GSFC contracts 25 major companies to assist GSFC in building their designs. The top three highest paid contracted companies are Boeing Satellite Systems, Inc., Lockheed Martin Corp., and Raytheon Information Systems Co. Employment of their workforce consists of both Civil Servants and Contract Personnel creating a total workforce of over 10,000 people, 52% of which consists of GSFC’s workforce of Scientists and Engineers.6 Figure 2 shows the department infrastructure of the GSFC. The last row in the table show all the project and organizations that make up the GSFC. The director of GSFC is Mr. A.V. Diaz. Our project advisor, Mr. Kilroy, works under the Applied Engineering and Technology Directorate (AETD) who “provides business and institutional support and services necessary for the successful accomplishment of the center’s earth science, space science, and technology management activities”. 7 Figure 2: GSFC Infrastructure8 6 http://www.gsfc.nasa.gov/indepth/about_wfdata.html http://www.gsfc.nasa.gov/indepth/about_contractors.html 7 http://www.gsfc.nasa.gov/indepth/org_listing.html http://www.gsfc.nasa.gov/gsfc_orgpage.html 8 http://www.gsfc.nasa.gov/org_chart_lrg.jpg 10 All the projects, organizations, and subdivisions are coded with a three digit number (100, 213, 428, etc). The AETD is coded with the number 500 and our advisor works under the subdivision coded 560, Electrical Systems Center. Under 560, he works in a specific group coded 568, Flight Systems Integration and Test Branch. His job is to oversee the integration and testing (INT) of hardware and make adjustments to correct any design or manufacturing concerns. Types of testing include thermal cycling, vacuum test, vibration test, Electromagnetic Interference (EMI) and Electromagnetic Compatibility (EMC). The process of INT determines if the hardware will successfully perform in space conditions (low earth orbit) before launching. 9 2.3 SimSat The Simulated Satellite (SimSat) program is an educational outreach to middle and high school students. It provides an opportunity for students to learn and experience first hand the design, building and flying of experimental payloads. The project was developed by Mr. Patrick Kilroy of NASA’s GSFC in 1995. The concept began with a similar educational program called “Hitchhiker”. The Hitchhiker program was a way for students to become involved in educational hands-on projects at NASA. Students were allowed to design and build experiments that would fit into a 55 gallon drum size container to be brought into space via the space shuttle. The time associated with launching and recovering experiments turned out to be problematic for students. In some cases, students began a project during high school and graduated prior to obtaining the results of their experiment. Mr. Patrick Kilroy’s proposed SimSat solution would solve the time constraint problem and provide quick results for the students. “The mission of SimSat is to provide the vehicle that allows the student to build, fly and recover a simple scientific experiment of his or her own design or group design, to experience first hand some fundamentals of payload flight operations, and to peer into a number of career choices in aerospace and related fields.” (Patrick Kilroy, 2001) SimSat uses a high altitude weather balloon as the carrier and is tethered to the payload (Figure 3). The SimSat vehicle enables students the opportunity to fly their experiments at high altitudes that exhibit similar characteristics to that of space. The benefits of SimSat above the Hitchhiker program are that students are able to develop an experiment, fly it, retrieve it, and possibly re-fly it all within a relatively short period of time. 9 http://www.gsfc.nasa.gov/indepth/org_listing.html http://www.gsfc.nasa.gov/gsfc_orgpage.html 11 Figure 3: The SimSat Flight Train The final product of SimSat will be a system that middle schools and high schools can use to develop and carryout experiments along with the mentorship of NASA. Students will be able to follow design ideas and instructions for payload development (such as CO2 sensors), the construction of a base (tracking and data receiving) station, and the launch of their payload. During flight students will be able to receive realtime positioning data, track its telemetry, and retrieve the payload once the flight is complete.10 2.4 Prototype Development Two previous major qualifying projects have been completed by WPI students at the Goddard Space Flight Center developing the SimSat prototype. The first MQP project group was successful in completing their overall goals to create a prototype payload that would sense and record the attitude of the SimSat flight train during its flight. Although their system accomplished the project goals, the components selected to implement the design limited the prototypes expandability. The second MQP 10 Paredes, Eduardo, Buchholz, Brooke. “SimSat Attitude Determination and Reporting,” 2003. 12 project addressed the issues of the limited expandability of the SimSat Prototype and decided to redesign it using components that would provide much better system performance and room for expandability. 2.4.1 Previous Prototype – 2001 MQP Project A WPI major qualifying project with SimSat was previously completed in the fall of 2001 at GSFC. The overall goal of the project was to develop, build, and evaluate a prototype payload that would sense and record the attitude of the SimSat flight train during its flight. A block diagram showing the flow of data in the system is seen in Figure 4. Figure 4: System Block diagram of 2001 MQP11 The inputs on the left of the block diagram connect to the PIC 16F877 microcontroller each through its own specific interface. The GPS receiver and EZ-Compass interface to the microcontroller using serial communications, while the analog signals from the photodiodes, temperature sensors, and voltage dividers interface through a digital to analog converter. The PIC then processes this data and outputs the temperature measurements, attitude data, and GPS information into a non-volatile flash memory storage device (Caldwell, Pelteku, Woodacre, 2001). Figure 5 shows the completed 2001 SimSat prototype. 11 Caldwell, Pelteku, Woodacre, 2001 13 Figure 5: Picture of the completed, assembled system without casing12 The individual components of the completed system are further specified as follows. 1. Power supply • Battery pack containing eight 1.5V AA batteries 2. EZ-Compass • Produces information about pitch, roll, azimuth, and temperature as outputs • Figure 6 shows a photograph of an EZ-Compass module Figure 6: Picture of the EZ-Compass13 3. Photodiodes – Spin Rate Determination • Four photodiodes, one on each side of the payload box • The photodiode that senses the most light produces the highest voltage and is assumed to be facing the sun 4. Garmin GPS 25 HVS receiver 12 13 Caldwell, Pelteku, Woodacre, 2001 Caldwell, Pelteku, Woodacre, 2001 14 • Uses the standard NMEA 0183 protocol for data output • Figure 7 shows a photograph of the Garmin GPS receiver used in the 2001 prototype Figure 7: Picture of the GPS receiver14 5. TMP36 temperature sensor • One used inside the SimSat capsule for a housekeeping function to ensure that the payload is operating in the acceptable temperature range for all the components • One attached to the outside of the capsule for experimental purposes 6. Voltage divider • Used to monitor battery voltages into the system, part of the housekeeping function • If any problems arise with the battery voltage or the temperature inside the capsule, some parts of the system may be shut down 2.4.2 Current Prototype Status - 2003 MQP Project The second WPI MQP with SimSat was previously completed in the fall of 2003 at GSFC with the purpose to design and build the SimSat “base” payload that will be part of every SimSat flight.10 The main goals for this project were to implement attitude determination to understand the movements of the payload during its flight, record GPS information for tracking, record temperature information both inside and outside the SimSat payload capsule, store data in onboard memory and develop the SimSat Attitude Approximation Recording and Playback (SAARP) protocol for data storage, and transmit data to ground stations via packet radio using the SAARP protocol.15 The functional system block diagram in Figure 8 shows the flow of data in the new prototype system. 14 15 Caldwell, Pelteku, Woodacre, 2001 Paredes, Eduardo, Buchholz, Brooke. “SimSat Attitude Determination and Reporting,” 2003. 15 Figure 8: System Block Diagram16 Both the compass and GPS modules connect directly to the flight computer through RS-232 serial communication and are each considered modules of the system. The remaining analog sensors such as the temperature sensor and photo resisters connect to the PCB and are fed into the analog to digital converter and are grouped into a single module. The outputs of the ADC are then connected in parallel to the flight computer. The output of the flight computer is stored on compact flash during flight, and can be PC interfaced for post flight data transfer. Also implemented into the system is the SAARP protocol for radio transmission of GPS tracking information, however there is no communications module integrated into the system to transmit the data.17 Figure 9 shows the completed SimSat prototype at the conclusion of the 2003 MQP 16 17 Paredes, Eduardo, Buchholz, Brooke. “SimSat Attitude Determination and Reporting,” 2003 Paredes, Eduardo, Buchholz, Brooke. “SimSat Attitude Determination and Reporting,” 2003 16 Figure 9: Completed SAARP System18 The 4 individual modules of the completed system are further specified as follows. 1. Flight Computer – Arbor EmCORE-i411 o Extensive I/O (Serial, USB, Parallel, Ethernet) o 32MB onboard DRAM, and 512MB Compact Flash o OS – Slackware 8.1 Linux distribution o Figure 10 shows a picture of the flight computer Figure 10: Arbor EmCORE-i411 Flight Computer19 18 19 Paredes, Eduardo, Buchholz, Brooke. “SimSat Attitude Determination and Reporting,” 2003 Paredes, Eduardo, Buchholz, Brooke. “SimSat Attitude Determination and Reporting,” 2003 17 2. GPS Receiver – Garmin GPS-25-HVS o RS-232 serial communication using NMEA 0183 Sentences o Global Positioning System Fix Data (GGA) string o Figure 11 shows a picture of the GPS receiver Figure 11: Garmin GPS-25-HVS Receiver20 3. Compass – EZ-Compass-3 o 3-axis magnetometer o RS-232 serial communication o Update rate of 4Hz o Figure 12 shows a picture of the EZ-Compass circuit Figure 12: EZ-Compass-3attitude sensor circuit21 4. PCB Interface for Analog Sensors 20 21 o Photoresistors – Determine spin rate o AD590 Temperature Sensors Paredes, Eduardo, Buchholz, Brooke. “SimSat Attitude Determination and Reporting,” 2003 Caldwell, Pelteku, Woodacre, 2001 18 o Analog to Digital Converter – 16 Available inputs with parallel interface to SBC o Figure 13 shows a picture of the analog interface board Figure 13: PCB Interface for analog sensors22 2.4.3 Summary Two previous WPI student MQP projects were completed with GSFC for the development of the SimSat prototype. The first prototype designed by the 2001 MQP team was functional and served as a proof of concept for an embedded system capable of meeting the requirements of the SimSat project. However, it was not practical as a final system as it was not expandable. The second MQP project built upon the foundations of the previous project and designed a more robust system that provides greater expandability and has an integrated communications interface. The current prototype consists of components are satisfactory for a final system as they meet all requirements of the SimSat project with room for expansion. 2.5 Balloon 1.0 As a proof of concept and to gather information on what others have done, we researched similar projects that utilized high altitude weather balloons. Balloon 1.0 was an experiment that consisted of a payload 22 Paredes, Eduardo, Buchholz, Brooke. “SimSat Attitude Determination and Reporting,” 2003 19 tethered to a weather balloon that used similar system components as the SimSat prototype.23 The main objective of Balloon 1.0 was to launch a system that was able to calculate and transmit real-time positioning data for tracking of the balloon during flight. The system was composed of a flight computer, a GPS receiver, and a communications sub system.13 The information we gathered through the examination of this project provided us with considerable knowledge of possible ways to implement a communications system for the SimSat prototype. We also learned how a system of comparable power draw to that of the SimSat prototype can be managed for the duration of a weather balloon flight. And lastly, we acquired a brief look into possible ways to graphically track the balloon during flight on a computer located at the base station. 2.5.1 Top Level System Description The main components of the system were the flight computer, the GPS receiver, and the communications subsystem, shown in Figure 14. The flight computer was a Soekris Engineering Net4511 board with an AMD 486 processor operating at 100MHz, 32 MB RAM, mini-PCI slot, PC card slot, CompactFlash slot, two Ethernet ports, and a single serial port (Meehan, 2002). The GPS receiver was a Garmin GPS-35HVS that used the NMEA 0183 standard format (Meehan, 2002). The flight computer was responsible for the control of the system; it received information coming from the GPS receiver, manipulated the data, and outputted it to the communications subsystem to be transmitted for tracking. 13 GPS RECEIVER (Garmin GPS-35-HVS) FLIGHT UNIT COMM. SUBSYSTEM (Soekris Engineering Net4511) (TNC & Amateur Radio XMTR ) Figure 14: Balloon V1.0 System Diagram 2.5.2 Communications Subsystem The communications subsystem utilized amateur packet radio, and the following flow of information is how the position is transmitted, as shown in Figure 15. The information from the GPS receiver was received by the flight computer and ready for transmission. The flight computer then sent the data to a terminal node controller (TNC) to convert the data into packets for transmission. The data packets were then transmitted using an armature radio transmitter that made use of a j-pole antenna for broadcasting.24 23 24 Meehan, James. “Balloon 1.0” January 9, 2002. Retrieved April 15, 2004 Meehan, James. “Balloon 1.0” January 9, 2002. Retrieved April 15, 2004 20 The information received from the Garmin GPS-35-HVS receiver is in the standard NMEA 0183 format, which contains information such as altitude, latitude, longitude, and Greenwich Mean Time (GMT) that is contained in a string of characters. The flight computer then parsed the data using a GPSD program that translates the positional data into a simplified format that can be more easily used by other programs. The flight computer then converts the data into a packet radio format called Automatic Position Reporting System (APRS), which is commonly used for the transmission of location data via the AX.25 protocol. Once the data was in the correct format, it was outputted to a Katronics KPC-3+ TNC for packet transfer. Lastly the data was sent to a Yaesu VX-1R transmitter for broadcasting. Figure 15: Balloon V1.0 Communication Subsystem Diagram On the receiving end, the base station acquired the packet data similarly using an amateur radio receiver and a TNC. The APRS packets were then displayed on a computer using two programs, APRSPoint and Microsoft MapPoint. Each position transmission received was superimposed onto a map for a real-time visualization of the flight path. 2.5.3 Power Management It was determined that the power requirements for the system were to sustain a 12 to 15 VDC supply for the duration of the flight because most of the components operated in this voltage range. to have little weight and to be small in size, and to be able to survive the environmental characteristics that they would be exposed to.14 He chose to use Lithium Batteries because they provide the highest power to weight ratio, and operate well at low temperatures compared to standard consumer batteries. Military Surplus BA-5513 Lithium Battery packs from S&G Photographic Equipment were selected as the power supply. The battery backs are composed of ten 3V, 7.5A-hour batteries which are approximately the same size as standard “D” cells. 14 Five batteries from this battery pack, weighing a total of 0.45kg,25 were used to power the entire Balloon 1.0 payload. 25 Paredes, Eduardo, Buchholz, Brooke. “SimSat Attitude Determination and Reporting,” 2003. 21 2.5.4 Flight Analysis and Results The overall objective of the Balloon 1.0 experiment was successful. During the flight, the payload transmitted positioning data that was received and superimposed the information onto a map. The engineer was able to track the payload in real-time during the flight. The problems that occurred with the system primarily were encountered during landing. The impact caused some of the components to short, and connections between devices were severed. The successes of this experiment serve as a proof of concept for our SimSat project. 2.6 Amateur Radio and Packet Radio: Amateur Radio is a hobby for people who use a personal radio station to communicate, purely for noncommercial purposes, with other amateur radio operators.26 This hobby is open to anyone regardless of age or skill. Amateur Radio allows operators to transmit radio-waves for communication of voice and digital data over short and great distances. One type of digital data communication is Packet Radio. The sending of digital data from one computer to another computer using radio-wave communication as the transfer median is known as Packet Radio. Before the internet, Packet Radio was a way of transferring data and messages between users over great distances. Services like electronic messaging (E-mail), instant messengers, and newsgroups are all features of Packet Radio. Even though the technology of the internet has made all these features accessible faster, there is still a great use for packet radio especially for private or point-to-point communications. The technology of GPS integrated with Packet Radio allows for a user position to be sent and recorded by others without the necessity of an internet connection. In the event of an emergency, Packet Radio can also be used for sending long text data, such as a list of names or supplies, and locations to emergency groups when internet and telephone services can not be guaranteed upon. Amateur Radio is not limited to communications for two or more locations on earth. Airplanes and satellites can use higher frequencies (any frequencies above 30MHz) to communicate with ground stations throughout the atmosphere, ionosphere and outer space. 2.6.1 Terminal Node Controller The computer (or terminal) to radio interface is what makes Packet Radio. This interface is known as the Terminal Node Controller or TNC. Figure 16 shows the structure of the TNC when connected between a 26 Pg 1.1: The ARRL Handbook for Radio Amateurs; ARRL – Copyright 1994 22 computer and a radio. The data from the computer (or terminal) must first be converted into packets. These packets, using the AX.25 protocol, allow for small amounts of data to be transferred over the radiowaves efficiently and effectively with as little error as possible. Figure 16: Flow diagram of a TNC27 Data conversion is done through the packet assembler-disassemble (PAD) circuit within the TNC. Once assembled, the packets are then processed though a modulator to convert the digital data signals into an audio signal for transfer thought the radio. Another radio (packet station) then receives the audio signals, demodulates the audio signals, disassembles the packet data and finally sends the original data into the computer (or terminal). 2.6.2 AX.25 The Amateur Packet Radio Link Layer Protocol, also known as AX.25, is commonly used in Packet Radio. The protocol is recognized standard for controlling the transfer of packets. AX.25 has the control ability to communicate with multiple stations at the same time using either half-duplex or full-duplex. Operators using AX.25 can send packets without the necessity of having an accepted connection of another station. This would allow Packet Radio operators the ability to send CQs (request contact), transmit beacon signals and chat with a large number of stations. Amateur Radio, regulated by the FCC (Part 97), requires each station to identify at certain times during a contact. The AX.25 protocol accounts for this identify requirement within its protocol by adding the sending and receiving call signs on every packet sent. This feature doubles for addressing when connecting to multiple packet stations. The AX.25 protocol itself takes the sending data and transforms the information into smaller blocks to provide error checking of the data. The protocol has three fundamental frame types; Information frame (I frame), Supervisory frame (S frame), and Unnumbered frame (U frame).28 Figure 17 shows each frame as a visual layout. 27 28 2-2: Practical Packet Radio, Stan Horzepa, WA1LOU; ARRL - Copyright 1995 Pg A-1: Practical Packet Radio, Stan Horzepa, WA1LOU; ARRL - Copyright 1995 23 Figure 17: Layout Format for each AX.25 Frame29 Each frame has its own function in the AX.25 protocol. Supervisory frames are used to control the connection status between packet radio stations. The frame has three major subfields labeled as Received Not Ready (RNR), Receive Ready (RR) and Reject (REJ). These subfields can tell the TNC and/or terminal whether the receiving station is busy (RNR), or ready to receive more data (RR), or the receiving station has rejected the packet and requests for the packet to be resent (REJ). The Unnumbered frames carry out five Supervisory functions and one for unconnected transmissions.30 The six frames are defined as follows: • Set Asynchronous Balance Mode (SABM) – This frame displays that a connection was made between two packet stations. • Disconnect (DISC) – This frame displays that the connection between two packet stations has been terminated • Unnumbered Acknowledge (UI) – This frame displays that a SABM or DISC had been received by the packet station. 29 30 Pg A-2: Practical Packet Radio, Stan Horzepa, WA1LOU; ARRL - Copyright 1995 Pg A-3: Practical Packet Radio, Stan Horzepa, WA1LOU; ARRL - Copyright 1995 24 • Disconnected Mode (DM) – In the event that the receiving station is busy or unable to accept a connection, the station rejects the SABM frame by sending a DM frame. • Frame Reject (FRMR) – This frame displays that the sent and resent packet are not the same and that the packet itself will rejected and deleted. • Unnumbered Information (UI) – This frame allows for data to be transmitted without the SAMB connection first being established. The information field contains the actual user data that is being transmitted. This field sends sequential addressed packets to identify which order the packet are assembled in. Since there is no error correction with unconnected packet, whatever information is sent will be accepted by the receiving packet station regardless of errors. 2.6.3 SAARP Protocol The SAARP protocol was developed by Brooke T. Buchholz and Eduardo J. Paredes during the 2003 WPI/NASA SimSat MQP. The protocol allows for all necessary housekeeping data and flight information to be sent in an organized decipherable format. This information will be transmitted over packet radio to the ground station to keep a real-time watch on the SimSat while in flight. The following below is the format for SARRP protocol31: $<Date>,<Time>,<GPS Time>,<Latitude>,<Latitude Hemisphere>,<Longitude>,<Longitude Hemisphere>, <Altitude>,<Roll>,<Pitch>,<Heading>,<Spin Rate>,<Compass Temperature>, <T1>,<T2>, <T3>, <T4>,<HK1>,<HK2>,<CR><LF> • SBC system date (UTC): dd/mm/yyyy (10B) • SBC system time (UTC): hh:mm:ss.sss (12B) • GPS-25 satellite acquisition time: hhmmss (6B) • GPS-25 latitude (degrees, minutes): ddmm.mmmm (9B) • GPS-25 latitude hemisphere (N, S): H (1B) • GPS-25 longitude (degrees, minutes): ddmm.mmmm (9B) • GPS-25 longitude hemisphere (W, E): H (1B) • GPS-25 altitude above sea level (km): hhhhh.h (7B) • EZ-Compass roll (degrees): (-)xx.xx (6B) 31 SimSat Attitude Determination and Reporting, Buchholz and Paredes; WPI - Copyright 2003 25 • EZ-Compass pitch (degrees): (-)xx.xx (6B) • EZ-Compass heading (degrees): xxx.x (5B) • Spin rate (degrees/second): (-)xxx.xx (7B) • EZ-Compass temperature (°C): (-)xx.x (5B) • T1, T2, T3, T4 temperatures (°C): (-)xx.x (5B each) • HK1, HK2 battery voltages (volts): vv.vv (5B each) • Delimiters: “,” (18B) • Miscellaneous Characters: “$”, <CR>,<LF> (3B) The total length of one complete SAARP string is 135B. 2.6.4 FCC Regulation Amateur Radio is regulated by the Federal Communication Commission (FCC) under the part 97 (Amateur Radio Service) regulations32. The FCC does permit the use of digital communication, in the form of packets, to be sent over Amateur Radio frequencies. However, there are certain rules we must observe when transmitting in the Amateur band. The operator of a radio and/or station must have a valid Amateur Radio operator’s license and have a valid call sign. Since, we will be operating in the VHF/UHF band, the radio operator must have at least a Technicians Class license. The SimSat itself must have a call sign when communication to the ground station. 2.7 Summary The background information presented in this section provides a foundation for our project. We began by describing the status of the current SimSat prototype where the 2003 MQP ended. We discussed similar research that had been conducted in weather balloon and payload design, which provides a proof of concept for our prototype. And lastly we explained the details of amateur radio and packet radio, which we will use extensively in our project. The knowledge that we obtained in our preliminary research will aid us in completing our project goals. 32 The FCC Rule Book, FCC/ARRL-1993 26 3 Project Statement The main goal of this project was to design, build, test, document, and fly a SimSat payload for high school students to replicate. To fulfill this goal, we used the concept of the Stanford CricketSat system (which includes the flight unit and ground station) to create our own “next generation” CricketSat system called CricketSat II+. Test flights of our product took place at Wallops Flight Facility. If time permitted, we would pursue our secondary goal on the SimSat Attitude Approximation Recording and Playback (SAARP) system. 3.1 Project Modification The original goal of our project was to complete the SimSat Attitude Approximation Recording and Playback (SAARP) system developed by the previous year’s MQP project. However, after a few weeks on the project at NASA Goddard, Mr. Pat Kilroy presented us with a change in the scope of the project to meet the time constraints set forth by SimSat’s flight schedule. Our choice was to either continue working on the SAARP development or “switch gears” completely to develop a necessary educational payload for testing with the upcoming flights. After we consulted with Mr. Kilroy and our WPI Advisors, we agreed to develop the educational payload and, if time permitted, to pursue working on the SAARP system development. 3.2 Primary Objectives and Tasks These are the primary objectives and tasks that had to be completed: 1. Understand the current hardware and software system of CricketSat. a. Review the Stanford documentation about CricketSat. b. Study hardware schematics and software code. 2. Assemble the Stanford CricketSat system. a. Breadboard the CricketSat system - Including both the flight unit and the ground station b. Test flight unit system for functionality. c. Test ground station unit for functionality d. Address and debug any discovered issues. 3. Design a “Next Generation” CricketSat (a.k.a. CricketSat II+). a. Identify new features for CricketSat II+. b. Research possible design solutions. 27 c. Propose a workable solution and finalize the design 4. Assemble the WPI CricketSat II+ system a. Breadboard the CricketSat II+ system. b. Test flight unit system for functionality. c. Test ground station unit for functionality d. Address and debug any discovered issues. 5. System Integration and Test. a. Assemble the Stanford CricketSat into a single stand alone system. b. Assemble the WPI CricketSat II+ into a single stand alone system. c. Test both stand alone systems for functionally. d. Perform environmental testing. e. Address and debug any discovered issues. 6. Test Fight of SimSat-1 a. Prepare a launch procedure for CricketSat II+ b. Obtain launch permission at Wallops Fight Facility. c. Attend and conduct the flight of SimSat-1 d. Record and document data acquired from flight. The design parameters of CricketSat II+ were limited to no more than 1 cubic foot of volume and have a mass of no more than 1 kilogram. The reason for these restrictions was the fact that the weather balloon is designed to lift small payloads. Also, all individual components of the final design must be able to withstand the harsh environment typical found during flight. Described in past MQP’s, this environment consists of a temperature of -50oC, pressure of 10 millibars, vibrations caused by high wind speeds, and high levels of radiation (Caldwell, Pelteku, Woodacre, 2001) 3.3 Secondary Objectives and Tasks After achieving all the primary goals, and time permitted, the secondary goal could then be addressed. The secondary goal would be to bring closure to the SAARP system developed by previous WPI MQP students. It is desired to have the system operational and debugged in order for the system to be used for future SimSat flights. 1. Understand the current hardware and software system of the prototype. a. Read and evaluate last years MQP. b. Meet with last years MQP team to obtain information on functional/non-functional components. 28 c. Study hardware schematics and software code. 2. Debug existing problems of the prototype. a. Test system for functionality. (First test all components individually, then test them collectively as a functioning system) b. Address any issues from the previous MQP. 3. Test each algorithm individually. 4. Test software system once integrated together. 3.4 Summary Our first task was to understand the workings of the Stanford CricketSat system and fabricate a working flight ready model. Then, using the information acquired from the Stanford CricketSat system, we would develop, design, and fabricate a “Next Generation" CricketSat system. Since there are many possible solutions to the problem, we would determine which one is best for our application based on cost, simplicity and the time available for our project. Once the two systems were flight ready, we would conduct an actual test flight of both systems at Wallops Flight Facility and record any information gathered during the test flight. We planed on successfully accomplishing our primary goals and hoped to have time enough to work on our secondary goals. 29 4 Methodology This chapter discusses the procedure that was followed in the development of our system in order to meet the project goals and objectives. As our project was modified midstream, we had an aggressive schedule to follow so that we would successfully complete our design within the time available and be prepared for the SimSat-1 test flights. We were facing the task of bringing a project from birth to launch in less then five weeks. 4.1 “Birth to Launch” All projects at NASA follow, what is commonly referred to as, a “Birth to Launch” process. Each step of the process allows the opportunity for project developers to either refine an original concept or make critical decisions as to the viability of the project, either in part or as a whole, to proceed any further. The lessons learned and reported along the way can be used, at the very least, to enhance similar project concepts, avoid future conceptual pit falls and encourage the development of some currently missing technology or component. The process eventually leads project developers, and other interested parties, to accept a final deliverable that meets realistic expectations. The major steps in this process are listed as follows: • Conceptual Idea • Research • Design Concept • Prototype • Debug • Fabrication • Integration and Test (I&T) • Calibration • Launch • Analysis This MQP project was conducted using this same process approach. Subsequent sections of this report give a more in-depth account of how this methodology was i mplemented and the lessons learned from each step of the process. 30 4.2 Summary Our MQP project for the development of the CricketSat II+ system was conducted following the same guidelines that govern most long-term projects at NASA. We developed the idea of what it was that we would like to design, we then conducted researched to gain factual knowledge about the goals of our project. Once the design requirements were finalized, we moved on to the development of a design concept. The design concept included schematics, simulation results, and supplementary data gathered through additional research. Following multiple design reviews where the ideas are critiqued and refined, the design is finalized and given the go ahead for beginning the prototype. Once the proof of concept prototype was assembled and debugged, the decision is made to finalize the system and mark it as completed. The fabrication phase includes the design of printed circuit boards and the physical construction of the components. Once the flight units have been assembled, they are put through a series of environmental and operational tests to ensure proper functionality on the day of the flight. The last step prior to launch is to calibrate the system. This is when tests are conducted to verify the operation of the system in comparison to the mathematical model. This step helps to minimize the error in data measurements that may be due to tolerances in the electronic components. Finally the system is required to carry out its purpose to fly on a SimSat balloon flight and transmit real-time telemetry. Once the test flights are concluded, the collected data is analyzed and conclusions are drawn from the results. 31 5 Stanford CricketSat System The Stanford CricketSat, created by Professor Bob Twiggs, is a simple and inexpensive system used to educate students about data telemetry. The system is composed of two parts: the flight unit and the ground station. The purpose of the flight unit is to determine the current altitude of the balloon by reading the outside temperature and transmit the temperature in the form of an audio tone. This audio tone is then received and decoded by the ground station where the temperature is displayed to the user numerically on a computer. The altitude of the balloon is then approximated using an atmospheric model. An illustration of the CricketSat concept is shown in Figure 18 to create a better visual of the overall idea. Figure 18: CricketSat Concept 5.1 Flight Unit The flight unit itself has three main components: a temperature sensor, an oscillator to generate the audio tone, and a transmitter to send the telemetry. Figure 19 shows the block diagram of the flight unit. Figure 19: CricketSat Flight Unit Block Diagram 32 5.1.1 NTC Thermistor The temperature reading is acquired by the use of the thermistor. A thermistor is a temperature sensitive resistor that changes resistance values with respect to its surrounding external temperature changes. Thermistors can have either a negative temperature coefficient (NTC) or positive temperature coefficient (PTC) depending on the user specifications. For example, as the exterior temperature of an NTC thermistor increases the resulting resistance value of the thermistor decreases (i.e., negative coefficient) and vice versa. A PTC thermistor’s resistance value will increase as the external temperature increases (i.e., positive coefficient) and vice versa. CricketSat uses a NTC thermistor with a room temperature value of 10k ohms. The resistive characteristic of the NTC thermistor that we used in the CricketSat flight units is sown in Figure 20. Figure 20: Resitive Characteristics of YSI44006 NTC Thermistor 5.1.2 Oscillator The flight unit uses a single 555 timer in order to create the oscillating tones. The timer for CricketSat is configured to operate as an astable multivibrator (shown in Figure 21) which uses two external resistors (i.e., R1 & R2) values and one capacitor (C) value to control both the oscillating frequency and the duty 33 cycle. The resulting output will be a continuous repeating square wave switching from 0 to 5vdc at a specified frequency. Inputting this square wave into an audio speaker will create an audible tone. Figure 21: Astable Multivibrator The output frequency (f) and duty cycle (D) of a 555 timer is computed utilizing the following equations: f = 1 0.693 ⋅ C ⋅ (R1 + 2 ⋅ R 2 ) D= R1 + R 2 R1 + 2 ⋅ R 2 When the timer is used, with fixed values for R1, R2, and C, it will output only a square wave, determined with the above equation as having a specific frequency resultant of “f.” Substituting R1 or R2 with a variable resistor (e.g., a potentiometer) it will allow the timer frequency output to change over a range of frequencies depending of the range of resistance values for that variable resistor. The thermistor itself acts as a variable resistor providing us with a method to track the change in the temperature of the thermistor as the frequency changes. The CricketSat design implements this variable timer by placing a NTC thermistor into the R1 position of the 555 timer. Now, as the temperature of the thermistor increases, the resistance of the thermistor will decrease causing the output frequency of the 555 timer to increase and vice versa. This relationship provides the basis for the conversation between temperature and frequency. 5.1.3 Transmitter The final part of the flight unit is the radio transmitter. The transmitter’s job is to send the square wave tone from the flight unit to the ground station by use of RF frequencies. This provides the user at the ground station with the ability to perform real-time tracking of the temperature. The CricketSat design uses a 433MHz Data Transmitter module (TX433) that provides a peek output power of 400mW. It is 34 very similar to the transmitters found in a garage door opener. The TX433 is perfect for this application because it is small, light weight, inexpensive and simple to use. Only 4 pins are required for operation of the transmitter. The square wave tone output from the 555 timer is inputted into pin 2 (i.e., data in) of the transmitter. Pin 1 and 4 provide the transmitter with connections for connecting a small antenna. Finally, a VCC power supply ranging from 2 to 12VDC is applied to pin 3 to provide operation power to the transmitter. 5.1.4 Summary The CricketSat flight unit is a design that is quite simple and contains only three main components. The components include a temperature sensor that is a NTC thermistor, an astable multivibrator that generate the audio tone, and a transmitter. A schematic of the CricketSat flight unit is shown in Figure 22. An assembled CricketSat flight unit that was used in the SimSat-1B test flight is shown in Figure 23. Figure 22: CricketSat Flight Unit Schematic 35 Figure 23: Completed CricketSat Flight Unit 5.2 Ground Station The ground station has four main components: the antenna, the radio receiver, the Parallax Board of Education (BOE) and the Basic Stamp software. Figure 24 shows the block diagram of the flight unit. Figure 24: CricketSat Ground Station Block Diagram 5.2.1 Antenna In order to receive the signal from the flight unit’s transmitter, a 433MHz high gain radio antenna is required. This antenna amplifies very weak signals, but only in the direction that the antenna is pointing. CricketSat uses this type of antenna because the transmitter output power is very weak (i.e., only 400mW). The antenna is connected to the radio receiver by the use of feed line, which is commonly a 50 ohm coax cable. 36 5.2.2 Radio Receiver The purpose of the radio receiver is to convert the received RF information, sent by the transmitter, back into its original audible form. Both the transmitter and the receiver must be tuned or calibrated to the same frequency in order to correctly receive the transmitted square wave tone. The final step of the receiver is to output the square wave tone to an external speaker jack for connection into the Parallax BOE. 5.2.3 Parallax Board of Education (BOE) The Parallax Board of Education (BOE) is an educational board that provides the user with the functionality of a miniature processor (i.e., Basic Stamp chip) for processing input signals and generating output signlals. The BOE uses a data 9 pin serial port for easy programming and debugging of the Basic Stamp chip and its signals. The board also features a built-in breadboard that is directly wired to different ports of the processor CricketSat uses the BOE to convert the square wave tone into a numeric value. The processor, with the use of a comparator and some low pass filters, counts the number of 0-1-0 or 1-0-1 cycles of the square wave for a specified amount of time. The number of cycles counted is the frequency of the inputted tone. This numeric value can then either be printed on a computer screen or plotted using the Basic Stamp Graph Plotting software. 5.3 Results The written documentation for the flight unit only pertained to information about the assembly of the circuit and did not elaborate upon the operational workings of the circuit. The ground station documentation gave useful information about receiving signals from the flight unit using Amateur Radio equipment. Very little information was given about the use of the Parallax BOE and the Basic Stamp Software except for a schematic and some uncommented code. Most of the pictures displayed in the manual were beneficial towards building the flight unit and ground station, but had no illustration on the operation of the system. Assembly the flight unit was accomplished with relatively few problems. The RF chokes used in the circuit were found to be very important for removing RF interference from affecting the components on the board. It also provides the transmitter with an active high signal to keep the transmitter continually transmitting when the 555 timer’s output is low (i.e., 0). The transmitter’s frequency was difficult to 37 locate because the true transmit frequency was above or below the specified frequency set by the manufacture. The device does not provided any tuning capabilities to compensate for this drift. Assembly of the physical ground station was straightforward, but operation of the ground station equipment, specifically the conversion from tone to numeric value, proved to be tricky and inaccurate. We believe the root cause for this deficiency is when the signal, received by the radio, is sent into the comparator circuit on the BOE board. Investigating the input and output of the comparator circuit using an oscilloscope showed that the signal was being hindered by low frequency noise in the communication channel, as illustrated in the Figure 25. This causes the Basic Stamp chip to miscount zero crossings (i.e., 0-1-0 or 1-0-1) cycles of the input square wave. The miscount alters the final result that is sent and Amplitude displayed on the computer. Time Figure 25: Miscount Zero Crossings (BOE) 5.4 Summary The goal of the CricketSat system is to estimate the current altitude of the balloon using the outside temperature in the form of an audio tone. After reviewing the CricketSat system, we are confident that the concept is basic and simple enough for High School level students to understand. Also, the design and construction of both the flight unit and ground station are simple enough to replicate with parts available at a local computer or electronics hardware store (e.g., Radio Shack). We did, however, encounter difficulties understanding the written documentation provided for CricketSat system and discovered issues with the operation of the flight unit and ground station. However, the CricketSat documentation issues can be improved by providing more information pertaining not only to the assembly but operation of the flight unit and ground station. Improving the flight unit’s transmitter to a more robust radio will eliminate tuning problems and, at the same time, will probably increase the 38 maximum output power. The ground station could be fixed by adding a sharp, high pass, filter to the comparator circuit to eliminate the low frequency noise. This, unfortunately, will cause a range reduction at the lowest end the tone can attain. We feel the ground station should be redesign to allow for a more functional and accurate conversation. 39 6 WPI CricketSat II+ The goal of the WPI CricketSat II+ was to enhance the design of the Stanford University CricketSat while preserving simplicity. This “Next Generation” CricketSat will offer the student with more informational feedback from the flight unit, a more accurate ground station, and better documentation of the assembly and operation of the system. 6.1 Design Requirements After examining the Stanford CricketSat design, we created, in collaboration with our principal investigator, the following design requirements with quantifiable specifications that the CricketSat II+ system must comply with. 6.1.1 Flight Unit 1. Enhance the Stanford CricketSat design while preserving simplicity: High school students with no formal engineering education will attempt to build and understand the completed flight unit design. Selected parts must be easily obtainable, preferably those available at a local Radio Shack. 2. Beacon three Tones: Available frequency range, 800Hz to 5800Hz a. Outside air temperature: Audio tone that varies frequency as a function of temperature. Temperature range, -60°C to 25°C. b. Inside air temperature: Audio tone that varies frequency as a function of temperature. Temperature range, -60°C to 25°C. c. Reference tone: Audio tone that is fixed at a known frequency for ground station calibration. d. Mix of three: As an experiment, the flight unit must generate and transmit an audio mix of the three individual tones. 3. Provide means for identification: The flight unit must identify the licensed Amateur Radio operator responsible for the transmission. 4. Implement a “push-to-talk’ (PTT) controller: To interface the flight unit to Amateur Radio transmitters, it must provide PTT control signals to “key the microphone”. 5. Must be easily interfaced with most amateur radio transmitters: This will allow potential high school students to interface the flight unit to their specific radio using information located in the user manual of the radio and the provided documentation for the CricketSat II+ flight unit. 40 6. Not sensitive to temperature change: The flight unit will be exposed to potential temperatures from -60°C to 25°C. It must continue to operate in a stable condition with high tolerances to cold temperature. 7. Low power consumption: The flight unit must operate for duration of 4 hours while supplied with an 8 pack of AA Lithium-Ion batteries. 8. Low mass: Mass less than 1.5 kg. 9. Small size: Must fit inside a 512in2 Styrofoam container. 6.1.2 Ground Station 1. Improve ground station accuracy while reducing cost: High school students may not have funds to purchase an expensive piece of electronics for the purpose of the ground station. Therefore the CricketSat II+ ground station must use readable available components and freeware software. 2. Eliminate the Board of Education: Use only a PC equipped with a sound card opposed to the ~$120 BOE which also requires the use of a PC. 3. Use freeware software to measure and record transmitted data: The received audio will be sampled by the PC sound card and graphically displayed using freeware software. 6.1.3 Summary The overall goal of the development of the CricketSat II+ system was to enhance the original Stanford CricketSat design while preserving simplicity. To accomplish this goal we identified several areas of the CricketSat design that could be expanded upon and improved. We decided to transmit multiple audio tones that would represent different temperatures along with a mix and a reference audio tone. This goal led to the specific temperature range that must be covered. The goal to be easily interfaced with most Amateur Radio transmitters led to the requirements for the push-to-talk control, the frequency range that the audio tones would span, and the requirement for the means to identify the licensed operator. The inherent goal to adhere to NASA safety and performance guidelines led to the requirements for all the physical aspects of the flight unit design. The CricketSat II+ flight unit must be able to successfully function for the duration of a short-term sub-orbital flight. This meant that the unit must have low power consumption, small dimensions, low mass, and a great tolerance to extreme temperature changes. 41 6.2 Flight Unit This section explains in detail the design of the CricketSat II+ flight unit. The flight unit consists of four main subsystems and an external transmitter and antenna. The subsystems include the tone generation voice identification, audio distribution, and transmitter interface. Within the tone generation subsystem are three individual astable multivibrators and an analog mixer to generate the audio tones. The voice identification subsystem consists of the ChipCorder and the supporting circuitry to control the playback. The audio distribution subsystem is the heart of the CricketSat II+ flight unit. It is responsible for generating all control signals that are required by other subsystems, it controls which audio source to transmit and for how long, and it is responsible for controlling the interface to the external transmitter. The transmitter interface controls the final signal levels that will be sent to the transmitter and includes the specific circuitry required by the transmitter that is being interfaced. A system block diagram of the CricketSat II+ is shown in Figure 26. Figure 26: CricketSat II+ Flight Unit Block Diagram 6.2.1 Tone Generators The Stanford CricketSat design used 555 Timers as oscillators to convert the temperature reading from a thermistor into an audio tone. Since this design proved to be functional, the decision was made to utilize the same conversion method and adapted the design to work within project specifications. Designing the tone generators required defining two critical specifications: the temperature and frequency range. After meeting with Mr. Kilroy and discussing some options, the tone frequency range was defined 42 as ranging between 800Hz and 5800Hz. This frequency range was chosen because common amateur radio frequency analysis software operates within that frequency range. The balloon caring the flight unit is expected to reach an altitude of approximately 100,000 ft. Atmosphere models, like the one shown in Figure 27, show that the air temperature between ground level and 100,000 ft ranges between 15ºC to -58 ºC. Thus the thermistors for this project were required to function accurately within this temperature range. The most readably available thermistors for immediate use were the model YSI44006 thermistor, who’s resistive characteristics are shown in Figure 28. It provides a 10K resistance at 25 ºC with a resistance tolerance of 1%, which allows for a ±0.2ºC accuracy in temperature. With the established frequency and temperature specifications detailed in section 6.1, a frequency signal of 800Hz was correlated to the -60ºC temperature bench mark while 5.8kHz was correlated to signifying a temperature of 30ºC, the resultant temperature frequency relationship is shown in Figure 29. Temp (°C) 0 -60 100,000 Altitude (ft) Figure 27: Atomosphic Temperature Model 43 Figure 28: Resistive Characteristics of YSI44006 NTC Thermistor Figure 29: Frequency Temperature Relationship The original Stanford CricketSat design utilized a single tone generator and only to measure the outside air temperature. As specified in section 6.1, the requirements for this project call for three separate and distinct tones to accommodate measurement of outdoor air temperature (TOA), measurement of indoor – 44 payload - air temperature (TIA) and one tone to act as a reference tone (REF) for radio calibration. These three tones were generated by utilizing three separate tone generators, two of which would be associated with individual thermistors and the reference tone associated with a fixed value resistor. The reference tone was necessary to provide a method for calibration for stations receiving the signal to ensure that they were receiving the correct tone frequency. To maintain the consistency in the frequency of the audio tones relative to the other tone generators, all three were designed with similar component values. An isolated circuit showing an individual tone generator is shown in Figure 30. The schematic for the entire tone generation subsystem can be found in Appendix A. Figure 30: Audio Tone Generator Circuit 6.2.2 Audio Mixer As an additional experiment to transmitting the individual tones in a sequenced schedule, the three tones were combined for simultaneous transmitting. A simply method to combine the analog audio tones was through an audio mixer. The audio mixer is a circuit that combines multiple input signals into one output signal (MIX). This type of circuit is commonly referred to as a “weighted summer circuit” because the output voltage is a “weighted sum” of the input signals. The circuit uses a 741 Op-amp in the inverted configuration with resistors at each input signal to control the impedance and level of the signals, the mixer circuit is shown in Figure 31. 45 Figure 31: Analog Mixer Circuit 6.2.3 Voice Identifier To provide a means for identifying the licensed amateur radio operator who is responsible for the transmission of the data, a voice identification signal was incorporated into the signal sequence. The design of this subsystem was influenced by our principal investigator, Mr. Kilroy, to have a vocal playback device that would identify the station call-sign and provide enough message length to promote the SimSat educational program during the flight. With weight and size limitations, the use of a cassette tape recorder or other off the shelf recording and playback device would not be suitable. Also, the audio device had to be capable of playing back a message of at least 10 seconds in length and was required to repeat the message periodically for the duration of the flight. The most suitable component that we found that could meet all of the requirements was a digital voice recorder IC chip, or ChipCorder. The first selection for the voice recorder chip was RadioShack ISD 1000A because it could be purchased at a local distributor, but more importantly it had a 20 second record time, which was more than was needed. However, it turned out that this chip was discontinued by the manufacturer and no alternative chips like it was sold by RadioShack. The next step was to contact the original equipment manufacturer (OEM) of the ISD voice recoding chip in search for a possible substitute. The ISD chip that was to be purchased was made by a company called Winbond Electronics Corp, who distributes their chips to many major catalog distributors including DigiKey and Mouser. Winbond’s substitute for the ISD 1000A was the ISD1400, which also recorded up 46 to 20 seconds of audio. This chip provided all the same features as the OEM predecessor chip and more, including a 1µA low power standby mode when the device that was discontinued. The full schematic of the ISD ChipCorder can be found in Appendix A. 6.2.4 Audio Distribution The audio distribution subsystem is ultimately responsible for routing the different audio signals to the transmitter. To achieve this operation, there is circuitry for the timing of the audio signals, the addressing of the audio signals, and additional circuitry for the push to talk control and all other control signals required to operate the CricketSat II+ system. The five audio sources that are routed by means of the audio distribution subsystem are the reference (REF) tone, the inside air temperature (IAT) tone, the outside air temperature (OAT) tone, the analog audio mix (MIX) signal, and the voice ID signal. The block diagram shown in Figure 32 shows the basic flow of data while a complete circuit schematic can be found in Appendix A. Figure 32: CricketSat II+ Audio Distribution Block Diagram 6.2.4.1 Clock. The clock circuit is used to provide a square wave signal to all parts of the audio distributor. The changing state of the clock controls when the subsystem should switch to output another signal. The frequency of the clock is controlled by one half of a 556 Timer (i.e., a dual 555 timer). Just like the tone generators, the frequency of the clock is controlled by resistors, Ra and Rb, and capacitor C. Since the voice ID required the longest transmission time of approximately 12 seconds, therefore, this time period established the minimum cycle period the clock had to be set for each signal transmission. Additional cycle time was added (~3 or 4 seconds) to reduce any time shifting that could occur due to the 47 temperature conditions inside the payload. The final clock frequency was set at 1/15 Hz or 15 seconds per transition. 6.2.4.2 Addressing Each signal was assigned a specific state by which the designated signal could be accepted for transmission. A 4-bit binary counter (i.e., CD4029) was used to assign each state with a respective address. The transition from state to state was controlled by the clock causing the counter to increment up by one every 15 seconds. Figure 33 shows the Audio Distribution Control Logic for each state. All together there are a total of 10 states (0-9) representing five silences and five signals. State 0 1 2 3 4 5 6 7 8 9 Q3 0 0 0 0 0 0 0 0 0 1 Q2 0 0 0 0 1 1 1 1 0 0 Q1 Q0 Signal transmitted Additional Control Signals 0 0 Silence 0 1 Reference Tone Push to Talk 1 0 Silence 1 1 Outside Air Temp Push to Talk 0 0 Silence 0 1 Inside Air Temp Push to Talk 1 0 Silence 1 1 Mix Push to Talk 0 0 Silence 0 1 Voice ID Push to Talk, Voice ID Play Figure 33: Audio Distribution Control Logic 6.2.4.3 Signal Selection Direct routing of each signal into the transmitter was done by using an analog multiplexer (i.e., CD4051). The multiplexer has the ability to input up to 8 analog signals and output one of the 8 signals depending on the three control address inputs. The control address inputs are connected to the three most significant bits Q3, Q2, and Q1 of the 4-bit counter. The multiplexer switches signals after every two cycles of the clock. 6.2.4.4 Control Signals Additional control signals were required to trigger or activate the 4-bit counter, voice ID, and transmitter. The 4-bit counter resets back to state 0 immediately after state 9 and repeats the entire sequence over until the power to the flight unit is turned off. This same reset is also used to reset the multiplexer back to the first signal after the fifth signal. 48 The voice ID’s chip uses a “play” trigger to begin the playback of the recorded audio. Since this event takes place at state 9, we use the combination of Q0 and Q3 with an “AND gate” to trigger “play” on the chip. This use of the AND gate ensures that the chip will be triggered only when both Q0 and Q3 have the value of 1 (or +5V). The transmitter requires a control signal to activate the “push-to-talk” and allow the inputted audio to be transmitted. The silence was added into the routine to create a pause in between each signal transition in order to allow the user at the ground station to determine when a signal had stopped and started. The silence was implemented by assigning Q0 to the push-to-talk control line on the transmitter. This allowed the counter to control when the transmitter was on or off depending upon the state of Q0. 6.2.5 Transmitter Interface To complete the CricketSat II+ system the output was interfaced with a transmitter. To accomplish this, the output is passed as an audio signal into a transmitter through the microphone input. There are several factors that were considered when interfacing the CricketSat II+ system to a transmitter. The input frequency range of the transmitter was verified to accept the frequency range of the generated tones. The signal levels to the transmitter input were scaled to be within the specified radio limits. For the low-pass filter, the components to set the 3dB frequency at 6000Hz were calculated. And to make the electrical connection to the transmitter, the circuitry was designed to modify the specific microphone circuit required by the radio to join to the flight unit. To ensure proper audio levels for the input of the transmitter, we consulted the KPC-3 Packet Controller manual. This manual contains information about how to use the controller, but more importantly, it covers the interfacing of many popular radio brands including Kenwood, Yaesu, ICOM, and RadioShack. According to the manual, when data is sent from the data controller to the transmitter, the audio level is assigned to a default level of 50mV peak-to-peak (p-t-p) regardless of radio. Unless specified otherwise in the user manual of the radio, this was the signal level that was within safe limits. To be consistent, the final output audio level for the CricketSat II+ flight unit was designed to 50mV p-t-p. The signal conditioning circuit that was used to set the level of the output audio signals is shown in Figure 34. 49 Figure 34: Signal Conditioning for Transmitter Interface The circuitry required to connect CricketSat II+ takes the audio output of the system and routes it into the transmitter via the microphone input. The microphone circuitry is unique to transmitter manufacturers and can also vary among models within a manufacturer. Most manufacturers will provide a circuit in the user manual that describes how to connect a microphone to their specific transmitter. Figure 35 shows an example of a microphone circuit for the Radio Shack HTX-200. The microphone circuit is the foundation for designing the interface to CricketSat II+. Figure 35: Microphone Interface for HTX-200 Radio The functionality of the microphone circuit is as follows. The transmitter produces a DC voltage at the tip, which is dropped across the load resistor. The microphone acts as a capacitor that AC couples an audio signal into the DC voltage. The AC voltage is the varying signal that is transmitted by the radio. The Push-to-Talk (PTT) is effectively a switch that disconnects the Tip from the input audio, which toggles the transmitting. To interface CricketSat II+ with the HTX-200, there are few changes in the microphone circuit. The audio signal is inputted through a capacitor in series which AC couples into the DC bias voltage similar to a microphone. And the PTT switch is implemented with an electronic solid state MOSFET, which acts like a switch. The transmitter interface for the CricketSat II+ flight unit to the Radio Shack HTX-200 is shown in Figure 36. 50 Figure 36: CricketSat II+ Interface for HTX-200 Radio To make the CricketSat II+ flight unit easily interfaced with many different transmitters we implement a bread board directly onto the PCB board because many transmitters have unique microphone circuits. This allows the user to build the interface circuit for any radio transmitter physically located on the flight unit. The bread board is a matrix of through holes with a dimension of 8 x 14 holes. Also, extra large size holes were added at the edge of the board to allow for stress relieving for the long connector cable between the board and the transmitter. For simplicity, we supplied four traces (i.e., Vcc, ground, audio output, and push-to-talk (PTT)) for the bread board which allows for quick interface connection. A full schematic of the transmitter interface can be found in Appendix A. 6.3 Design of the Ground Station The Stanford CricketSat design used a Parallax Board of Education (BOE) to convert the audio tone received by the radio receiver into a numeric value to determine the balloon altitude. After testing the BOE, we had discovered an inaccuracy in the conversion from the audio tone to the numeric value. Instead of trying to improve the accuracy, we decided to replace the BOE with a computer running software package(s) to analyze the signal. This change will not only improve accuracy of the ground station but also eliminate the $100+ cost of the BOE The new CricketSat II+ ground station block diagram is shown in Figure 37. Three are three main parts to the new ground station, the receiver (including the antenna), the computer, and the software. 51 Figure 37: CricketSat II+ Ground Station Block Diagram 6.3.1 Receiver Receiving the signal from the flight unit can be accomplished using any amateur radio antenna or radio. Two general types of antennas that could be used are a directional or omni-directional antenna. An omnidirectional antenna can be used when the output power of the flight unit transmitter is greater then 2W. Directional antennas, called Yagi antennas, are ideal for low power transmitters (typically used in flight units) because they are capable of amplifying very small signals. Regardless of the power level, it is recommended to use a directional antenna to ensure that your signal is received regardless of transmit power. The radio receiver is the component in the system that demodulates the VHF or UHF signal (sent by the flight unit transmitter) and outputs the temperature audio tone. The radio itself can either be a handheld, mobile, or base station radio depending on your power requirements. A handheld radio is able to operate on its own internal battery. Mobile and base station radio require an external power source such as an AC power generator or a DC power supply. We recommend that the radio chosen for the ground station has the Minimum specifications listed below: • Receives Amateur Radio frequencies (VHF and/or UHF). • Receives NFM modulation • Minimum frequency step size, 5kHz • SO-239, SMA, BNC, etc connection for external antenna • Audio output jack for computer/laptop 52 6.3.2 Computer The ground station requires the use of at least one laptop or desktop computer in order to run the signal analysis and audio recording software. Choosing between a laptop or desktop depends upon necessary mobility of the ground station such as the availability of an external power source. The computer must have the following minimum specifications: • A 200MHz PC (laptop or desktop) with Windows installed (98SE and up) • A soundcard with an audio input resolution of 16 bits • A color graphics mode with at least 640*480 pixels with 256 colors (a graphics mode with higher resolution and "true color" is preferred, and even required under WinXP) 6.3.3 Signal Analysis and Audio Recording Software The new ground station software will provide both real-time and post-processing of the signal. The software will replace the BOE functions by provide a visual decoding of the frequency on the computer, known as a waterfall spectrum analyzer, A new function that will be add is the audio recording of the input audio signal to allow future review of the flight. As part of the software requirement, we needed to find program(s) that would not only perform these tasks but be cost-free with and have no user limitations. Our search of the internet showed that many waterfall spectrum analyzers available online where created by members of the Amateur Radio community. Waterfall spectrum analyzers allow the computer’s user to visually interpret the signal’s energy level over a large range of frequencies. The software can analyze an audio signal originating from a computer’s soundcard (microphone) or a prerecorded audio file. The energy level of a signal is denoted by a color(s) changes in the scrolling window. We were able to locate 5 programs that could be used as the spectrum analyzer. A review of each software title can be found in the appendix. Three of the five programs were free to download and use with no limitations such as time trials or blocked features. The titles of these programs are DigiPan, SpecTran, and Spectrum Lab. After reviewing each program, we decided to use a program called Spectrum Laboratory (SpecLab) because it provides many features that the other titles had lacked. The program design by Wolfgang Büscher features: • Waterfall spectrum display • Adjustable frequency range 53 • Energy level color adjustor • Audio recorder and playback • Peak frequency detector • Spectrum data logger (logs peak frequency) • Spectrum image snapshot The program can be downloaded from www.qst.net/dl4fh/spectral.html. The setup and operation of this software can be found in the attached Ground Station Manual. 6.4 Prototype Testing and Results Once the design of the flight unit and ground station was complete, we needed to prototype our new design to ensure proper operation before finalizing the design. First, we tested the flight unit design by building the circuit on a protoboard, as shown in Figure 38. Figure 38: CricketSat II+ Flight Unit Proof of Concept The circuit was first powered with the use of a variable DC power supply conserve our supply of batteries and test overall power draw. Testing of the prototype began with the checking of signals at different inputs and outputs using an oscilloscope to verify that the correct signals were being passed. All signals were correctly passing through the circuit except for the mixing op-amp. We discovered that the particular op-amp were using was a dual supply op-amp thus prohibiting the output signal to reach 0v. Once the prototype flight unit was operational, we then tested the new ground station using the Spectrum Lab software. The radio link between the flight unit and the ground station was tested using a RadioShack HTX-200 (flight unit) and a Yeasu VX-7 (ground station). The circuit interface for the 54 external microphone port and the external speaker port were found in the manuals provided with the radios. We ran the prototype flight unit for several hours to determine the best software configuration for Spec Lab and tested the additional features of the program (such as the waterfall spectrum, the peak frequency detector, and the spectrum data logger). The logger provides the users with a time stamped log of the peak frequency during the flight. Figure 39 shows a plot of the resulting data obtained from the program’s spectrum data logger. As you can see, the plot shows the peak frequency of each tone in the entire sequence (Ref, TOA, TOI, MIX, ID) repeated three times with a time stamp provided at each reading. Figure 39: Recoded Data from SpecLab The program had proved to be very capable in detecting the peak frequency and logging the result for each tone (not including the ID) except the forth tone in the sequence, the Mix. When the program searches for the peak frequency, it looks at the energy level of all the frequencies and associates the peak frequency with the frequency having the highest energy level. Since the Mix signal has three tones combined into one, we noticed that each tone in the Mix did not have the same energy level. As a result the program only detected one tone during the mix. We decided to ignore this complication because it was more important that the program detect the peak frequency of the first three tones in the sequence. 55 6.5 Integration and Testing (I&T) 6.5.1 Fabrication Once our flight unit prototype had worked successfully and schematic design was finalized, we needed to package the circuit on to a board for insertion into the payload capsule. The capsule’s interior size was very limited (10”x10”x10”?) so we needed to ensure the board dimensions were as small as possible. The Stanford CricketSat flight unit was assembled on a small perf board with “through hole plating” which was able to accommodate the entire circuit including the transmitter and antenna. We determined that using a perf board for our circuit was impossible because the circuit design is more complex then the Stanford design and wiring the board would be very time consuming and can increase the probability of making a mistake. Debugging will also be very difficult with the numerous amounts of leads to check. In order to get the three required working flight units ready for the upcoming launch in less then 2 weeks, we decided to layout our circuit on a printed circuit board (PCB). Our PCB was created by a company called ExpressPCB. This company is capable of taking a circuit design and producing small quantities (22000+) of two or four layer circuit boards within a short “turn around” time of 2 or 10 days. They provide users with two free CAD programs called ExpressSCH and ExpressPCB that allow the user to layout a schematic of the circuit and design the layout of the board. The program features a large component library, schematic to PCB node verifier, automatic bill of materials list with up-to-date pricing, and online ordering with instant quotes. Designing the layout of the board took us very little time to create since the program was very simple to use. The completed layout design consisted of a two-layered board that was approximately 6.25”x4/5” in size. The total cost of producing 10 boards with a two day “turn around” was $370 and delivery of the boards took only a few business days. After the boards arrived, we traced the lead connections at every node to ensure no mistakes in the circuit were made. We found no errors in the layout of the board. 6.5.2 Assembly of the Flight Unit Assembling the flight unit requires the soldering of all components on the parts list and cables onto the breadboard. This is possible because the flight unit was integrated onto a PCB board, which includes all circuit traces connecting each component together. The PCB board has every part outlined and labeled providing easy assembly. Each part is assigned a label with the letter defining what type of part it is, such as R for resistor, C for capacitors, and D for diode. 56 The flight unit requires the fabrication of four cables, which are exterior to the board, in order to interface the power supply, transmitter and the two thermistors with the board. All cables were made using thin gage wire (i.e., 18-22 AWG) and twisted together to form one cable. The cable for the transmitter required a 3.5mm connector to be plugged into the audio input jack. The thermistors were attached to the cable by soldering the leads to the wire and heat shrinking each lead to ensure that they do not touch and cause a short. The power supply cable did not require any special connectors since it is connected to the main power line of the payload package upon assembly. Soldering each component onto the board is very simple and can be done by almost anyone. The first step is soldering all the IC chips onto the board because their leads are small and require the most attention. Then populate one section of the board by completing that section before moving to another next section. Also, the value of each resistor and capacitor was verified and recorded before they were inserted onto the board. This practice allowed us to test each subsystem (e.g., tone generators, clock, etc) to ensure that it was operating properly. Once the board was populated, the cables were attached to the board. The bigger holes on the edge of the board provide opportunity to loop the cables through them. This acted as the stress relieving mechanism for potential disconnection in case the cables were pulled or stretched by some unknown force. Figure 40 shows a picture of the three completed flight units. Figure 40: Completed CricketSat II+ Flight Units 57 6.5.3 Assembly of the Ground Station The physical assembly of the ground station requires the antenna to be attached to the radio and the radio’s audio output (speaker) be linked to the computer’s soundcard (microphone). It is necessary to check what connectors are on the antenna and radio in order to determine which cable and/or adaptor to purchase. The manual provide with your antenna and radio will specify the connector type. The most commonly used connectors are PL-259, BNC, SMA, and N connectors. If the connectors on the radio and antenna differ, you will need to purchase an adaptor for your cable. Cables and adaptors can be purchased from any Amateur Radio distributor. The plug connector for the receiver’s speaker jack will differ depending on the radio. Most radios have a 1/8” audio jack that you can simply plug into. However, there are radios that require special connectors (ex 4-condutor jack) to extract the output audio from the radio. The manual provided with your radio will explain to you how to connect to the output speaker port. The computer’s microphone port uses a 1/8” mono audio jack which needs a 1/8 mono plug cable. This cable is readily available at Radio Shack. Finally, we connected the radio’s speaker cable to the computer’s microphone cable by either adapting or splicing the cable(s). A picture of the assembled CricketSat II+ ground station is shown in Figure 41. Figure 41: CricketSat II+ Assembled Ground Station 58 6.6 Calibration After populating the boards, we needed to conduct a calibration test to verify that each complete flight unit was operational. The purpose of the test was to ensure that the flight units were transmitting accurate temperature readings from data received at the thermistors. The test composed of exposing the two external thermistors on each flight unit to three different known temperatures points; room temperature (~22ºC), ice (0ºC), and dry ice (-78.5 ºC). These three temperatures were chosen because they are capable of testing the functional operating range of the flight unit as it would be during flight. The test was performed in our lab since we could verify that the temperature of the room was 22 ºC with the aid of a thermometer. Each flight unit was tested individually for temperature readings at room temperature and ice. However, dry ice could not be tested due to time constraints of the launch and the time required obtaining a block of dry ice. Nonetheless, with the collected data at the two different temperatures, we were able to show that the output of the CricketSat II+ system was accurate with our expected frequency values. 6.7 Summary The overall goal to enhance the original Stanford CricketSat design while preserving simplicity was successfully accomplished in the design of the WPI CricketSat II+. The Flight unit boasts an additional temperature sensor for the monitoring of multiple locations, such as inside and outside air temperature. The flight unit transmits a fixed reference tone at a known frequency for the purpose of grond station calibration and authenticating the transmitted information. The CricketSat II+ flight unit provides a means for voice identification which allows the amateur radio operator to beacon their call sign as well as pitch a small promotional for the SimSat program. The flight unit also implements push-to-talk control for interfacing with many different amateur radio transmitters. Being able to use off the shelf hand-held radios allows for a much higher transmit power than that of the original CricketSat transmitter (garage door opener). All of these improvements were made to the original CricketSat concept while preserving simplicity through the design and components chosen. The goal to simplify the Stanford CricketSat ground station while improving accuracy and reducing cost sounds like a goal that is impractical. We however were able to reduce the required investment cost by ~$120, and vastly improve the performance. The performance increase came from making the switch from counting zero-crossings to determine frequency of an audio tone to a software program that utilizes frequency analysis to determine the frequency of an audio tone. 59 7 Test Flight of SimSat-1 7.1 Facilities and Services The test fights for SimSat-1A and SimSat-1B took place at NASA’s Wallops Flight Facility, which is located near Wallops Island, Virginia. Wallops Flight Facility provides testing, launch, and operations of suborbital and other small orbital payloads developed by NASA or other groups (e.g., industry and academia) for the prescribed purpose of advancing science and technology. Their facility features a launch range, research airport, machine shop and radar tracking. Telemetry support, consisting of radar and GPS devices, were used to track the position of the balloon during the test flight. Some of these same devices are used to track the path of rockets that are launched from the facility. Due to scheduling conflicts, SimSat-1A utilized only GPS tracking while SimSat-1B utilized both radar and GPS tracking. 7.2 Purpose of the Test flights SimSat-1 consisted of two test fights that were designated as SimSat-1A and SimSat-1B. The primary purpose of the SimSat-1 test fights is to help develop the appropriate method and training materials on how to launch a weather balloon with an attached SimSat payload. These flights were to be the first of possibly four SimSat experimental flights to also test and explore different SimSat payload options. As part of SimSat-1, CricketSat II+ acted as a “hitchhiker” on this test flight as an aid to providing more useful real-time telemetry then would be possible with the Stanford CricketSat system. One of the objectives to this MQP was to confirm and demonstrate the flight and operational capability of the CricketSat II+ system. In order to prove operational worthiness, the flight unit had to communicate with the ground station and relay accurate temperature information as designed. Our CricketSat II+ flight unit was part of the payload on both SimSat-1 test flights. The SimSat-1 test flights were launched from a balloon shelter on the facility. The expectation called for the weather balloons to reach an altitude either equaling or exceeding 100,000ft. Upon reaching this altitude, the balloon would burst and the payload capsule would free fall back to earth. A parachute attached to the balloon cable was expected to open during payload decent and reduce the payload’s falling velocity for a low impact landing. The entire flight of the balloon and payload package should take approximately 2 to 3 hours from launch to landing. 60 7.3 Packaging of SimSat-1A and SimSat-1B The SimSat-1 payload containers were constructed in a box configuration made of Styrofoam similar in thickness to that used to preserve and transfer medical donor organs. The total volume of the boxes was approximately 1 cubic foot, but the interior dimensions varied based on foam panel’s thickness used for each box. Since our circuit board was very thin and small, there were no issues in fitting the flight unit into a box. The flight unit circuit board was strapped to a piece of Styrofoam which was then inserted into the box diagonally to provide a more secure and anchored fit into the box. The transmitter and power supply were also secured inside the box with the use of duck tape and hot glue. Mounted on the exterior of the box were noise-making buzzers and identification stickers to aid in the recovery of the payload box in case it is found by anyone outside of NASA’s Wallops Flight Facility. Two pictures shown in Figure 42 illustrate the packaging of the CricketSat II+ Flight Unit into the SimSat Styrofoam capsule. Two external thermistors from the flight unit were placed in the box to sense and indicate temperature readings outside and inside the payload package. A small hole was made through the side of the payload box to position the outside air temperature thermistor and then secured with hot glue. Inside the box, a thermistor was placed on the power supply to get reading of air temperature around the battery. Two different types of antennas were used for the SimSat payloads. The antenna used for SimSat-1A used a tall (~4ft) ground plane antenna, while SimSat-1B used a v-shaped antenna. Both antennas were placed so that they dangled outside the bottom of the box and secured with duct tape and hot glue. The payload of SimSat-1B contained additional items in addition to the CricketSat II+ flight unit. The Stanford CricketSat flight unit was added along with $50 worth of NASA goodies - which served as a consolation prize for anyone who recovered and returned the payload package. Figure 42: Packaging CricketSat II+ Flight Unit 61 7.4 Setup of the Ground Station The ground station for the CricketSat II+ system was laid-out on a long folding-table outside the staging building. The monitoring devices used for the ground station consisted of two laptops (both +1GHz), a Yaesu VX-7 handheld radio and an Arrow II directional antenna. Each laptop was utilized to perform a specific job to ensure the capture of any relevant data in the event of an unexpected computer failure. One laptop was assigned the job of running the spectrum analyzer software (i.e., Spec Lab) to decode the frequency of the received audio tones. The second laptop was responsible for recording the unaltered audio received by the handheld radio to provide future playback and means for post flight analysis of all radio signals received. The Arrow II antenna was attached to a camcorder tripod to serve as a movable stand. This provided flexibility to direct the antenna towards the strongest possible signal reception from the payload transmitter. The antenna was then connected to the VX-7 radio with a 15ft BNC cable. Meanwhile, the audio output from the radio was connected to the MIC input on both computers. Finally, AC power was provided to the laptops by a gasoline generator. All cables were secured to eliminate the possibility of disconnections. The picture of the assembled ground station is shown in Figure 41. 7.5 Flight Delayed On the morning for the first scheduled launch of SimSat-1A, preparations were made for testing the CricketSat II+ system before it was integrated into the flight unit within the SimSat payload. The preflight test included verifying the transmission capability between the flight unit and the ground station. Repeated and unsuccessful attempts were made in transmitting/receiving the audio tones from the flight unit (Kenwood THG-71A transmitter) to the ground station receiver. As a result, the launch of SimSat1A was postponed by one day until the problem could be isolated. To investigate the cause of the communication problem, the first diagnostic test involved directly observing the output signal from the flight unit. The results of this test indicated that the board was operating correctly, which meant that the problem must be with the transmitter or the transmitter/receiver interface. However, isolating the problem was more difficult than first perceived. A technician who had experience with handheld transmitters suggested an idea to test the input frequency range of the radio. To perform this test, two computers were used to simulate the functionality of a spectrum analyzer. One computer ran software configured to generate an audio tone with a frequency sweep from 0 to 8,000 Hz. This signal was sent to the microphone input of the flight unit transmitter. The receiver then outputted the demodulated audio signal to the microphone input of the second computer. The second computer was 62 running real-time spectrum analysis software that plotted the frequency content of the audio input. The results indicated that the input frequency range of the transmitter was limited to 4 kHz, which is below the established operating upper frequency of 5.8 kHz. This frequency limitation was designed into the radio receiver to allow functionality of other features such as an external remote control which sends signals through the audio input. As a solution to the problem, a Radio Shack HTX-200 2-meter (VHF) radio transmitter was used in place of the Kenwood THG-71A. The ability of the HTX-200 to transmit the required input frequency range was confirmed to be successful. 7.6 Results of First Test Flight: SimSat-1A The launch of SimSat-1A took place on September 30, 2004 at approximately 19:40:38 UTC. During the initial assent of the balloon, the flight unit suddenly ceased radio transmission. This loss of signal (LOS) lasted for about 40 seconds followed by a short duration strong signal then a subsequent LOS. The second LOS lasted for 16 minutes and 26 seconds before the ground station was able to reacquire the radio signal. Although the specific cause of the LOS is unknown, it is likely that the problem was attributed to the poor quality in the battery terminal connector. Immediately prior to launch it was observed that the connector would loose electrical contact if oriented in a certain way. It is highly possible that mechanical shock during the balloon release and ascent could have caused the power to become temporarily disconnected. Regardless, no further transmission failures occurred for the remainder of the flight. The entire flight from launch to landing lasted 2 hours and 28minutes. The indicated signal strength from the flight unit to the handheld radio remained strong (i.e., S9+) for the entire ascent and the majority of the decent. It was not until the end of the decent when the flight unit began to reach an angle close to the horizon that the signal strength began to weaken and completely fade away after landing. When the signal strength became weak, it was hard to decode the tones from the signal because of an increasing level of noise. A spectrogram plot shown in Figure 43 visually displays the frequency of the received audio tones versus mission elapsed time. It can be seen that there are 3 distinct audio tones that were received along with the voice identification that shows up as low frequency energy. As mentioned previously, one can see how the received audio becomes difficult to distinguish following the balloon burst. 63 Figure 43: Spectrogram Plot of SimSat-1A The received audio tones, as produced by the CricketSat II+ flight unit, appeared to be slightly unstable as their frequency was fluctuating graphically similar to that of a wiggled line (only ±100Hz). It is possible that vibrations caused by the motion of the payload during flight could have affected the flight unit board, the transmitter or the antenna. However, because the frequency fluctuation was small relative to the center frequency, the frequency of the received audio tone was recorded as an average of the frequency produced during its transmission state. This does not affect the accuracy of the system due to the nature of the temperature to altitude conversion being only an approximation and not a precise calculation. Data from the flight was later decoded by playing back the audio recording of the flight. The frequency of each state (i.e., Ref, OAT, and IAT) was decoded and logged into separate columns within a table. According to the collected information, the temperature inside the payload never dropped below 0ºC. As expected during the assent of the balloon, the outside temperature had decreased as it passed through the troposphere and lower stratosphere, but increased as the balloon passed though the upper stratosphere, shown in Figure 44. Utilizing the recorded data, an estimate of when the balloon “popped” and started its decent was computed. At approximately 1 hour and 37 minutes into the flight and an apogee of 114,000 feet, correlated to the sudden drop in outside temperature, the balloon popped. The subsequent decent of the payload to the point marked by the absence of any further radio transmission took approximately 49 minutes. (Note: LOS should not be interpreted as the point final landing.) 64 Figure 44: SimSat-1A Measured Outside Air Temperature Observation of the transmission period of the flight unit decreasing as the flight progressed suggests that the extreme cold temperature was affecting the RC timing constant of the Audio Distribution clock. As the inside air temperature of payload decreased, the total time of each cycle began to decrease. This caused the radio to stop transmitting prematurely at the end of each state. This means that even the small component tolerances in the metal film resistors and Tantalum capacitors could greatly affect the system performance. 7.7 Result of Second Test Flight: SimSat-1B The launch of SimSat-1B took place on October 1, 2004 at approximately 19:03:01 UTC. Approximately 10 minutes after launch, the transmission signal from the flight unit was lost. Unlike the flight of SimSat1A, there was no reacquisition of the signal from the flight unit for the duration of the flight. It was speculated that the additional items added to the payload of SimSat-1B may have disrupted the CricketSat II+ flight unit’s transmitter and/or battery pack cables resulting in system failure. However, because the Stanford CricketSat flight unit, which was also inside the SimSat-1B capsule, was running on its own power supply and transmitter, the problem that is attributed to the failure of the CricketSat II+ did not impact its operation. 65 The operability of the Stanford CricketSat system, while limited, prevented the total loss of valuable data from this test flight. The CricketSat II+ ground station was used to monitor the Stanford CricketSat system. As the balloon began its ascension and the ambient temperature began to drop, the simple fixed frequency transmitter used for the Stanford CricketSat system began to malfunction. This was determined after observing the fixed center frequency of the transmitter beginning to slowly decrease. Other ground stations, outside Wallops Flight Facility, also reported the same observation. Our ground station was not able to receive the signal because the radio receiver used was limited to a 5 kHz frequency step size when a smaller step size of 100 Hz was required to track the signals changing center frequency. Because of this, the data recorded during the flight was incomplete. The spectrogram plot in Figure 45 shows the received audio tone decreasing in frequency until the transmitter malfunctioned. Following the malfunction, the CricketSat II+ ground station was unable to successfully record the flight telemetry. Figure 45: Spectrogram Plot of SimSat-1B As supplemental telemetry for our experiment, radar tracking was provided for the SimSat-1B test fight by Wallops Radar station 18. This radar station was able to track the exact position and altitude of the balloon as well as provide a visual video feed of the balloon using a high power camera attached to the radar dish that was tracking the balloon. Analyzing the data produced by Radar station 18, a 3D model of the balloons flight path was created as shown in Figure 46. The radar data confirmed the computed apogee using the signaling information. Based on the radar data, the balloon had reached a zenith of 66 113,540 ft before popping and traveled a distance of 30 miles between the land base launch site and the ocean landing or splashdown. Although the SimSat-1B test flight appeared to be a failure at first glance when weighed against the telemetry copied during SimSat-1A, the additional radar data was very useful in our post flight analysis. WWF provided us with precise radar data for the duration of the flight. Using the supplied longitude, latitude, and altitude data, we generated the following 3-dimensional plot of the flight path for the SimSat-1B test flight shown in Figure 46. This plot reveals the type of motion that the flight train experiences during a typical high altitude balloon flight. This type of data is a preview of the sort of information that the SAARP system is capable of obtaining. Figure 46: SimSat-1B 3-D Flight Path 7.8 Summary Both of the SimSat-1 test flights were learning experiences. SimSat-1A was a successful flight in that we copied telemetry for the majority of the duration of the flight. The data was accurate with what we would expect and the system performed in compliance with its design. SimSat-1B was not as successful as the first test flight. It is arguable that the newly introduced variable to the second flight may have been the reason for the failure. The capsule was filled with NASA trinkets including cloths, hats, patched, stickers, 67 bags of dehydrated food, etc. The extra cargo in the capsule may have interfered with the operation of our flight unit or another critical component such as the radio transmitter or battery pack. Nevertheless, we copied telemetry from our secondary payload which was the original Stanford CricketSat. The lessons learned from the two test flights include that even the components with high temperature tolerances could fluctuate in the extreme low temperatures of the atmosphere. The connection to the batteries should be a secure connection that is guaranteed not to break. And lastly, be careful when placing passive items in the capsule next to crucial system electronics that may cause the system not to function (i.e. a metal object that could possible short connections on the flight unit PCB). 68 8 SAARP Closure Status As a secondary goal, the development of the SAARP system advanced as time permitted. There were periods of time during the development of the CricketSat II+ system when there was down time waiting for critical parts to arrive in the mail. During these times, we were able to focus on the SAARP system. Following our secondary goals that were outlined in Chapter 3 (Project Statement), we were interested in accessing the current status of the hardware and the software components of the SAARP system. Then to bring the overall system to a state of closure where there would be no pending problems with the operation of the system. This would allow subsequent MQP teams to continue development without the need to address existing problems from the past. 8.1 Hardware The primary focus of assessing the hardware of the SAARP system was insuring the integrity of the wiring in the connections as well as the ability for the system to function as it was intended. To evaluate the operation of the hardware it was broken into two components, the power system and the sensor I/O. 8.1.1 Physical Connections By means of visual inspection it was easily determined that all of the connections to power and sensors needed to be replaced. When looking at the Molex connectors that were used in the connections, we determined that the wire connections to the Molex pins were made in an inadequate method. The wires were soldered to the Molex pins and were then inserted into the Molex headers. The best method for wiring when using Molex type connectors is to use the accompanying Molex crimp tool that is designed for making secure connection to the Molex pins. A further observation that we made was that the type of Molex headers being used were not the most secure type available for this specific application. Although the mating connector that was mounted on the PCB supported pressure clips, the headers originally used were smooth, not utilizing this feature. This allowed the connectors to pull apart with the slightest stress applied to the wires. To improve the integrity of the hardware we purchased both the Molex crimper and the Molex headers that were equipped with the pressure clips and rewired all of the connections. 8.1.2 Power System The power system was examined by means of connecting the +5 volt supply and verifying that all components were functional. The system design as detailed in section 2.4.2 (Current Prototype Status 69 2003 MQP Project) breaks the power supply to the SAARP into two paths. One voltage regulator (LM7805) is used to source all of the sensors and analog components, while a dedicated voltage regulator (LM7805) supplies power to the SBC (Single Board Computer). It was found that the voltage regulator to the SBC was not sufficient to meet the power requirements of the SBC. After consulting with the members of the 2003 MQP team, we discovered that during development and testing of the SAARP the SBC was powered using an ATX compatible power supply, not the voltage regulator. After referring to both the specification sheets to the voltage regulator and the SBC, it was concluded that though the voltage regulator met the constant (steady-state) power requirements, it was not sufficient to supply the start-up transients of the SBC. To resolve this shortcoming, we purchased a 5 volt regulator (LM323T) that would be sufficient to supply power to the SBC during the high-power transient at start-up. 8.1.3 Sensor I/O The operation of the sensor I/O was tested using a combination of manufacturer supplied test software (for the PC) and test software onboard the SAARP that was written by the 2003 MQP team. First the manufacture test software (executed on a lab PC) was used to verify the correct operation of the sensors independent of the SAARP. This insured that any latter problems with sensor I/O when executed on the SAARP would be attributed to the software and not the sensor itself. Once the sensors operation was confirmed using the lab PC, they were tested using the SAARP. There was individual C program files located onboard the SAARP for testing the individual sensors. The programs essentially read data from the sensor and displayed it to the screen for a visual inspection of the information. If there were no discrepancies, the sensor I/O was deemed functional. In conclusion, all of the sensors were operational. 8.2 Software The primary focus of assessing the software of the SAARP system was to insure robust operation and verify that the output of the SAARP was concurrent with expected data. This is where the largest problem with the SAARP was identified. Approximately 45 seconds into the execution of the SAARP flight code, the SBC would experience a segmentation fault error and would crash. To recover from the crash, the entire system had to be hard rebooted by cycling the power to the SBC. Using our intuitive knowledge of computers we knew that segmentation fault errors may occur when trying to access information that is outside of the dynamically allocated memory for the program. We began to study the code for the SAARP and found two instances where data is accessed in an array (reading data from the EZ-compass and reading data from the GPS). A simple sanity check of commenting out the code in question and re-executing the SAARP code confirmed our initial diagnostic when the error was not 70 repeated. We concluded that the error was originating in both of those locations in the code. The reason why the segmentation fault was occurring was due to the parsing of the received data from the sensors when bad information was received. The existing error check scheme only compared the first character in the data string (always the same) and decided if the whole string was good or bad based on that first character. What was occurring was the first character would be correct, and the parsing algorithm would begin to parse bad data until trying to access a memory address that was outside of the array dimensions, causing the segmentation fault error. To correct this problem we developed a robust error check algorithm that was 100% guaranteed to only save good data from the sensors. After researching the specification sheets for the two sensors, it was found that both sensors were implementing a checksum feature and sending the result to the SAARP as part of the data string. The only thing left was to perform a checksum algorithm in the SAARP code to verify the information was correct. The algorithm consists of exclusively “OR-ing” all of the characters in the data string between the ‘$’ and the ‘*’ and comparing the result to the hex value of the last two characters in the data string (sample data string from the EZcompass: $R0.55P0.08T19.9C257.5*29). Once this was implemented in the code to read from both the EZ-compass and the GPS receiver, the SAARP was operational with no errors. 8.3 Testing and Results To test the overall functionality of the SAARP once all of the modifications were made to both hardware and software, we executed the SAARP code for a time duration that would simulate a balloon flight. The system was powered up and executed for approximately two hours and thirty minutes. The SAARP successfully ran for the entire duration of the test with no errors. Upon completing the test, the flight log data was observed to ensure that there were no discrepancies. The flight log data was as expected and the system is fully functional. In addition to the development to the SAARP, we developed software to perform post flight analysis of the data in the SAARP flight log. The program was written in Matlab and is an executable m-file. The input to the program is the directory and file name of the flight log that is to be analyzed. The output of the program is 18 plots that visually display all of the import data that is contained within the flight log, an example of two of the plots is shown in Figure 47. The program also provides an environment for further data analysis in Matlab, as all of the information has been parsed from the text file and is available in numeric vectors that can be easily manipulated to generate additional useful analysis information. 71 Figure 47: Sample Output from SAARP Analysis Software 8.4 Summary The SAARP has been brought to a state of closure. Closure is defined as a state in which there are no existing problems that will need to be addressed in order for the development of the system to continue. This was our intention as a secondary goal of our overall MQP project. Subsequent MQP teams that may work on further developing the SAARP will be able to focus on new endeavors and can be assured that the existing system is completely operational. In addition to the closure of the SAARP, we developed a powerful software analysis tool for analyzing the flight log data from the SAARP. This software will allow not only the ability to visually analyze the data but will also provide the analysts with all of the parsed text data in a numeric form that will lend itself nicely for further data analysis. 72 9 Discussion and Conclusions Once the development of our flight unit and ground station was finished, and the SimSat-1 test flights complete, it was necessary to analyze the actual outcome of the designs with the initial design requirements set forth by our principal investigator. This chapter will present a comparison of each design requirement with the actual outcome of the CricketSat II+ system. A similar comparison will also be presented of the outcomes to the development of the SAARP system to the secondary project goals. Furthermore, this chapter includes final conclusions about our project and suggestions for future work for both the CricketSat II+ system and the development of the SAARP. 9.1 Requirements Analysis (CricketSat II+) The requirements for the CricketSat II+ system were specified in chapter 7 of this report. Within this section is a review of each requirement and a conclusion as to its completion through our final system. 9.1.1 Flight Unit 1. Enhance the Stanford CricketSat design while preserving simplicity: High school students with no formal engineering education will attempt to build and understand the completed flight unit design. Selected parts must be easily obtainable, preferably those available at a local Radio Shack. This was the overall goal of the CricketSat II+ system. This goal was met in part by each of the design requirements as they all were generated from this original objective. Specifically this was accomplished in the nature of the flight unit design. The system was designed with mostly analog components and was kept clean and straight forward. Components such as microcontrollers were left outside of the design possibilities because an average high school student would not have the knowledge necessary to build a CricketSat II+ themselves. In some situations, the design was more difficult for us as engineers trying to maintain the simplicity. For example, most of the flight unit could be easily implemented using a microcontroller, but that would have defeated the purpose of this project. 2. Beacon three Tones: Available frequency range, 800Hz to 5800Hz a. Outside air temperature: Audio tone that frequency varies as a function of temperature. Temperature range, -60°C to 25°C. 73 b. Inside air temperature: Audio tone that frequency varies as a function of temperature. Temperature range, -60°C to 25°C. c. Reference tone: Audio tone that is fixed at a known frequency for ground station calibration. d. Mix of three: As an experiment, the flight unit must generate and transmit an audio mix of the three individual tones. The CricketSat II+ flight unit transmits four different audio tone sources. The temperature range requirements governed what type of NTC-thermistor would be used as the temperature sensor. The resistive characteristics of the thermistor then governed how to configure the frequency range for the audio tones. The result was an audio tone that varied from 800Hz to 5800Hz and represented a temperature range that spanned from -60°C to 25°C. The audio mix of the three tones was an experiment that would determine if it was necessary for multiplexing of the audio transmissions. If the three audio tones could be successfully determined at the ground station, the flight unit design could then be greatly simplified. 3. Provide means for identification: The flight unit must identify the licensed Amateur Radio operator responsible for the transmission. This requirement was met by the voice identification capabilities of the flight unit. A voice recorded message of length up to 20 seconds could be recorded pre-flight and would be transmitted during the flight once every 2 minutes and 30 seconds. This design feature also provided the opportunity for the principal investigator to include a “SimSat commercial” to promote the educational program and or to recognize any participating educational groups. 4. Implement a “push-to-talk’ (PTT) controller: To interface the flight unit to Amateur Radio transmitters, it must provide PTT control signals to “key the microphone”. The requirement to implement a push-to-talk controller was met by providing two different PTT signals. For easy interfacing to different types of radios, both an active high and an active low control signal is generated for the use in the interfacing circuitry. 5. Must be easily interfaced with most amateur radio transmitters: This will allow potential high school students to interface the flight unit to their specific radio using information located in the user manual of the radio and the provided documentation for the CricketSat II+ flight unit. 74 To make the CricketSat II+ flight unit easily interfaced with many types of Amateur Radio transmitters there were a couple of features included in the design. The first is the signal levels of the audio tones. The design allows all of the transmitted signal levels to be adjusted at a single gain stage that is configurable with a single resistor. There is also a configurable low-pass filter that can be used to remove high frequency content that may interfere with the transmitters’ ability to send clean signals. The final feature that makes interfacing an easy task is the incorporation of a bread board in the printed circuit board. There is a section of the PCB that is a small matrix of through holes that allows the interface circuitry to be placed on the PCB with the necessary signals close by. 6. Not sensitive to temperature change: The flight unit will be exposed to potential temperatures from -60°C to 25°C. It must continue to operate in a stable condition with high tolerances to cold temperature. To meet the requirement of not being sensitive to temperature change we used components that had high tolerance to temperature. The resisters were all metal film, and the capacitors were all Tantalum. By selecting components that exhibited these characteristics, we insured that critical components to the design such as timing circuits would be minimally affected by temperature changes. 7. Low power consumption: The flight unit must operate for duration of 4 hours while supplied with an 8 pack of AA Lithium-Ion batteries. To meet the requirement for low power consumption we chose components that were low power and designed the system to be as efficient as possible. For instance, the voice ID chip that was utilized in the design was configured in a way that was turned “on” only during the time the chip outputted its audio message and returned to a sleep status for the remained of the time. The total power consumption for the CricketSat II+ flight unit was approximately 30mW. 8. Low mass: Mass less than 1.5 kg. Our total mass is far less than the 1.5 kg limit. The CricketSat II+ flight unit exists on a single 2 layer PCB board with dimensions of approximately 4in. x 7in. 9. Small size: Must fit inside a 512in2 Styrofoam container. This requirement was meet with the size of the CricketSat II+ flight unit. It exists on a single PCB board with dimensions of approximately 4in. x 7in. The components protrude less than 1in. depth total. 75 9.1.2 Ground Station 1. Improve ground station accuracy while reducing cost: High school students may not have funds to purchase an expensive piece of electronics for the purpose of the ground station. Therefore the CricketSat II+ ground station must use readable available components and freeware software. This was the overall goal of the CricketSat II+ ground station. This requirement was met by eliminating the Board of Education. The BOE has a cost of approximately $120.00 for all of the required parts. This is not the only required component either. An Amateur Radio receiver, high-gain antenna, and personal computer are also required. The CricketSat II+ ground station consists of an Amateur Radio receiver, high-gain antenna, and personal computer. The accuracy of the CricketSat II+ ground station was improved by using frequency analysis software opposed to an analog zero-crossing detector (BOE). The BOE was prone to error with the presence of slight noise, while our ground station will successfully display a received audio tone even when it is not distinguishable by ear. 2. Eliminate the Board of Education: Use only a PC equipped with a sound card opposed to the ~$120 BOE which also requires the use of a PC. The requirement to eliminate the BOE was accomplished by changing the method in which the audio tone frequency is determined. Instead of using the method of counting zero-crossings and displaying the number of the counter per second on a plot (BOE) our ground station uses the PC sound card to sample the audio signal. Once the PC has converted the analog audio signal into digitized data, it can be recorded and analyzed in the PC using standard audio software. 3. Use freeware software to measure and record transmitted data: The received audio will be sampled by the PC sound card and graphically displayed using freeware software. This requirement was met by selecting a freeware audio program that was capable of performing the tasks that were necessary. Spectrum Laboratory was the program that was selected for use in the CricketSat II+ ground station. It was able to display real-time spectrogram plots of the incoming audio tones as well as record the information for post data analysis. 76 9.2 Secondary Goals Analysis (SAARP) The secondary goals for our project were specified in chapter 3 of this report. Within this section is a review of each goal and a conclusion as to its completion through the development of the SAARP that was accomplished. 1. Understand the current hardware and software system of the prototype. To begin work on the development of an application specific embedded system, it was crucial to fully understand all of the aspects of the design, both hardware and software. To accomplish this goal required lots of research and experimentation. We read the MQP report from the 2003 MQP team and studied the specifics of their design. We then studied the schematics of the hardware and the software code to become familiar with the system. To learn the software environment and the purpose of specific instructions, we generated test programs that simplified the code so that we could easily observe any outputs. Once we knew the system inside and out, we began to evaluate is performance and identified all of the current problems with the system. 2. Debug existing problems of the prototype. The problems that were successfully debugged included both hardware problems and software problems. We re-wired the hardware connections making the physical aspect of the SAARP more reliable and robust. We also identified a power supply issue with one of the voltage regulators to the single board computer, which was corrected by purchasing a more powerful voltage regulator. There were several problems with the SAARP software that we identified. These problems were corrected by implementing new error checking algorithms in the communications to two of the peripheral sensors. 3. Test each component individually. To ensure that the system was fully operational, we tested each component individually to verify its operation. We began with the hardware, testing each of the analog sensors with a digital multimeter, and the serial I/O sensors with manufacturer supplied test software. Once the hardware was proven to be operational, we moved to testing the software. The software was executed in a modular method testing sections of the code and verifying successful execution. Once the code was fully debugged, the system was ready for a full integration and test. 4. Test software system once integrated together. 77 To complete the final integration and test of the SAARP, we conducted a simulated execution of a SimSat flight. The system was powered up and executed for approximately two hours and thirty minutes. The SAARP successfully ran for the entire duration of the test with no errors. Upon completing the test, the flight log data was observed to ensure that there were no discrepancies. The flight log data was as expected and the system is fully functional. 9.3 Future Work Both the SAARP system and CricketSat II+ have area in which they could be further developed and improved upon. This section will provide insight as to what specific items could be addressed for future work. 9.3.1 CricketSat II+ Although the CricketSat II+ flight was fully functional and successfully accomplished the design requirements, there were a few areas in the design that we have identified that could be easily improved upon. The first item that we observed during the SimSat-1 test flights was the tendency for the clock that changes the state of the transmitter source to drift from its designed duration. This is caused by small tolerances in the resistor and capacitor due to temperature changes. The period of the clock (LM555) is approximately 15 seconds. To improve upon this design one could reduce the period of the 555 timer so that it is more stable and use a frequency divider to reduce the output frequency to the desired 1/15 Hz. This would ensure a fixed clock period that would be less sensitive to temperature. The second item in the design of the flight unit that could be improved upon is the generation of the audio tones. In order to configure the audio frequency range to span the full 800Hz to 5800Hz, given the resistive characteristics of the NTC thermistors, the duty cycle output of the audio tone was not the ideal 50%, nor did it remain constant throughout the frequency span. To correct this problem we used diodes along with a high-pass filter to only pass the rising edges of the audio signal and effectively eliminate the duty cycle altogether. This fixed our original duty cycle problem but not in the best way. A better solution would have been to scale the output frequency to span 1600Hz to 11600Hz and use a flip-flop to divide the frequency in half. This would have produced the same 800Hz to 5800Hz frequency range while maintaining a constant 50% duty cycle. 78 The final item that would be interesting to investigate would be improvements to the PCB layout to make the flight unit less sensitive to RF noise. Though there is no RF signals routed in the PCB, the output of the flight unit interfaces with an amateur radio transmitter that can cause RF noise to enter the flight unit circuitry. An easy improvement that would prove to be useful would be a larger ground plane that utilizes all of the unused real-estate on the PCB. We fell this would improve the performance of the flight unit circuitry because during experimentation, when the PCB was grounded to a piece of metal, any RF noise in the circuitry was reduced significantly. 9.3.2 SAARP The functional purpose of the SAARP is to be an instrument and not a spacecraft bus. As defined by our mentor Pat Kilroy, a spacecraft bus is the component that is the foundation of every flight. In the application of SimSat, the spacecraft bus will provide real-time GPS tracking, real-time housekeeping information, as well as be responsible for the data storage and power management for any experiments. Experiments are defined as being dependant components that rely on the spacecraft bus for things such as power and data storage. The purpose for an experiment is to collect information. Examples of experiments include a camera, carbon-monoxide sensor, etc. The SAARP was designed for the purpose of being an instrument. An instrument is defined as a component that is stand-alone and does not require the services of the spacecraft bus such as power and data storage. An instrument will fly on missions that require its services and will not serve as a spacecraft bus. The SAARP is designed to fly on specific missions that require knowledge of the flight mechanics. The SAARP is a two fold benefit for the SimSat program. In the future it is desired to have pointing control of a balloon capsule during flight. In order to design such a system requires researching the mechanics of the flight motion of a balloon capsule. The SAARP will provide crucial data that will allow NASA engineers to study and characterize the motion of the capsule. The second benefit that the SAARP will provide is precise pointing knowledge at any instant in time during a SimSat flight. If a camera were on board as an experiment and a photo was taken and time stamped, during post flight analysis one could compare the attitude data recorded by the SAARP and the time stamp of the photo to determine what was photographed. 9.4 Conclusions By meeting our design requirements for the CricketSat II+ system and successfully executing two test flights, we accomplished our fundamental project goal to design, build, test, document, and fly a SimSat payload for high school students to replicate. The CricketSat II+ system has a two fold benefit for the 79 SimSat program. It first fulfilled the immediate need for an inexpensive yet reliable means for real-time telemetry on non-recoverable SimSat flights. And the second and more significant benefit to the SimSat educational program is that it will serve as a project that high school groups can participate in with the SimSat program. Students will be able to build their own CricketSat II+ and fly it on a SimSat flight with the mentorship of NASA engineers. The design has been proven, documented, and is ready for high school students to reproduce and become involved with the SimSat educational program. 80 Appendix A: CricketSat II+ Flight Unit Schematics 81 82 83 84 85 86 87 Appendix B: Wallops Flight Facility Photographs These are some photographs taken at the Wallops Flight Facility where the SimSat-1A and SimSat-1B test flights were carried out. These two photos show the balloon preparation and the securing of the flight train. These photos show the sealed SimSat capsule with the signatures of the MQP team, and the moment prior to releasing the balloon for flight. These two photos show the experimental ground station on the table and the ground station of the principal investigator in the tent. 88 Appendix C: Sample Output of SAARP This section contains partial flight data that was logged during a testing experiment. This data represents the flight information for the first eighteen seconds of the test. $8/28/2004,10:16:13.578,232043,3859.7818,N,07651.1340,W,M,0.51,-0.00,196.5,0.00,15.8,-107.8,107.8,38.0,-87.0,3.73,2.79 $8/28/2004,10:16:15.834,,,,,,,,,,0.00,,-107.8,-107.8,38.0,-107.8,3.73,2.79 $8/28/2004,10:16:16.233,,,,,,,0.51,-0.02,197.0,0.00,15.7,-107.8,-107.8,38.0,-87.0,3.73,2.79 $8/28/2004,10:16:16.633,,,,,,,,,,0.00,,-107.8,-107.8,38.0,-87.0,3.73,2.79 $8/28/2004,10:16:17.041,,,,,,,0.49,-0.02,197.2,0.00,15.8,-107.8,-107.8,38.0,-87.0,3.73,2.79 $8/28/2004,10:16:17.443,,,,,,,,,,0.00,,-107.8,-107.8,38.0,-87.0,3.73,2.79 $8/28/2004,10:16:17.843,,,,,,,0.53,-0.00,196.2,0.00,15.7,-107.8,-107.8,38.0,-87.0,3.73,2.79 $8/28/2004,10:16:18.244,,,,,,,,,,0.00,,-107.8,-107.8,38.0,-107.8,3.73,2.79 $8/28/2004,10:16:18.643,,,,,,,0.49,-0.04,196.0,0.00,15.8,-107.8,-107.8,38.0,-128.6,3.73,2.79 $8/28/2004,10:16:19.043,,,,,,,,,,0.00,,-107.8,-107.8,38.0,-107.8,3.73,2.79 $8/28/2004,10:16:19.443,,,,,,,0.51,-0.00,198.5,0.00,15.7,-107.8,-107.8,38.0,-87.0,3.73,2.79 $8/28/2004,10:16:19.843,,,,,,,,,,0.00,,-107.8,-107.8,38.0,-107.8,3.73,2.79 $8/28/2004,10:16:20.243,,,,,,,0.51,-0.00,198.8,0.00,15.7,-107.8,-107.8,38.0,-107.8,3.73,2.79 $8/28/2004,10:16:20.643,,,,,,,,,,0.00,,-107.8,-107.8,38.0,-107.8,3.73,2.79 $8/28/2004,10:16:21.043,,,,,,,0.51,-0.00,198.0,0.00,15.7,-107.8,-107.8,38.0,-128.6,3.73,2.79 $8/28/2004,10:16:21.443,,,,,,,,,,0.00,,-107.8,-107.8,38.0,-107.8,3.73,2.79 $8/28/2004,10:16:21.843,,,,,,,0.49,-0.00,197.8,0.00,15.7,-107.8,-107.8,38.0,-87.0,3.73,2.79 $8/28/2004,10:16:22.243,,,,,,,,,,0.00,,-107.8,-107.8,38.0,-107.8,3.73,2.79 $8/28/2004,10:16:22.644,,,,,,,0.51,-0.00,198.4,0.00,15.7,-107.8,-107.8,38.0,-128.6,3.73,2.79 $8/28/2004,10:16:23.043,,,,,,,,,,0.00,,-107.8,-107.8,38.0,-107.8,3.73,2.79 $8/28/2004,10:16:23.443,,,,,,,0.51,-0.02,198.8,0.00,15.6,-107.8,-107.8,38.0,-128.6,3.73,2.79 $8/28/2004,10:16:23.843,,,,,,,,,,0.00,,-107.8,-107.8,38.0,-107.8,3.73,2.79 $8/28/2004,10:16:24.243,,,,,,,0.51,-0.00,198.2,0.00,15.7,-107.8,-107.8,38.0,-107.8,3.73,2.79 $8/28/2004,10:16:24.643,,,,,,,,,,0.00,,-107.8,-107.8,38.0,-128.6,3.73,2.79 $8/28/2004,10:16:25.043,,,,,,,0.49,0.02,198.2,0.00,15.7,-107.8,-107.8,38.0,-107.8,3.73,2.79 $8/28/2004,10:16:25.443,,,,,,,,,,0.00,,-107.8,-107.8,38.0,-128.6,3.73,2.79 $8/28/2004,10:16:25.843,,,,,,,0.51,-0.02,198.3,0.00,15.8,-107.8,-107.8,38.0,-107.8,3.73,2.79 $8/28/2004,10:16:26.243,,,,,,,,,,0.00,,-107.8,-107.8,38.0,-87.0,3.73,2.79 $8/28/2004,10:16:26.643,,,,,,,0.49,-0.00,198.7,0.00,15.7,-107.8,-107.8,38.0,-107.8,3.73,2.79 $8/28/2004,10:16:27.052,,,,,,,,,,0.00,,-107.8,-107.8,38.0,-128.6,3.73,2.79 $8/28/2004,10:16:27.453,,,,,,,0.51,-0.00,198.8,0.00,15.7,-107.8,-107.8,38.0,-128.6,3.73,2.79 $8/28/2004,10:16:27.853,,,,,,,,,,0.00,,-107.8,-107.8,38.0,-107.8,3.73,2.79 $8/28/2004,10:16:28.254,,,,,,,0.51,-0.00,198.5,0.00,15.7,-107.8,-107.8,38.0,-87.0,3.73,2.79 $8/28/2004,10:16:28.653,,,,,,,,,,0.00,,-107.8,-107.8,38.0,-107.8,3.73,2.79 $8/28/2004,10:16:29.053,,,,,,,0.53,-0.00,198.1,0.00,15.7,-107.8,-107.8,38.0,-107.8,3.73,2.79 $8/28/2004,10:16:29.453,,,,,,,,,,0.00,,-107.8,-107.8,38.0,-107.8,3.73,2.79 $8/28/2004,10:16:29.853,,,,,,,0.49,-0.02,198.5,0.00,15.7,-107.8,-107.8,38.0,-87.0,3.73,2.79 $8/28/2004,10:16:30.253,,,,,,,,,,0.00,,-107.8,-107.8,38.0,-128.6,3.73,2.79 $8/28/2004,10:16:30.653,,,,,,,0.51,-0.00,197.9,0.00,15.7,-107.8,-107.8,38.0,-87.0,3.73,2.79 $8/28/2004,10:16:31.053,,,,,,,,,,0.00,,-107.8,-107.8,38.0,-128.6,3.73,2.79 $8/28/2004,10:16:31.453,232045,3859.7818,N,07651.1340,W,M,0.51,-0.00,197.9,0.00,15.7,-107.8,107.8,38.0,-107.8,3.73,2.79 89 Appendix D: Source Code for Data Acquisition Program /********************************************************************** * Name: simsat.C * * * * Authors: Eduardo J. Paredes ([email protected]) * * Brooke Buchholz ([email protected]) * * Antonio Sangermano ([email protected]) * * Michael Kastanas ([email protected]) * * * * Last Mod: 08/24/2004 * * * * Description: This is the SimSat program used to gather data from * * the appropriate I/O ports, format them to the SAARP* * protocol specification, and log the SAARP string * * into a flight log file. * * * * Paramaters: 1. filename. The name of the file in which we are * * going to record the flight data. * * 2. echo. Indicates whether we want to echo the * * values to the screen. * * * * Compile: "g++ simsat.C -lparapin -o run". Compiles "simsat.C" * * source code into an executable called "run". Must * * link "lparapin" to use Parapin. * **********************************************************************/ #include #include #include #include #include #include #include #include #include #include #include #include #include #include #include <errno.h> <fcntl.h> <iostream.h> "parapin.h" // Include Parapin library <sstream> <stdio.h> <stdlib.h> <string> <string.h> <sys/stat.h> <sys/time.h> <sys/types.h> <termios.h> <time.h> <unistd.h> #define FILENAME "flight.log" // Declare a default filename #define ADDR_A LP_PIN02 // Declare local names for Parapin constants. These parallel pins connect to the ADC #define ADDR_B LP_PIN03 #define ADDR_C LP_PIN04 #define ADDR_D LP_PIN05 #define DATA0 LP_PIN01 #define DATA1 LP_PIN14 #define DATA2 LP_PIN16 #define DATA3 LP_PIN17 #define DATA4 LP_PIN13 #define DATA5 LP_PIN12 #define DATA6 LP_PIN10 #define DATA7 LP_PIN11 #define ALE LP_PIN06 90 #define EOC LP_PIN15 #define START LP_PIN07 #define OE LP_PIN08 int x1; // Global variable. The previous spin position of the satellite long int t1; // Global variable. The time of the previous satellite spin calculation (expressed in microseconds) bool isFirst; // Global variable. Indicates whether this is the first spin calculation (special case) using namespace std; // Use appropriate namespace /* DECLARE FUNCTION PROTOTYPES */ int open_port(string name); void initialize_port(string name, int fd); string generateTimeStamp(void); string readSerial(string devName, int fd); string parseGPS(string data); string getCompassTemp(string data); string parseEZCompass(string data); void initialize_parallel(void); void set_address(string device); void do_conversion(void); int get_ADC_output(void); void print_ADC_output(int status); string getTemperature(string name); string getSpinRate(void); string getHousekeeping(string name); int convertBinary(int binary); /* BEGIN PROGRAM */ int main(int argc, char* argv[]) { bool shouldEcho; int fdLog, serial1Link, serial2Link, status; long int loopCounter; string filename, serial1Name, serial2Name, GPSstring; string tempTS, tempEZ, tempGPS, compassTemp, t1, t2, t3, t4, spinRate, hk1, hk2, SAARP; serial1Name = "/dev/ttyS0"; serial2Name = "/dev/ttyS1"; isFirst = true; // Name of first serial port (EZ-Compass) // Name of second serial port (GPS-25) /* HANDLE COMMAND LINE PARAMETERS */ if (argc >= 2) // Some parameters were passed if (argc == 2) { // If only a single parameter was passed if (string(argv[1]) == "-e") { // The echo parameter was passed shouldEcho = true; // Then we should print the output to the screen filename = FILENAME; // Use the default filename } else { // The filename parameter was passed filename = argv[1]; // Store the name of the destination file shouldEcho = false; // Do not echo the output } } else if (argc == 3) { // Two parameters were passed if (string(argv[2]) == "-e") { // The first parameter is echo 91 shouldEcho = true; // Enable echoing filename = argv[3]; // Store the second parameter as filename echo endl; } else if (string(argv[3]) == "-e") { // The second parameter is shouldEcho = true; // Enable echoing filename = argv[2]; // Store the first parameter as filename } else { // No parameters are echo (an unknown parameter exists) cout << "Error: Optional parameters are <filename> <-e>" << cout << "<filename> The name of the file containing the flight data" << endl; cout << "<-e> Flag that indicates the enabling of SAARP echoing" << endl; exit(1); // Exit with errors } } else { // More than the acceptable amount of parameters were passed cout << "Error: Optional parameters are <filename> <-e>" << endl; cout << "<filename> The name of the file containing the flight data" << endl; cout << "<-e> Flag that indicates the enabling of SAARP echoing" << endl; exit(1); // Exit with errors } else { // No parameters were passed filename = FILENAME; // Use the default file name shouldEcho = false; // Do not echo output to screen } /* OPEN A FILE FOR LOGGING. Create one if does not already exist. Append data for writing only. */ fdLog = open(filename.c_str(), O_CREAT | O_APPEND | O_WRONLY, S_IRUSR | S_IWUSR | S_IRGRP | S_IWGRP | S_IROTH); if (fdLog < 0) { // There has been an error opening the data file. cout << "ERROR: Unable to open " << filename << endl; // Print error message exit(1); // Exit with errors } /* OPEN I/O PORTS | INITIALIZE I/O PORTS */ serial1Link = open_port(serial1Name); // Open the EZ-Compass initialize_port(serial1Name, serial1Link); // Initialize the port serial2Link = open_port(serial2Name); // Open the GPS serial initialize_port(serial2Name, serial2Link); // Initialize the initialize_parallel(); // Initialize the parallel ADC port serial port EZ-Compass port GPS port loopCounter = 0; // Initialize loop counter while(1) { // loop forever /* BEGIN DATA ACQUISITION */ tempTS = generateTimeStamp(); if ((loopCounter % 40) == 0) { receiver // Generate a Time Stamp // If it is time to sample the GPS 92 GPSstring = readSerial(serial2Name, serial2Link); GPS // Get data from GPSstring.resize(GPSstring.find_first_of("*",0)+3); tempGPS = parseGPS(GPSstring); // Parse the GPS string into partial SAARP } else // No relevant data in GPS, so don't sample tempGPS = ",,,,,"; // Use blank GPS data if ((loopCounter % 2) == 0) { // If it is time to sample the EZCompass tempEZ = readSerial(serial1Name, serial1Link); // Get data from EZ-Compass tempEZ.resize(tempEZ.find_first_of("*",0)+3); compassTemp = getCompassTemp(tempEZ); // Get the EZ-Compass temperature tempEZ = parseEZCompass(tempEZ); // Parse EZ-Compass string into partial SAARP } else { // EZ-Compass has not refreshed, so don't sample tempEZ = ",,"; // Use blank EZ-Compass data compassTemp = ""; // Use blank compass temperature } t1 = getTemperature("T1"); // Get the first temperature t2 = getTemperature("T2"); // Get the second temperature t3 = getTemperature("T3"); // Get the third temperature t4 = getTemperature("T4"); // Get the fourth temperature spinRate = getSpinRate(); // Calculate the spin rate hk1 = getHousekeeping("HK1"); // Get the first housekeeping voltage hk2 = getHousekeeping("HK2"); // Get the second housekeeping voltage /* FORMAT SAARP STRING */ SAARP = "$" + tempTS + "," + tempGPS + "," + tempEZ + "," + spinRate + "," + compassTemp + "," + t1 + "," + t2 + "," + t3 + "," + t4 + "," + hk1 + "," + hk2 + "\r\n"; /* OUTPUT SAARP */ if (shouldEcho) // We want to echo the output cout << SAARP; // Print out SAARP to the screen write(fdLog, SAARP.c_str(), SAARP.length()); // Write SAARP to the specified file } } loopCounter++; // end while // Increment loop counter /* CLOSE FILE | TERMINATE CONNECTIONS WITH I/O PORTS | EXIT PROGRAM */ close(fdLog); // Close the file close(serial1Link); // Close the EZ-Compass port close(serial2Link); // Close the GPS port exit(0); // Exit the program succesfully int open_port(string name) { /* This function will open the specified port to begin communication. successful completion, the function returns the file descriptor associated Upon 93 with the open port. string name - This is the name of the device we wish to open (ex. "/dev/ttyS1") */ int handle; /* Open the port for read+write, as non-controlling terminal */ handle = open(name.c_str(), O_RDWR | O_NOCTTY); if (handle == -1) { // The port could not be opened cout << "Error: Unable to open " << name << endl; exit(1); } else /* Port/Device successfully opened */ fcntl(handle, F_SETFL, 0); // Do not block the device if there is nothing present at the port return(handle); // Return the file descriptor for the open port } void initialize_port(string name, int fd) { /* This function initalizes the open port for communication. I/O settings include Baud rate, parity bits, data bits, and I/O format. string name - This is the name of the device that we are initializing. The EZ-Compass (COM1) has a baud rate of 9600. The GPS (COM2) has a baud rate of 4800. int fd - This is the file descriptor for the open port for which we want to configure. */ struct termios tio; // data structure holding port settings bzero(&tio, sizeof(tio)); // Clear struct for new port settings /* Set the port with the correct baud rate, 8 data bits, no parity bits, 1 stop bit, enabling receiver, and not transferring ownership of port */ if (name == "/dev/ttyS0") // We are initializing the EZ-Compass tio.c_cflag = B9600 | CS8 | CREAD | CLOCAL; else if (name == "/dev/ttyS1") // We are initializing the GPS tio.c_cflag = B4800 | CS8 | CREAD | CLOCAL; else { // We want to initialize an unknown port/device cout << "Error Initializing. Unknown device: " << name << endl; Print error message exit(1); // Exit with errors } // /* Enable canonical input. Disable all echo functionality, and don't send signals to the calling program */ tio.c_lflag = ICANON; } tio.c_iflag = IGNPAR; // Ignore parity errors tio.c_oflag = 0; // raw data output tcflush(fd, TCIFLUSH); // Clean the serial line tcsetattr(fd, TCSANOW, &tio); // Activate the settings for the port return; string generateTimeStamp(void) { 94 /* This function gets the current system time timestamp from the data. Furthermore, we also get after the last second to get a better precision on been calculated and formatted, it is returned */ stringstream ts; time_t current; struct tm *currTime; struct timezone tzp; struct timeval t1; char usec[33]; int status; (GMT/UTC) and generates a the number of microseconds time. When the timestamp has as a string. current = time(NULL); // Get the current time currTime = localtime(¤t); // Set up the time in a struct status = gettimeofday(&t1, &tzp); // Get the current time of day in a second struct status = sprintf(usec, "%ld", t1.tv_usec); // Convert the amount of microseconds to a string ts << currTime->tm_mon + 1 << "/"; // Set up the Date field. Add the month ts << currTime->tm_mday << "/" << currTime->tm_year + 1900 << ","; // Add the day and the year if (currTime->tm_hour < 10) // Set up the Time field ts << "0"; ts << currTime->tm_hour << ":"; // Add the hour if (currTime->tm_min < 10) ts << "0"; ts << currTime->tm_min << ":"; // Add the minute if (currTime->tm_sec < 10) ts << "0"; ts << currTime->tm_sec; // Add the second if (strlen(usec) == 6) // Add additional precision (3 places) to the seconds, based on the number microseconds ts << "." << usec[0] << usec[1] << usec[2]; else if (strlen(usec) == 5) { ts << ".0"; ts << usec[0] << usec[1]; } else if(strlen(usec) == 4) { ts << ".00"; ts << usec[0]; } else ts << ".000"; return(ts.str()); // Convert the stringstream into a string and return } string readSerial(string devName, int fd) { /* This function will read the available data from the specified open serial port. Once the data has been successfully read, all the data will be returned. 95 with the open port. string devName - This is the name of the device that we are referencing (ex. "/dev/ttyS1") int fd - This is the file descriptor that is used for communication to the port. */ bool isGoodInput; char buffer[100]; int numRead; char chksum; int ndx; char chksumb, actchksumb; char temph, templ; isGoodInput = true; numRead = read(fd, buffer, sizeof(buffer)); // Attempt reading from the specified serial port if (numRead < 0) // If the reading was not successful cout << "Error: Could not read data from " << devName << endl; if (devName == "/dev/ttyS0") { // Validate data from the EZ-Compass isGoodInput = false; // Assume the data we received from it is probably wrong while (!isGoodInput) { // While the input from the compass is bad read(fd, buffer, sizeof(buffer)); // Read from the EZ-Compass again if ((buffer[0] == '$') && (buffer[1] == 'R')){ // If the EZ-Compass input is finally correct chksumb = buffer[1]; ndx = 2; while ((buffer[ndx] != '*') && (ndx < 50)){ chksumb ^= buffer[ndx]; ndx += 1; } if (ndx < 50){ temph = buffer[ndx+1]; templ = buffer[ndx+2]; if (temph < 0x40){ temph -= 0x30;} else{ temph -= 0x37;} if (templ < 0x40){ templ -= 0x30;} else{ templ -= 0x37;} actchksumb = (temph * 0x10) + templ; if (chksumb == actchksumb) isGoodInput = true; // Then we dont need to read from it anymore } else{ cout << endl << "Did not find *" << endl; } } } } else if(devName == "/dev/ttyS1") { // Validate data from the GPS isGoodInput = false; // The data we received from it is probably wrong while (!isGoodInput) { // While the input from the GPS is bad 96 read(fd, buffer, sizeof(buffer)); // Read from the GPS again if ((buffer[0] == '$') && (buffer[4] == 'G')){ // If the GPGGA string finally begins correctly chksumb = buffer[1]; ndx = 2; while ((buffer[ndx] != '*') && (ndx < 81)){ chksumb ^= buffer[ndx]; ndx += 1; } if (ndx < 81){ temph = buffer[ndx+1]; templ = buffer[ndx+2]; if (temph < 0x40){ temph -= 0x30;} else{ temph -= 0x37;} if (templ < 0x40){ templ -= 0x30;} else{ templ -= 0x37;} actchksumb = (temph * 0x10) + templ; if (chksumb == actchksumb) isGoodInput = true; } else{ cout << endl << "Did not find *" << endl; } } } } else { // We are attempting to read from an unknown port cout << "Error Reading. Unknown Device: " << devName << endl; // Print error message exit(1); // Exit with errors } return(string(buffer)); // Return the value read from the serial port } string parseGPS(string data) { /* This function will take a raw comma-delimited GPS string, tokenize it by commas, and break it up into fields. The function then returns only a single string that contains all the relevant GPS data in partial SAARP format. string data - This is the raw GPS string we need to parse. */ char temp[100], *gpsArray[30]; int i = 0; strcpy(temp, data.c_str()); // Copy the <string> into a <char *> (necessary for parsing) gpsArray[0] = strtok(temp, ","); // Tokenize the GPS string with "," as the delimeter while (gpsArray[++i] = strtok(NULL, ",")); // NULL out the delimiting commas since they are trash /* Now that the GPS data is parsed, we can select the data of interest for SAARP. 97 Following the standard format of NMEA 0183 v2.0 Transmitted Sentences (Garmin-25 Technical Specifications). Section 4.2.4. Global Positioning System Fix Data (GGA). Fields of Interest: 1.) GPS Time 2.) Latitude 3.) Latitude Hemisphere 4.) Longitude 5.) Longitude Hemisphere 9.) Antenna Height Above/Below Sea Level */ return(string(gpsArray[1]) + "," + string(gpsArray[2]) + "," + string(gpsArray[3]) + "," + string(gpsArray[4]) + "," + string(gpsArray[5]) + "," + string(gpsArray[9])); // Return appropriately formatted values } string getCompassTemp(string data) { /* This function will take a raw EZ-Compass string, find the temperature data, and return it. string data - This is the raw EZ-Compass string we need to parse. */ int pos1, pos2; pos1 = data.find("T", 0); // Find the beginning of the "Temperature" data pos2 = data.find("C", pos1); // Find the beginning of the "Compass Heading" data return(data.substr(pos1+1, pos2-pos1-1)); // Return appropriately formatted values } string parseEZCompass(string data) { /* This function will take a raw EZ-Compass string, parse it to find all relevant data, format this data into partial SAARP format, and return it. string data - This is the raw EZ-Compass string we need to parse. */ int pos1, pos2; string compassPitch, compassRoll, compassHead; pos1 = data.find("R", 0); // Find the beginning of the "Roll" data pos2 = data.find("P", pos1); // Find the beginning of the "Pitch" data compassRoll = data.substr(pos1+1, pos2-pos1-1); // Get the "Roll" data pos1 = pos2; pos2 = data.find("T", pos1); // Find the beginning of the "Temperature" data compassPitch = data.substr(pos1+1, pos2-pos1-1); // Get the "Pitch" data pos1 = data.find("C", pos2); // Find the beginning of the "Compass Heading" data pos2 = data.find("*", pos1); // Find the beginning of the checksum compassHead = data.substr(pos1+1, pos2-pos1-1); // Get the "Heading" data return(compassRoll + "," + compassPitch + "," + compassHead); // Return all appropriately formatted values } 98 void initialize_parallel() { /* This function initializes the parallel port. First we specify the base address of the parallel port (must be root to do this), then specify the input and output pins. We also clear pin 9, since it is not connected to the ADC */ int status; status = pin_init_user(LPT1); // Initialize the parallel port (address LPT1=0x0378). Must be root. if (status < 0) { cout << "Error: Could not initialize parallel port. Must be root" << endl; // Print error message exit(1); // Exit with errors } pin_input_mode(DATA0 | DATA1 | DATA2 | DATA3 | DATA4 | DATA5 | DATA6 | DATA7 | EOC); // Specify input pins pin_output_mode(ADDR_A | ADDR_B | ADDR_C | ADDR_D | ALE | START | OE); // Specify output pins clear_pin(LP_PIN09); // Clear pin 9, since it is not connected return; } void set_address(string device){ /* This function sets the appropriate ADC address for the specified device. The address is actually written to the parallel port (to the ADC). string device - This is the name (abreviation) of the device. Based on its name, we can set the address to the correct value on the ADC. */ if (device == "T1") { // Select T1 sensor from channel 1 (address 0x0001) clear_pin(ADDR_A); // 0 clear_pin(ADDR_B); // 0 clear_pin(ADDR_C); // 0 set_pin(ADDR_D); // 1 } else if (device == "T2") { // Select T2 sensor from channel 4 (address 0x0100) clear_pin(ADDR_A); // 0 set_pin(ADDR_B); // 1 clear_pin(ADDR_C); // 0 clear_pin(ADDR_D); // 0 } else if (device == "T3") { // Select T3 sensor from channel 6 (address 0x0110) clear_pin(ADDR_A); // 0 set_pin(ADDR_B); // 1 set_pin(ADDR_C); // 1 clear_pin(ADDR_D); // 0 } else if (device == "T4") { // Select T4 sensor from channel 7 (address 0x0111) clear_pin(ADDR_A); // 0 set_pin(ADDR_B); // 1 set_pin(ADDR_C); // 1 set_pin(ADDR_D); // 1 99 } else if (device == "P1") { // Select P1 sensor from channel 2 (address 0x0010) clear_pin(ADDR_A); // 0 clear_pin(ADDR_B); // 0 set_pin(ADDR_C); // 1 clear_pin(ADDR_D); // 0 } else if (device == "P2") { // Select P2 sensor from channel 3 (address 0x0011) clear_pin(ADDR_A); // 0 clear_pin(ADDR_B); // 0 set_pin(ADDR_C); // 1 set_pin(ADDR_D); // 1 } else if (device == "P3") { // Select P3 sensor from channel 5 (address 0x0101) clear_pin(ADDR_A); // 0 set_pin(ADDR_B); // 1 clear_pin(ADDR_C); // 0 set_pin(ADDR_D); // 1 } else if (device == "P4") { // Select P4 sensor from channel 8 (address 0x1000) set_pin(ADDR_A); // 1 clear_pin(ADDR_B); // 0 clear_pin(ADDR_C); // 0 clear_pin(ADDR_D); // 0 } else if (device == "HK1") { // Select HK1 sensor from channel 9 (address 0x1001) set_pin(ADDR_A); // 1 clear_pin(ADDR_B); // 0 clear_pin(ADDR_C); // 0 set_pin(ADDR_D); // 1 } else if (device == "HK2") { // Select HK2 sensor from channel 10 (address 0x1010) set_pin(ADDR_A); // 1 clear_pin(ADDR_B); // 0 set_pin(ADDR_C); // 1 clear_pin(ADDR_D); // 0 } else { // The device name is unknown. Select channel N/C channel 0 (address 0x0000) clear_pin(ADDR_A); // 0 clear_pin(ADDR_B); // 0 clear_pin(ADDR_C); // 0 clear_pin(ADDR_D); // 0 cout << "Unable to set the address for \"" << device << "\". Please make sure the device name is correct" << endl; } return; } void do_conversion() { 100 /* This function activates the ADC to do a conversion. A pulse is sent to ALE to load the address (set previous to calling this function), then a pulse is sent to START to do the conversion. The conversion is complete when EOC goes from low to high. Then we set OE to high to enable to output to the parallel port. */ set_pin(ALE); // Begin pulse to ALE to load address usleep(10); // Wait for 10 microseconds (usec) during the pulse clear_pin(ALE); // End the pulse to ALE, MUX settles in 1 usec set_pin(START); // Begin pulse to START to begin the conversion usleep(10); // Wait for 10 usec during pulse clear_pin(START); // End pulse to START (EOC going low) while(pin_is_set(EOC) == 0) ; // Do nothing while EOC pin is still low set_pin(OE); // The conversion is done, so set OE to enable output return; } int get_ADC_output() { /* This function will read the output from the ADC from the parallel port (1 B) and return it as an integer. */ int status = 0; status = pin_is_set(DATA0 | DATA1 | DATA2 | DATA3 | DATA4 | DATA5 | DATA6 | DATA7); // Get the current data value form the ADC return(status); // Return the output } void print_ADC_output(int status) { /* This function takes the raw binary Byte that was read from the parallel port as the ADC output and prints it to the screen. int status - This is the integer value that contains the output of the ADC. We can check to see if each of the data bits is set, and output the appropriate bit value. */ if (status & DATA7) // Output the status of the MSB (DATA7) cout << "1"; else cout << "0"; if (status & DATA6) // Output the status of bit 6 (DATA6) cout << "1"; else cout << "0"; if (status & DATA5) // Output the status of bit 5 (DATA5) cout << "1"; else cout << "0"; if (status & DATA4) // Output the status of bit 4 (DATA4) cout << "1"; else cout << "0"; 101 } if (status & DATA3) // cout << "1"; else cout << "0"; if (status & DATA2) // cout << "1"; else cout << "0"; if (status & DATA1) // cout << "1"; else cout << "0"; if (status & DATA0) // cout << "1" << endl; else cout << "0" << endl; return; Output the status of bit3 (DATA3) Output the status of bit 2 (DATA2) Output the status of bit 1 (DATA1) Output the status of the LSB (DATA0) string getTemperature(string name) { /* This function gets the ADC output for the specified temperature sensor, converts it to a temperature (Celsius), and then returns this value as a string. string name - This is the name of the sensor that we want to convert. */ int data, resistor, Vcc; float voltage, temperature, levels; char buf[10]; levels = 256; // The quantization levels in the ADC resistor = 15000; // The resistor value whose voltage was measured in parallel to this sensor by the ADC Vcc = 5; // The input voltage powering the ADC set_address(name); // Set the address for the specified temperature sensor do_conversion(); // Activate ADC for conversion data = get_ADC_output(); // Get the converted output from the ADC //cout << name << ": "; //print_ADC_output(data); // Display the binary ADC output data = convertBinary(data); // Convert the binary ADC output to a decimal integer voltage = (data/levels) * Vcc; // Convert the raw data into the input voltage to the ADC from this sensor temperature = ((voltage/resistor) * 1000000) - 273.15; // Convert the voltage to temperature (C) sprintf(buf, "%2.1f", temperature); // Convert the temperature into a string, formatted with the correct amount of decimal places return(string(buf)); // Return the temperature as a formatting string } string getSpinRate() { /* This function gets the ADC output for the four photoresistors, then does some calculations to determine the spin rate of the satellite. The return value is a string that contains the spin rate. */ 102 int x2, xtemp, sideF, sideL, sideB, sideR, angleF, angleL, angleB, angleR, status, error; float rate; long int t2; struct timeval sampleTime; struct timezone tzp; char spin[10]; angleF = 180; // Declare angleL = -90; // Declare angleB = 0; // Declare angleR = 90; // Declare error = 10; // Establish the front angle the left angle the bottom angle the right angle a margin of error between voltage levels if (isFirst == true) { // This is the first time we tried to calculate the spin rate x1 = 0; // Initialize the starting point (could be anything, doesn't matter) set_address("P1"); // Set the address for the first photoresistor do_conversion(); // Activate ADC for conversion sideF = get_ADC_output(); // Get the converted output from the ADC //cout << "Side F: "; //print_ADC_output(sideF); // Display the binary ADC output sideF = convertBinary(sideF); // Convert this binary number to its decimal equivalent set_address("P2"); // Set the address for the second photoresistor do_conversion(); // Activate ADC for conversion sideL = get_ADC_output(); // Get the converted output from the ADC //cout << "Side L: "; //print_ADC_output(sideL); // Display the binary ADC output sideL = convertBinary(sideL); // Convert this binary number to its decimal equivalent set_address("P3"); // Set the address for the third photoresistor do_conversion(); // Activate ADC for conversion sideB = get_ADC_output(); // Get the converted output from the ADC //cout << "Side B: "; //print_ADC_output(sideB); // Display the binary ADC output sideB = convertBinary(sideB); // Convert this binary number to its decimal equivalent set_address("P4"); // Set the address for the fourth photoresistor do_conversion(); // Activate ADC for conversion sideR = get_ADC_output(); // Get the converted output from the ADC //cout << "Side R: "; //print_ADC_output(sideR); // Display the binary ADC output sideR = convertBinary(sideR); // Convert this binary number to its decimal equivalent day status = gettimeofday(&sampleTime, &tzp); // Get the current time of t1 = (sampleTime.tv_sec * 1000000) + sampleTime.tv_usec; timestamp expressed in usec // Get a /* Determine which side has the highest voltage */ if ((sideF > sideL) && (sideF > sideB) && (sideF > sideR)) { has the largest voltage // side F 103 x1 = angleF; if (((sideF-error) <= sideL) || (sideL <= (sideF+error))) // side F has roughly the same voltage as side L xtemp = angleL; else if (((sideF-error) <= sideR) || (sideR <= (sideF+error))) // side F has roughly the same voltage as side R xtemp = angleR; else // no other sides have roughly the same voltage as side F xtemp = angleF; } else if ((sideL > sideF) && (sideL > sideB) && (sideL > sideR)) { // side L has the largest voltage x1 = angleL; if (((sideL-error) <= sideF) || (sideF <= (sideL+error))) // side L has roughly the same voltage as side F xtemp = angleF; else if (((sideL-error) <= sideB) || (sideB <= (sideL+error))) // side L has roughly the same voltage as side B xtemp = angleB; else // no other sides have roughly the same voltage as side L xtemp = angleL; } else if ((sideB > sideF) && (sideB > sideL) && (sideB > sideR)) { // side B has the largest voltage x1 = angleB; if (((sideB-error) <= sideL) || (sideL <= (sideB+error))) // side B has roughly the same voltage as side L xtemp = angleL; else if (((sideB-error) <= sideR) || (sideR <= (sideB+error))) // side B has roughly the same voltage as side R xtemp = angleR; else // no other sides have roughly the same voltage as side B xtemp = angleB; } else { // side R has the largest voltage x1 = angleR; if (((sideR-error) <= sideF) || (sideF <= (sideR+error))) // side R has roughly the same voltage as side F xtemp = angleF; else if (((sideR-error) <= sideB) || (sideB <= (sideR+error))) // side L has roughly the same voltage as side B xtemp = angleB; else // no other sides have roughly the same voltage as side R xtemp = angleR; } x1 = (x1 + xtemp) / 2; // Get the angle that the satellite is pointing } rate = 0.0; // Set the spin rate to zero the first time sprintf(spin, "%3.2f", rate); // Format the spin rate isFirst = false; // The first only comes once, so never do this again return(string(spin)); // Return the calculated spin rate set_address("P1"); // Set the address for the first photoresistor do_conversion(); // Activate ADC for conversion sideF = get_ADC_output(); // Get the converted output from the ADC //cout << "Side F: "; //print_ADC_output(sideF); // Display the binary ADC output 104 sideF = convertBinary(sideF); decimal equivalent // Convert this binary number to its set_address("P2"); // Set the address for the second photoresistor do_conversion(); // Activate ADC for conversion sideL = get_ADC_output(); // Get the converted output from the ADC //cout << "Side L: "; //print_ADC_output(sideL); // Display the binary ADC output sideL = convertBinary(sideL); // Convert this binary number to its decimal equivalent set_address("P3"); // Set the address for the third photoresistor do_conversion(); // Activate ADC for conversion sideB = get_ADC_output(); // Get the converted output from the ADC //cout << "Side B: "; //print_ADC_output(sideB); // Display the binary ADC output sideB = convertBinary(sideB); // Convert this binary number to its decimal equivalent set_address("P4"); // Set the address for the fourth photoresistor do_conversion(); // Activate ADC for conversion sideR = get_ADC_output(); // Get the converted output from the ADC //cout << "Side R: "; //print_ADC_output(sideR); // Display the binary ADC output sideR = convertBinary(sideR); // Convert this binary number to its decimal equivalent status = gettimeofday(&sampleTime, &tzp); // Get the current time of day t2 = (sampleTime.tv_sec * 1000000) + sampleTime.tv_usec; // Get a timestamp expressed in usec /* Determine which side has the highest voltage */ if ((sideF > sideL) && (sideF > sideB) && (sideF > sideR)) { // side F has the largest voltage x2 = angleF; if (((sideF-error) <= sideL) || (sideL <= (sideF+error))) // side F has roughly the same voltage as side L xtemp = angleL; else if (((sideF-error) <= sideR) || (sideR <= (sideF+error))) // side F has roughly the same voltage as side R xtemp = angleR; else // no other sides have roughly the same voltage as side F xtemp = angleF; } else if ((sideL > sideF) && (sideL > sideB) && (sideL > sideR)) { // side L has the largest voltage x2 = angleL; if (((sideL-error) <= sideF) || (sideF <= (sideL+error))) // side L has roughly the same voltage as side F xtemp = angleF; else if (((sideL-error) <= sideB) || (sideB <= (sideL+error))) // side L has roughly the same voltage as side B xtemp = angleB; else // no other sides have roughly the same voltage as side L xtemp = angleL; } else if ((sideB > sideF) && (sideB > sideL) && (sideB > sideR)) { // side B has the largest voltage x2 = angleB; 105 if (((sideB-error) <= sideL) || (sideL <= (sideB+error))) // side B has roughly the same voltage as side L xtemp = angleL; else if (((sideB-error) <= sideR) || (sideR <= (sideB+error))) // side B has roughly the same voltage as side R xtemp = angleR; else // no other sides have roughly the same voltage as side B xtemp = angleB; } else { // side R has the largest voltage x1 = angleR; if (((sideR-error) <= sideF) || (sideF <= (sideR+error))) // side R has roughly the same voltage as side F xtemp = angleF; else if (((sideR-error) <= sideB) || (sideB <= (sideR+error))) // side L has roughly the same voltage as side B xtemp = angleB; else // no other sides have roughly the same voltage as side R xtemp = angleR; } x2 = (x2 + xtemp) / 2; // Calculate the anglw at which the satellite is pointing rate = (x2-x1)/(t2-t1); // Calculate the spin rate x1 = x2; // Store the current angle for future use t1 = t2; // Store the current time stamp for future use sprintf(spin, "%3.2f", rate); // Format the spin rate return(string(spin)); // Return the formatted spin rate } string getHousekeeping(string name) { /* This function gets the ADC output for the specified housekeeping voltage, converts it to roughly its original voltage, and then returns this value as a string. string name - This is the name of the sensor that we want to convert. */ int data, resistor, Vcc; float voltage, levels; char buf[10]; levels = 256; // The quantization levels in the ADC resistor = 18000; // The resistor value whose voltage was measured by the ADC Vcc = 5; // The input voltage powering the ADC set_address(name); // Set the address for the specified temperature sensor do_conversion(); // Activate ADC for conversion data = get_ADC_output(); // Get the converted output from the ADC //cout << name << ": "; //print_ADC_output(data); // Display the binary ADC output data = convertBinary(data); // Convert the binary ADC output to a decimal integer voltage = (data/levels) * Vcc; // Convert the raw data into the input voltage to the ADC from this voltage divider sprintf(buf, "%2.2f", voltage); // Convert the voltage into a string, formatted with the correct amount of decimal places return(string(buf)); // Return the voltage as a formatted string } 106 int convertBinary(int binary) { /* This function takes the raw binary Byte that was read from the parallel port as the ADC output and converts it to a useable integer. int status - This is the integer value that contains the output of the ADC. We can check to see if each of the data bits is set, and output the appropriate bit value. */ int decimal = 0; if (binary & DATA7) decimal += 128; if (binary & DATA6) decimal += 64; if (binary & DATA5) decimal += 32; if (binary & DATA4) decimal += 16; if (binary & DATA3) decimal += 8; if (binary & DATA2) decimal += 4; if (binary & DATA1) decimal += 2; if (binary & DATA0) decimal += 1; return(decimal); // Return the decimal (integer) conversion of the binary byte } 107

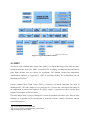
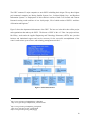
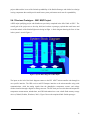
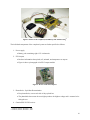
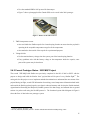
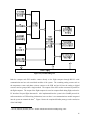
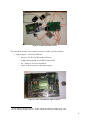
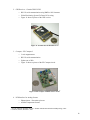
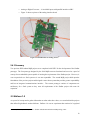
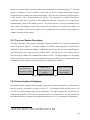
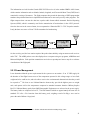
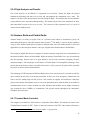
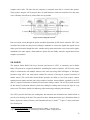

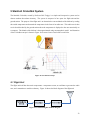

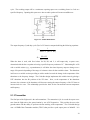
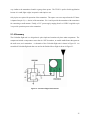
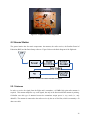
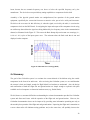


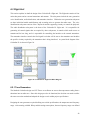
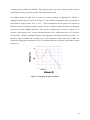
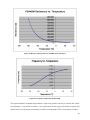
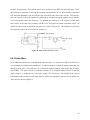
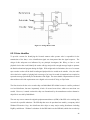

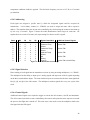

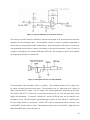

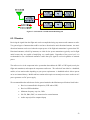
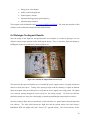

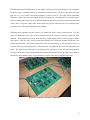
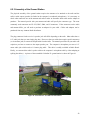


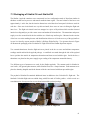
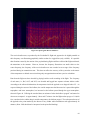
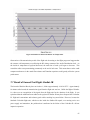
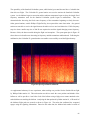
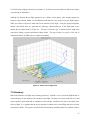


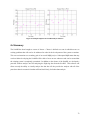


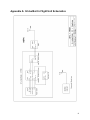
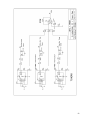
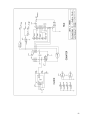
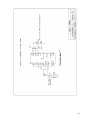

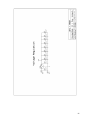

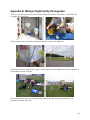
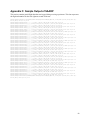
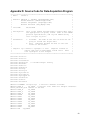
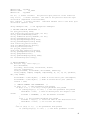
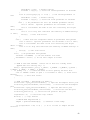
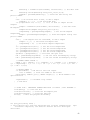


![ISQUES COLUMBIA L. Preetzmann—Àggerhalm ]](http://vs1.manualzilla.com/store/data/006392774_1-0422bcc5d356255aa7f43d6945e506b7-150x150.png)