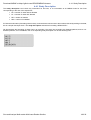
1
iMRMC
User guide
Brandon D. Gallas, PhD
Xin He, PhD
Rohan Pathare
US Food and Drug Administration
Center For Devices and Radiological Health
Office of Science and Engineering Labs
Division of Imaging and Applied Mathematics
June 3, 2014
Download iMRMC at https://github.com/DIDSR/iMRMC/releases
iMRMC
Summary
Summary
The primary objective of this Java application (iMRMC) is to assist investigators with analyzing and sizing multi-reader multicase (MRMC) reader studies that compare the difference in the area under Receiver Operating Characteristic curves (AUCs)
from two modalities. The core elements of this java application include the ability to do MRMC variance analysis and the ability
to size an MRMC trial. A database containing components of variance from past MRMC studies is planned.
When publishing results using our software, please reference with one of the following:
• Gallas, B. D.; Bandos, A.; Samuelson, F. & Wagner, R. F. (2009), 'A Framework for Random-Effects ROC Analysis: Biases
with the Bootstrap and Other Variance Estimators', Commun Stat A-Theory 38 (15), 2586-2603.
• Gallas, B. D. (2006), 'One-Shot Estimate of MRMC Variance: AUC.' Acad Radiol, 13 (3), 353-362.
The software treats arbitrary study designs that are not "fully-crossed". Please refer to the following for more information.
• Gallas, B. D. & Brown, D. G. (2008), 'Reader Studies for Validation of CAD Systems.' Neural Networks Special Conference
Issue, 21, (2-3), 387-397.
• Obuchowski, N.; Gallas, B. D. & Hillis, S. L. (2012), 'Multi-Reader ROC Studies with Split-Plot Designs: A Comparison of
Statistical Methods.' Acad Radiol, 19, 1508-1517.
Status
The sizing analysis has been debugged and enabled. We believe all elements are now functioning properly. Confirmatory
validation of statistical and sizing analysis by Roe and Metz simulation is planned. Please contact us with any issues via the
issues page (link).
Contents
This user manual contains
• Introduction to ROC Reader Studies
• How iMRMC is implemented
• How to use the iMRMC application
• References for iMRMC
Click to go to a pdf version of this user manual (link)
Size and Analyze Multi-reader Multi-case Reader Studies
2of 26
Download iMRMC at https://github.com/DIDSR/iMRMC/releases
Table of Contents
Table of Contents
1. Introduction to ROC Reader Studies ....................................................................................................4
2. Methods .................................................................................................................................................5
2.1 Variance Estimation .......................................................................................................................6
2.2 Components of Variance ...............................................................................................................7
2.3 Hypothesis Testing and Confidence Intervals ...............................................................................8
2.4 Sizing a Future Study ...................................................................................................................9
3. Database .............................................................................................................................................10
4. Using the iMRMC Application .............................................................................................................11
4.1 Technical Specifications ..............................................................................................................12
4.2 First Time Use .............................................................................................................................13
4.3 Input data ....................................................................................................................................14
4.4 Data Format for ROC Ratings ....................................................................................................15
4.4.1 Study Description ...............................................................................................................16
4.4.2 List of ROC Ratings ...........................................................................................................17
4.4.3 Formating Errors ................................................................................................................19
4.5 Data Analysis ..............................................................................................................................20
4.6 Sizing a Future Study .................................................................................................................23
4.7 Generate a Report ......................................................................................................................24
4.8 Database .....................................................................................................................................25
5. References ..........................................................................................................................................26
Size and Analyze Multi-reader Multi-case Reader Studies
3of 26
Download iMRMC at https://github.com/DIDSR/iMRMC/releases
1. Introduction to ROC Reader Studies
1. Introduction to ROC Reader Studies
ROC reader studies are designed to evaluate and compare imaging devices and acquisition protocols, or generally evaluate
image quality according to an objective task. The ROC task is a classification task, e.g., classifying a patient as non-diseased
or diseased. Image quality is then defined as the ability of a reader (e.g., a radiologist) to perform such a task.
In a typical ROC reader study the reader is presented with one of two mutually exclusive alternatives (e.g. a tumor-present
image or a tumor-absent image). The observer is then asked to rate his or her confidence level of which alternative is presented
(e.g., the confidence level of tumor presence on an image). Any number of responses may be used to rate the confidence
level. For example, in a traditional clinical reader study, a set of five confidence level responses is used with 1 representing
“absolutely sure there is no tumor” and 5 representing “absolutely sure there is tumor present”. Alternatively, reader studies
may ask the observer to use a “continuous” rating scale. Such scales are not really continuous but allow the reader to rate each
case with a whole number ranging from 1 to 100. The rating values are collected for both non-diseased and diseased cases.
Given ratings for non-diseased and diseased cases, an ROC curve can be traced out by calculating the sensitivity/specificity
(TPF/TNF) pair for each confidence level, or threshold, possible [1]. An ROC curve illustrates the tradeoff between sensitivity
and specificity of the reader across all thresholds. This tradeoff is realized by a change in the reader’s threshold. In the case
of breast cancer screening via mammography, when the threshold is made more aggressive the reader recalls more patients
for additional imaging, increasing his or her sensitivity at the price of lower specificity. If the reader’s threshold is moved in the
opposite direction, the reader will recall fewer patients; the reader is less aggressive, decreasing his or her sensitivity with the
concomitant result of increased specificity. The area under this ROC curve (AUC) is a summary figure-of-merit for describing
how well a reader is able to separate the population of diseased patients from non-diseased patients.
One interpretation of AUC is that it is the reader’s average sensitivity over all possible specificities. As such, it is a global
summary of task performance that avoids thresholds entirely. AUC is also mathematically equivalent to the probability that a
random reader will correctly choose the signal-present image over the signal-absent image when a pair is presented side-byside or sequentially, as is done in a 2-alternative forced choice (2AFC) task [12].
To account for the variability in readers, an ROC study is often conducted in a multi-reader paradigm. The endpoint of such an
ROC reader study is the reader-averaged AUC value. The uncertainty in the reader-averaged AUC suffers from two sources
of variability: the readers and the cases. To account for both sources of variability, reader studies often involve several trained
readers in addition to a dataset of diseased and non-diseased cases. One popular study design for estimating AUC is the
fully crossed study design in which every reader reads every case. Statistical methods have been proposed in the literature to
analyze fully-crossed MRMC data [13]. The origin of each method differs, and consequently, the estimation process of each
method differs. Additionally, each method has at its foundation a different decomposition, or representation, of the total variance.
Size and Analyze Multi-reader Multi-case Reader Studies
4of 26
Download iMRMC at https://github.com/DIDSR/iMRMC/releases
2. Methods
2. Methods
<TODO>: Insert description text here... And don't forget to add keyword for this topic
Size and Analyze Multi-reader Multi-case Reader Studies
5of 26
Download iMRMC at https://github.com/DIDSR/iMRMC/releases
2.1 Variance Estimation
2.1 Variance Estimation
In this software, we utilize two methods to estimate the MRMC variance components of four widely used variance
decompositions of the reader-averaged AUC. Then we use these variance decompositions to size a trial. The software can
analyze data from a reader-study of two modalities that is fully crossed with readers and cases paired across modalities (every
reader reads every case in two modalities).
The first variance estimation method uses U-statistics to provide unbiased estimates of the variance components [4]. This
method lacks a positivity constraint and can lead to negative estimates of variance components and total variance. The second
variance estimation method uses the non-parametric maximum likelihood estimate (MLE) of the distribution of readers and
cases, which is the empirical distribution of readers and cases [2]. Efron and Tibshirani also refer to this estimation method
as the “ideal” bootstrap. The MLE estimate of variance components and total variance cannot go negative. The tradeoff for
positive variance estimates is a positive bias.
Both variance estimation methods are performed in the source file covMRMC.java (package mrmc.core) within the sole
constructor with header:
public covMRMC(double[][][] t0, int[][][] d0, double[][][] t1, int[][][] d1, int R, int N,
int D);
Size and Analyze Multi-reader Multi-case Reader Studies
6of 26
Download iMRMC at https://github.com/DIDSR/iMRMC/releases
2.2 Components of Variance
2.2 Components of Variance
Regardless of their original developments, the four variance decompositions that are included in this software can be derived
from first principles for the reader average of empirical AUCs. As such they are related to one another with simple mappings
[3]. The decompositions are
# BDG components [3-5]: The author Brandon D. Gallas (BDG) decomposed the total variance into eight moments
from first principles in a fashion equivalent to U-statistics, which decomposes the total variance into seven conditional
covariances. The “extra moment” is the mean squared, which is a part of each conditional covariance. There is a
term for non-diseased cases, diseased cases, readers, and all combinations. The decomposition treats non-diseased
cases separately from diseased cases such that the total variance can be easily generalized to new readers, new
non-diseased cases, and new diseased cases.
#
BCK components [6]: The authors Barrett, Clarkson, and Kupinski (BCK) decomposed the total variance into
seven marginal variances from first principles. They are marginal in the sense that they average over the non-random
effects rather than conditioning on them as above. The BCK components are thought of as pure variance terms. There
is a term for non-diseased cases, diseased cases, readers, and all combinations. The BCK decomposition treats nondiseased cases separately from diseased cases such that the total variance can be easily generalized to new readers,
new non-diseased cases, and new diseased cases.
# DBM components [7]: The authors Dorfman, Berbaum, and Metz (DBM) decomponsed the total variance into
six components based on a mixed-model ANOVA. The components are: reader effect, case effect, reader-case effect,
modality-reader effect, modality-case effect, and modality-reader-case effect. The DBM decomposition does not treat
non-diseased cases separately from diseased cases. So, while the total variance can be easily generalized to new
readers and to total cases (with a fixed disease prevalence), additional modeling is needed to separately generalize
to new non-diseased cases and new diseased cases (i.e., population with arbitrary disease prevalence).
# MS components [7]: The MS decomposition is based on the same mixed-model ANOVA as the DBM components.
MS stands for mean squares, which are estimated from the data first and then mapped to the DBM components. There
are six MS components: reader effect, case effect, reader-case effect, modality-reader effect, modality-case effect,
and modality-reader-case effect. The MS decomposition does not treat non-diseased cases separately from diseased
cases. So, while the total variance can be easily generalized to new readers and to total cases (with a fixed disease
prevalence), additional modeling is needed to separately generalize to new non-diseased cases and new diseased
cases (i.e., population with arbitrary disease prevalence).
#
OR components [8]: The authors Obuchowski and Rockette (OR) decomposed the total variance into six
components based on a two-factor ANOVA by modeling the accuracy of the jth reader using the ith diagnostic test. The
components are: reader effect, modality-reader effect, same-reader-different-modality covariance, different-readersame-modality covariance, different-reader-different-modality covariance, and residual error. The OR decomposition
does not treat non-diseased cases separately from diseased cases. So, while the total variance can be easily
generalized to new readers and to total cases (with a fixed disease prevalence), additional modeling is needed to
separately generalize to new non-diseased cases and new diseased cases (i.e., population with arbitrary disease
prevalence).
We emphasize that the software presents the four different variance decompositions of the reader average of empirical AUCs
estimated by U-statistics and MLE [3]. The software does not estimate the DBM and OR components as originally proposed [7,
8]. They are obtained through linear combinations of the BDG components [3]. It is worth pointing out that the U-statistics and
MLE estimation methods in this software are specific to the reader average of empirical AUCs, whereas the original DBM and
OR estimation methods can be used for other performance measures. Estimation of components when using fully-crossed data
is applicable to the BDG, BCK, DBM, OR and MS decompositions. If using data with a non-fully-crossed study design, only the
BDG and BCK components are currently able to be estimated. Calculations for the other decompositions are in development.
Size and Analyze Multi-reader Multi-case Reader Studies
7of 26
Download iMRMC at https://github.com/DIDSR/iMRMC/releases
2.3 Hypothesis Testing and Confidence
Intervals
2.3 Hypothesis Testing and Confidence Intervals
We use the methods of Hillis et al. 2008 [10] to determine the t-statistic, the corresponding degrees of freedom, and the p-value
of the null hypothesis that the two modalities have equal AUCs (or that the single modality AUC = 0.5), and the confidence
interval on the difference (or the confidence around the single modality AUC).
Size and Analyze Multi-reader Multi-case Reader Studies
8of 26
Download iMRMC at https://github.com/DIDSR/iMRMC/releases
2.4 Sizing a Future Study
2.4 Sizing a Future Study
The variance components can be used to size future studies. In particular, the user specifies the new study design with number
of split-plot groups, pairing of readers, pairing of cases, significance level, expected effect size, and the number of readers,
normal cases and abnormal cases. The software calculates the expected statistical power of the new study. The software
implements two kinds of hypothesis testing. One is for a single modality; the null hypothesis is that the AUC is equal to a
specified value. The second compares modalities, the null hypothesis is that the two modalities have the same AUC. The
statistical power is computed in two ways. One uses the Z-test, and the other uses an F test from Hillis [9]. The Z-test assumes
the variance is known even though it is actually estimated. The Z-test uses the ratio of the affect size over the square root
of its estimated variance as the test statistic, and assumes the test statistic follows a standard normal distribution. The F-test
does not assume the variance is known. It estimates the non-centrality parameter and the denominator degrees of freedom
values using the components of variance (input or estimated) for the specified case and reader sample size and effect size.
The degrees of freedom is also determined with an alternate calculation from Obuchowski et al. 2012 [11]. The statistical power
is then computed using F distributions, unless the degrees of freedom is greater than 50, at which point the power is computed
using a standard normal distribution.
Size and Analyze Multi-reader Multi-case Reader Studies
9of 26
Download iMRMC at https://github.com/DIDSR/iMRMC/releases
3. Database
3. Database
The software includes a database that consists of results from simulated data and results from previous MRMC reader studies.
We have accrued many reader study datasets and are working on the letters of permission to include them. The datasets are
from a variety of sources including FDA sponsor data for imaging device approvals, as well as academic research studies.
Each dataset contains
# Basic information of the study: this includes the source of the study, a summary of the study, related publications,
and other information.
#
Key information of the study: number of readers, number non-diseased cases, number of diseased cases,
modalities used, and task.
#
Variance representations as outlined above.
See Appendix A for details regarding the summary information.
In addition to the information outlined above, we are working on permission letters to share the ROC scores for each study. The
ROC scores that we share are listed on the website. You can download a file with the study description that produced the ROC
scores followed by the ROC scores themselves; the file is formatted for use with the iMRMC software. See the “Data Format
for ROC Ratings” section for more information on the iMRMC file formatting and the “Sample Permission Letter” section below.
We welcome more data. Please contact us.
Size and Analyze Multi-reader Multi-case Reader Studies
10of 26
Download iMRMC at https://github.com/DIDSR/iMRMC/releases
4. Using the iMRMC Application
4. Using the iMRMC Application
<TODO>: Insert description text here... And don't forget to add keyword for this topic
Size and Analyze Multi-reader Multi-case Reader Studies
11of 26
Download iMRMC at https://github.com/DIDSR/iMRMC/releases
4.1 Technical Specifications
4.1 Technical Specifications
The software is written in Java. It requires Java Runtime Environment (JRE) 1.6 or 1.7.
The application has been tested on the following operating systems:
#
Ubuntu Linux 12.04 32-bit, success
#
Windows 7 64-bit, success
Please let us know what system you have tried to run the application on, and its success. We are attempting to make the
application as portable as possible.
Size and Analyze Multi-reader Multi-case Reader Studies
12of 26
Download iMRMC at https://github.com/DIDSR/iMRMC/releases
4.2 First Time Use
4.2 First Time Use
Test that Java is working on your computer by going to
http://java.com/en/download/testjava.jsp
Running the application:
Extract imrmc.zip to the desired folder. It should contain imrmc.jar and the DB folder, containing files for the imrmc database.
Double click on imrmc.jar to start the application. Alternatively, navigate to the containing folder via command line and run the
command ‘java –jar imrmc.jar’ to start the application (This requires the java system variable to be set if it has not been already.
See http://docs.oracle.com/javase/tutorial/essential/environment/paths.html).
Size and Analyze Multi-reader Multi-case Reader Studies
13of 26
Download iMRMC at https://github.com/DIDSR/iMRMC/releases
4.3 Input data
4.3 Input data
The user may choose “Input raw data…”, where “raw data” refers to ROC ratings from an MRMC reader study. See the “Data
Format for ROC Ratings” section below to create a properly formatted file of ROC ratings. Click on the “Browse” button to
open up a file browser and navigate to a suitable .imrmc input file. Select open or double click on the file to load it into the
application. A dialog box will pop up displaying information about the study content (number of readers, number of diseased
and normal cases, and number of modalities). If the study is not fully crossed, a dialog box will inform the user as well. If the
input file is incorrectly formatted, a dialog box will inform the user, and provide the line in the file at which the error occurs.
Figure 4.3.2: Raw study data input panel
Size and Analyze Multi-reader Multi-case Reader Studies
14of 26
Download iMRMC at https://github.com/DIDSR/iMRMC/releases
4.4 Data Format for ROC Ratings
4.4 Data Format for ROC Ratings
Here we describe a properly formatted file of ROC ratings. The file format has two parts: the study description at the top
followed by a list of ROC ratings.
Size and Analyze Multi-reader Multi-case Reader Studies
15of 26
Download iMRMC at https://github.com/DIDSR/iMRMC/releases
4.4.1 Study Description
4.4.1 Study Description
The study description can include any information as free text, or no information at all. iMRMC looks for four lines
corresponding to the size of the experiment.
#
N0 = number of cases without disease
#
N1 = number of cases with disease
#
NR = number of readers
#
NM = number of modalities
If it finds this information (formatting shown below), it shows these numbers next to the numbers derived by reading in the data;
this is a simple data input check. The study description ends with a line stating “BEGIN DATA:”.
We demonstrate the formatting of these lines in an example. If the study has 9 readers, 55 diseased patients, and 75 nondiseased patients, and 5 modalities, then a corresponding study description can be the following lines:
Size and Analyze Multi-reader Multi-case Reader Studies
16of 26
Download iMRMC at https://github.com/DIDSR/iMRMC/releases
4.4.2 List of ROC Ratings
4.4.2 List of ROC Ratings
The list of ROC ratings has a row for each score—each reader, case, modality combination observed—in any order. It also
has rows specifying the truth state of each case (given by the reference gold-standard reader = truth). iMRMC can handle
data that is not fully-crossed for any number of modalities, though only two of those modalities may be used at a time for
variance analysis.
For rows recording reader scores, there are four fields in the following order:
#
#
reader I.D. (string)
o The reader I.D. can be any string (or number) to identify a study reader. Make sure that this reader I.D.
appears the same way each time or the program will think that there are multiple readers. For example,
iMRMC believes that “novice0247”, “novice 0247”, “NOVICE0247” are three different readers. Do not change
the I.D. of a reader when recording his or her scores from a different modality.
o Do not use “-1” as that indicates a row recording the truth state.
case I.D. (string)
o The case I.D. can be any string (or number) to identify the case imaged. Make sure that this case appears
the same way each time or the program will think that there are multiple cases. For example, iMRMC believes
that “TeacherMale15”, “Male Teacher15”, “TeacherM15” are three different cases. Do not change the I.D. of
a case when recording its scores from a different modality.
#
modality I.D. (string)
o The modality I.D. can be any string (or number) to identify the imaging modality. Some examples could be:
“film”, “digital”, “digital+CAD”, “MRI”. Again be careful how you type the modality I.D.
#
score (integer or float)
o The score is the level of confidence, likelihood, rank, or severity of disease that the reader gives to the case
for the modality indicated. Low scores correspond to truth state 0 (normal or no disease) and high scores
correspond to truth state 1 (abnormal or disease). If low scores correspond to truth state 1 and high scores
correspond to truth state 0, AUC calculations and ROC curve displays will be incorrect.
For rows recording truth states, there are also four fields in the following order:
#
-1
o Rows recording case truth states are denoted with a -1 in the first field.
#
case id (integer)
o Every case I.D. scored by a reader (appears in a row recording a reader score described above) must
have one and only one row recording the truth state. Each case must be defined as 0 (normal or no disease)
or 1 (abnormal or disease).
#
arbitrary string (string)
o This string can be anything and it needs to be something. It is currently unused by iMRMC. You can use
“truth” as a reminder of what the row is recording.
#
truth state (0 or 1)
o The truth state 0 indicates normal or no disease. The truth state 1 indicates abnormal or disease.
Higher reader scores should indicate higher likelihood or confidence of disease and low ratings should indicate lesser likelihood
or confidence of disease.
FIELDS MUST BE SEPARATED BY COMMAS.
For example, the first few rows could look like the following:
Size and Analyze Multi-reader Multi-case Reader Studies
17of 26
Download iMRMC at https://github.com/DIDSR/iMRMC/releases
4.4.2 List of ROC Ratings
In the example, we see the ROC ratings from two readers reading two cases with three modalities each.
#
The first line specifies truth state for “case1” # Rows 3-5 show “reader1” scores for “case1” on
is abnormal
modalities “film”, “digital”, and “digital+CAD”.
o Field 1: -1 indicates row records truth state # Rows 6-8 show “reader2” scores for “case1” on
o Field 2: case I.D. = “case1”
modalities “film”, “digital”, and “digital+CAD”.
o Field 3: arbitrary string = “truth”
# Rows 9-11 show “reader1” scores for “case2” on
o Field 4: truth state = 1
modalities “film”, “digital”, and “digital+CAD”.
# The second line specifies truth state for case2
#
Rows 12-14 show “reader2” scores for
is normal
“case2” on modalities “film”, “digital”, and
o Field 1: -1 indicates row records truth state
“digital+CAD”.
o Field 2: case I.D. = “case2”
o Field 3: arbitrary string = “truth”
o Field 4: truth state = 0
Size and Analyze Multi-reader Multi-case Reader Studies
18of 26
Download iMRMC at https://github.com/DIDSR/iMRMC/releases
4.4.3 Formating Errors
4.4.3 Formating Errors
Currently, iMRMC does not provide detailed feedback on formatting errors. The feedback it does provide is to report the
experiment size after successfully reading an input file.
Typical errors in formatting are as follows:
#
#
#
The truth state of every case must be defined once and only once.
o ERROR: Truth states not defined for all the cases.
o ERROR: Truth states multiply defined.
The row containing "BEGIN DATA:" must be typed exactly as given.
o ERROR: "BEGIN DATA:" not all upper-case.
o ERROR: "BEGIN DATA:" not terminated with a colon.
Commas with no spaces must be used to separate the four fields of data describing each ROC rating.
o ERROR: Spaces, tabs, or semicolons separate the data in the list of ROC ratings. Only commas should
be used.
Size and Analyze Multi-reader Multi-case Reader Studies
19of 26
Download iMRMC at https://github.com/DIDSR/iMRMC/releases
4.5 Data Analysis
4.5 Data Analysis
ROC Data Analysis Charts
Figure 4.5.1: Data analysis diagram buttons
If raw data was input from a file of ROC ratings, the user can view some visual representations of this data. The “Input Statistics
Charts” button, located next to “Format Info.” causes two charts to appear. These charts show information about the study,
allowing the user to easily determine if the study has been input correctly. One chart displays the number of cases that each
reader scored, and the other displays the number of readers that scored each case. The bars allow for easy visual recognition
of where the study is incomplete. Hovering the mouse over a particular bar displays the relevant information for the data.
Figure 4.5.2: Input statistics charts
For a more in-depth view of the completeness of the study, the “Show Study Design” button allows the user to view the
presence or absence of score data per modality. The user selects a modality to view, and a chart displaying each case and each
reader appears. A black square represents an existing score for said modality, case, and reader. A white square represents
missing data at this point. Hovering the mouse over a particular square displays this information as “Present/Absent (Case
# / Reader #)”.
Figure 4.5.3: Study design chart
The “Show ROC Curve” button asks for a modality, and then displays the ROC curves for the given modality. Selecting
the various checkboxes on the bottom border of the chart window enables/disables ROC curves for each individual reader,
as well as average ROC curves, of which there are four types. Horizontal Average averages in specificity at every possible
Size and Analyze Multi-reader Multi-case Reader Studies
20of 26
Download iMRMC at https://github.com/DIDSR/iMRMC/releases
4.5 Data Analysis
specificity, Vertical Average averages in sensitivity at every possible specificity, and Diagonal Average averages in the direction
of sensitivity+specificity at every sensitivity-specificity (along x=y diagonal line). Pooled Average gathers all reader scores into
one large set and calculates the ROC curve across that set.
Figure 4.5.4: ROC curve chart
These charts are all resizable, and their contents will scale to the new size automatically. Additionally, clicking and dragging
from an upper left to lower right direction zooms the view in on that area. Clicking and dragging from a lower right direction to
an upper left direction returns the view to its default zoom.
Variance Analysis
The user can estimate the components of variance for modality 1, modality 2, or the difference in modalities when data is input
from the database. Choose the desired modality with the radio buttons and click “MRMC variance analysis” to perform the
statistical analysis.
If data is input from raw ROC ratings, there will be a drop-down menu next to “Modality A” and Modality “B”, allowing the user
to choose from the various modalities in the input file. If one modality is selected in either only Modality A or only Modality B
and the other is set to none, the “MRMC Variance Analysis” button will show which modality the components of variance will
be estimated for. If a modality is selected in both Modality A and Modality B, the components of variance will be estimated for
the difference in the two modalities. The “MRMC Variance Analysis” button will reflect this.
For manual input of variance components, the relevant information of the study is input, and the radio buttons to choose
between single modality and difference are available. Once this is done, the “MRMC Variance Analysis” button will perform
the statistical analysis.
If any of the resulting components are negative, the user will be asked if they would like to use MLE estimates instead of
the usual u-statistics estimates. The MLE estimates of the components are never negative, and this can help with calculating
the variance/error sometimes. If MLE estimates are being used, a double asterisk (**) will appear next to the decomposition
names in the table.
The populated table shows the components of variance, which can be given in five different representations: these are available
by clicking on the corresponding tab of the “Statistical Analysis” table. For the BDG and BCK representation we have 7 total
rows. The “comp M0” and “comp M1” rows show the components for each modality, and the “coeff M0” and “coeff M1” rows
give the corresponding coefficients/weights for each component of variance. The “product M0, M1” shows the covariance
components for both modalities, and the “2*coeff M0-M1” gives its coefficient/weight. The “total” row displays the contribution
towards the total variance by each component. The contributions are summed to produce the total variance, and the square
Size and Analyze Multi-reader Multi-case Reader Studies
21of 26
Download iMRMC at https://github.com/DIDSR/iMRMC/releases
4.5 Data Analysis
root of that is the standard error, which is displayed to the right of the table. The DBM, OR, and MS tabs are similar, but only
contain 3 rows, showing the components, coefficients, and total without separating by modality.
Figure 4.5.5: Variance analysis results table
Size and Analyze Multi-reader Multi-case Reader Studies
22of 26
Download iMRMC at https://github.com/DIDSR/iMRMC/releases
4.6 Sizing a Future Study
4.6 Sizing a Future Study
The second panel is for sizing a trial using the components of variance shown. Input the number of split-plot groups, pairing
of readers, pairing of cases, number of readers, non-diseased cases, and diseased cases, as well as the significance level
and the effect size. Then click “Size a Trial”. The summary statistics that are produced show the square root total variance, the
delta, degrees of freedom by Hillis’ method with F-test [9] and BDG method [11], CVF, and statistical power by Hillis’ method
and the Z test method.
Figure 4.6.1: Study sizing panel
Size and Analyze Multi-reader Multi-case Reader Studies
23of 26
Download iMRMC at https://github.com/DIDSR/iMRMC/releases
4.7 Generate a Report
4.7 Generate a Report
The following information is summarized and displayed by the GUI. A report of the results may also be generated:
1) size of the existing study and AUC values
2) components of variance calculated from the existing study in BDG, BCK, DBM, OR, MS representations
3) size of the future study and AUC values
4) effect size, significance level, and corresponding statistical power
5)
For input from database or input of raw data, the report may also include a description of the existing study if
available. For the manual input, the report may not include all four kinds of components of variance, depending on
whether the input components of variance are convertible to other types of components of variances. For example,
if the user chooses to input DBM components of variance, OR components can be derived while BDG components
cannot.
Size and Analyze Multi-reader Multi-case Reader Studies
24of 26
Download iMRMC at https://github.com/DIDSR/iMRMC/releases
4.8 Database
4.8 Database
At the bottom of the applet is the means by which we are sharing the whole database (basic information of each study, size
of the study, and variance decompositions). The “database” is populated by simulated datasets right now. The buttons at the
bottom are related to downloading a spread sheet of that data (work in progress).
Size and Analyze Multi-reader Multi-case Reader Studies
25of 26
Download iMRMC at https://github.com/DIDSR/iMRMC/releases
5. References
5. References
[1] Metz, C. E., “Basic principles of ROC analysis.”, Semin Nucl Med. 1978 Oct;8(4):283-98.
[2] Efron, B. & Tibshirani, R. J, “An Introduction to the Bootstrap: Monographs on Statistics and Applied Probability”, Chapman
& Hall, New York, N.Y, 1993.
[3] Gallas, B. D.; Bandos, A.; Samuelson, F. & Wagner, R. F. (2009), 'A Framework for Random-Effects ROC Analysis: Biases
with the Bootstrap and Other Variance Estimators', Commun Stat A-Theory 38(15), 2586-2603
[4] Gallas, B. D. (2006), 'One-Shot Estimate of MRMC Variance: AUC', Acad Radiol 13(3), 353-362.
[5] Gallas, B. D. & Brown, D. G. (2008), 'Reader Studies for Validation of CAD Systems', Neural Networks 21(2-3), 387-397.
[6] Clarkson, E.; Kupinski, M. A. & Barrett, H. H. (2006), 'A Probabilistic Model for the MRMC Method. Part 1.Theoretical
Development', Acad Radiol 13(11), 1410-1421.
[7] Dorfman, D. D.; Berbaum, K. S. & Metz, C. E. (1992), 'Receiver Operating Characteristic Rating Analysis: Generalization
to the Population of Readers and Patients with the Jackknife Method', Invest Radiol 27(9), 723-731.
[8] Obuchowski, N. A. (1995), 'Multireader, Multimodality Receiver Operating Characteristic Curve Studies: Hypothesis Testing
and Sample Size Estimation Using an Analysis of Variance Approach with Dependent Observations', Acad Radiol 2(Suppl
1), S22-S29.
[9] Hillis S.L.,
Berbaum K. S. “Power estimation for the Dorfman-Berbaum-Metz method.” Acad Radiol. 2004
Nov;11(11):1260-73, 2004.
[10] Hillis, S. L.; Berbaum, K. S. & Metz, C. E. (2008), 'Recent developments in the Dorfman-Berbaum-Metz procedure for
multireader ROC study analysis.', Acad Radiol 15(5), 647--661.
[11] Obuchowski, N.A.; Gallas, B. D. & Hillis, S. L. (2012), ‘Multi-reader ROC Studies with Split-plot Designs: A Comparison
of Statistical Methods’, Acad Radiol 19(12), 1508-1517.
[12] Wagner, R. F.; Metz, C. E. & Campbell, G. (2007), 'Assessment of Medical Imaging Systems and Computer Aids: A Tutorial
Review.' Acad Radiol, 14, (6), 723-748.
[13] Gallas, B. D.; Chan, H.-P.; D'Orsi, C. J.; Dodd, L. E.; Giger, M. L.; Gur, D.; Krupinski, E. A.; Metz, C. E.; Myers, K. J.;
Obuchowski, N. A.; Sahiner, B.; Toledano, A. Y. & Zuley, M. L. (2012), 'Evaluating Imaging and Computer-aided Detection and
Diagnosis Devices at the FDA.' Acad Radiol, 19, (4), 463-477.
Size and Analyze Multi-reader Multi-case Reader Studies
26of 26