1
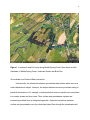
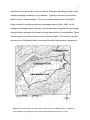
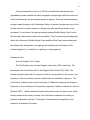
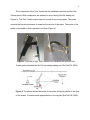
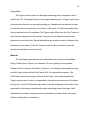
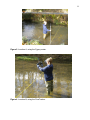
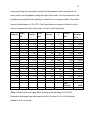
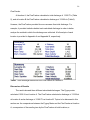
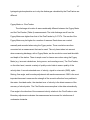
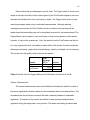
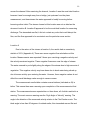
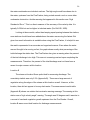
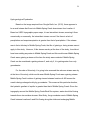
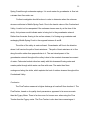
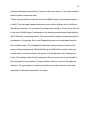
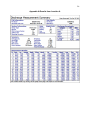
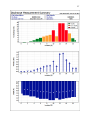
A Hydrologic Study of the Middle Spring Creek
near Shippensburg, Pennsylvania
Keri Simmons
M.S. Practical Exam
October 26, 2012
Table of Contents
Abstract……………………………………………………………………………………………………………….1
Introduction………………………………………………………………………………………………………..1
Literature Review.……………………………………………………………………………………………….2
Study Area.…………………………………………………………………………………………………2
Groundwater and Surface Water Interaction….………………………………….………....4
Karst Hydrology………………………………………………………………………………………….3
Equipment……………………………………………………………………………………………….....8
Acoustic Doppler Flow Tracker.………………………………………………..….……8
Pygmy Meter……...…………………………………………………………………………….10
Methods……………………………………………………………………………………………………………….10
Pygmy Meter………………………………………………………………………………………….......12
FlowTracker..……………………………………………………………………………………………..13
Results…………………………………………………………………………………………………………….......14
Pygmy Meter….…..………………………………………………………………………………………14
FlowTracker………………………………………………………………………………………………16
Discussion of Results ………………………………………………………………………………………....16
Pygmy Meter vs. FlowTracker..……………………………………………………………...……17
Stream Characteristics………………………………………………………………………………..18
Location A………………………………………………………………………………….........19
Location B ……………………………………………………………………………………….20
Hydrogeological Explanation ………………………………………………………………………21
Conclusion …………………………………………………………………………………………………………..22
References Cited...………………………………………………………………………………………………..24
Figures and Tables
Figure 1…………………………………………………………………………………………………………………4
Figure 2…………………………………………………………………………………………………………………7
Figure 3…………………………………………………………………………………………………………….......9
Figure 4…………………………………………………………………………………………………………….......9
Figure 5…………………………………………………………………………………………………………….....11
Figure 6…………………………………………………………………………………………………………….....11
Table 1…………………………………………………………………………………………………………………13
Table 2…………………………………………………………………………………………………………………14
Table 3…………………………………………………………………………………………………………….......14
Table 4….……………………………………………………………………………………………………………..16
Appendices
Appendix A: FlowTracker Results from Location A……………………………………………….26
Appendix B: FlowTracker Results from Location B……………………………………………….30
1
Abstract
This study was conducted at two different locations along Middle Spring Creek to
determine if the stream segment between the measurement points was a losing or
gaining segment. At the time of the study, Middle Spring Creek was generally a gaining
system. Measurements were taken using a Pygmy Meter and a state-of-the-art Acoustic
Doppler FlowTracker. The Pygmy Meter was used at only one site to compare its
results to those of the Acoustic Doppler FlowTracker. The FlowTracker measurements
appeared to be more accurate than those of the Pygmy Meter. The FlowTracker
provides quality check information to assure the accuracy of its readings. Given that the
stream was a gaining stream at the time the study was conducted, it can be said that
baseflow was contributing to the flow of the stream. The geology of the Cumberland
Valley allows for a vast underground network of stream channels. These underground
channels are a recharging mechanism for the two main streams that drain the valley;
Conodoguinet and Yellow Breeches Creeks. The few surface streams in the valley
allude to the theory that much of the water in the area must flow underground.
Introduction
It was once believed that there was no connection between surface water and
groundwater. If surface water was lost to the subsurface, it was thought to never return
to the surface. However, this is no longer the case. It is now known that surface water
and ground water are constantly interacting. Depending the hydrgeologic conditions,
aquifers and streams will feed each other. This is where the idea of gaining and losing
streams arise.
This study was conducted by collecting discharge data at Middle Spring Creek
near Shippensburg, Pennsylvania. The discharge data was collected at two locations,
roughly ---miles apart, enclosing a middle segment. Two pieces of equipment; a Pygmy
meter and the state-of-the-art Acoustic Doppler Flow Tracker, were used for the
discharge data collection. Both pieces of equipment are used by the U.S. Geologic
Survey and are considered acceptable methods of measuring discharge (Rehmel,
2007)
2
This study focused on answering the following questions: Is Middle Spring Creek
a gaining or losing stream between the two measurement locations? What
hydrogeological conditions could affect that status of gaining or losing? Shippensburg is
located in a karst terrain, which can complicate the hydrogeological conditions.
Literature Review
Study Area
Shippensburg is located in south-central Pennsylvania in the Cumberland Valley
between South Mountain, to the south, and Blue Mountain, to the north. South Mountain
is part of the Blue Ridge Physiographic Province, and Blue Mountain is part of the Ridge
and Valley Physiographic Province. In the Ridge and Valley Physiographic Province, the
bedrock has been folded and faulted due to tectonic activity during the formation of
Pangaea. The structural trend of the area is to the east-northeast. Tectonic activity
caused the carbonate bedrock to fracture. Due to the rate at which carbonate rocks
dissolve, these fractures enlarge from the flow of infiltrating water. Together with the
dissolution action of water, karst features such as sinkholes, caves, or solution cavities
are formed and become underground conduits for water to flow. Karst features that can
be seen in the valley are sinkholes, closed depressions, sinking springs, and swallow
holes (Chichester, 1996).
A colluvium wedge, of thickness up to 137 meters thick, exists at the border of
South Mountain (Chichester, 2006). This colluvium extends and thins to the middle of
the Cumberland Valley allowing carbonate outcrops to appear. This colluvium consists
of resistant quartzite material from which South Mountain is derived.
3
There are two main surface streams that drain the valley: the Conodoguinet
Creek and Yellow Breeches Creek (Hurd et. al., 2010). The Conodoguinet runs along
the base of Blue Mountain and Yellow Breeches runs along the base of South
Mountain. The Conodoguinet Creek drains most of the Cumberland Valley before
flowing to the Susquehanna River (Becher and Root, 1981). The Middle Spring Creek
and Burd Run system, located in the southwestern part of the Cumberland County, is
the only surface water system that connects the headwaters on South Mountain to the
Conodoguinet Creek (Chichester, 1996) (Figure 1).
The climate of south-central Pennsylvania is classified as humid-continental
(Chichester, 1996). The average daily temperature in October is 55 degrees Fahrenheit.
The average rainfall in October is 2.99 inches (Shippensburg University Weather Page).
The average daily temperature, for October 2012, was 56 degrees and the amount of
precipitation was 1.82 inches. On the day the measurements were taken, Shippensburg
was falling short of the average precipitation of 3.01 inches, which is based on
precipitation data collection since 1932.
The two locations at which the measurements were taken can be seen in Figure
1. Location A, was just downstream of the confluence of Burd Run and Middle Spring
Creek. Location B, was approximately 2 miles downstream, and a much smaller stream
feeds into it about 1.3 miles downstream from Location A.
4
Figure 1. Locations A and B of study along Middle Spring Creek. Also shown are the
tributaries to Middle Spring Creek: Unknown Stream and Burd Run.
Groundwater and Surface Water Interaction
Until recently, the interaction between groundwater and surface water was not a
much talked-about subject. However, the subject has become more prominent owing to
practical observations. For example, contaminants that enter an aquifer have resurfaced
in a nearby stream and vice versa. Thus, surface and groundwater systems are
increasingly studied from an integrated approach. Hydraulic interactions between
surface and groundwater occur by subsurface lateral flow through the unsaturated soil
5
and by infiltration into or exfiltration from the saturated zones (Sophocleous, 2002). In
karst terrains, the interactions between surface water and groundwater can occur
through fracture and/or solution channels.
In order to better understand groundwater and surface water interactions, one
must understand the effects of the entire hydrogeologic environment (Sophocleous,
2002). For example, groundwater flow is affected by climate, geology, and topography.
Climate affects groundwater through precipitation, a major source of recharge, and
evapotranspiration (a major loss). Groundwater is also affected by geology due to the
various properties of the host rocks such as the hydraulic conductivity and porosity.
Similarly, topography controls groundwater flow directions similar to its control on
surface streams due to slope changes. These interactions were not completely
accepted until the 1960’s when water management started to become an issue.
More broadly, groundwater-surface water interaction is best exemplified in the
context of whether a surface water body recharges an aquifer, or vise versa. All rocks
have the ability to hold and transmit water through the pore spaces that exist between
mineral grains (White, 1988). Rock formations capable of holding large amounts of
water are known as aquifers. Water infiltrates through the soil and into the rock
formations below under the influence of gravity. Once it reaches the water table, the
area that separates the air filled pore spaces from the water filled pore spaces it ceases
downward movement. If a permeable zone of rock allows the movement of water
beneath an impermeable zone, this is known as a confined aquifer. The water located in
this area is not known as water table because it does not communicate freely with the
surface. Rather, it is known as a piezometric surface. This refers to the amount of
6
pressure head beneath the confining layer. The water in an aquifer moves under the
influence of hydraulic gradient from sources of recharge to areas of discharge. The
hydraulic gradient of the water table is highest at areas of recharge and lowest at areas
of discharge (White, 1988). This hydraulic gradient determines whether or not the
surface stream will recharge an aquifer or the surface stream will be recharged by the
aquifer. If the gradient of the aquifer is higher than that of the stream, the aquifer will
feed the stream. When this occurs, the stream is known as an effluent (gaining) stream.
If the gradient of the stream is higher than that of the aquifer, the stream will feed the
aquifer. This is type of stream would be an influent (losing) stream. The flow of water
that recharges and maintains flow of a stream, between precipitation events, is known
as baseflow (Sophocleus, 2002). For many streams and springs in the Cumberland
Valley area, this baseflow is the primary source of recharge. The hydrology of the
Cumberland Valley varies greatly due to the carbonate bedrock underlying the valley.
The same hydrologic fundamentals, as discussed above, are still at work but the
aquifers can vary greatly.
Karst Hydrology
Aquifers located in carbonate bedrock are known as carbonate aquifers.
Carbonate aquifers can vary greatly in their properties. Carbonate aquifers vary from
other aquifers because of the integrated system of pipe-like conduits that transport
water in a localized area. Carbonate bedrock can dissolve quite rapidly in an
environment where water is readily available. This dissolution of calcite in the bedrock
can form subsurface pathways for water to travel. In karst terrains, groundwater is very
7
abundant and can be found in caves or conduits. Sinkholes and sinking springs can be
a direct recharging mechanism for groundwater. Typically in an area of karst terrain,
there is a lack of surface streams. This lack of surface streams is due to the valley
losing its water to developing underground drainage system (White, 1988). As the
underground drainage system develops, more stream water along with the groundwater
that would have recharged the stream during dry times diverts to the subsurface. Figure
2 shows the lack of surface streams in the Cumberland Valley. This scarcity of surface
streams in the Cumberland Valley is sure sign that water flows primarily underground.
Figure 2. This map shows the paucity surface streams in the Cumberland Valley, Cumberland
County between Conodoguinet Creek and Yellow Breeches Creek (Hurd et al., 2010).
8
A study conducted by Hurd et al. (2010) concluded that water entering the
groundwater system parallels the valley topography and geologic strike from west and
south and discharges the groundwater system at springs. There are several limestone
springs located throughout the Cumberland Valley. In general, springs may come to the
surface and form a surface stream, or springs may enter an existing stream at the
streambed. It is not clear if any springs emerge beneath Middle Spring Creek, but its
flow through a karst terrain makes this a possibility. Thus, by measuring discharge just
below the confluence of Middle Spring Creek and Burd Run Creek, and another point
two miles further downstream, we might get an indication about the status of the
enclosed segment (i.e. whether it is a gaining or losing segment).
Equipment Used
Acoustic Doppler Flow Tracker
The FlowTracker uses acoustic Doppler velocimeter (ADV) technology. The
basis behind the FlowTracker ADV is the Doppler Shift (SonTek/YSI, 2009). The
Doppler principle states that if a source of sound is moving relative to the receiver, the
frequency of the sound at the receiver is shifted from the transmitter frequency. The
FlowTracker operates at an acoustic frequency of 10Mhz and measures the change in
frequency of sound reflected off the particles (organisms, bubbles, sediment) in the flow
(Rehmel, 2007). Unlike mechanical meters that use the motion of water to turn, which
directly measures the velocity of water, the FlowTracker measures the velocity of
particles suspended in the flow. The quality of measurement is dependent on the
existence of particles in the water.
9
The components of the Flow Tracker are the handheld controller and the Flow
Tracker probe. Both components are attached to a top-setting SonTek wading rod
(Figure 3). The Flow Tracker probe does not consist of any moving parts. The probe
contains the acoustics elements to measure the velocity of the water. The center of the
probe is orientated so that is parallel to the flow (Figure 4).
Figure 3. From left to right, Flow Tracker ADV handheld unit and the Flow
Tracker probe attached the SonTek top-setting wading rod (SonTek/YSI, 2009).
Figure 4. The picture shows the center of the probe should be parallel to the flow
of the stream. It should remain perpendicular to the tag line (SonTek/YSI, 2009).
10
Pygmy Meter
The Pygmy current meter is a discharge-measuring piece of equipment and is
used by the U.S. Geological Survey for discharge measurements. A Pygmy meter has a
rotating meter attached to a top-setting wading rod. Headphones are attached in order
to hear the clicks that represent one revolution of the meter. The clicks are heard every
time an electrical circuit is completed. The Pygmy meter differs from the Flow Tracker in
that it requires two people to be involved. One person must keep time and another
person must count the clicks. Manual calculations are needed in order to determine the
discharge at each station. The Flow Tracker counts the time needed to record the
velocity and calculates velocity instantly.
Methods
The discharge measurements were performed at two locations along Middle
Spring Creek (refer to Figure 1) to determine if it was a gaining or losing stream
between the two locations. At location A (Figure 3), the discharge was measured using
both the Pygmy meter and the FlowTracker ADV for comparative purposes. The
FlowTracker was the instrument of choice in this study. It was used alongside the
Pygmy current meter in order to compare and contrast the two instruments. At location
B (Figure 4), only the FlowTracker was used to calculate discharge. Each location was
examined for ideal stream characteristics when calculating stream discharge. Ideal
characteristics include a relatively smooth streambed free of debris that could cause
eddies, pooling water, or turbulence.
11
Figure 5. Location A, using the Pygmy meter.
Figure 6. Location B, using the FlowTracker.
12
Pygmy Meter
Upon locating an ideal cross-section of the stream channel to be measured, a
measuring tape was anchored to both edges of the stream channel. The total width of
the channel was determined. The width was then divided into smaller cross-sections for
discharge measurements following the guidelines set up by the U.S. Environmental
Protection, but was based on USGS standards of practice (Forrest). This procedure
was used at both locations (A and B).
The Pygmy meter was then set up and tested to begin discharge measurements.
The meter was attached to the wadding rod and a test spin was performed after
lubricating the meter. The meter surpassed 60 seconds during the test spin. The
headphones were then attached to the wadding rod. Once the meter and site setup
were complete, measurements were taken for 18 cross-sections across the channel.
The meter was adjusted based on the sixty percent depth rule for measuring discharge.
The 60 percent rule is most commonly used and is the method used by the U.S.
Geological Survey. The sixty-percent rule is used when the water depth is 2.5 feet or
less. In general, water velocity at 60 percent of the depth is a good average velocity of
the water column. At each station, revolutions (R), heard as clicks through the
headphones, were counted for 40 seconds and recorded. These were used in the
formula below to determine cross-sectional velocities (USGS, 1999):
Velocity (V)= 0.0312+0.9604R
Where: V= velocity (ft/sec)
R=
13
The calculated velocities were then used to determine discharge for each crosssection using the following equation (USGS, 2012):
Q=VA
Where: Q= Discharge
V=Velocity
A=Area
The total discharge at the location was determined by summing all crosssectional discharges.
FlowTracker
After completing measurements with the Pygmy Meter at location A, the
FlowTracker was then setup for use to determine discharge. The same cross-sections
used for the Pygmy Meter were used for the FlowTracker. At location B, the site was set
up according to the method above but 24 cross-sections were taken due to the greater
width of the stream at this point.
The first step in using the FlowTracker was to put the wading rod together and
then mount the Handheld Unit to the wading rod. A name was given to the file, site, and
operator before beginning measurements. The default mode (the desired mode for this
research) for collecting measurements was discharge mode, which uses the midsection
discharge equation. This equation is the same equation used for the Pygmy Meter
described above. The 60 percent of depth rule was chosen by using the “Method +”
button. The FlowTracker then asked to run a Quality Check Test. This was done before
beginning measurements at both sites to assure the equipment was working properly.
14
To begin measurements, the meter was placed at the starting edge of the stream. The
first screen that appeared was for the starting edge. Depth of water and location
(distance) were the only items entered at this station. The “next station” button was then
pressed and the depth and location information was entered before pressing “Measure”.
After 40 seconds, the FlowTracker calculated a velocity for that particular station. The
station could be accepted or repeated if desired. Once accepted, FlowTracker Handheld
Device moved to the next station and this process was repeated until the other edge of
the channel was reached. Once at the other end of channel, the “end station” button
was pressed. This let the computer know the section was completed so the handheld
unit could calculate the discharge. In order to calculate the total discharge, the
“calculate disch.” button was pressed and a total discharge was displayed instantly. An
advantage of using the Flow Tracker over the Pygmy is there is no room for human
error when calculating the discharge of the stream.
In order to interpret the data, the FlowTracker software was used. This software
was extremely user friendly and allowed for quick interpretation of the data. Once the
handheld device was connected to a computer, the software downloaded the data and
gave the results in a very complete and organized fashion. The data were then
interpreted and notes for future use were made.
Results
Pygmy Meter
The results for measurements taken with the Pygmy Meter are given in Table 1.
The total width of the stream was 17 feet. Measurements were taken in one-foot
15
increments along the cross section, except the first measure, which was taken at 0.5
feet in order to avoid vegetation along the edge of the stream. The cross-sections of the
streambed were relatively flat, requiring no variation in cross-section widths. The results
showed total discharge of 15.92 ft3/s. The Pygmy Meter was used at Location A only in
order to compare the results of the meter to those of the FlowTracker.
Stage (ft)
1.02
1.2
1.1
1.25
1.2
1.4
1.6
1.5
1.5
1.55
1.7
1.6
1.65
1.45
1.55
1.6
1.5
1.4
Width
(ft)
2
Area (ft )
0.5
1
1
1
1
1
1
1
1
1
1
1
1
1
1
1
1
1
0.51
1.2
1.1
1.25
1.2
1.4
1.6
1.5
1.5
1.55
1.7
1.6
1.65
1.45
1.55
1.6
1.5
1.4
No. of
Revs.
Time (s)
1
1
4
6
10
14
3
21
24
27
50
41
68
54
38
27
12
7
40
40
40
40
40
40
40
40
40
40
40
40
40
40
40
40
40
40
R
0.025
0.025
0.1
0.15
0.25
0.35
0.075
0.525
0.6
0.675
1.25
1.025
1.7
1.35
0.95
0.675
0.3
0.175
Velocity
(ft/s)
0.06
0.06
0.13
0.18
0.27
0.37
0.10
0.54
0.61
0.68
1.23
1.02
1.66
1.33
0.94
0.68
0.32
0.20
Subsection
discharge
(ft3/s)
0.028
0.066
0.140
0.219
0.326
0.514
0.165
0.803
0.911
1.053
2.094
1.625
2.745
1.925
1.463
1.087
0.479
0.279
Total
Discharge
Table 1. Results from the Pygmy Meter showing a total discharge of 15.92 ft3/s
Subsection discharges were calculated using Q=VA; where, V= No. of Revolutions
divided by time in seconds.
15.92
16
FlowTracker
At location A, the FlowTracker calculated a total discharge of 13.25 ft3/s (Table
2), and at location B the FlowTracker calculated a discharge of 15.66ft3/s (Table3).
However, the FlowTracker provided far more answers than total discharge. For
example, it provided statistics behind each calculated discharge in order to better
analyze the method in which the discharge was collected. A full analysis of each
location is provided in Appendix A and Appendix B, respectively.
Table 2. Total Discharge results from the FlowTracker at Location A.
Table3. Total discharge results from the FlowTracker at Location B.
Discussion of Results
The results showed three different calculated discharges. The Pygmy meter
calculated 15.92 ft3/s at location A. The FlowTracker calculated a discharge of 13.25ft3/s
at location A and a discharge of 15.66 ft3/s at location B. Topics to be discussed in this
section are: the comparisons between the Pygmy Meter and the FlowTracker at location
A; a comparison of the results given by the FlowTracker at both locations; a
17
hydrogeological explanation as to why the discharges calculated by the FlowTracker are
different.
Pygmy Meter vs. FlowTracker
The discharge at location A was considerably different between the Pygmy Meter
and the FlowTracker (Table 4) measurements. The total discharge result from the
Pygmy Meter was higher than that of the FlowTracker by 2.67 ft3/s. The results of the
Pygmy Meter may be higher for a number of reasons. Revolutions are counted
manually and recorded when using the Pygmy meter. Those revolutions are then
converted into a measurement that can be used. The only items taken into account
when measuring discharge, with a Pygmy Meter, are the revolution count and the width
and depth of the station. There is ample room for human error when using the Pygmy
Meter (e.g. incorrect calculations, timing errors, and counting errors). The FlowTracker,
on the other hand, records a variety of quality control data to ensure quality of the
velocity data. It records standard error of velocity, signal to noise ratio (SNR), spike
filtering, flow angle, and boundary adjustment with each measurement. SNR is the most
important because it measures the strength of the acoustic reflection from particles in
the water. As stated earlier, the standard error of velocity is the direct measure of the
accuracy of velocity data. The FlowTracker removes spikes in the data automatically.
Flow angle is the direction of the measured velocity relative to the FlowTracker x-axis.
Boundary adjustment evaluates the measurement environment for interference of
underwater obstacles.
18
Each method has its advantages over the other. The Pygmy meter is much more
simple to set-up in the field, but the results given by the FlowTracker appear to be more
accurate and certainly less time consuming to obtain. The Pygmy meter does not give
warning messages when trying to calculate measurements. Although warning
messages received from the FlowTracker can be a nuisance, the warnings let the
reader know that something may not be completely accurate for the measurement. The
Pygmy Meter is much easier to use in turbulent or slow moving waters for this reason,
however, it may not be as accurate. Also, the results from the FlowTracker are laid out
in a very organized format. It provides an entire table of the results for each subsection,
discharge uncertainty, graphs that show discharge, velocity, and depth, and a summary.
The results from the quality control test are also shown.
Method
Pygmy Meter
FlowTracker
Total
Discharge
(ft3/s)
15.92
13.25
15.66
Location
A
A
B
Table 4. Results from the Pygmy Meter and FlowTracker at locations A and B.
Stream Characteristics
The stream characteristics were much different at locations A and B. Location A
had some significantly turbulent water and the streambed was not an ideal surface. The
streambed was not as flat as one would like and contained patches of underwater
vegetation. The stretch of the stream accessible for easy access contained heavy
vegetation along the edges and a rocky bottom. The water was flowing at varied rates
19
across the channel. After examining the channel, Location A was the most ideal location
because it was far enough away from a bridge, just upstream from the place
measurement, and downstream the water appeared to hardly be moving before
becoming rather turbid. The stream channel at this location was not as ideal as the
stream at location B. Location B appeared to be the most ideal location for measuring
discharge. The streambed was flat, it did not contain any rocks that could disrupt the
flow, and the flow appeared to be consistent over the particular cross section.
Location A
Due to the nature of the stream at location A, the results had an uncertainty
statistic of 9.5% (Appendix A). There were some negative flow calculations at this
location. Measurements were repeated 3 times upon receiving a negative velocity and
the velocity remained negative. These negative flows were near the edge of stream.
The water seemed to pool slightly along the edges of the stream due to high amounts of
vegetation. This negative velocity may have been due to slack water being stirred up
due to human activity upon entering the water. However, these negative values do not
affect the overall discharge value enough to cause concern.
The measurement results table contains several stations (indicated as St) in
italics. This means there was a warning upon completion of the measurement at that
station. The measurements were repeated two or three times, all of which resulted in a
warning. The most common warning was the “High Angle of Velocity” warning. The
angle is the direction of the measured velocity relative to the FlowTracker x-axis. The
ideal angle is less than 20 degrees. As stated earlier, this streambed was not flat and
20
the water contained some turbulent sections. The high angle could have been due to
the water, upstream from the FlowTracker, being routed around a rock or some other
underwater obstruction. Another warning that appeared in this section was “High
Standard of Error”. This is a direct measure of the accuracy of the velocity data. It is
typically 0.03ft/s but can be higher in turbulent water (SonTek/YSI, 2009).
Looking at these results, rather than keeping equal spacing between the stations,
more stations should have been added where the water was moving the fastest. But
given how much information is available when using the FlowTracker, it is helpful to see
the results represented in an accurate and organized manner. Even where the water
was not thought to be moving so fast, the graph shows exactly what percentage of the
total discharge the station has. The FlowTracker also gives a warning when the percent
of the total discharge is too high. This was not a warning received upon completing the
measurements. Therefore, the percent of the total discharge must not have been a
cause for major concern at this location.
Location B
The stream at location B was quite ideal for measuring discharge. The
uncertainty statistic was only 2.2% (Appendix B). There was a large amount of
vegetation along the edges of the stream at this location as well. However, at this
location, there did not appear to be any slack water. The measurement results table
(Appendix B) shows one station that received a warning message. The warning at this
station was a “high velocity angle” warning. The angle was 20 degrees and it was due to
a mound of sand and vegetation growth upstream from the FlowTracker. Overall,
location B was a more ideal location for discharge measurements.
21
Hydrogeological Explanation
Based on the image acquired from Google Earth, Inc. (2012), there appears to
be a small stream that flows into Middle Spring Creek downstream from location A.
Based on USGS topographic paper maps, it is an intermittent stream; meaning it flows
occasionally or seasonally. An intermittent stream occurs if the there is a lack of
precipitation and evapotranspiration is greater than that of precipitation. If the stream
was in fact a tributary to Middle Spring Creek, the title of gaining or losing stream cannot
apply to this study. However, if this stream was dry at the time of the study, it would not
have been adding any water to Middle Spring Creek and this would mean Middle Spring
Creek was a gaining a stream at the time the study was conducted. Middle Spring
Creek can be considered a gaining stream if, and only if, it is gaining water from only
groundwater.
For the sake of this study, it is going to be assumed the unknown stream was dry
at the time of the study, which would mean Middle Spring Creek was a gaining stream.
Middle Spring Creek’s status of gaining stream between locations A & B means the
creek is being recharged solely by groundwater. This means at this particular location,
the hydraulic gradient of aquifer is greater than that of Middle Spring Creek. Given the
topography around the Middle Spring Creek/Burd Run system, water should be flowing
towards those two surface streams. Most likely, the groundwater west of Middle Spring
Creek between locations A and B is flowing along the strike and recharging Middle
22
Spring Creek through underwater springs. It is much easier for groundwater to flow into
a stream than flow under one.
Further investigation should be done in order to determine when the unknown
stream contributes to Middle Spring Creek. Due to the karstic nature of the Cumberland
Valley, it would not be unexpected if the unknown stream were dry at the time of the
study. A dry stream would indicate water is being lost to the groundwater network.
Rather than the water flowing in the surface stream, it is flowing as groundwater and
recharging Middle Spring Creek in the segment between A and B.
The strike of the valley is east-northeast. Groundwater will flow in the direction
where it will receive the path of least resistance. The path of least resistance is to flow
along the strike rather than perpendicular to it. The vast development of the
groundwater network throughout the valley is due to the constant downward movement
of water. Carbonate bedrock dissolves easily with this downward flowing water and
creates paths through which water can flow with ease. The water then flows
underground along the strike, which explains the lack of surface streams throughout the
Cumberland Valley.
Conclusion
The FlowTracker measured a higher discharge at location B than location A. The
FlowTracker, based on its quality check parameters, appeared to be more accurate
than the Pygmy Meter. There is far less room for human error when using the Flow
Tracker than the Pygmy meter. The Flow Tracker is also less time consuming as it
23
calculates discharge automatically at the end of the cross section. It then gives detailed
results to better interpret the data.
There is an intermittent stream that feeds into Middle Spring Creek between locations
A and B. The discharge between these two points could be different due to the flow of
the tributary. However, it is unknown if this stream was flowing or if it was dry at the time
of the study. Middle Spring Creek based on the discharge measurements calculated by
the FlowTracker, is a gaining stream. This means that the stream is being recharged by
groundwater. Groundwater flow in the Shippensburg area is more abundant than the
flow of surface water. The Cumberland Valley lacks surface streams; therefore, the
water is flowing underground. The Middle Spring Creek/Burd Run system is the only
surface water connection between the waters of South Mountain and Conodoguinet
Creek. The geologic strike of the Cumberland Valley is west to east and is the path of
least resistance for groundwater. The groundwater network is vast and the paths are
unknown. The groundwater is continuously feeding the surface streams in the area,
especially in times when precipitation is lacking.
24
References Cited
Becher, A.E. and Root, S.I., 1981, Groundwater and Geology of the Cumberland
Valley, Cumberland County, Pennsylvania: Pennsylvania Geological Survey, 4th ser.,
Water Resources Report 50, 95p.
Chichester, D.C., 1996, Hydrogeology of, and Stimulation of Ground-water Flow in, a
Mantled Carbonate-rock System, Cumberland Valley, Pennsylvania: U.S. Geological
Survey Water-Resources Investigations Report 94-4090, 39p.
Forrest, J., Standard Operating Procedure for Streamflow Measurement, U.S.
Environmental Protection Agency, 2p.
Hurd, T.M., Brookhart-Rebert, A., Feeney, T.P., Otz, M.H., Otz, I., 2010, Fast, Regional
Conduit Flow to an Exceptional-Value Spring-Fed Creek: Implications for SourceWater Protection in Mantled Karst of South-Central Pennsylvania. Journal of Cave
and Karst Studies, v. 72, no. 3, p. 129-136.
Rehmel, M., 2007, Application of Acoustic Doppler Velocimeters for Streamflow
Measurments. Journal of Hydraulic Engineering, v. 133, no. 12, p. 1433-1438.
Shippensburg University Weather Page, Climatology:
http://webspace.ship.edu/weather(accessed October 2012)
25
SonTeck/YSI, 2009, FlowTracker Handheld ADV User’s Manual Firmware Version 3.7
featuring Smart QC, 32p.
Sophocleous, M., 2002, Interactions between Groundwater and Surface water: The
State of Science. Hydrogeology Journal, v. 10, p. 52-67.
United States Geological Survey, 1999, Standard Rating Table No.2 for Pygmy Current
Meter: http://water.usgs.gov/osw/pubs/pygmytable.pdf (accessed November 2012)
United States Geological Survey, 2012, How Streamflow is Measured Part 2: The
discharge measurement: http://ga.water.usgs.gov/edu/streamflow2.html (Accessed
November 2012)
White, W., 1988, Geomorphology and Hydrology of Karst Terrains: New York, Oxford
University Press, 464 p.
26
Appendix A-Results from Location A
27
28
29
30
Appendix B- Results from Location B
31
32