1
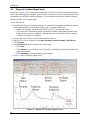
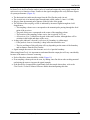
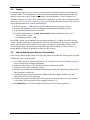
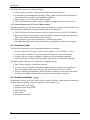
SonTek/YSI Inc.
9940 Summers Ridge Road, San Diego, CA 92121-3091 USA
Telephone (858) 546-8327 • Fax (858) 546-8150
E-mail: [email protected] • Internet: http://www.sontek.com
YSI incorporated
FlowTracker®
®
Handheld ADV
User’s Manual
Firmware Version 3.3
featuring
Copyright 2007 by SonTek/YSI Inc. All rights reserved. This document may not, in whole or in part, be copied, photocopied, reproduced,
translated, or reduced to any electronic medium or Machine-readable form without prior consent in writing from SonTek. Every effort has been
made to ensure the accuracy of this manual. However, SonTek makes no warranties with respect to this documentation and disclaims any implied
warranties of merchantability and fitness for a particular purpose. SonTek shall not be liable for any errors or for incidental or consequential
damages in connection with the furnishing, performance, or use of this manual or the examples herein. The information in this document is
subject to change without notice.
P/N 6054-60051--C
SonTek/YSI
WARRANTY, TERMS, AND CONDITIONS
Thank you for purchasing a SonTek/YSI FlowTracker. The instrument was thoroughly tested at
the factory and found to be in excellent working condition. If the shipping crate appears damaged, or if the system is not operating properly, please contact SonTek/YSI immediately.
The system you have purchased is covered under a one year limited warranty that extends to all
parts and labor for any malfunction due to workmanship or errors in the manufacturing process.
The warranty does not cover shortcomings that are due to the design, nor does it cover any form
of incidental damage as a result of errors in the measurements.
If your system is not functioning properly, first try to identify the source of the problem. If additional support is required, we encourage you to contact us immediately, and we will work to resolve the problem as quickly as possible.
If the system needs to be returned to the factory, please contact SonTek/YSI to obtain a Return
Merchandise Authorization (RMA) number. We reserve the right to refuse receipt of shipments
without RMAs. We require the system to be shipped back in the original shipping container using the original packing material with all delivery costs covered by the customer (including all
taxes and duties). If the system is returned without appropriate packing, the customer will be required to cover the cost of a new packaging crate and material.
CONTACT INFORMATION
Any questions, concerns, or suggestions can be directed to SonTek by telephone, fax, or email.
Business hours are 8:00 a.m. to 5:00 p.m., Pacific Standard Time, Monday through Friday.
Phone : (858) 546-8327
Fax
: (858) 546-8150
Email : [email protected] (General information)
[email protected] (Sales information)
[email protected] (Support information)
Web
: http://www.sontek.com
See our web site for information concerning new products and software/firmware upgrades.
ii
FlowTracker User’s Manual (July 2007)
SonTek/YSI
TABLE OF CONTENTS
WARRANTY, TERMS, AND CONDITIONS ......................................................................... ii
CONTACT INFORMATION.................................................................................................... ii
Section 1.
Getting Started: Operational Overview ............................................................1
1.1.
System Components.......................................................................................................1
1.2.
Battery Power ................................................................................................................2
1.3.
Mounting and Installation..............................................................................................3
1.3.1. Probe Orientation During Data Collection ................................................................3
1.4.
Keypad ...........................................................................................................................5
1.5.
Main Menu.....................................................................................................................5
1.6.
Setup Parameters Menu (Main Menu <1>) ...................................................................6
1.6.1. QC Settings (Setup Parameters <4>) .........................................................................6
1.6.2. Discharge Settings (Setup Parameters <5>) ..............................................................6
1.7.
System Functions Menu (Main Menu <2>)...................................................................7
1.7.1. Automatic QC Test ....................................................................................................7
1.8.
QC Menu........................................................................................................................7
1.9.
Pre-Deployment Diagnostics .........................................................................................8
Section 2.
Discharge Measurements ....................................................................................9
2.1.
Discharge Calculation Equation ....................................................................................9
2.1.1. Mid Section Discharge Equation ...............................................................................9
2.1.2. Mean Section Discharge Equation...........................................................................10
2.1.3. Japanese Discharge Equation...................................................................................11
2.1.4. Determining Mean Station Velocity (Discharge Measurement Method)................11
2.1.5. Discharge Uncertainty Calculation..........................................................................13
2.2.
Discharge Data Collection Procedure..........................................................................15
Section 3.
General Mode Operation ..................................................................................19
Section 4.
FlowTracker Windows Software......................................................................23
4.1.
Section 5.
Diagnostic Software (BeamCheck)..............................................................................24
Quality Control Data (SmartQC) and Troubleshooting ....................................27
5.1.
Quality Control Data....................................................................................................27
5.1.1. Adjusting Quality Control Criteria ..........................................................................27
5.2.
Seeding.........................................................................................................................29
5.3.
Velocity Data Appears Noisy or Unreasonable...........................................................29
Appendix A.
FlowTracker Principles of Operation............................................................31
FlowTracker User’s Manual (July 2007)
iii
SonTek/YSI
iv
FlowTracker User’s Manual (July 2007)
SonTek/YSI
Section 1. Getting Started: Operational Overview
1.1.
System Components
Figure 1 – FlowTracker with 2D Probe
Figure 1 shows the FlowTracker with all major components labeled.
• Probe – The probe contains the acoustic elements used to measure velocity. See the
FlowTracker Principles of Operation for more information.
• Handheld controller – The controller is designed to withstand temporary submersion, but
is not intended for underwater operation. The battery compartment is on the back.
The FlowTracker has several QA/QC features designed to increase
data integrity. Some of these features have bounds that can be set
by the user, while others automatically adapt to the given situation.
SmartQC™ refers to the collective ability of all these features
towards helping you make a better measurement. Specific QA/QC
features are identified in this manual with the SmartQC symbol.
FlowTracker User’s Manual (July 2007)
1
SonTek/YSI
1.2.
Battery Power
The FlowTracker uses eight AA batteries: alkaline, NiMH, or NiCad. Table 1-1 lists approximate new-battery operating parameters.
Table 1-1. FlowTracker Battery Types
Alkaline
NiMH
(rechargeable)
New battery voltage
12.0 V
10.2 V
Approximate operating life
25 hours
15 hours
NiCad
(rechargeable)
10.0 V
7 hours
To check FlowTracker battery level and estimated battery capacity:
• Press 5 from the System Functions Menu.
• Battery life estimates are at ≈20° C (70° F); cold weather greatly reduces battery capacity.
Check battery capacity with the system acclimated to the outside temperature.
The batteries are accessed from the back of the FlowTracker handheld controller (Figure 2). To
change the batteries, use the following steps.
•
•
•
•
Turn the system off.
Remove the six screws holding the battery compartment lid to the main housing.
Remove the old batteries from the battery holder.
Install the new batteries, matching the orientation shown on the battery holder.
o Do not mix old and new batteries.
o Do not mix different types of batteries.
• Secure the battery compartment lid using the six screws.
• Turn the system on and check the battery voltage level to ensure proper installation.
To Avoid Draining Batteries When System is Not in Use
• Always turn the system off before storing the system.
• If the system will not be used for more than one month, remove the batteries.
Figure 2 – FlowTracker Battery Compartment
2
FlowTracker User’s Manual (July 2007)
SonTek/YSI
1.3.
Mounting and Installation
SonTek offers top-setting wading rods and mounting brackets for the FlowTracker (Figure 3).
The probe is mounted from a special adaptor bracket that offsets the probe to one side of the
wading rod, placing the sampling volume closer to the wading rod. The cable from the probe to
the handheld controller is highly susceptible to electronics noise and should be treated with care.
In any mounting, the cable should be secured to prevent excessive motion or damage.
Figure 3 – SonTek Wading Rod
1.3.1. Probe Orientation During Data Collection
Figure 4 shows the proper orientation of the probe for discharge measurements. The tag line is
installed perpendicular to the primary flow direction. The FlowTracker X-axis is perpendicular
to the tag line (not in line with the flow); the red band (which marks receiver arm #1) should
face downstream. Figure 5 shows the FlowTracker XYZ coordinate system.
Graduated Tag Line
Primary Flow
Direction
Y
Sampling
Volume
X
Probe
Coordinate System
Mounting
Pin
Figure 4 – FlowTracker Probe Orientation Relative to Stream Flow
FlowTracker User’s Manual (July 2007)
3
SonTek/YSI
Z
X
Y
Figure 5 – FlowTracker XYZ Coordinate Systems
4
FlowTracker User’s Manual (July 2007)
SonTek/YSI
1.4.
Keypad
Delete
Corr.
Factor
1
LEW /
REW
4
GHI
Set Ice
Depth
7
PQRS
Abort
0
Next
Station
Set
Velocity
2
3
ABC
Previous
Station
5
JKL
QC
Menu
8
TUV
Calculate
Disch.
.
Set
Depth
MNO
Method
-
9
Set
Location
DEF
Set Meas
Depth
6
Measure
Method
+
WXYZ
End
Section
-
ENTER
Figure 6 – FlowTracker Keypad
Figure 6 shows the FlowTracker keypad. Many keys serve multiple functions; the use of a few
special keys is described below. Special keypad overlays are available in each language supported by the FlowTracker to translated key functions.
On/Off
• To turn the system on, hold the On/Off switch for 1 second until the LCD screen turns on.
• To turn the system off, hold the On/Off switch for 4 seconds until the LCD screen resets.
IMPORTANT
Return to the Main Menu before turning the system off to ensure all data is properly saved.
Back Light
• This key turns the LCD backlight on/off (the backlight turns off after 1 minute).
Letters (A-Z)
• These keys are used to enter text for the filename and for comments in the file.
• Text entry is done in the same manner as for mobile phones.
1.5.
Main Menu
When turned on, the FlowTracker displays a wake up screen. Pressing Enter displays the Main
Menu. From the Main Menu, press the appropriate key to access the desired function.
• Press 1 for the Setup Parameters Menu (see §1.6).
• Press 2 for the System Functions Menu (see §1.7).
• Press 3 to start a data run.
Main Menu
1:Setup Parameters
2:System Functions
3:Start Data Run
IMPORTANT
Return to the Main Menu before turning the system off to ensure all data is properly saved.
FlowTracker User’s Manual (July 2007)
5
SonTek/YSI
1.6.
Setup Parameters Menu (Main Menu <1>)
Setup parameters determine how the FlowTracker collects data (menu screens shown below).
Press Enter to switch between screens. To change settings, press the number shown.
1:Units English
2:Avg Time (40)
3:Mode Discharge
0=Exit or Enter=More
4:QC Settings
5:Discharge Settings
6:Salinity (0.00)
0=Exit or Enter=More
7:Language English
0=Exit or Enter=More
The following settings are available in the Setup Parameters menu.
• Units – English or Metric units for display of all data.
• Avg Time – the length of data collection for each measurement (10 to 1000 seconds).
• Mode – data collection mode as Discharge (Section 2) or General (Section 3).
• QC Settings – settings for automatic review of quality control data (§1.6.1).
• Discharge Settings – settings for discharge calculation (§1.6.2).
• Salinity – water salinity in ppt, used for sound speed calculations.
o In salt water, install a zinc anode for corrosion protection (available from SonTek/YSI).
• Language – operating language for FlowTracker firmware.
1.6.1. QC Settings (Setup Parameters <4>)
The QC Settings menu sets quality control criteria (Discharge or General mode) (§5.1)
•
•
•
•
Press 1 to set the SNR Threshold.
Press 2 to set the σV Threshold.
Press 3 to set the Spike Threshold.
Press 4 to set Max Velocity Angle.
1.6.2. Discharge Settings (Setup Parameters <5>)
The Discharge Settings menu specifies settings for discharge calculation.
• Press 1 to set the discharge Equation (§2.1) – Mid Section, Mean Section, or Japanese.
• Press 2 to toggle Repeat Depth (§2.1) between YES/NO.
o Normally used only with the Japanese discharge equation.
• Press 3 to toggle Repeat Velocity (§2.1) between YES/NO.
o Normally used only with the Japanese discharge equation.
• Press 4 to set Max Section Discharge (§5.1).
• Press 5 to set Max Depth Change (§5.1).
• Press 6 to set Max Location Change (§5.1).
• Press 7 to set the discharge Reference value.
o Section discharge (%Q) is calculated from either the Rated or Measured discharge.
• Press 8 to select the Methods Displayed.
o The FlowTracker supports several methods to determine mean velocity (§2.1.4).
o This selects methods for display when using the Method + and Method – keys.
• Press 9 to select set the discharge Uncertainty calculation (§2.1.5).
o Two method of uncertainty calculation are supported, ISO and Statistical.
6
FlowTracker User’s Manual (July 2007)
SonTek/YSI
1.7.
System Functions Menu (Main Menu <2>)
The System Functions screens are shown below. Press Enter to switch between screens. To
change settings, press the number shown.
1:View Data File
2:Recorder Status
3:Format Recorder
0=Exit or Enter=More
4:Temperature Data
5:Battery Data
6:Raw Velocity Data
0=Exit or Enter=More
7:Auto QC Test
8:Show Config
9:Set System Clock
0=Exit or Enter=More
The following settings are available in the System Functions menu.
• View Data File – display data from an already completed file.
• Recorder Status – display number of recorded files and remaining space.
• Format Recorder – erase all files on recorder.
• Temperature Data – display data from FlowTracker temperature sensor.
• Battery Data – display battery voltage and remaining battery life.
o Battery capacity estimates are based on voltage and are only approximate.
o Cold weather reduces battery capacity; check batteries after the system has acclimated
to outside temperatures.
• Raw Velocity Data – display raw velocity and SNR data to verify basic system operation.
o Press ENTER to stop data display.
• Auto QC Test – an automatic test to verify system operation (§1.7.1).
• Show Config – display system serial number, probe type, and firmware version.
• Set System Clock – set and change internal FlowTracker clock.
1.7.1. Automatic QC Test
The Auto QC Test is an automated version of the BeamCheck software (§4.1).
• Place the probe in moving water away from underwater obstacles.
• Data collection and analysis takes ≈30 seconds.
• If any warnings are issued, you are given an option to repeat the test.
o We recommend repeating the test once, after first checking that the probe and sampling
volume are well away from any underwater obstacles.
o If multiple warnings are received, run BeamCheck from a PC (§4.1) to evaluate FlowTracker performance in more detail.
1.8.
QC Menu
The QC Menu is available during data collection for the following functions.
• Input supplemental data
o Each record includes gauge height, rated flow, a time stamp, and user comments.
• Modify QC Settings (§1.6.1).
• Modify Discharge Settings (§1.6.2) (Discharge mode only).
• Change the averaging time (Avg Time) used for each measurement.
• Display Raw Velocity Data
• Run and record an additional Auto QC Test (§1.7.1).
FlowTracker User’s Manual (July 2007)
7
SonTek/YSI
1.9.
Pre-Deployment Diagnostics
Simple diagnostic procedures are provided to verify system operation. BeamCheck requires an
external computer. Other procedures require only a few minutes and can be performed in the
field from the keypad interface. These should be performed before each data run.
BeamCheck:
• BeamCheck lets you evaluate all aspects of system performance and should be run before
an extended field trip (about once per week).
• Using BeamCheck for the first time will require about 30 minutes; experienced users
should need about 5 minutes.
• The system must be connected to an external PC. BeamCheck details are described in §4.1.
Field diagnostics:
• Recorder Status (2 in System Functions Menu)
o Check available space; download data and format the recorder as needed.
• Temperature Data (4 in System Functions Menu)
o Check temperature data to be sure it is reasonable for the environment.
• Battery Data (5 in System Functions Menu)
o Expected life from new batteries (20°C; 70°F); cold weather reduces capacity.
Alkaline: ≈25 hours
NiMH: ≈15 hours
NiCad: ≈7 hours
• Raw Velocity Data (6 in System Functions Menu)
o Place the probe in the area to be measured.
o SNR data should ideally be above 10 dB, but at least 4 dB.
o Velocity data should appear reasonable for the environment.
• System Clock (9 in System Functions Menu)
o Verify the clock is correctly set.
8
FlowTracker User’s Manual (July 2007)
SonTek/YSI
Section 2. Discharge Measurements
Discharge Mode is for applications where the primary goal is to measure river/stream discharge.
Section 2.1 describes the measurement methodology and discharge calculations. Section 2.2 describes how to make discharge measurements with the FlowTracker.
2.1.
Discharge Calculation Equation
The basic procedure for making a discharge measurement follows.
• A graduated tag line is strung across the river.
• At each station, the operator records the station location and water depth, and takes velocity
measurements at one or more depths to determine the mean velocity.
• The probe’s X-axis is maintained perpendicular to the tag line (Figure 4).
o Only the X component of velocity (Vx) is used for discharge calculation.
The FlowTracker supports the following equations for calculating discharge – Mid Section equation (§2.1.1), Mean Section equation (§2.1.2), and the Japanese equation (§2.1.3).
2.1.1. Mid Section Discharge Equation
The Mid Section discharge equation (Figure 7) is the default and the most commonly used. This
method is used by the U.S. Geological Survey (USGS) and is described in ISO standards 748
(1997) and 9196 (1992).
Discharge Measurement - Mid Section Equation
Loc0
W0
Loc1
Vel1
Loc2
Vel2
Loc3
Vel3
Loc4
Vel4
Loc5
Vel5
W1
W2
W3
W4
W5
Dep1
Dep2
Dep3
Dep4
Dep5
Loc6
Vel6
W6
Dep6
Loc7
Vel7
Loc8
Vel8
Loc9
Vel9
W7
W8
W9
Dep7
Dep8
Dep9
Loc10 Loc11 Loc12
Vel10 Vel11
W10
W11 W12
Dep10 Dep11
Area1
Dep12
Area12
Area2
Area11
Area10
Area6 Area
Area9
7
Area3 Area Area5
Area
8
4
Edge Calculations (Starting, Ending, Internal Island)
Open Water Calculations
i = edge station (Loci , Depi)
Station Width = Wi = (Loci+1 - Loci-1)/2
j = adjacent station with velocity (Locj , Depj , Velj )
Station Area = Areai = Wi * Depi
Edge Width = Wi = (Locj - Loci)/2
Station Velocity = Veli
Edge Area = Areai = Wi * Depi
Station Discharge = Qi = Areai * Veli
Edge Correction Factor = CFi
Total Discharge = Sum( Qi )
Edge Velocity = Veli = CFi * Velj
Edge Discharge = Qi = Areai * Veli
Figure 7 – Discharge Measurement - Mid Section Equation
FlowTracker User’s Manual (July 2007)
9
SonTek/YSI
2.1.2. Mean Section Discharge Equation
The Mean Section discharge equation (Figure 8) uses the same data collection procedure as the
Mid Section equation (§2.1.1), but differs in the details of how discharge is calculated. It is described in ISO standards 748 (1997) and 9196 (1992).
Discharge Measurement - Mean Section Equation
Loc0
Loc1
Vel1
W1
Loc2
Vel2
W2
Dep1
Area1
Loc3
Vel3
W3
Dep2
Loc4
Vel4
W4
Dep3
Dep4
Loc5
Vel5
W5
Loc6
Vel6
W6
Dep5
Loc7
Vel7
W7
Dep6
Dep7
Loc8
Vel8
W8
Loc9
Vel9
W9
Dep8
Dep9
Loc10 Loc11 Loc12
Vel10 Vel11
W10
W11
W12
Dep10 Dep11
Area2
Dep12
Area12
Area11
Area3
Area4 Area5
Area6 Area7 Area8 Area9 Area10
Edge Calculations
Starting edge, second edge of internal island
Q0 = W0 = Area0 = 0.0
Ending edge, first edge of internal island
i = edge station (Loci , Depi)
Edge Width = Wi = Loci - Loci-1
Edge Area = Areai = Wi * (Depi + Depi-1) / 2
Edge Correction Factor = CFi
Edge Velocity = Veli = CFi * Veli-1
Mean Edge Velocity = MeanVi = (Veli + Veli-1) / 2
Edge Discharge = Qi = Areai * Veli
Open Water Calculations
Station Width = Wi = Loci - Loci-1
Station Area = Areai =
Wi * (Depi + Depi-1) / 2
Mean Station Velocity = MeanVi =
(Veli + Veli-1) / 2
Station Discharge = Qi =
Areai * MeanVi
Total Discharge = Sum( Qi )
Figure 8 – Discharge Measurement - Mean Section Equation
10
FlowTracker User’s Manual (July 2007)
SonTek/YSI
2.1.3. Japanese Discharge Equation
The Japanese discharge equation (Figure 9) includes several modifications to the data collection
procedures described earlier (§2.1.1, §2.1.2). Velocity is only measured at every second station.
Depth for each station is recorded twice; the mean value is used for discharge calculations. Each
velocity measurement is repeated twice; the mean is used for discharge calculations.
Discharge Measurement - Japanese Equation
Loc0
Loc1
Vel1
W1
Dep1
Loc2
W2
Dep2
Loc3
Vel3
W3
Dep3
Loc4
W4
Dep4
Loc5
Vel5
W5
Loc6
W6
Dep5
Dep6
Loc7
Vel7
W7
Dep7
Loc8
W8
Dep8
Loc9
Vel9
W9
Loc10 Loc11 Loc12
Vel11
W10
Dep9
W11
W12
Dep10 Dep11
Dep12
Area1
Area11
Area3
Area5
Area7
Area9
Width, area and discharge are calculated only for stations that include a velocity measurement.
Station Width Wi = Loci+1 - Loci-1
Station Area = Areai = ((Loci - Loci-1)*(Depi+Depi-1) / 2) + ((Loci+1 - Loci)*(Depi+1+Depi) / 2)
Station Discharge = Qi = Areai * Veli
Total Discharge = sum(Qi)
Figure 9 – Discharge Measurement - Japanese Equation
2.1.4. Determining Mean Station Velocity (Discharge Measurement Method)
The Method specifies how the FlowTracker determines mean velocity at each station, involving
variations in the number and location of velocity measurements.
• Table 2-1 describes all Methods supported by the FlowTracker.
• Select the method using the Method + and Method – keys.
• Methods with more than one measurement can be done in either direction: from surface to
the bottom, or from the bottom towards the surface.
• If some Methods will never be used, you can specify which methods to display.
o Press 9 from the Discharge Settings menu (§1.6.2).
• All depth values are referenced from the water surface down.
• Effective depth is water depth minus ice depth (water surface to bottom of ice or slush).
FlowTracker User’s Manual (July 2007)
11
SonTek/YSI
Method
0.6
0.2/0.8
0.8/0.2
.2/.6/.8
.8/.6/.2
Table 2-1. FlowTracker Mean Velocity Methods
Measurement Locations
Mean Velocity Equation
0.6 * depth
Vmean = V0.6
0.2 / 0.8 * depth
Vmean = (V0.2 + V0.8) / 2
0.2 / 0.6 / 0.8 * depth
Vmean = (V0.2 + 2*V0.6 + V0.8) / 4
Ice 0.6
0.6 * effective depth
Ice 0.5
0.5 * effective depth
Ice 2/8
Ice 8/2
0.2 * effective depth
0.8 * effective depth
0.0 (near surface)
0.62 * depth
0.0 (near surface)
0.2 / 0.6 / 0.8 * depth
1.0 (near bottom)
Any number of points at userspecified depths
No velocity measurement
Kreps 2Kreps 2+
5 Point5 Point+
Multi Pt
None
Input V
User input velocity
Vmean = 0.92*V0.6
(Correction Factor 0.92 can be changed by user)
Vmean = 0.89*V0.5
(Correction Factor 0.89 can be changed by user)
Vmean = (V0.2 + V0.8) / 2
Vmean = 0.31*V0.0 + 0.634*V0.62
Vmean = (V0.0 + 3*V0.2 + 3*V0.6 + 2*V0.8+ V1.0) / 10
Integrated velocity average (Figure 10)
Vmean = CF * Vadjacent
Vmean = Vinput
You can enter an estimated velocity when velocity
measurements are not possible (e.g., due to weed
growth along a river bank).
There are a few special cases to consider.
Method None
• Method None is used in two different situations.
o No measurement is possible and velocity is estimated from adjacent station(s).
o To specify the banks of an internal island (for a multiple channel river).
• If a single Method None station is recorded, it is assumed that no measurement was possible.
o Velocity for this station is based on adjacent station(s) multiplied by the user-specified
correction factor (CF) for this station. The default CF is 1.00.
• If two Method None stations are recorded together, they are assumed to represent an internal
island and discharge is calculated accordingly.
Method Multi Pt
• This allows you to make any number of velocity measurements.
o Manually enter the measurement depth using the Set Meas Depth key. Measurement
depth should indicate the distance above the bottom.
o When all measurements are done, press End Section or Abort to complete the station.
• The mean velocity is calculated by integrating all velocity measurements (Figure 10).
o If multiple measurements are made at the same measurement depth, these measurements
are averaged prior to the velocity integration.
12
FlowTracker User’s Manual (July 2007)
SonTek/YSI
Multiple Point Mean Velocity Integration
Surface
V1
V2
V3
VSurface
Surface
V1
V12
V2
V23
V3
....
VSurface
V12
V23
....
VN
VN
VBottom
VBottom
Bottom
Bottom
Mid and Mean Section Integration
Japanese Equation Integration
VSurface = V1
Vi(i+1) = ( Vi + Vi+1 ) /2
VBottom= (6/7)*VN (1/6 power law)
VSurface = V1
Vi(i+1) = ( Vi + Vi+1 ) /2
VBottom= (1/2)*VN (linear velocity change)
Figure 10 – Multiple Point Mean Velocity Integration
Correction Factor (CF)
• CF is a user-supplied parameter used to scale the station velocity.
• CF is most commonly used at edges, internal islands, and other Method None stations.
o The default CF value is 1.00.
o Any value from -1.00 to 1.00, except 0.0, is allowed.
• The CF can be input for any station and mean velocity will be multiplied by the CF.
o One possible use is near the edges in very narrow streams; the orientation of the FlowTracker probe can be reversed 180° to allow measurement closer to the edge.
o A CF of -1.00 should be input to correct the FlowTracker X-velocity.
• Incorrect use of this parameter will affect the final discharge measurement.
2.1.5. Discharge Uncertainty Calculation
The FlowTracker estimates the uncertainty of every discharge measurement. This calculation can
be done using two different ways: Statistical or ISO.
• The Statistical (abbreviated Stats) uncertainty calculation uses a method developed by researchers at the U.S. Geological Survery; this is the default calculation as it provides the
most reliable indicator of measurement qualtiy.
• The ISO method is based on the international standard. It provides users with the results of a
published, standard technique; however, in many cases this calculation may not provide a
reliable indicator of data quality (see FlowTracker Technical Manual for details).
The uncertainty calculations are based on several different parameters. In addition to overall uncertainty, the FlowTracker also looks at the contribution of each parameter.
• Accuracy: the accuracy of FlowTracker velocity (this is generally negligible).
• Depth
o In the Statistical calculation, this term includes both uncertainty in the depth measurement and the effect of changes in depth between stations.
o In the ISO calculation, this term includes only the uncertainty in depth measurements.
FlowTracker User’s Manual (July 2007)
13
SonTek/YSI
• Velocity
o In the Statistical calculation, this term includes both uncertainty in the velocity measurement and the effect of changes in velocity between stations.
o In the ISO calculation, this term includes only the uncertainty in velocity measurements.
• Width
o Estimated uncertainty in width measurements.
• Method: Discharge measurement method (§2.1.4)
o Use for the ISO method only.
• Number of stations
o Use for the ISO method only.
In the FlowTracker real-time display, uncertainty is shown with the calculated discharge; the
largest individual source of uncertainty is also shown. The FlowTracker software program shows
both uncertainty calculations and the contribution of each parameter to the overall uncertainty. A
complete description of the discharge uncertainty calculations can be found in the FlowTracker
Technical Manual.
14
FlowTracker User’s Manual (July 2007)
SonTek/YSI
2.2.
Discharge Data Collection Procedure
This section outlines a typical procedure when collecting data in the Discharge Mode. The actual
sequence of steps may vary based on your application. Table 2-2 lists the items shown on the
display screen during data collection.
Table 2-2. Data Collection Display Items
Label
Description
English Metric
RatedQ
Rated discharge (as input by the user)
ft3/s
m3/s
TotalQ
Computed discharge (based on FlowTracker measurements)
ft3/s
m3/s
Loc
Location
ft
m
Dep
Water depth
ft
m
0.6, 0.2/0.8, etc. Velocity method; §2.1.4
Measurement depth
• Fractional depth is first – e.g., 0.6 indicates 0.6 * depth
0.6(0.32)
down from the surface.
ft
m
• Actual depth (in parenthesis) is second. This is referenced
from the bottom up and includes the effect of ice, if present.
Vel
X velocity component
ft/s
m/s
SNR
Signal-to-noise ratio; §5.1
dB
dB
Time
Time remaining in average
σV
Standard error of velocity; §5.1
ft/s
m/s
Spikes
Number of spikes removed from mean; §5.1
Bnd
Boundary QC value; §5.1
NPts
Number of points collected
Ang
Flow angle relative to X direction; §5.1
°
°
3
StnQ
Station discharge
ft /s
m3/s
StnV
Mean station velocity; §2.1.4
ft/s
m/s
Station discharge as percent of either rated or measured dis%Q
%
%
charge, based on the discharge Reference value.
The following steps describe the data collection sequence when in Discharge Mode.
1.
2.
3.
4.
5.
6.
7.
Run pre-deployment diagnostics before taking the instrument to the field (§1.9).
Check Setup Parameters.
From the Main Menu, press 3 to Start Data Run.
Specify file name and extension (or press Abort or End Section to return to the Main Menu).
Enter site and operator name; these are optional values used only to document the data set.
At any point, press QC Menu to access a variety of special functions (§1.8).
You are prompted to conduct an automatic QC test (§1.7.1).
a. Press 1 to run the automatic QC test, and follow on screen instructions.
b. Press 2 to skip the test and begin data collection.
8. Starting-edge information will be displayed (right).
a. Press Set Location to set starting-edge location (Loc).
Starting Edge
b. Press Set Depth to set starting-edge water depth (Dep).
Loc 1.00
Dep 0.50
c. Press Corr. Factor to set any required correction factor
LEW
CF 1.00
(CF); see §2.1.4.
Press Next Station
FlowTracker User’s Manual (July 2007)
15
SonTek/YSI
d. Press LEW/REW to toggle the starting edge of water (left or right).
e. When complete, press Next Station to continue.
9. Station information will be displayed (right).
Stn 1
Loc 2.00
a. Press Set Location to set station location (Loc).
0.6
0.6(0.54)
b. Press Set Depth to set water depth (Dep).
Dep 1.35
c. Use Method+ and Method– to select the method used for
Enter=More
velocity at that station (§2.1.4).
10. When all values are specified and the probe is in position, press Measure.
11. When the station is complete, a summary of velocity and
Vel 2.25
σV 0.04
quality control data is shown (right).
Ang 5°
SNR 15.1
a. Data are automatically reviewed using several quality
Spikes
0
Bnd BEST
control criteria (§5.1). If any data are outside expected
1:Accept
2:Repeat
values, a warning is issued.
b. The values represent the mean over the entire averaging period after removing any spikes.
c. Press 1 to accept the measurement and move on to the next measurement.
d. Press 2 to repeat the measurement (using the same station number).
12. If there is more than one measurement at a station (e.g., method 0.2/0.8), the system proceeds
to the next measurement in the series (e.g., 0.8).
a. With Multi Pt, the FlowTracker allows any number of measurements for each station.
b. When the last measurement is complete, press End Section or Abort to end that station.
13. When a station is completed, the FlowTracker displays the next station. Repeat Steps 9
through 12 to add additional stations.
14. Between stations, you can use Next/Prev. Station to scroll through completed stations.
a. Stations are sorted based on location and displayed in that order.
b. Four screens are available for completed stations; press Enter to scroll through screens.
Stn 1
0.6
Loc 2.00
0.6(0.54)
Dep 1.35
Enter=More
Stn 1
Loc 2.00
Npts 40
0.6(0.54)
Vel 2.25
Ang 5°
Enter=More
Stn 1
SNR 14.5
σV 0.04
Spikes 0
Loc 2.00
0.6(0.54)
Bnd BEST
Enter=More
Stn 1
Loc 2.00
StnQ 2.523 cfs
StnV 2.25 ft/s
%Q 4.5%
Enter=More
c. Use Calculate Disch. to view the total discharge (TotalQ) TotalQ 44.234 cfs
RatedQ 45.000 cfs
for all completed stations (right). This is a temporary
Difference -1.7%
calculation and does not affect ongoing data collection.
Press Enter
15. It is possible to delete or repeat a station if desired.
a. To delete an existing (completed) station:
Use the Next Station and Previous Station keys to scroll to the desired station.
Press the Delete key; when prompted, enter 123 to confirm the deletion.
b. To repeat a station:
First, Delete the desired station.
Enter the location, depth, and measurement method of the station to be repeated.
The new station data automatically sorts to the correct position based on location value.
16. When all stations are completed, press the End Section key.
a. The FlowTracker reviews all data using several quality control criteria (§5.1).
16
FlowTracker User’s Manual (July 2007)
SonTek/YSI
b. When the review is complete, the ending-edge screen is shown.
c. Next Station and Previous Station can be used to view/edit other stations.
To add new measurements, press the Measure key and confirm when prompted that you
wish to re-open the file and add measurements.
d. When ready, press Calculate Disch. to complete discharge calculations and close the file.
17. After final discharge calculations are complete, nine screens of data are available.
a. Press Enter to move between the different display screens (below and Table 2-3).
b. Press Prev. Station from any file summary screen to view the station data; scroll through
all station data using the Next Station and Prev. Station keys.
18. Press 0 to return to the main menu.
IMPORTANT: Return to the Main Menu before turning the system off to save all data.
TotalQ 44.234 cfs
RatedQ 45.000 cfs
Difference -1.7%
0=Exit or Enter=More
Q Uncertainty 3.5%
Largest Source
Num Stations
0=Exit or Enter=More
Num Stations 27
V Mean 1.43 ft/s
V Max 2.21 ft/s
0=Exit or Enter=More
Width 23.000 ft
Area 47.350 ft^2
Depth Mean 2.77 ft
Depth Max 3.15 ft
0=Exit or Enter=More
0=Exit or Enter=More
SNR Mean 16.5 dB
σV Mean 0.05 ft/s
Temperature 61.2°F
0=Exit or Enter=More
Start Height 4.900
End Height 5.000
Change 0.100 ft
0=Exit or Enter=More
File 555312.100
Mode: Discharge
2001/06/25 14:24:15
0=Exit or Enter=More
Site
Poudre River FC
Operator Billy Bob
0=Exit or Enter=More
Table 2-3. Data Review Screen Details
Label
Description
Rated discharge
Calculated discharge
Discharge uncertainty (§2.1.5)
Total number of stations (including edges)
Mean velocity (equals discharge / area)
Maximum station velocity
Total width
Total area
Mean river depth (area / width)
Maximum station depth
Mean signal to noise ratio; §5.1
Mean standard error of velocity; §5.1
Mean water temperature.
First and last gauge height values, and the
Start / End
Height, Change difference between the two; §1.8
Site
Site name
Operator
Operator name
RatedQ
TotalQ
Q Uncertainty
Stations
MeanV
Max V
Width
Area
Mean Depth
Max Depth
MeanSNR
MeanσV
Temperature
FlowTracker User’s Manual (July 2007)
English Units
ft3/s
ft3/s
%
Metric Units
m3/s
m3/s
%
ft/s
ft/s
ft
ft2
ft
ft
dB
ft/s
ºF
m/s
m/s
m
m2
m
m
dB
m/s
°C
ft
m
17
SonTek/YSI
18
FlowTracker User’s Manual (July 2007)
SonTek/YSI
Section 3. General Mode Operation
The General Mode of data collection is for applications that need a series of current measurements at different locations, but do not require a discharge calculation. The following parameters
are recorded with each measurement (none are required).
•
•
•
•
Station number (automatically generated)
Two location variables (L1 and L2)
Water depth (Dep)
Measurement depth (MDep)
This section outlines a typical procedure when collecting data in the General Mode; the sequence
of steps you use may vary based on your application. Table 3-1 lists the items shown on the display screens during data collection.
Table 3-1. Data Collection Display Screen Details (General Mode)
Label
Description
English Metric
Stn
Station number
L1
Location value 1
ft
m
L2
Location value 2
ft
m
Dep
Water depth
ft
m
MDep
Measurement depth
ft
m
Vx
X velocity component
ft/s
m/s
Vy
Y velocity component
ft/s
m/s
Vz
Z velocity component
ft/s
m/s
SNR
Signal-to-noise ratio (mean of all receivers); §5.1
dB
dB
Time
Time remaining in average
σV
Standard error of velocity; §5.1
ft/s
m/s
Spikes Number of spikes edited from mean; §5.1
Bnd
Boundary QC value; §5.1
Number of points collected (may differ from averaging time if
NPts
Abort key used)
The following steps describe the data collection sequence when in General Mode.
1. Run pre-deployment diagnostics before taking the instrument to the field (§1.9).
2. Check Setup Parameters.
3. From the Main Menu, press 3 to Start Data Run.
4. Specify file name and extension (or press Abort or End Section to return to the Main Menu).
5. Input site and operator name; these are optional values used only to document the data set.
6. At any point, press QC Menu to access a variety of special functions (§1.8).
7. You are prompted to conduct an automatic QC test (§1.7.1).
a. Press 1 to run the automatic QC test, and follow on screen instructions.
b. Press 2 to skip the test and begin data collection.
8. Station information will be displayed (right).
a. Press Set Location to set location 1 (L1) and location 2 (L2) values.
b. Press Set Depth to set water depth (Dep).
Station 1
c. Press Set Meas Depth to set measurement depth (MDep).
L1 0.00
Dep 0.00
d. When the probe is located at the desired station, press
L2 0.00
MDep 0.00
Measure to start data collection.
Press Meas to Start
FlowTracker User’s Manual (July 2007)
19
SonTek/YSI
9. When the station is complete, a summary of velocity and
Vx 2.25
σV 0.02
quality control data is shown (right).
Vy 0.42
SNR 15.1
a. Press 1 to accept the measurement and move on to the Spikes 0 Bnd BEST
next station.
1:Accept
2:Repeat
b. Press 2 to repeat the measurement (using the same
station number).
10. When a measurement is accepted, the FlowTracker displays the next station. Repeat Steps 6
through 9 to add additional stations.
11. Use the Prev/Next Station keys to scroll through completed stations. Three screens (below)
are available for each completed station; press Enter to scroll through the screens.
Station 3
L1 4.00
Dep 2.25
L2 6.50
MDep 1.50
Press Enter For More
Stn 3
MDep 1.50
Vx 2.25
Vy 0.42
Vz 0.05
Npts 40
Press Enter For More
Stn 3
MDep 1.50
SNR 14.5
Bnd BEST
σV 0.02
Spikes 0
Press Enter For More
12. When all stations are done, press End Section to close the file and view summary data.
a. Press Enter to move between the file summary screens (below and Table 3-2).
b. Press Prev Station from any file summary screen to view station data; scroll through all
station data using the Next Station and Prev Station keys.
c. When done, press 0 to exit and return to the main menu.
d. Return to the Main Menu before turning the system off to ensure all data has been saved.
File 555312.100
Mode: General
2001/06/25 14:24:15
0=Exit or Enter=More
Site
Poudre River FC
Operator Billy Bob
0=Exit or Enter=More
File 555312.100
Num Stations 15
Vx Mean 1.05 ft/s
Vy Mean 0.08 ft/s
Vx Min 0.88 ft/s
Vy Min –0.10 ft/s
Vx Max 1.63 ft/s
Vy Max 0.34 ft/s
0=Exit or Enter=More
0=Exit or Enter=More
0=Exit or Enter=More
0=Exit or Enter=More
SNR Mean 16.5 dB
σV Mean 0.05 ft/s
Temperature 63.2ºF
0=Exit or Enter=More
20
FlowTracker User’s Manual (July 2007)
SonTek/YSI
Table 3-2. Summary Display Screen Details (General Mode)
Label
Description
English Metric
Stations
Total number of stations (including edges)
Site
Site name
Operator
Operator name
Vx Mean
Mean X velocity
ft/s
m/s
Vy Mean
Mean Y velocity
ft/s
m/s
Vz Mean
Mean Z velocity (if present)
ft/s
m/s
Vx Min
Minimum X velocity
ft/s
m/s
Vy Min
Minimum Y velocity
ft/s
m/s
Vz Min
Minimum Z velocity (if present)
ft/s
m/s
Vx Max
Maximum X velocity
ft/s
m/s
Vy Max
Maximum Y velocity
ft/s
m/s
Vz Max
Maximum Z velocity (if present)
ft/s
m/s
SNR Mean
Mean signal to noise ratio; §5.1
dB
dB
σV Mean
Mean standard error of velocity; §5.1
ft/s
m/s
Temperature
Mean water temperature
°F
ºC
FlowTracker User’s Manual (July 2007)
21
SonTek/YSI
22
FlowTracker User’s Manual (July 2007)
SonTek/YSI
Section 4. FlowTracker Windows Software
The FlowTracker software is intended to be self-explanatory. The software can be found on the
CD included with the system or downloaded from the SonTek/YSI website at www.sontek.com.
Additional documentation is available in the software and the FlowTracker Technical Manual.
To install the FlowTracker software on your computer:
•
•
•
•
Insert the distribution CD in your computer.
An installation menu should automatically appear after the CD has been inserted.
Click the FlowTracker Software Installation button and follow the instructions.
FlowTracker software is compatible with Windows 2000 and XP.
The FlowTracker software serves several functions.
• Download data files using Recorder.
o Connect the FlowTracker to a COM port on your computer and click Connect.
• Export data files and generate reports using Open a FlowTracker File.
o Select data export options using Program Settings.
o Several outputs are available.
HTML Report: A formatted report for easy viewing and printing.
ASCII Discharge File (.DIS): Final results in a form that is easy to integrate with database utilities.
ASCII Summary File (.SUM): Summary velocity and quality control data from all
measurements.
ASCII Raw Data File (.DAT): Raw, one-second velocity and SNR data.
ASCII Control File (.CTL): System configuration data.
o Output formats should be self-explanatory and include optional column headers.
• Export data files and generate reports for multiple files using Open Many FlowTracker
Files/Folders.
• Detailed system diagnostic procedures using BeamCheck.
o BeamCheck is a module used to evaluate all aspects of system operation (§4.1).
o Connect the FlowTracker to a COM port on your computer and click Connect.
FlowTracker User’s Manual (July 2007)
23
SonTek/YSI
4.1.
Diagnostic Software (BeamCheck)
BeamCheck (Figure 11) is a diagnostic program that is used to verify FlowTracker performance.
This is the same diagnostic program used at SonTek; it provides you with a powerful tool for understanding and verifying system performance. We recommend you become familiar with this
software and use it on a regular basis.
To run BeamCheck:
• Hold the FlowTracker in a bucket of water (or a natural environment) such that the probe is
submerged and there is a boundary (surface, side, or bottom) within view.
o Ideally, the boundary should be placed 20-30 cm (8-12 in) from the probe.
o You may need to add a small amount of fine dirt or other seeding material and stir the
bucket well for good test conditions. Regular tap water usually does not have enough
scatterers (seeding) for a valid test.
• Connect the FlowTracker to the PC and turn the system on.
• Run the FlowTracker software (click Start | Programs | SonTek Software | FlowTracker).
• Click Connect.
• Select BeamCheck on the left side of the screen; now:
o Click Start.
o Click Record to save all data to a file. Typically, a minimum of 20 pings is required for
proper data analysis.
o Click Averaging to average multiple pings together.
• Figure 11 shows a sample output screen.
Figure 11 – BeamCheck Sample Output Screen
24
FlowTracker User’s Manual (July 2007)
SonTek/YSI
In BeamCheck, the FlowTracker sends a pulse of sound and outputs the return signal strength for
each receiver as a function of time. Features in the signal strength profile verify different aspects
of system performance (Figure 11).
•
•
•
•
The horizontal axis indicates the range from the FlowTracker probe (in cm).
The vertical axis is in internal signal strength units called counts (1 count = 0.43 dB).
Ringing from the transmit pulse appears on the left side of the graph.
The location of the sampling volume is indicated by increased signal strength in a bellshaped curve.
o The sampling volume curve corresponds to the transmit pulse passing through the focal
point of the receivers.
o The peak of this curve corresponds to the center of the sampling volume.
o The location of the sampling volume varies, but is typically 10-12 cm.
o All receivers (2 or 3) should see the peak in the same location, although there will be
variation in the height and shape of the curve.
• A sharp spike indicates a boundary reflection (if a boundary is within range).
o If the probe is close to a boundary, a sharp reflection should be seen.
o The size and shape of this reflection will vary depending on the nature of the boundary
and its distance from the FlowTracker.
• Signal strength decreases to the electronic noise level past the boundary.
When using BeamCheck, it is important to understand that the output plot will vary considerably
because of the nature of acoustic scattering.
• Each of the above items should be visible (Figure 11).
• If no sampling volume peak can be seen, try adding some fine dirt or other seeding material
and stirring the water to increase the signal strength.
• If the BeamCheck output differs significantly from the sample shown here, refer to the
FlowTracker Technical Manual for more details about interpreting this data.
FlowTracker User’s Manual (July 2007)
25
SonTek/YSI
26
FlowTracker User’s Manual (July 2007)
SonTek/YSI
Section 5. Quality Control Data (SmartQC) and Troubleshooting
5.1.
Quality Control Data
The FlowTracker records quality control (QC) data with every measurement (Table 5-1). QC parameters are automatically reviewed with each measurement and at the completion of a discharge
cross section. If any value exceeds expected criteria a warning is given. Table 5-2 displays different QC warning messages and gives guidelines for interpreting these messages. All QC review criteria can be adjusted or disabled.
5.1.1. Adjusting Quality Control Criteria
All quality control criteria can be modified or disabled. To access quality control settings:
• From the Main Menu, press 1 for Setup Parameters.
• From Setup Parameters, select 4 for QC Settings (§1.6.1).
o SNR Threshold, σV Threshold, Spike Threshold
• From Setup Parameters, select 5 for Discharge Settings (§1.6.2).
o Max Section Discharge, Max Depth Change, Max Location Change, Max Velocity Angle
To disable any QC criteria, set that parameter to a value of 0.
Parameter
SNR
σV
Spikes
Angle
%Q
Boundary
QC
Table 5-1. Quality Control (QC) Parameters
Description
SNR is the most important QC parameter.
• It measures the strength of the acoustic reflection from
particles in the water.
• Without sufficient SNR, the FlowTracker cannot
measure velocity.
σV (standard error of velocity) is a direct measure of the
accuracy of velocity data.
• It includes the effects of turbulence in the river and instrument uncertainty.
Spikes in FlowTracker velocity data are removed using a
spike filter.
• Some spikes are common and no cause for concern.
• Too many spikes indicate a problem in the measurement environment (e.g., interference from underwater
obstacles or highly aerated water).
Angle is the direction of the measured velocity relative to
the FlowTracker X-axis.
• Used for discharge measurements only.
• A good site should have small velocity angles.
• Large angles may be unavoidable at some sites.
%Q is the percentage of the total discharge in a single
measurement station.
• Most agencies have criteria for the maximum %Q.
Boundary QC evaluates the measurement environment
for interference from underwater obstacles.
• FAIR or POOR results may indicate significant interference from an underwater obstacle.
FlowTracker User’s Manual (July 2007)
Expected Values
Ideally > 10 dB
Minimum ≥ 4 dB
Typically <
0.01 m/s (0.03 ft/s).
Higher in turbulent
environment.
Typically < 5% of
total samples.
Should be < 10% of
total samples.
Ideally < 20º
Typical criteria:
Ideally < 5%
Maximum < 10%
BEST or GOOD
27
SonTek/YSI
Warning
QC Criteria
Low SNR
None
Beam SNR
SNR
Threshold
SNR Variation
None
SNR Change
SNR
Threshold
High σV
σV Threshold
High Spikes
Spike Threshold
High Angle
Max Velocity
Angle
High %Q
Max Section
Discharge
Suspect
Depth Value
Max Depth
Change
Suspect Loca- Max Location
tion Value
Change
Location Out
of Order /
Location Outside Edge
None
Bad Boundary
QC
None
28
Table 5-2. QC Warning Messages
Description
Suggested Action
SNR < 4 dB
• Improve SNR (§5.2)
• Look for underwater obstacles;
Difference in SNR for any 2
repeat measurement.
beams is > SNR Threshold.
• Check probe operation (§4.1).
One-second SNR data varies
• Look for underwater obstacles;
more than expected during a
repeat measurement.
measurement. May indicate
• Look for environmental sources
underwater interference or a
(e.g., aerated water).
highly aerated environment.
SNR more than SNR Threshold
• Look for underwater obstacles or
different previous measureother changes in river condition.
ments; major change in meas• Repeat measurement
urement conditions.
• Look for underwater obstacles or
σV > σV Threshold; adjusted
a change in conditions.
based on previous data and
measured velocity. May indi- • Consider real turbulence levels
cate interference or a highly
in river.
turbulent environment.
• Repeat measurement.
• Look for underwater obstacles or
Spikes > Spike Threshold perunusual conditions (e.g., aerated
cent of samples. May indicate
water).
poor measurement conditions.
• Repeat measurement.
• Consider if measured angle is
Angle > Max Velocity Angle.
May only indicate non-ideal
realistic.
measurement environment.
• Repeat measurement if needed.
%Q > Max Section Discharge.
Station contains a large portion • Consider adding more stations.
of the total discharge.
Station depth differs from adja• Verify station depth value.
cent stations by more than Max
• Re-enter if needed.
Depth Change %. This may indicate a data entry problem.
Spacing between stations has
changed by more than Max Lo- • Verify station location value.
cation Change %. This may in- • Re-enter if needed.
dicate a data entry problem.
Station location out of sequence or outside river edge. • Verify station location value.
This may indicate a data entry • Re-enter if needed.
problem.
• Consider re-locating probe and
Boundary QC is FAIR or POOR.
repeating test.
Indicates possible interference
• Measurement can proceed if refrom underwater obstacles.
sults are consistent.
FlowTracker User’s Manual (July 2007)
SonTek/YSI
5.2.
Seeding
If velocity data appears "noisy" the most common cause is low SNR (a lack of scattering material in the water). Visual inspection is not an acceptable method for determining the amount of
particles in the water and no simple relationship exists with turbidity. If you are unsure as to
whether a stream is “too clear” for a FlowTracker, simply place it in the water to check the SNR
values. See the FlowTracker Principles of Operation for details about how/why the FlowTracker
uses scattering material for velocity measurements.
•
•
•
•
If SNR is too low (< 4 dB), the FlowTracker cannot accurately measure velocity.
In most field applications, there is sufficient scattering material naturally present.
Large laboratory tanks may have low SNR.
To check requirements, use the Raw Velocity Data from the handheld interface (§1.7).
o Ideally, SNR > 10 dB.
o At a minimum, SNR ≥ 4 dB.
In the field, seeding can be introduced by stirring the bottom (e.g., walking across the river upstream). In some situations, seeding material will need to be introduced. A practical seeding material is lime or pulverized limestone. Large bags are inexpensive and readily available from
most hardware stores; the material is mixed with water prior to adding. A note of caution: repeated addition of lime may gradually increase the pH in a tank.
5.3.
Velocity Data Appears Noisy or Unreasonable
If the velocity data from the FlowTracker does not appear reasonable, the following list may help
establish the source of the problem.
• Low SNR is the most common problem. See §5.2 and the FlowTracker Principles of Operation for details about seeding requirements.
• Inspect the FlowTracker to be sure debris has not caught on the probe.
• Verify the FlowTracker mounting is stable.
• Consider any possible environmental influences, particularly flow interference from underwater structures or obstacles.
• Consider the measurement environment. Highly turbulent or highly aerated water will
greatly affect FlowTracker operation.
• Consider the orientation of the probe with respect to the flow direction to be sure the probe
is not causing flow interference in the sampling volume (§1.3).
• Run BeamCheck (§4.1); this can address all aspects of FlowTracker operation.
FlowTracker User’s Manual (July 2007)
29
SonTek/YSI
30
FlowTracker User’s Manual (July 2007)
SonTek/YSI
Appendix A. FlowTracker Principles of Operation
A-1. Introduction
The FlowTracker uses the proven technology of the SonTek/YSI Acoustic Doppler Velocimeter
(ADV) from a simple handheld interface. ADV technology provides several advantages.
•
•
•
•
Accurate velocity measurements in a remote sampling volume
2D or 3D velocity measurements (depending on probe configuration)
Invariant factory calibration – no periodic recalibration required
Excellent performance for low and high flows – accuracy 1% of measured velocity
This appendix presents a general overview of the operating principles the FlowTracker. To learn
more, see the FlowTracker Technical Manual or contact SonTek/YSI.
A-2. The Doppler Shift
The Doppler principle says that if a source of sound is moving relative to the receiver, the frequency of the sound at the receiver is shifted from the transmit frequency. The most common example of this is a train whistle; the pitch sounds higher when the train is approaching and lower
and when the train is moving away. The FlowTracker uses the Doppler shift by measuring the
change in frequency of sound that is reflected off particles in the water.
A-2.1. Bistatic Doppler Current Meters
Figure 12 shows the FlowTracker probe, a bistatic Doppler current meter.
• Bistatic means separate acoustic transducers are used for transmitter and receiver.
• The receivers are mounted to focus at a fixed distance (10 cm; 4 in) from the probe.
• The beam intersection determines the location of the sampling volume.
Figure 12 – FlowTracker 2D Side Looking Probe and Sampling Volume
FlowTracker User’s Manual (July 2007)
31
SonTek/YSI
The FlowTracker measures velocity as follows.
• The transmitter generates a short pulse of sound at a known frequency.
• As the pulse passes through the sampling volume, sound is reflected in all directions by
particulate matter (sediment, small organisms, bubbles).
• The acoustic receivers sample the reflected signal.
• The FlowTracker measures the change in frequency (Doppler shift) for each receiver.
A-2.2. Beam Geometry and 3D Velocity Measurements
A single transmit/receive pair measures the projection of the water velocity onto the bistatic axis.
The bistatic axis is halfway between the transmit and receive beam axes.
• The FlowTracker uses one transmitter and two or three receivers (for 2D or 3D probes).
• Bistatic velocities are converted to Cartesian (XYZ) velocities using the probe geometry
(the relative angles of transmit and receive beams).
• Probe geometry is precisely determined by a calibration procedure.
• The calibration only needs to be performed once; no periodic re-calibration is required.
A-3. FlowTracker Data
The FlowTracker provides several important performance advantages.
•
•
•
•
It can measure 2D or 3D water velocities from 0.0001 to 4.5 m/s (0.0003 to 15 ft/s).
Velocity data is accurate to 1% of the measured velocity in a one-second sample.
Velocity data can be used immediately without any post-processing corrections.
The FlowTracker calibration will not change unless the probe is physically damaged.
The following describes the basic FlowTracker sampling strategy.
• One velocity sample is recorded each second.
• Velocity data are collected at each measurement location over the user-specified time.
Raw one-second velocity, mean velocity, and quality control data are recorded.
• For river discharge measurements, the FlowTracker combines velocity data with station
location, water depth, and other data to determine total discharge in real-time.
A-4. Quality Control Data
In addition to velocity, the FlowTracker records a variety of quality control data with each measurement station to quickly evaluate the quality of velocity data (§5.1).
•
•
•
•
•
32
Standard Error of Velocity
Signal-to-Noise Ratio (SNR)
Spike Filtering
Flow Angle
Boundary Adjustment
FlowTracker User’s Manual (July 2007)