1
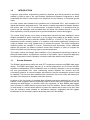
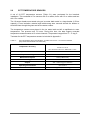
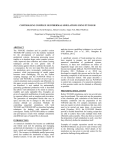
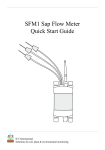
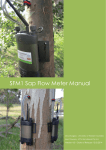
Borehole Temperature Array – Installation at the
Ruakura Climate Station Site
Fiona Atkinson
GNS Science Report 2014/01
February 2014
Anya Seward
BIBLIOGRAPHIC REFERENCE
Atkinson, F.; Seward, A. 2014. Borehole Temperature Array – Installation at the
Ruakura Climate Station Site GNS Science Report 2014/01. 18 p.
F. Atkinson, GNS Science, Wairakei Research Centre, Private Bag 2000, Taupo
A. Seward, GNS Science, Wairakei Research Centre, Private Bag 2000, Taupo
© Institute of Geological and Nuclear Sciences Limited, 2014
ISSN 1177-2425
ISBN 978-1-927278-24-6
CONTENTS
ABSTRACT ...........................................................................................................................II
KEYWORDS ..........................................................................................................................II
1.0
INTRODUCTION ........................................................................................................1
1.1
System Overview........................................................................................................... 1
2.0
ECT TEMPERATURE SENSORS ..............................................................................2
3.0
DECAGON EM50 DATA LOGGERS ..........................................................................3
4.0
RUAKURA NIWA CLIMATE STATION SITE .............................................................4
5.0
BOREHOLE CONSTRUCTION AND EQUIPMENT INSTALLATION ......................... 5
6.0
SUMMARY ...............................................................................................................10
7.0
ACKNOWLEDGEMENTS .........................................................................................10
FIGURES
Figure 3.1:
Decagon EM50 data logger. ......................................................................................................... 3
Figure 4.1:
Ruakura site map. The temperature profile borehole is located in the south east corner of
the NIWA enclosure. .................................................................................................................... 4
Figure 4.2:
The NIWA site at Ruakura. ........................................................................................................... 4
Figure 5.1:
Borehole installation using a Geoprobe drill rig. .......................................................................... 5
Figure 5.2:
ECT Temperature Sensor Cables Anchored to Nylon Rod. ........................................................ 6
Figure 5.3:
The completed NIWA Ruakura site with EM50 data loggers installed and operating. .................. 7
Figure 5.4:
The temperature sensors installed in the borehole ready to be connected to the EM50
Data Loggers. ............................................................................................................................... 8
Figure 5.5:
Example of anomalous temperature measurements recorded on the shallow sensors................ 9
Figure 5.6:
Photo of the later modification to the site involved installing the EM50 loggers and
excess cable into secondary cabinets for improved weather protection. ...................................... 9
TABLES
Table 2.1:
ECT Temperature Sensor specifications. As taken from the ICT – ECT sensor factsheet. .......... 2
(http://www.ictinternational.com.au/ect.html) ............................................................................................................ 2
Table 5.1:
Depths of the temperature sensors at the Ruakura temperature monitoring site. ........................ 7
APPENDICES
APPENDIX 1: ECT TEMPERATURE SENSOR TEST DATA .............................................. 12
APPENDIX 2: BORE LOG SHEETS ....................................................................................13
APPENDIX FIGURES
Figure A 1.1:
Raw data recorded during calibration testing. ........................................................................... 12
GNS Science Report 2014/01
i
ABSTRACT
Long-term near-surface temperatures related to seasonal and diurnal variation are being
studied by GNS Science (GNS) as part of the Low Enthalpy Geothermal Research
Programme, to understand the effect of near-surface rock properties on efficiency of
horizontal ground loops. Equipment was installed at the Raukura NIWA climate station site in
Hamilton. The temperature sensors span a depth range of 0.05 to 9 m below ground surface
level. Ten ECT soil/air temperature sensors attached to two EM50 data logger were installed
at the site to record temperature measurements at 10 minute time intervals.
Drilling and sensor installation work was carried out by Brown Brothers Drilling using a directpush drilling method. The installation was completed successfully on 17th October 2013 to
the target depth of 9 m. Core was not recovered during this drilling as previous core samples
were collected from a site 1 m away and are assumed to be sufficient for geological record at
the new drill site. The temperature data will be used to calculate thermal properties of the soil
and monitor effects of climatic events.
KEYWORDS
Borehole, Temperature, Profile, Data, Logger, Ruakura, Hamilton
GNS Science Report 2014/01
ii
1.0
INTRODUCTION
Long-term near-surface temperatures related to seasonal and diurnal variations are being
studied by GNS as part of the Low Enthalpy Geothermal Research Programme to better
understand the effect of near-surface rock properties on the efficiency of horizontal ground
loops.
An initial system was installed at the Hamilton site in November 2011, and consisted of a
digital thermometer integrated circuit. This system recorded temperature at depths between
the surface and 13 m for six months before it stopped working. It is presumed that the
system was not watertight, and had failed when the winter rainy season arrived. It has now
been replaced by a set of propose built in-ground temperature sensors and loggers.
The current study focuses on an array of temperature sensors that was installed to record
detailed temperature profile information in a 9 m deep bore located at the NIWA “elevenstation” climate station site in Hamilton (NZMG 6378587 N, 2713297 E). The goal of the new
temperature profile recording system is to measure sub-surface temperature changes at a
variety of depths over a long (greater than 12 month) time period. Two similar temperature
measuring sites are installed in Lincoln, Christchurch and Arrowtown. Seven additional
stations are planned for different locations across New Zealand, in order to compare the
effects of climate and soil-rheology type on ground temperature.
This report outlines the design and installation of the temperature-monitoring borehole at
Raukura climate station. It presents an overview of the location, type of equipment deployed,
and drilling procedure used. Calibration of sensors and initial data are also presented.
1.1
SYSTEM OVERVIEW
The Ruakura temperature profile site uses ECT temperature sensors and EM50 data logger
design. The EM50 data logger was set up to record temperatures at 10 minute intervals.
Important considerations for the installation were to minimise disruption to the surrounding
soil and groundwater flow, while maximising contact between the sensors and the
surrounding material. A narrow borehole was drilled so that the temperature sensors could
be installed. The hole was then backfilled with a bentonite clay slurry, while still allowing for
the walls of the borehole to collapse around the sensors.
A review of the first month of recorded data revealed anomalous readings from one of the
EM50s. It was suggested that the anomalies could be due to dew point or heat from the sun
affecting the data loggers, or moisture within the equipment, so both EM50s data loggers
were mounted in a small cabinet to protect them from the weather. Excess cable was coiled
up and stored in a second small cabinet to protect the cables and to leave a tidy site. Data
from the following month showed no anomalous readings, suggesting that the loggers
benefitted from the secondary cabinet protecting them from the weather.
GNS Science Report 2014/01
1
2.0
ECT TEMPERATURE SENSORS
A set of 10 ECT temperature sensors (Table 2.1) were purchased for the borehole
installation. This consisted of five sensors with 5 m cables, three with 10 m cables and two
with 15 m cables.
The 10 sensor heads were tested using an ice water bath made in a large beaker (2.5 litre
capacity). Foam insulation material and bubble-wrap were secured around the beaker to
slow heat loss through the glass and off the water surface.
The temperature sensors were placed in the ice water bath and left to equilibrate to room
temperature. The process took 72 hours. During this time, the data loggers recorded
temperature measurements at 10 minute intervals. Temperature ranged from 0 – 17 deg C.
Test data for the ECT temperature sensors is included in Appendix 1.
Table 2.1:
ECT Temperature Sensor specifications. As taken from the ICT – ECT sensor factsheet.
(http://www.ictinternational.com.au/ect.html)
-40 to -20°C: ± 1.0°C
Temperature Accuracy
5 to 40°C: ± 0.5°C
40 to 50°C and -20 to 5°C: better than ± 1.0°C
Temperature Resolution
0.1°C
Temperature Range
-40°C to 50°C
Measurement Speed
10 ms (milliseconds)
Sensor Type
Thermistor
Output
320 – 1000 mV @ 3 V excitation
Operating Environment
-40°C to 50°C
Power
2.5 VDC @ 2 mA, to 3.6 VDC @ 7 mA
GNS Science Report 2014/01
2
3.0
DECAGON EM50 DATA LOGGERS
Temperature measurements were recorded by Decagon EM50 data loggers, purchased from
ICT international. They are powered by five AA batteries which are expected to last 6
months. Each EM50 logger can record data from five sensors, so two EM50 loggers are
required for the ten sensors used at the borehole site.
Programing and data collection is done via a comms port (Jack plug to USB lead) connected
to a laptop running ECH2O Utility Software. The software allows the EM50 to be programed
with Device ID, Device location, measurement interval and type of sensor in each port. It also
displays a battery warning light when the batteries drop below 5% and has status lights and a
test button to aid with basic functionality monitoring (See EM50 User Manual).
The software allows all five ports to be scanned for data in real time. The “Download”
function allows data to be downloaded in four different formats, to a location of the user’s
choice. For this project we used the excel workbook format.
Figure 3.1:
Decagon EM50 data logger.
GNS Science Report 2014/01
3
4.0
RUAKURA NIWA CLIMATE STATION SITE
The temperature profile borehole and loggers were installed at the Ruakura NIWA climate
monitoring station in Hamilton East on 17th October 2013. Co-locating the borehole at an
established NIWA climate station allows climate information, such as atmospheric
temperature and rainfall, to be directly compared with our recorded ground temperature
profiles. The NIWA climate site is currently leased from AgResearch. Climate records have
been collected from this location since 1906. Figure 4.1 is a site map of part of the
AgResearch campus with the locations of the NIWA climate site and the temperature
borehole marked.
Figure 4.1:
Ruakura site map. The temperature profile borehole is located in the south east corner of the NIWA
enclosure. Note the 11 KV buried power cable which crosses the NIWA site (location is
approximate).
The NIWA climate station is enclosed within a fenced area 50 m west of an access road.
GNS installed the temperature borehole in the south east corner of the NIWA enclosure,
1.5 m from the corner post (Figure 4.1 and Figure 4.2). This is approximately 1 m from the
previous borehole. Maps of underground services, provided by AgResearch, showed an
11 KV power cable crossing the NIWA enclosure. The drilling site was selected far enough
away from the power cable to ensure excavation safety and to minimise any thermal effects
of the cable on the sensor installation.
Figure 4.2:
The NIWA site at Ruakura. The arrow shows the location of the temperature profile borehole.
GNS Science Report 2014/01
4
5.0
BOREHOLE CONSTRUCTION AND EQUIPMENT INSTALLATION
Drilling at the Ruakura site was carried out by Brown Brothers Drilling on 17th October 2013.
A track-driven “Geoprobe” drilling rig was used (see Figure 5.1).
Figure 5.1:
Borehole installation using a Geoprobe drill rig.
GNS Science Report 2014/01
5
Drilling to the target depth (9 m) was achieved using a direct push method. A hollow drill pipe
of PQ size (3.25”/82.5 mm outside diameter) fitted with a short, tapered-edge nose cone was
forced into the ground using a combination of direct pushing and hammering by the drill head
mechanism. Ground conditions were fairly soft, allowing easy drilling using this method, and
the drilling process took approximately one hour. The core log from the previous borehole is
shown in Appendix 2.
Nylon rods were used to provide a rigid core to which the ECT temperature sensor cables
could be anchored for installation (Figure 5.2). The 16 mm diameter rods totalled 8.5 m in
length. Adhesive tape was used to attach the cable to the rods and the rods to each other.
Figure 5.2:
ECT Temperature Sensor Cables Anchored to Nylon Rod.
GNS Science Report 2014/01
6
The sensors were anchored at the distances provided in Table 5.1. Their corresponding port
number is also listed.
Table 5.1:
Depths of the temperature sensors at the Ruakura temperature monitoring site.
Sensor #
Depth below ground level (m)
Port Number
1
0.05
Shallow Port #5
2
0.10
Shallow Port #4
3
0.30
Shallow Port #3
4
0.50
Shallow Port #2
5
1.00
Shallow Port #1
6
2.00
Deep Port #5
7
3.00
Deep Port #4
8
5.00
Deep Port #3
9
7.00
Deep Port # 2
10
9.00
Deep Port #1
Once the sensors were in place, the drill pipe was lifted out in sections. Some lifting of the
sensor string was noted during the initial pull-up of the drill pipe, but it was successfully
pushed back down due to the soft ground conditions. Dried pellets of bentonite clay were
added during the removal of the drill pipe, in order to seal the drill hole.
The installation was completed by attaching the EM50 loggers to the nearby fence post
(Figure 5.3). The sensor cables were buried in a shallow trench from the borehole to the post
(Figure 5.4).
Figure 5.3:
The completed NIWA Ruakura site with EM50 data loggers installed and operating.
GNS Science Report 2014/01
7
Figure 5.4:
The temperature sensors installed in the borehole ready to be connected to the EM50 Data
Loggers.
After the sensor cables were connected to the EM50 loggers, the loggers were set-up to
record temperatures at 10 minute intervals. The initial testing indicated that the logger and
temperature sensors were working correctly.
The site was visited on the 12th November 2013 to check that the installation was performing
correctly and to add further protection for the excess cable and EM50 loggers. It was found
that the EM50 logger supporting the top five sensors was providing anomalous results
(Figure 5.5). This is thought to have been caused by the high dew point/temperature
gradients of the spring weather conditions.
The EM50 loggers were then installed into an Aria cabinet and the excess cable was coiled
into the cabinet left empty from the previous borehole installation (Figure 5.6). The site was
re-visited on the 3rd December 2013. The downloaded temperature measurements did not
show any further anomalous readings. The site will be visited every three months for at least
5 years to collect results and check the condition of the equipment.
GNS Science Report 2014/01
8
Figure 5.5:
Example of anomalous temperature measurements recorded on the shallow sensors.
Figure 5.6:
Photo of the later modification to the site involved installing the EM50 loggers and excess cable into
secondary cabinets for improved weather protection.
GNS Science Report 2014/01
9
6.0
SUMMARY
A ground temperature profile measurement system was installed by GNS at the Ruakura
NIWA climate site in Hamilton East. This replaced a previous installation which had failed at
the site due to sensor cable failure. Ten ECT temperature sensors were installed at depths of
5 cm, 10 cm, 30 cm, 50 cm, 100 cm, 200 cm, 300 cm, 500 cm, 700 cm, and 900 cm below
the surface. The data is recorded on two EM50 data loggers. The new installation will be
monitored with the aim of comparing the results to the two other working sites at Wairakei
(Taupo) and Lincoln (Christchurch) and the other seven planned installations at selected
sites around New Zealand.
All future sites will have the EM50 data loggers and any excess cable housed in an additional
Aria cabinet to ensure the endurance of the equipment.
7.0
ACKNOWLEDGEMENTS
We would like to acknowledge Andrew Harper at NIWA for assistance with site selection,
Alec McGowan at AgResearch Ruakura for assistance with site access and underground
service locations, Nathan Brown, Brown Brothers Drilling for drilling and installation work,
and Michael Forester, ICT International for the manufacture of the ECT temperature cables
and supply of the equipment. The work is funded by the Ministry for Science and Innovation’s
Low Enthalpy Geothermal research programme.
GNS Science Report 2014/01
10
APPENDICES
GNS Science Report 2014/01
11
APPENDIX 1: ECT TEMPERATURE SENSOR TEST DATA
The sensors are placed in a bath of ice in order to identify any anomalous sensors. The ten
sensors test and deployed at the Raukura show good correlation. : shows the raw data
recorded over a 3 day period.
Figure A.1:
Raw data recorded during calibration testing.
GNS Science Report 2014/01
12
APPENDIX 2: BORE LOG SHEETS
GNS Science Report 2014/01
13
GNS Science Report 2014/01
14
www.gns.cri.nz
Principal Location
Other Locations
1 Fairway Drive
Dunedin Research Centre
Wairakei Research Centre
National Isotope Centre
Avalon
764 Cumberland Street
114 Karetoto Road
30 Gracefield Road
PO Box 30368
Private Bag 1930
Wairakei
PO Box 31312
Lower Hutt
Dunedin
Private Bag 2000, Taupo
Lower Hutt
New Zealand
New Zealand
New Zealand
New Zealand
T +64-4-570 1444
T +64-3-477 4050
T +64-7-374 8211
T +64-4-570 1444
F +64-4-570 4600
F +64-3-477 5232
F +64-7-374 8199
F +64-4-570 4657