1
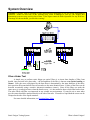
FIBER SIGMA 105 Hillcrest Road Flemington, New Jersey 08822-7173 U.S.A. Tel: +(908) 377-0763 Fax: +(908) 547-0095 E-mail: [email protected] Web: http://www.fibersigma.com STATIC FATIGUE TESTING SYSTEM: TRIGGER BOX MONITOR SYSTEM TBM for Windows CONTROL PROGRAM FOUR CHANNEL TRIGGER BOX PRECISION BORE TUBES USER’S MANUAL (PRELIMINARY VERSION) (For TBM for Windows software version 0.03) Version 0.03, February 2014 Contents Edit Existing Event Window ......................................17 Edit New Event Window ............................................17 Add Comment to Data File Window ..........................17 Cleanup Data File Window.........................................18 Export Data Window ..................................................18 Analyze Data Window................................................19 Contents................................................................................... 1 System Overview .................................................................... 1 Fibers Under Test .............................................................. 1 Four-Channel Trigger Boxes ............................................. 2 Trigger Box Monitor System............................................. 2 What is Static Fatigue?............................................................ 3 Background........................................................................ 3 Static Fatigue ..................................................................... 3 Dynamic Fatigue................................................................ 4 Test Environment .............................................................. 4 Trigger Box Monitor System .................................................. 5 Installation ......................................................................... 5 PC Minimum Requirements ........................................ 5 Software and Hardware Installation............................. 5 Time Keeping .................................................................... 6 Fail-Safe Operation............................................................ 6 Data File Structure............................................................. 7 Data Files ..................................................................... 7 Log Files ...................................................................... 8 The TBM Window System................................................ 9 Main Window .............................................................. 9 Channel Monitoring Information Area................... 9 Menu Bar.............................................................. 10 Trigger Box Power Status Area ........................... 11 Command Buttons Area ....................................... 11 Log Grids Area..................................................... 12 Program Options Window ......................................... 12 Email Configuration Window.................................... 13 About TBM Window ................................................. 13 Update Firmware Window......................................... 14 Channel Setup Window ............................................. 14 Status Area ........................................................... 15 Break Counts Area ............................................... 15 Data Analysis Area .............................................. 15 Start Time Area .................................................... 15 Data File Area ...................................................... 15 Actions Area ........................................................ 16 Static Fatigue Testing System Four-Channel Trigger Box .....................................................20 Introduction ......................................................................20 Operation ..........................................................................20 Power Supply Requirements.......................................20 Input............................................................................20 Sensitivity ...................................................................20 Output .........................................................................20 Latched Output ...........................................................21 Multiplexed Outputs ...................................................21 Acoustic Telltale...............................................................21 Computer Interface...........................................................21 Interface Pin-out .........................................................21 Pulsed Outputs, PA..PD ................................................22 Latched Outputs, LA..LD .............................................22 Reset Inputs, RA..RD ...................................................22 5 VDC.........................................................................22 Internal Adjustments ........................................................22 Trouble Shooting..............................................................23 Spurious Pulses...........................................................23 Missed Trigger Events ................................................23 Multiple Triggers from One Event .............................23 Precision Bore Tubes .............................................................24 Sensor Attachment Issues.................................................24 Sensor Attachment for Liquid Test Environments .....25 Sensor Attachment for Air or Gas Test Environments25 Standard Test Methods .....................................................26 Calculation of Failure Stress.............................................26 Calculation of the Stress Corrosion Parameter, n .............26 References..............................................................................27 TBM for Windows Change History .......................................27 1 Contents System Overview Warning: Carefully read all warnings in this manual before attempting to use any of the equipment or software. Failure to take note of the warnings may result in damage to your PC, the Trigger Box Monitoring system or may result in loss of data. Fiber Sigma cannot be held responsible for any such loss. Warnings are shown shaded, just like this warning! Fibers Under Test A simple way to perform static fatigue on optical fibers is to insert short lengths of fiber, bent double, into precision bore glass tubes – the deformation of the fiber is known as two-point bending or flexure. Since the stress experienced by the bent fibers is determined by the inner diameter of the tubes, their precision ID means that all fibers in one tube see the same identical stress. Failure of the fibers can be detected acoustically using a sensitive ultrasonic transducer (sensor). Since all the fibers are under the same stress, it is enough to know when the breaks occur – it is not needed to know which fiber broke when. The tubes filled with fiber can immersed in any suitable test environment. If tested in air or some other gas, the sensor should be attached directly to the side of the tube. If tested in a liquid bath the sensor can be clamped to the side of the liquid container. For more detailed information, see Precision Bore Tubes. Static Fatigue Testing System 1 What is Static Fatigue? Four-Channel Trigger Boxes Warning: The trigger boxes are extremely sensitive and can be triggered (giving false break events) by, for example, static discharges. It is highly recommended that the trigger boxes and the acoustic sensors are placed on a static dissipating mat and that the user discharges his/herself on the mat before touching any part of the system. It is recommenced that the AC power supply be filtered to avoid false break events caused by noise on the power supply. The four-channel trigger box connects to up to four acoustic sensors. The trigger box amplifies the signal from each sensor and detects when the signal exceeds a particular value when a fiber break is occurs. This triggers the amplifier to output a digital pulse which is then logged to give the time of failure. For more detailed information see the Four-Channel Trigger Box section. Trigger Box Monitor System The four-channel trigger boxes are monitored by the Trigger Box Monitor (TBM) hardware. Any break detections are logged in the TBM and stored. The TBM unit connects to a PC via a USB connection and the TBM for Windows software on the PC collects the break detection events and displays them for the user. TBM for Windows organizes the breaks for each of the 32 channels (up to 4 channels for each of up to 8 trigger boxes), keeping logs of a variety of events in addition to the break detection – the experiment start time and any diagnostic events such as power failures on the trigger boxes. The results for each channel can be subjected to a statistical analysis to determine, for example, the mean time-to-failure and the Weibull parameters describing the time-to-failure distribution. The time-to-failure data can be exported for insertion into graphing software or a spreadsheet. Damage to the apparatus is possible if the equipment is not used correctly. Therefore familiarize yourself with this manual before using the equipment. For more detailed information see the Trigger Box Monitor System. Precision Bore Tubes 2 Static Fatigue Testing System What is Static Fatigue? Background I recommend the book, Mechanical Properties of Ceramics: 2nd Edition by Wachtman, Cannon and Matthewson (Reference 1) for detailed background on the phenomena discussed here. I declare my interest in this book as a coauthor! However, I do not recommend it to generate royalties (which are pitifully small anyway) but because it lays out the topic in the way I like. The most relevant chapters are 5 (fracture mechanics, 7 (statistical aspects of strength) and 8 (subcritical crack growth/stress corrosion/fatigue) which I completely rewrote for the second edition. Glasses in general, and optical fiber in particular, are susceptible to stress corrosion cracking also know as subcritical crack growth or fatigue. Tiny defects in the surface of the glass locally concentrate any applied stress causing the defects to be preferentially attacked by moisture (or some other mildly corrosive environmental species). The defects slowly grow and will eventually reach a critical size at which time the glass will fail by fast fracture. The defects are submicroscopic (they are too small to be viewed by an optical microscope and even by most electron microscopes). The biggest defects are rare (maybe only one per kilometer of fiber length) so could be nearly impossible to find even if they could be imaged. The biggest defects in shorter lengths (say, less than a meter) are of atomic dimension and so are effectively undetectable. The presence of the defects can therefore only be inferred by measuring the strength. The slow growth of the defects under the combined action of stress and environmental moisture means that the strength properties of optical fiber are time dependent. In a dynamic fatigue experiment the strength is measured by loading the fiber up to failure at different loading rates – the slower the loading rate, the weaker is the measured strength since there is more time for the defects to grow subcritically. In a static fatigue measurement the fiber is loaded rapidly to a constant stress – the defects grow subcritically until failure occurs – this phenomenon is also known as delayed failure. In this case, the higher the constant stress, the shorter the time to failure. Static Fatigue The practical concern is that an optical fiber is often subjected to applied stress during manufacture, cabling, installation and throughout its life if installed with a small amount of residual stress. Delayed failure in service is clearly highly undesirable. Reliability can be assessed by measuring the time to failure as a function of applied stress in an accelerated static fatigue experiment – the lifetime in service is then estimated by extrapolating the time to failure to lower applied stress more characteristic of the stress the fiber sees in service. Service conditions are therefore usually modeled as static fatigue. Fracture mechanics theory provides a relationship between the time so failure, t f , and the static applied stress, a : in 2 tf B n a where B 2 1 . AY (n 2) K InC2 2 (1) B is a compound variable of several parameters which are described in detail in Reference 1. For our purposes b is just a scale parameters that depends on the nature of the glass and the test environment (humidity, temperature, pH, etc.). i is the initial or inert strength – it is the strength that would be measured if there were no stress corrosion cracking. When this equation is applied to service conditions, i is often replaced by the proof stress, p , to give a worst-case estimated of lifetime. Static fatigue experiments are time consuming and require many specimens to be tested simultaneously. The lifetime is very sensitive to the value of the exponent n, which is known variously as the stress corrosion susceptibility parameter, the stress corrosion parameter, the fatigue parameter, the n-parameter or simply as “n” - everyone in the reliability field will know what you mean if you say “n”! Higher values of Static Fatigue Testing System 3 System Overview n are desirable and typical values for fused silica optical fiber range from about 18 to nearly 30. Measurements are primarily concerned with measuring n while B is less important since for many reliability models it has the same value during laboratory testing and in service conditions and so cancels when calculating lifetime under service conditions. Static fatigue measurements are generally consider less convenient to perform than the dynamic fatigue measurements described below. This is because very long times to failure might be encountered if the applied stress is accidentally set too low. Also, the distribution in times to failure is extremely broad, meaning again that the experimental duration can be inconveniently long. Both these effects mean that to get results in a reasonable time a large number of specimens must be under test simultaneously (typically hundreds or even thousands) and the large amount of equipment needed can be expensive. However, static fatigue measurements more closely model the in-service conditions and so are more meaningful. Most measurements are made using dynamic fatigue (as described below) for the convenience of getting results relatively quickly. However, lifetime estimates require more extrapolation if based on dynamic fatigue and so are less meaningful. The Fiber Sigma Static Fatigue Testing System overcomes the problems with static fatigue by loading the fibers in two-point flexure using precision bore tubes. The system can test large numbers of specimens simultaneously for extended durations (out to years) and so provides a viable alternative to dynamic fatigue. The method is described in detail in Reference 2. Dynamic Fatigue The purpose of this document is to describe static fatigue, not dynamic fatigue. However, a brief discussion of dynamic fatigue is included for comparison purposes. Static fatigue measurements relate the measured failure stress, f , to the stress rate, d dt : nf 1 (n 1) B in 2 . (2) The value of n can be obtained by such measurements and used to predict the behavior under static fatigue conditions. Fiber Sigma sells a Two-Point Bend System for dynamic fatigue measurements in two-point flexure. The method is described in detail in Reference 3. Test Environment Warning: Fatigue (be it static or dynamic) is sensitive to the environment (temperature, humidity in air, pH and ionic content in water). It is therefore important to use a carefully controlled test environment. The test environment should be controlled and monitored carefully so the nature of the environment can be reported in detail at the end of the experiment. Standard test procedures should be consulted for suitable test environments. However, in my opinion, the test procedures are a little incomplete. For example one standard specifies a test environment of 22 3C, 50 5% humidity. However, if one compares measurements made at opposite ends of the permitted range (i.e. 21C, 45% humidity compared to 23C, 55% humidity) are noticeably different. When comparing results and running “round robin” tests, it is important to report the actual test environment; it is not enough to report that the environment was within the limits specified by the test procedure. System Overview 4 Static Fatigue Testing System Trigger Box Monitor System Installation PC Minimum Requirements The Trigger Box Monitor system is controlled from an IBM PC or compatible. The computer does not need to be particularly powerful since the time-critical event logging is performed by the microprocessor in the Trigger Box Monitor unit – events are then uploaded to the PC over a USB connection. The PC therefore must have an available USB port. TBM for Windows should run on any version of Windows since 98SE but has as yet only been tested on Windows XP (SP3) and Windows 7. It runs on either 32 or 64-bit versions of Windows. The PC also needs to have the Microsoft .NET Framework 3.5 or later. This can be obtained directly from Microsoft – contact us if you have any difficulty. In due course it is planned that the TBM for Windows setup program will automatically install the .NET Framework if needed. Software and Hardware Installation Prepare the PC prior to installation by running Windows Update. Also, check that Windows is configured to regularly update its internal clock via the internet. Consult Windows documentation to find out how to do this. Also, check that the PC has the correct time zone set – changing the time zone later will introduce an offset error in any experiment spanning the standard time/summer time change. Run the TBM for Windows setup program. The latest version of the program can be downloaded from http://www.fibersigma.com/downloads. The program name will be Setup_TBM_nnn.exe where n.nn is the version number. Running this program will install the TBM for Windows program and will also ask if you want to install the driver for the USB connection. If updating TBM for Windows, you can run the installation program without uninstalling the older version. Also, you probably will not need to reinstall the USB driver except for the initial installation. Connect the Trigger Box Monitor interface box to power – a 12 VDC power “brick” is supplied. This should be connected to a reliable source of AC power. It is a good idea to connect the Trigger Box Monitor to a battery-backed uninterruptible power supply. The PC can now be connected to the Trigger Box Monitor using the supplied USB cable and TBM for Windows can be started. Connect the Trigger Box Monitor interface box to the trigger boxes using the cables supplied. 10 cables of various lengths are supplied with each 32 channel monitoring system. Wherever possible use the shortest cable length available that will reach, this will reduce the possibility of electrical interference. Secure the connectors using the screws installed in the connector shells, but do not over tighten them. The length of the cables (in meters) is marked on the connectors. All ten cables are identical electrically. They can be connected end to end for long runs. Secure the cables to each other using the #4/40 stand-offs supplied in the accessory box. Additional cables can be ordered from Fiber Sigma or can be wired according to the following instructions. Using good quality, 6-core screened cable, on one male and one female Canon D25 connector, connect together pins 2 and 2, 4 and 4, 6 and 6, 8 and 8, 13 and 13, 25 and 25. Connect the shield at both ends to pins 24. Also connect the shield to the connector shell on the male connector only. Warning: Keep all cables as far as possible from potential sources of electrical interference (power supplies, transformers, air conditioners, etc..) The Trigger Box Monitor interface box accepts signals from the trigger boxes via fully optically isolated inputs. The interface box contains a microprocessor module, the TBM Controller, that monitors the pulsed output from the trigger boxes and logs them. In addition, the power at each trigger box is Static Fatigue Testing System 5 Trigger Box Monitoring System monitored so that if power is lost, events from the affected channels will be ignored, and the loss of the trigger box is logged. The interface box is connected to the PC via a USB port. The TBM for Windows program periodically checks the interface box and uploads any events and saves them to the appropriate data files. Therefore, the monitor box is still logging events even if the PC crashes or loses power. However, the internal buffer of the TBM Controller is of limited size so every effort should be made to keep the TBM for Windows program running in order to avoid buffer overflow. Time Keeping The TBM Controller inside the Trigger Box Monitor interface box implements two precision clocks, one in hardware and one in software (clocked by a precision crystal). The hardware clock is battery-backed and keeps time even if the TBM Controller loses power. The TBM Controller uses its software clock to log the time of events and so only uses the hardware clock to refresh the software clock when it reboots after a power loss. This arrangement means that, even though the controller loses any events that occur while it is without power, it can immediately begin logging again when power is restored. The controller has a limited buffer for storing events so it can operate for a reasonable amount of time without any interaction with TBM for Windows running on the PC. The TBM for Windows obtains the date and time from the Windows operating system, which is based on the PC system clock. TBM for Windows periodically compares its clock with both clocks in the TBM Controller – if there are any discrepancies the clocks in the controller are updated. This means that the “master” clock is in the PC. Any updates are logged by TBM for Windows so you can keep an eye out for clock problems – repeated corrections, or corrections larger than a second or two should be investigated. Although the PC clock is typically less accurate than the clocks in the TBM monitor, it can be independently checked via the internet and so using a single clock for defining time makes the software simpler. The PC should be configured to automatically update its clock using one of the internet timing signals. Consult the Windows documentation on how to do this. Windows greatly increases the precision of the PC clock by continuously adjusting a correction factor based on the differences found between the PC and internet clocks. The clock in the PC is usually configured to automatically shift the clock as it passes from Winter/Standard time to Summer/Daylight savings time or vice versa. If the “local” time were used for logging events calculation of experimental results would be greatly complicated since it would have to account for the specific clock bias for your specific time zone. The simplify matters, the time used by TBM for Windows is standard or winter time. During summer daylight savings it will differ from local time by an hour in the US for example. However, when the local and standard times are different, both are shown in the status bar at the bottom of the Main Window. The time of events currently is logged in seconds – this means that the error in the time of an event will not normally exceed one second but could be up to two seconds. This is typically more than enough for a typical static fatigue experiment.. To summarize: 1. Timing precision is about one second. 2. But this assumes that the PC clock is that accurate. Make sure that Windows is regularly updating its clock from an internet time server. 3. Monitor the warnings region of TBM for Windows for excessively frequent or large corrections to the TBM Controller clocks. Fail-Safe Operation It is planned that the TBM for Windows installation program will copy a shortcut to TBM for Windows to the startup program folder so that TBM for Windows will automatically start after a reboot. Trigger Box Monitoring System 6 Static Fatigue Testing System While great effort has been made to ensure TBM Controller and TBM for Windows program as robust as possible, entirely fail safe operation is impossible. A power “brown out” can crash the PC (less of a problem) or the TBM Controller (more of a problem), but not hard enough to cause a reboot. This is best avoided by using an uninterruptible power supply for the system. Unforeseen bugs in the TBM software and firmware could also cause the system to hang. While such problems are unavoidable, TBM for Windows logs the duration of the problem so that the significance to on-going experiments can be assessed. Data File Structure Data Files Warning: Do not move or modify data files outside the TBM for Windows program. By default data files for the channels are stored in the My Documents\TBM folder. N.B. Data files generated by TBM for DOS should be readable by TBM for Windows so that older files can be analyzed. The data file contains plain ASCII text with one event per line. Lines are terminated by the standard carriage return, linefeed pair. Each line is of the form: # yy/MM/dd hh/mm/ss [comment] The character represented by # specifies the type of event. yy/MM/dd represents the date in year/month/day format with two characters per field; while this format is non-standard worldwide (except, I think for Canada) it has the advantage that a simple alphanumeric sort on the date and time puts all the events into chronological order. hh/mm/ss specifies the time of the event in hours/minutes/seconds format; the hours are in a 24 hours format, running from 00 to 23. Some events are followed by a comment. Note that the year represented by two digits is assumed to be 20yy. If you import data files from TBM for DOS with events before January 1, 2000, the dates will be assume to be in the 21st century. Since this 100 years offset applies to both the start time and events times, this should not cause any problems unless the data file contains events both before and after January 1, 2000. Let us know is this is too much of a limitation. Possible values for the event type characters, and their meanings are: = Break event detected; a signal was received from the trigger box. ; A comment; the comment can be explicitly appended to the data file from the Channel Setup Window or are added by the TBM for Windows program. * This is a comment which is appended to the data file by the user via the Channel Setup Window. It is planned that * comments will appear in statistical analysis output to annotate the results. In contrast the ; comments are intended and informational only. S This event signals the start time for an experiment. Such events can either be explicitly inserted into the file by directly editing it or by setting the first event in the file to be the start event; see the Analyze Data Menu. The data file can contain more than one start event; in this way data from multiple runs can be combined into one file for analysis. b, B These two types of event are reported by the TBM Controller when it boots - which should not normally occur during testing. It indicates that power to the TBM Controller was interrupted or the USB cable was disconnected and reconnected. The b event gives the date/time when the TBM Controller was last “alive” and the B event is the date/time when it rebooted. Any events that occurred between the b and B date/times are lost. R This event occurs when TBM for Windows starts. Static Fatigue Testing System 7 Trigger Box Monitoring System -, + These events occur when the trigger box for the relevant channel loses (-) or regains power (+). Any breaks between the times of the – and + events will have been missed. c, C These events occur when a discrepancy is found between the PC clock and the TBM Controller’s hardware (c) or software (C) clocks. The correction applied to the TBM Controller clocks is given in the comments field. e This event signifies that an internal error in the TBM Controller was detected – the exact error is given in the comments field. It signifies hardware issues. If the error occurs repeatedly report the problem to Fiber Sigma. However, “the real time clock was stopped recently” suggests that the internal battery for the TBM Controller’s hardware clock needs replacing. It is a standard 2024 lithium coin cell which can be access by removing the lid from the TBM Controller interface box. Disconnect the USB cable and power while replacing the battery. x, X These events report that errors have been detected in the communications between the TBM Controller and the TBM for Windows program. Check the USB cable. If the problem is persistent, report to Fiber Sigma. ><IO These events were used by TBM for DOS to signify censored data. They are not currently implemented in TBM for Windows. Log Files Log files which contain logs of all events as well as error messages are stored in the subfolder \LOGS in the folder used for saving data files – by default the log files are in the My Documents\TBM\LOGS folder. There are three logs files named EVENTS_yyyymmdd, INFO_yyyymmdd and ERRORS_yyyymmdd. “yyyymmdd” is the year month and day for the log file. New files are created each day. The contents of the log files are shown in the main window in the log file grid area. Trigger Box Monitoring System 8 Static Fatigue Testing System The TBM Window System Main Window Channel Monitoring Information Area The above screenshot shows the main window of the TBM program. Most of the area is devoted to displaying information about the individual channels, 1A, 1B, … 8C, 8D. The channel name, 5C for example, represents trigger box 5, channel C. Each channel has a button which opens the Channel Setup Window for that channel. Each active channel (channels 1A, 1B, 1D and 2C in the above screenshot) has a status region listing how many breaks have been detected and how many breaks are expected. For example, 12 breaks have been detected on channel 1A and a total number of 14 breaks is expected. If the measurement is in progress (i.e. the number of breaks is less than the expected number of breaks) the status region is green. If the expected number of breaks has been reached the status region is yellow (for example channel 1B above). The channel will continue to be monitored and will show yellow until the maximum number of breaks is reached, as specified in the Channel Setup Window; at that time, the software stops monitoring the channel for any additional breaks and the status area turns red. If channel monitoring is turned off in the Channel Setup Window the number of breaks detected continues to be shown in the status area, but the area is grey, as for channel 1D above. Each channel information area also includes a tabulation of events logged for that channel – the tabulation shows the contents of the data file attached to that channel. Messages include breaks times, status changes (e.g. trigger box power changes) and error messages that might affect that channel (e.g. Static Fatigue Testing System 9 Trigger Box Monitoring System timing clock updates). Important messages that might affect the validity of the data are shown highlighted, for example the magenta messages want of problems with synchronizing the software and hardware clocks. Menu Bar File | Exit Program The TBM program is closed and will not automatically restart Data | Analyze data file Opens up the Channel Setup Window so that data in a file can be analyzed – the file must not be attached to one of the channels being logged. Because of this several options in the Channel Setup Window are grayed-out (disabled) or hidden. View | Hide all grid contents (no loss of data) Clears all the data grids – those showing activity on all active channels as well as the log windows. The underlying data in the data and log files are unchanged. The purpose of this option is to remove clutter on the screen. When the user comes back later to check the program, only events that have occurred since the grid contents were hidden will be shown. This makes keeping an eye on all activity easier. View | Show all grid contents Makes all the grid contents visible including those that might have been hidden by View | Hide all grid contents. Help | Help Opens the online help file. Trigger Box Monitoring System 10 Static Fatigue Testing System Help | Check for program update Checks the Fiber Sigma web site to see if a newer version of TBM for Windows is available. The PC needs an internet connection for this function to work. Help | Update TBM controller firmware Updated versions of TBM for Windows might need the firmware in the TBM controller to be updated. Selecting this option opens the Update Firmware Window. Help | About Opens the About TBM Window which shows version information and gives access to some diagnostic information. Trigger Box Power Status Area The power status of the Trigger Boxes is shown in the grid of 8 cells. If a cell is green, the corresponding trigger box is properly powered. If the cell is red the corresponding trigger box has lost power or is not attached. If the power status changes for any trigger box, messages are sent to the log files and to the data files for any active channel on that. So, if a trigger box temporarily loses power, the times the box lost and regained power are logged which will help identify when any breaks are lost. Logging break events is stopped while a trigger box is without power. Also, break events are ignored for about a second after a trigger box regains power in order to avoid spurious break events during the powering up process. Command Buttons Area Clear logs button Clicking this button clears the three log grids. The information in the log files is unchanged but no messages are shown on the screen to reduce screen clutter and to quickly identify any recent activity. Options button Opens the Program Options Window. Analyze data button Opens the Channel Setup Window so that the contents of a data file can be analyzed. The data file must not be associated with any of the active channels. The behavior is functionally identical to the Data | Analyze data file menu bar item. Static Fatigue Testing System 11 Trigger Box Monitoring System Log Grids Area Three different log files are implemented that maintain a record of all program activity. New log files are opened each day so that the files do not get too log. The Event log contains messages relevant to the active channels (breaks, trigger power status changes etc.). The information log contains a variety of warning messages associated with functioning of the TBM program. The Error log contains more serious messages that might affect the validity of data. The Error log should be monitored carefully. Click Log Files for more information. Program Options Window Currently the only program options concern sending email messages to the operator so that they can remotely monitor the progress of experiments and the status of the TBM program. This window contains three check boxes which, if checked, enable the corresponding messages to be sent. The PC must have an internet connection for the email notifications function to work. Clicking the Configure button opens the Email Configuration Window. Trigger Box Monitoring System 12 Static Fatigue Testing System Email Configuration Window This window is used to configure the various parameters needed to send email notifications while in automatic mode. Note that messages can be sent to multiple recipients. If you are not sure what to use for these parameters, check your email program (which will already be set for sending mail in the same way) or with your IT support department. About TBM Window Shows version and registered user interface. The System Info button provides diagnostic information that might be requested by Fiver Sigma technical support. Static Fatigue Testing System 13 Trigger Box Monitoring System Update Firmware Window Follow the instructions! Channel Setup Window Trigger Box Monitoring System 14 Static Fatigue Testing System This window contains the functionality for setting up the behavior of a channel that is to be monitored. Several parts of this window might be disabled (grayed-out) or hidden depending on the context. Information: If an event occurs on the channel while the Channel Setup Window is open, a timer starts a countdown – when the timer expires the Channel Setup Window (and any windows below it) is automatically closed so that the new event(s) can be recorded. This is to avoid having the experiment and the data file getting out of synchronization. If the timer starts counting down you have a few seconds to finish making any changes and close the Channel Setup Window. Status Area This area (shown green above) shows the channel being configured and the color of the area indicates status – for example green means the channel is currently actively logging breaks. Break Counts Area The number of breaks expected on the channel (the number of specimens) is configured here. For safety logging will continue after this number of breaks is reached until the specified maximum break count is reached at which time logging automatically stops. Also shown in this area is the number of breaks detected so far as well as a calculation of how many breaks are left to be detected (specimen count minus break count). Data Analysis Area This area shows a grid containing the contents of the data file associated with the channel being configured. In addition, the last column includes the calculated times to failure for any detected breaks – provided a start time has been specified. The units are the time to failure can be selected using the radio buttons in this area. The functions of the several buttons are: Start Time Area This area of the Channel Setup Window provides various options for specifying the experiment start time. Depending on the radio button selection the start time event can be added to the top of the data (the start time is for all data in the grid) or at the bottom of the data (for adding a continuation experiment). Note that data files can contain multiple start time events and each break event is assumed to occur relative to the start time specified before the event. The start time can be selected to be the current time or the directly edited. A useful option is to convert the first break event in the data file to a start event – when an experiment is started, the acoustic sensor can be tapped to generate a break event which is then converted to the start time. Data File Area The data file associated with the channel is selected by either typing the file path and name, or the Browse button can be used to browse the file system. Warning: Do not attach a channel to a data file on a removable drive – this will cause problems if the removable drive is removed during an experiment. The Save as button copies the current file to a different file and continues logging to the new file. The copy data file button causes a copy of the current data file to be made. Logging continues to go to the original data file so the new file can be used for viewing or editing data outside the TBM program. Warning: Data files attached to the channels must not be accessed from outside the TBM program. Doing so could corrupt the files and cause data loss. Static Fatigue Testing System 15 Trigger Box Monitoring System Actions Area Start/continue logging button Click to return to the Main Window after setting the channel configuration. Stop logging button Stops logging on the selected channel, but continues to link the data file to that channel. Disconnect data file from channel button After stopping logging the channel, click this button to disconnect the data file. Once disconnected, it is safe to access the data file from an application other than TBM. Exit – discard any changes button Click to discard any changes that have been made. Add comment button Opens the Add Comment to Data File Window. Edit line button Opens the Edit Existing Event Window so that the currently selected grid line can be edited Insert line button Opens the Edit New Event Window then inserts a new line before the currently selected line in the gird. Delete line button Asks for confirmation then deletes the currently selected line from the grid. Move up, Move down buttons Moves the currently selected line in the grid up or down. Cleanup button Opens the Cleanup Data File Window. Export data button Copies the time to failure currently displayed in the grid to the clipboard, then showing the Export data window. Analyze data Opens the Analyze Data Window. The times to failure are collected from the grid and sent for analysis. If the Include breaks not yet occurred check box is checked, the data will include breaks yet to come as censored data. Trigger Box Monitoring System 16 Static Fatigue Testing System Edit Existing Event Window This dialog permits you construct a new line for the data grid – it only permits creating valid events. The data/time for the event can be selected or edited and a message can be added. Edit New Event Window This dialog permits you to edit a line from the data grid. This might be used to add a comment to a line or to modify the date/time or comment out a spurious break event without actually deleting it. Add Comment to Data File Window A comment can be added to the grid either at the top of the grid (e.g. to provide a title or testing information) or at the bottom of the grid (e.g. to add a comment on how many specimens are remaining.) The date/time associated with the comment is the current date/time. There are two types of comment – “*” comments are kept with the data, for example if it is to be analyzed or exported. “;” comments are stripped out before analysis or exporting. Static Fatigue Testing System 17 Trigger Box Monitoring System Cleanup Data File Window The data files can get cluttered. This window permits various classes of none-critical items to be stripped out for the data file. Note that break events, “=”, and experiment start time, “S”, events can not be removed in this manner. However, they can be removed by explicitly deleting the line. Export Data Window The data shown are exported to the clipboard. All “*” comments are preserved and a comment is prepended to the data indicating the units of the data. The results can be pasted directly into a graphing program (Such as the Fiber Sigma Data Analysis Plugins for SigmaPlot) or a spreadsheet for further analysis. Trigger Box Monitoring System 18 Static Fatigue Testing System Analyze Data Window The time to failure data in the data grid are shown in the left side of the window (and may include censored data for break events that have not yet happened). The right side shows the results of various statistical analyses of the data. Either the input data or the output of the analysis or both can be copied to the clipboard for export. Static Fatigue Testing System 19 Trigger Box Monitoring System Four-Channel Trigger Box Introduction The Four-Channel Trigger Box contains four independent general purpose amplifier and trigger level detection circuits. While they may be used for general analog voltage level detection they are designed specifically for acoustic detection, and in particular, the detection of failure of optical fibers under load in long duration fatigue tests especially the static two-point bend test (Reference 2). Each channel consists of an amplifier stage incorporating a band pass filter, a comparator stage, a monostable pulse generator and interfaces for communication with external equipment. The two-point bend system for determining fiber strength, also available from Fiber Sigma, contains a single channel identical to those in the four channel trigger box. Much of this manual also applies to that single channel. Operation Power Supply Requirements Power is supplied via a rear panel 2.1 mm jack socket. The plug should have a positive center polarity (the internal circuitry is protected from the application of reverse polarity). The supply should be nominally 12 V, 250 mA unregulated DC and is most conveniently supplied by the supplied wall transformer that plugs directly into the AC supply. The wall transformers for international customers are “universal” (can accept input AC voltage in the range of 100 to 240 V and 50 to 60 Hz) and “multiplug” (includes interchangeable plugs for a range of different AC sockets from around the world). Specifications: nominal minimum absolute maximum 12 V @ 250 mA 7V 16 V Exceeding the absolute maximum supply voltage will result in permanent damage to the unit. Input The analog signal input for each channel is via the front panel BNC socket labeled input. The input impedance is approximately 10 k and is capacitively decoupled. The acoustic transducer or other analog input should be connected here. Avoid connecting the metallic parts of the acoustic sensor to any other equipment that might apply large voltages to the trigger box input. Sensitivity The potentiometer labeled sens may be used to adjust the sensitivity or the threshold level for triggering (break event detection). Turning the control clockwise increases the sensitivity until at full rotation continual triggering occurs. Transducers with a resonance in the 100 kHz to 1 MHz range are best suited for use with this apparatus and are available from Fiber Sigma (part number AE-R15). Output The trigger output is available via the front panel BNC sockets labeled outputs and A, B, C and D. A TTL high level pulse indicates a trigger event has occurred. The red LED reflects the status of this output. The output is non-retriggerable so that events occurring while the output is high are ignored (this prevents multiple triggering from a single intense input signal). Four Channel Trigger Box 20 Static Fatigue Testing System Latched Output The amber LED indicates that an event has been detected since the last reset. The LED may be reset by pressing the button labeled reset. Multiplexed Outputs Multiplexed outputs from the four channels are available from three front panel BNC sockets on the right of the unit below the power input socket. Each normally has an output impedance of 10 k and sits at a DC voltage of 2½ V. Positive and negative voltage swings indicate which channel detected an event: B-A: A 2 V positive pulse indicates an event on channel B; a negative pulse an event on channel A. D-C: A 2 V positive pulse indicates an event on channel D; a negative pulse an event on channel C. 2D+C-B-2A: A 2 V positive pulse indicates an event on channel D, a 1 V positive pulse an event on channel C, A 1 V negative pulse an event on channel B and a 2 V negative pulse an event on channel A. These outputs are designed for connection to an analog chart recorder. Since the output pulses are short (typically 100 ms) the recorder will operate in ballistic mode and the output pulse will produce a “blip” on the chart. The size and direction of the blips indicate the channel on which the event occurred. For a chart recorder with left-to-right pen motion a left going pulse indicates a left channel (when viewing the front panel of the trigger box) and the larger the pulse the further left the channel. For example a large right hand blip on the chart from the 2D+C-B-2A output indicates channel D, the rightmost channel. If the DC voltage appearing on the multiplexed outputs cannot be offset by the chart recorder it may be removed by capacitive decoupling by internal capacitors. See the section Internal Adjustments for further information. Note that a continuous monitoring chart recorder is required. Some multichannel recorders sample their inputs in succession and may miss pulses. Acoustic Telltale The trigger box is fitted with a buzzer that beeps each time an event is detected. The duration of the beep is the same as the duration of the output pulse for the corresponding channel. As shipped, a beep is given for events occurring on all four channels. However, beeps can be disabled for selected channels. To change the channel selection first remove the top of the cabinet by removing four screws. A bank of four DIP switches should be visible on the power supply board. When a switch is in the “OPEN” position, beeps are disabled for the corresponding channel. Switch 1 controls channel A, switch 2 channel B, switch 3 channel C and switch 4 channel D. Computer Interface The trigger box is fitted with a digital interface suitable for connection to a computer. The signals are available via a Canon D25 female connector on the rear panel. Note that ALL signals use NEGATIVE logic levels, i.e. they are at TTL low when asserted (true). Interface Pin-out pin signal 1 LA LA..LD are latched outputs 2 PA PA..PD are pulsed outputs 3 LB 4 PB Static Fatigue Testing System 21 Four Channel Trigger Box 5 LC 6 PC 7 LD 8 PD 9 RD 10 RC 11 RB 12 RA 13 5 VDC 14-23 Reserved 24 Shield 25 Ground RA..RD are reset inputs Pulsed Outputs, PA..PD These lines are TTL outputs that reflect the status of the corresponding front panel red LED, i.e. when active (TTL low) an event is currently triggering on that channel. For improved noise immunity these lines should be pulled up to 5 V by 5 k resistors at the computer. Latched Outputs, LA..LD These lines are TTL outputs that reflect the status of the corresponding front panel amber LED, i.e. when active (TTL low) an event has occurred since the last reset on that channel. For improved noise immunity these lines should be pulled up to 5 V by 5 k resistors at the computer. Reset Inputs, RA..RD These lines are TTL inputs that when asserted (pulled to TTL low) reset the corresponding channel's latch. Pulling the line low is equivalent to pressing the front panel reset button. These lines are pulled to +5 V internally via 4.7 k resistors for improved noise immunity and the external device must be capable of pulling them low against this load. The reset inputs may be hard wired together in order to reset all channels simultaneously from one control line. 5 VDC This line makes available the 5 VDC internal regulated power supply for driving small external circuits. No more than 50 mA or so should be drawn in order to avoid degrading the performance of the trigger box. Internal Adjustments The buzzer that sounds when a break is detected can be turned on or off for each channel. By default the buzzer is turned on for all channels. The rear panel has an access hole. A hooked rod can be inserted to adjust a four-way toggle switch. Pull the switch tab outwards to disable the buzzer for the corresponding channel, push in the tab to enable the buzzer. There are internal adjustments that can be made, but they should not normally be made without consulting Fiber Sigma. For your reference, these are the adjustments: Output pulse duration Gain control Four Channel Trigger Box 22 Static Fatigue Testing System Sensitivity zero position DC Decoupling the Multiplexed Outputs Trouble Shooting In any acoustic detection system there is a trade off between sensitivity to the events to be detected and susceptibility to extraneous noise (both acoustic and electrical). Here are some hints that may help if you are having difficulty detecting weak signals: Spurious Pulses Spurious trigger pulses may come from several sources: Excessive noise on input power supply. Make sure the 12V DC power supply is relatively clean with respect to high frequency noise and transients. Move all power cables as far away as possible from the unit. Check for sensitivity to high power equipment being switched on and off nearby and either screen from it or avoid its use. Inductive pickup from unused channels. Set the sensitivity of unused channels to a minimum (fully anti clockwise). Short unused inputs to ground. Cable noise and microphonic pickup. Flexing cables connected to the inputs may generate enough electrical noise to trigger the sensitive circuitry of this unit. Wiggle cables to detect this problem. Only use high quality cables and protect them from casual disturbance. Some acoustic sensors - including the AE-R15 sensors sold by Fiber Sigma, have a case which is connected to the ground of the trigger box. Avoid making electrical contact between the sensors and any other equipment which might put large voltages on the trigger box ground Missed Trigger Events In any acoustic detection system a lack of sensitivity is usually due to excessive loss in the acoustic path rather than in the electronics. Place the acoustic transducer as close as possible to the acoustic source. Make sure the transducer makes good mechanical contact - a flat faced transducer should always be fixed to a flat surface! Always use an acoustic coupling jelly - vacuum grease or Vaseline will do in a pinch. Minimize the number of interfaces in the acoustic path. Acoustic coupling is best through liquids and solids but if coupling through a gas is essential then sensitivity may be improved by replacing the transducer by a small capacitive microphone. However, spurious sounds may then become a problem - talk quietly! (Radio Shack sells a small tie-pin microphone with amplifier that works well in this application, part number 33-1063.) Multiple Triggers from One Event If the signal from an event continues for longer than the output pulse duration then the event may cause multiple triggering. Decreasing the sensitivity might help but increasing the output pulse length will definitely help (see the section “Internal Adjustments”). If you are still having difficulties or have any comments about this document or any other matter please do not hesitate to contact John Matthewson. Static Fatigue Testing System 23 Four Channel Trigger Box Precision Bore Tubes Two examples of precision bore tubes and a fiber insertion tool. Warning: The end of the tubes by the label is as-cut and so has very sharp edges which are potentially dangerous. Precision bore tubes are supplied (by default) cut into 150 mm lengths. One end of the tube has a label showing an identifying number of the tube and the internal diameter (ID) in microns. The ends of the tubes are not the same. The end by the label is in the as-cut condition with sharp edges. This is so that the internal diameter can be accurately measured at that end either to identify the tube if it has lost its label, or to check the indicated diameter. The end opposite to the label is flame polished to remove the sharp edges. Fibers should be inserted at this end, but the flame polishing will affect the diameter so this end should not be used to measure the tube ID. Fibers are inserted by bending a short length (about 10 to 25 mm long, depending on the tube ID) into a loop and pushing the loop into the flame polished end. The system is supplied with some wood sticks that have a notch filed into both ends. The stick is used to catch the notch on the loop of fiber so the fiber can be pushed into the tube. Slowly twisting the stick rotates the plane of the fiber to help with alignment with other fibers already in the tube. The fibers should be spaced a few mm apart – the separation should be roughly the tube ID or perhaps a little closer. It is suggested that fibers are inserted in groups of 5 with an extra large gap between each group – this greatly helps counting the fibers during an experiment. Up to 30 fibers or even more can be inserted into a 150 mm tube. Sensor Attachment Issues For best performance of the system the acoustic signal reaching the sensor should be maximized so that the sensitivity of the four-channel trigger box can be minimized, hence maximizing noise immunity. There are several sources of signal degradation in the acoustic path between the breaking fiber and the sensor. The most important signal loss occurs at interfaces where reflection losses occur. In contrast geometric attenuation and absorption losses are minor. The distance between the fiber and the sensor has a minor effect – the number and nature of interfaces in the acoustic path dominates. Reflection losses at an interface depend on the acoustic impedance mismatch – acoustic coupling between solids liquids is reasonably good, while interfaces into and out of air/gas is have poor coupling and so their number should be minimized. Therefore an air gap between the mounting surface and the sensitive face of the sensor (the which ceramic disc) is undesirable. If the sensor is to be attached to a rough or uneven surface, grease or acoustic jelly should be spread on the sensor face before attachment. Petroleum jelly is a suitable coupling medium. Precision Bore Tubes 24 Static Fatigue Testing System Sensor Attachment for Liquid Test Environments Warning: The acoustic sensor must not be immersed in water or any other liquid environment. The acoustic sensor must be attached to the outside of the vessel containing the liquid with the white ceramic face of the sensor against the container. Various attachment methods can be used. One I have found useful is to have a chain – one end is attached to a spring, while the other end of the spring has as open hook. The chain is passed around the container and the spring is hooked onto the other end of the chain under tension. The sensor is then slipped underneath the chain and the spring tension holds the sensor in contact with the surface. A flat surface is best and I have found glass “battery jars” inexpensive and useful. A transparent container is helpful since the progress of experiments can be monitored. The liquid in the container can be held at constant temperature using an immersion heater. The precision bore tube can be immersed directly in the container or inside a tube with the desired test environment which is then immersed in the container. Acoustic coupling between the fibers and the sensor is extremely good in a liquid, so the sensor does not need to be close to the fibers. However, only one measurement can be made in one container of liquid since all attached sensors will pick up all breaks occurring in the container. Sensor Attachment for Air or Gas Test Environments If testing in air, the acoustic sensor should be directly attached to the side of the precision bore tube. Fiber Sigma can supply optional assemblies for do this as shown below: The sensor is slid into a tube with a spring under it. The spring is attached to a think acrylic spacer plate, primarily to stop the spring scratching the sensor. Two different sizes are springs are available – a shorter spring should be used for thicker tubes, a longer spring for thinner tubes. Extra spacer discs are supplied to adjust the position of the sensor. The sensor is pressed down against the spring and the precision bore tube is inserted through the holes in the tube as shown below. The sensor is then released and pressed to the side of the tube by the spring. Hold the assembly up to the light and check that the tube makes a line contact across the entire face of the sensor. Tube/sensor assemblies should be kept separate from each other – it would be best if they were laid on a foam mat. The sensor case is connected to the ground of the electronics so a static discharge could Static Fatigue Testing System 25 References cause spurious break events on any of the trigger boxes. dissipative. The foam mat should therefore be static Warning: The sensor assemblies should be placed on a grounded static dissipative soft foam mat to avoid acoustic coupling between tubes and to avoid static discharges in dry weather. Users should ground themselves on the mat before touching any part of the system. Static discharges can result in spurious data. Standard Test Methods The Fiber Sigma Static Fatigue Testing System is guaranteed to be fully compliant with the IEC 60793-1-33 standard. The system is also compliant with draft TIA/EIA documents that have, as yet, remain unpublished. If you are using other standard test procedures, please let us know so we can guarantee compliance. Calculation of Failure Stress The peak strain in the surface of the bent fiber is given by: 1.198 df D dc (3) Where d f is the diameter of the glass in the fiber, dc is the outer diameter of the fiber coating and D is the internal diameter of the precision bore tube (Reference 3). The stress is calculated from the strain via the Young’s modulus, E. However, the Young’s modulus of silica is non-linear – it depends on the strain: E E0 (1 ) E0 (1 ) . (4) E0 is the young’s modulus in the limit of zero strain and a value of 72 GPa is usually used. is the large strain correction term. For simple tensile testing the accepted value is 3. However, in two-point flexure, the dependence of modulus on strain varies across the section of the fiber. As a result, the neutral axis shifts and the peak stress in bending is a little different. For bending, the corrected value of is 2.125 not 3 (Reference 5). Consult a standard test procedure for more information. Calculation of the Stress Corrosion Parameter, n Equation (1) shows that a graph of ln t f versus ln a should be a straight line of slope n . n can therefore be simply determined by using an Excel spreadsheet to graph the time-to-failure data vs. stress for several different tube sizes. n can be determined from the slope of the trend line. A better analysis is to install the Data Analysis Tool Pack into Excel (not normally installed by default) and then selecting Tools/Regression analysis. This provides a detailed description of the ln t f vs. ln a behavior and includes an estimate of the error in n. Consult a standard test procedure for recommended methods for data analysis. Precision Bore Tubes 26 Static Fatigue Testing System References 1. Mechanical Properties of Ceramics: Second Edition by J. B. Wachtman, W. R. Cannon & M. J. Matthewson (2009), John Wiley & Sons, New York. ISBN-10: 0-471-73581-6, ISBN-13: 978-0471-73581-6. 2. M. J. Matthewson & C. R. Kurkjian (1987) “Static fatigue of optical fibers in bending” J. Am. Ceram. Soc., 70 [9] 662-668. 3. M. J. Matthewson, C. R. Kurkjian & S. T. Gulati (1986) “Strength measurement of optical fibers in bending” J. Am. Ceram. Soc. 69 (11) 815-821. 4. CEI/IEC International Standard 60793-1-33 (2001) “Optical fibres – Part 1-33: Measurement methods and test procedures – Stress corrosion susceptibility” IEC, Geneva, Switzerland. 5. W. Griffioen (1992) “Effect of nonlinear elasticity on measured fatigue data and lifetime estimations of optical fibers” J. Am. Ceram. Soc. 75 [10] 2692-2696. TBM for Windows Change History 0.02 Beta release. 0.03 First release. Static Fatigue Testing System 27 References