1
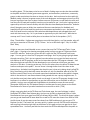
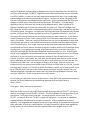
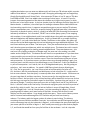
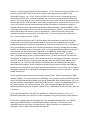
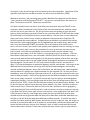
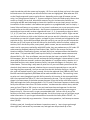
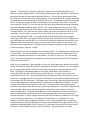
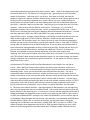
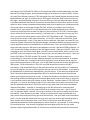
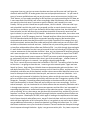
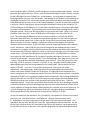
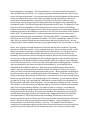
Transcript for "TRI Web-based Tools: What's New and Emerging" Webinar
So without delay I’d like to give a brief introduction. I’m Kelley Ann Lovelace. I know I’ve met
several of you before. I’d like to welcome everyone to this Webinar entitled "TRI Web-based
Tools: What’s New and Emerging." We have six presenters, hopefully, who will speak to you
today over the next few hours and their bios can be found on the chemicalright2know.org web
site. Given our time limitations we will only be taking two questions per presenter and I would
ask you to submit your questions in writing. And you should have an area on your screen,
which allows you to do so. And these questions will come directly to me and then I will give
them to each appropriate presenter to answer. If we have time at the end of the Webinar
we’ll open things up for additional questions. If there were additional questions we were
unable to answer during the Webinar, we’re going to have a frequently asked questions bank
set up on our web site to address these remaining questions. And this information should be
up within the next few weeks. Since this is our first public TRI Webinar, your feedback is very
important and much appreciated. So please take some time to provide some basic feedback at
the end of this Webinar via an e-mail that will be sent to you when the Webinar is over. We are
especially interested in listening to your thoughts on any future Webinar topics because we
plan to have another one in late spring 2010. I should also note that this Webinar will be
recorded and will be available at our website again www.chemicalright2know.org. And we
anticipate that this will be up hopefully by mid December.
I’d now like to introduce Mike Petruska, Director of the Toxics Release Inventory Program at
EPA headquarters. He would like to make brief remarks before we begin. (2:05)
Thanks Kelley.
Thanks Mike.
Yes, I know some of you probably from the TRI conferences we’ve done over the years and
what we’re doing today is a Webinar that’s entitled TRI Web-based tools: What’s New and
Emerging. And I just since some of you are probably very well versed in TRI, but some of you
may not be let me just give a few words of background here. This project of the promotion of
the TRI data and tools is a joint effort between EPA and ECOS under a cooperative agreement
that EPA funds. And under that cooperative agreement we do a national training conference
and that’s been done in the past annually. We’ve now moved it to an 18-month cycle so there
will be a conference coming up in fall of 2010. And there’s also a website that many of you may
have seen it’s called www.chemicalright2know.org that is again part of the EPA-ECOS
project. And then we have the Webinars that we’re doing which were intended to kind of fill in
between the in person conferences. And especially since we’ve gone to the 18-month schedule
we felt we could schedule two Webinars in between the conferences and cover some of the
similar topics that we’ve covered in our in person conferences. So today and we will have
another one coming up in spring. And if you have thoughts on what would be useful topics for
the spring Webinar, you can go to chemicalright2know.org and you can also contact Kelley Ann
at ECOS or Christine Arcari at EPA. So just a brief intro here on the tool sets that we’re going to
be talking about. TRI has always tried to sort of lead in finding ways to make the data available
to the public and that includes government agencies, and researchers, and others, community
groups, trade associations that have an interest in the data. And so what we’ve done with this
Webinar today is that we’ve gotten some of the tool developers and managers primarily at EPA,
but you’re going to hear from at least I believe one non-EPA person, to talk about the tools and
how they can be used and hopefully how they can be useful to you. And it also is going to be an
opportunity to kind of interact directly with the folks who have developed these tools. And also
there’ll be again some as Kelley Ann mentioned there are mechanisms for feedback and
hopefully this will kind of make the tools more transparent and useful to you. And also let you
hear first hand from the technical folks who have developed these and managed them and
work with them every day. So it’s you know an opportunity to pick their brain. With that let
me stop and I’ll turn it back to Kelley Ann to introduce the first of the speakers. (5:17)
Okay. Thanks Mike. I believe we are going to start with Kara Koehrn, our first speaker, who will
give you an overview of TRI tools. (5:27) I’m here. You’re at Bill’s desk right? Yea, I’m at Bill’s
desk. Okay.
Alright so everyone should be able to see a screen that says Get TRI Data and Tools. I hope
that’s right. I’m going to be showing everybody today how you can get to TRI data and tools
from EPA’s web site. And so just to start off this is again the Get TRI Data and Tools home
page. You can get to it from the TRI program home page. And I’m just going to go right down
through everything. This is just as a general overview where you can get the latest news and
information on the TRI program as well as the latest data that the TRI program released. And
then also the three tools that EPA has developed to sort of analyze and do your own data
analysis on TRI data. So starting at the top, this first link takes you to the latest TRI data that we
have out and open to the public. You can access it through these three links down at the
bottom here. And what’s exciting about the data this year is that we’re doing what’s called TRI
Early Data Sharing, which basically means that after our July first deadline when all of the TRI
facilities turned in their forms, we turned around and released the data to the public in August,
which is the earliest it’s ever been released. And granted this was a pretty rough data set. It
only had the most basic data quality checks run through it, but the TRI program thought it was
important in an effort for transparency to get that information out to the public as early as
possible. And our more refined and analyzed data is scheduled to come out next month
[December 2009] with the TRI National Analysis. And that was formerly known as the Public
Data Release for those of you who have been out around for a while. (7:38)
Alright, now going back to the TRI Data and Tools home page, the next link down is called
Download TRI’s Public Data Release data. And you can go there to download PDRs or Public
Data Releases from years past from 2007 all the way back to 1996. The third link down is where
you can go and download TRI state data files as well as TRI state fact sheets from 1996 to 2001.
And for those of you who want state fact sheets from 2002 and beyond, you can go to TRI
Explorer for that. The fourth link, just very quickly, is where you can find TRI source reduction
and recycling information right here at the bottom of this page and you can get that in Excel
spreadsheet form. And lastly we find the three tools that EPA has developed for the public to
analyze TRI data and these are going to be gone into in further depth later on in this Webinar,
but just a quick overview, TRI.NET is a high performance data machine that you can download
from EPA’s website. It caters to the more experienced and technical user. It can handle large
queries and generate very complex trends for analysis. And you can access it by going to this
link and scrolling down to this download the application. And so you download that onto your
desktop and work with it from there. And the next tool is TRI Explorer. It’s a web-based
application that’s a little more user friendly for the beginner users. And it includes a TRI
Explorer tutorial for the first time users that you’ll find right here. And this is straight from
EPA’s web site. You don’t have to download anything onto your desktop. And the last tool that
I’ll be talking about, Envirofacts, is actually one of the first tools that EPA developed for TRI data
analysis. It includes both TRI data and data from other EPA database collections. And if you
click on the link, you can see that you can search through air, water, waste, etc. If you want to
search TRI data go to Toxics. And it comes up with one of the most simple interfaces that we
have in Envirofacts. There are a variety of interfaces that you can use depending on what kind
of experience you have as a user and what kind of query you want and what kind of data you
want out of that query. So it ranges from some of the most simple interfaces like this Toxics
interface and the Form R Reports interface to the most complex which is this Customized Query
interface And I’m not going to go through all of them because they have been around for a
while, but I will highlight the Form R&A Download interface because it is new. And what you
can do here is aggregate information based on your inputs from directly from the Form Rs and
the Form As. So you can specify your inputs here and search Form Rs and Form As by for
instance city name, county name, etc. And then you can specify your outputs as well and see
exactly what data you want from the Form R or the Form A. And as you can see there are a lot
of options to choose from. I do not suggest clicking on all of those. And then at the very
bottom here you can choose to have your output in either an HTML Table or a CSV file. And the
last thing that I’ll touch in or I’ll touch on within Envirofacts is within any of these queries, if you
go to TRI e-FDR that’ll take you to the Facility Locator tool which has been around, but I just
wanted to highlight it because that’s where our Early Data Sharing 2008 data is housed. And
with that, Kelley Ann, I’ll take any questions from the listeners.
I’m not seeing any questions come in at the moment. Okay, well if you anyone has questions at
the end, feel free to add those to the additional questions and we’ll take a look at
them. (12:20).
Okay, great. Okay, thank you so much Kara.
With that I’d like to turn it over to Bill Smith who will be doing a demo of TRI.NET. (12:29) OK I
want to run through the tool TRI.NET a little bit. The URL to download is on the bottom if you
can see that. I will come back to that later. Let me get on with the tool now. This is it
TRI.NET. Let me get rid of this. TRI.NET is a desk top application. It’s focused on capabilities
needed to analyze TRI data and its strength is in analysis. It has a powerful ad hoc query
capability. It is integrated with mapping systems for maps mashup, it has powerful context drill
down with undo, it has a very rapid response, it is highly interactive, and has large capabilities
for big queries. It has innovations like auto update of data over the web. It has my TRI
neighborhood where you can enter an address and it will show you TRI releases within a certain
radius of that address. It is integrated with web 2.0 mapping technology such as Google Map,
Google Earth and Microsoft Virtual Earth. It has extensive TRI data. It has 21 years of TRI data
from 1988 to 2008. Plus it has added value consisting of other layers. It has an EJ layer for
instance for answering questions like where the releases are in high minority areas, or which
facilities are in low income areas. It also has a border layer for looking at facilities along the USMexico border. In addition, it has tribal layer for looking at releases within tribal buffer areas.
And something new this time, it supports metropolitan areas so you can analyze TRI releases
within a metropolitan area. It also has, as well as having TRI pounds-base data, it has hazard
Data which is pounds X toxicity, which is a little bit of what RSEI [Risk Screening Environmental
Indicators] would have. So in a nutshell, TRI.NET has an ad hoc query system, it has mapping
with mashups, it has neighborhoods, and it has multiple layers along with auto updating on the
web and integration with desktop applications. So let’s go ahead and try a couple of queries,
run through it. Let’s talk a little about the Toolbar. The button on the toolbar, this globe, will
take you out to the Web supporting this tool and allowing you to get additional data sets. The
tool comes with one year of data – the latest year. Then you can download up to 21 data sets
and it also has some trend data sets, which are multiple years. This button here with a search
on it is a magnifying glass is for looking around neighborhoods. These two buttons are – this
one here is for mapping a selection of Google maps, the next one is for sending it to a KML
reader such as Google Earth. This button here will send it to a spreadsheet so if you have done
a query analysis you can send it to a spreadsheet and share it with your colleagues. Or you
could send it to the browser for a browser report. These last three buttons allow you to open
and save queries. So if you have a query you do not have to go through building it again, you
could just save it and the next time you would want to use it load that. So let’s go ahead and
try one of these queries. Let’s look at, let’s do a TRI Neighborhood query. We are getting an
echo here. Let’s enter an address. I’ve typed in 1600 Pennsylvania Avenue, Washington,
DC. Click ‘Go’ to geo-code it. Let’s say I want to look at facilities within five miles of it. I say
OK. And then I will click on build query and build query to look at facilities ID. I might want to
look at some releases. Run that query. It comes up down here with 10 records. So what we can
do now is tag them all and then map them. So you can see [on the map] these are the ten
facilities it found. And you click on any of these and they will be identified. And you can click on
this link to go out to get an Envirofacts report for that facility. Another thing you can do is….so
that was to Google….I could just have easily sent this to Google Earth, but let’s try MS Virtual
Earth. I will take a look at this first facility. Virtual earth map gives you a nice bird’s eye view of
that facility, which is useful. See, you can look at facilities in terms of Google Map, Virtual
Earth, or Google Earth. Let’s do a simple query. Let’s do something by Industry. Go to the
grouping and pick Industry and I want counts of facilities…show me the facilities in each
Industry and the total releases. So go ahead and do that query. These are the industry names
and for instance food and beverage has 1575 facilities and you could sort these by
releases. The industry with the largest number of release is metal mining. The industry
containing the most facilities would be Chemicals. You could also use this filtering and say give
me the same query but only the industries in Region 1, so this subsets the query and shows you
just counts specific to facilities in Region 1. And I could just as easily go to that and say Region
1, 2, and 3 and that would be for a query for facilities in the northeast. Let’s do a zip code
analysis. Let’s do counts in there and some releases. So, for instance, if I sort on facilities, this
tells me that Zip code 77507 has the most facilities reporting and zip code 99752. And
something I forgot is…no…it’s ok. So let’s do 2008…let’s look at trend. I’m going to go to zip
code and also look at year, counts and releases and I will use the trend file and see what that
gives us. So we can now do one of several things. Also want to tell it that I’m interested in two
just two years, 2007, 2008 and then I want to do a change analysis. And this will tell me if I click
on this, this column has the absolute change and the next column is the percent change. If I
wanted to find out which zip code had the greatest absolute change it would be 89820 … that
has the greatest change. You can also say I am only interested in mercury. I want to look at that
and do that analysis for mercury, mercury compounds. It looks like the same facility has
maximum change for mercury from ’07 to ’08 as well. I do not know how much time I have
left. I have not kept track of it. (23:03)
OK, how much time do I have left? You know what, you have about ten questions that have
come in and I am trying to keep up with them all. So if you are at a good point to stop Bill, I
would like to give you a couple of these questions if you do not mind? Sure, Yes. I just want to
say to the attendees out there that I’m getting all questions in and I’m writing the ones down
that Bill can’t possibly answer in this time frame, so I’m just going take probably the top twp or
three and the rest we will put on our FAQ Bank on our Web Site, so we will get to your
answers. So the first question is does TRI.Net have a Federal Facility Layer? Yes it does. It
does… go ahead and go to that…click on Federal Facility. Click on that and just run the query
with respect to Federal Facilities. Like if we were to click on a new query of Seattle…I only want
to look at Federal Facilities…and show me how many there are and the total releases and it
would tell me. So it says that 340 Federal Facilities and the total release from those guys is
about 500 million pounds. And if I wanted to see who they are and I could do name-address
and there they are and you can tag them all and map whichever ones you want, you can look at
the highest releasing ones, tag those by sliding this up and down, and then map them. Ok, that
should answer that.
Ok, let me get another one here because there are quit a few. Should I have access to 2008
data for TRI.NET? Currently, we have only 2007 data. No, currently we just have 2007 data out
there. But 2008 data will be available next month [December] after the data release. OK. And
the next question is what platform does the TRI.NET run on? It runs on all Window platforms, it
will run on the Mac, on a virtual machine….like I have an Apple MacBook Pro and I have
Windows installed in a virtual machine. Matter of fact, I developed TRI.NET on a Mac, and I run
it on a Mac.
Ok, so the next question is TRI .NET only available on a Microsoft Platform? Yes. It is a
Microsoft application, but it will run on other hardware as long as they have a virtual machine.
Ok, ok and I’m going to take this last question since we zipped through those. Can TRI.NET
query map multiple facilities in a defined watershed or river basin? At one time I had
watershed layer on there, but I no longer have it. When I had that, you could query by
watershed. I don’t know if that answers the question.
Ok, alright, I know we did not get to all the questions since we started late. I appreciate all the
questions, and those that we did not answer, we will post on our Web Site. (26:38)
Without further ado, I will pass things over to Mort Wakeland from Region 6 who will discuss
"Uses, Successes, and Perspective of TRI.NET." Just give me a second to pass the controls to
Mort. Thank you so much Bill. Thanks you are welcome.
OK, what I wanted to start out with is to let folks know that when they load TRI.NET on the
computer…what it should look is they’ll have a little icon that looks like this, and that is what
you will click on for your short cut. OK, let’s go back to here and go back to here and what I
want to show is basically an example of how to use a particular part of TRI.NET and that is what
Bill mentioned is to find facilities around a certain address. Like you have a certain address of
either your home, friend’s home, a facility or whatever and you wanted to find all the TRI
facilities around that certain address. So again what you would do is you would click the icon
that looks like a little magnifying glass for my neighborhood, but another thing I want to add
too is once you download TRI.NET, periodically click on this button which looks like the
earth…click on it to see if you need to have updates, and I updated mine this morning, so it says
software is current, data is current, but sometimes it comes up and says you have so many
items to load. Just make sure periodically you check and make sure your software and
information is up to date. Ok in this instance, I’m just going to type in an address … 601 East
8th St down in Deerpark Texas. I am interested in facilities within five miles of that location. I
want to know what latitude and longitude is of this particular address, and so when you hit go,
you will notice down here it has geo-coded latitude and longitude and these are referred to as
decimal degrees. You will notice it is 29.7 and a bunch of digits minus 95. and a bunch of
digits. This is decimal degrees as opposed to degrees, minutes, and seconds. You can go on the
Web and find converters where you can go back and forth between degrees, minutes and
seconds and decimal degrees. Notice the United States, we will always have a west longitude
and that means it is going to be a negative number for the longitude. Ok. So once you stick in
the address, once you go and get a geo-code, and say Ok. And now what you want to do is you
want to build your query. I have not yet figured out yet the difference between the up and the
down arrow, either one works. So just click on one and if you are going to be thinking about
mapping the facilities, if you are going to map the facilities, then you always want to pick out
what we call the TRIFID – that’s the Toxic Release Inventory Facility Identification Number. And
for the first part we will just say we want the name, address, city, state. And then we want to
make sure we stay in Texas so we want to click on the filter, we want to click on geography,
scroll down and pick Texas, and then up here, under the ad hoc, we want to make sure we stay
in the Deer Park vicinity, so we type in lower case city then = then single quote, and then in ALL
CAPS the name of the city, close single quote and if you want to determine what all these
variable could be simply go under data and then look at Meta Data, and under Meta Data you
will find on the left hand side what these different variables could be. It could be zip code; it
could be just about anything. Well anyway, we have our city, we’ve got our state, we’ve got our
location so now what we want to do is we want to run that query and we see up here we have
several facilities and note, they are all in Deerpark. Now, in order to map these facilities we
have to select them, because if I went here and just did map, notice it says no rows selected
mark the selection with the mouse and try again. OK. So to mark all these, up here in the upper
left hand corner click that and you will notice all the rows are highlighted. Now when we click
on the Google maps and I want to point this out…depending on the type of browser you are
using…I am using Internet Explorer 7. If you are using that, notice this little security button that
comes up. Simply click on that, allow block contents, say yes. And we notice facilities are
coming up and Will was kind enough to insert this crosshair so we can simply zoom in and the
intersection of that crosshair is the address we typed in to my neighborhood, and I’m simply… I
have a little scroll button on my mouse, so I can zoom in and zoom out or you can use the zoom
in and out bar on the left hand side here. And if you are interested in what the facilities is,
eventually we hope to add, we have a legend over here 1, 2, 3, 4, eventually we hope to add 1,
2, 3, 4, 5, 6, over here, so we can visually see at one time which facility is which. Right now we
can click on a link here or click on the little icon and you can see this is Valvoline, we can click up
here and we can see this is Vopak Logistics, and again it gives a latitude and a longitude for that
particular facility. And as Will mentioned, what you can do is you can click on this link and that
will take you (if it will come up) that will take you to that facility within Envirofacts, and we can
see here, this is the facility name, county name, public contact, we can see what the NAICS
code is and in case you are unfamiliar with NAICS codes, they are predecessors to SIC codes. SIC
codes meaning Standard Industrial Classification Code. NAICS is the acronym for North
American Industry Classification System, and each facility has a unique number that identifies
what it does. This particular NAICS code says this facility is a hazardous waste treatment and
disposal facility. OK. If we scroll down, note too that we also have a tool within TRI called
Enviromapper. We can click on this tool and map the facility and again it shows where it is and
what other facilities are around it, and over here whether it is multiple activity, whether it is a
Superfund fund site, toxic release inventory facility, haz water discharges, air emissions, and
hazard waste. The one thing I really want to point out is if you scroll down you will see all the
chemicals they have ever reported, whether they are currently reported them or not and for
how long they have reported. And you can see here that this particular facility or I will say
site…and I will explain myself in just a second…this site has reported from 1998 thru 2007 and
like Will mentioned apparently 2008 data will be made available shortly. The one thing I want
to point out is even though we have this facility name for this location in that one would think
that it has reported from ’98 to ’07, that is not necessarily the case. The only thing Envirofacts
shows is the latest name of the latest operator because in fact this facility could have come in
2005 and bought the facility that operated in ’04, ’03, and ’02 and now it appears to be the only
facility that has been there since ’98. So be cautious. Just because that name is there, and the
years go from 07 back to ’98, it may or may not have been the actual operator for that time
period. So basically that is it. You can move this around any place you like so you can get a
better view of it. You can scroll in to get a more detailed view. You can click on any of the
facilities to find their names, latitude and longitude. You click on here to go to Envirofacts to get
other information. Or you can get information on here with this facility within TRI NET. So
Kelley Ann that is basically my presentation. If there are any questions, I will attempt to answer
them. (39:58)
OK Mort, great job. Actually we had about six questions come in. I am trying to go through
them right now, and we will try to answer two, and again we will put these up on the
website. First question is, does this application let you use rural route addresses, or P.O.
Boxes, or country highway roads? I would have to defer that to Will, because he is actually the
gentleman who was kind enough to generate this for us. I’m sure it may take some of those,
but some I am not sure about rural route numbers. The next question is do I need to download
any applications to take advantage of all the TRI.NET tools …for example Virtual Earth or Google
Earth? No you do not. All you need is the browser to see the maps. Any others? Is there a
user manual for TRI.NET? It is on the web site. Will and I are collaborating on doing something
about the mapping capabilities within TRI NET. Ok, I think we have time for one more. After
entering the query do the map icons that are shown reflect all TRI reporting facilities even they
no longer Report? If so, does the user have to select and go into Envirofacts to see if it is still
reporting? I ran this report, if you can still see my screen, I ran this report and I ran it for
facilities that reported in 2008. Conceivably, there could be facilities that have stopped
reporting in 2006, 2005, that will not show up here because I limited this search to 2008. Now I
can come down here and use 2007, or I can come all the way to the bottom and use 2001, thru
2008 and map all those facilities. You can use the multi-year file; it will pick up all years. OK
Does that answer the question? If not have, then have them re-submit and we will address it
on the home page. OK great. (43:05)
Thank you very much Mort and thank you for stepping in Bill. I’m now going to turn things over
to Steve Witkin. Just lost Steve Witkin. Give me a minute every body. For some reason, I’m
unable to change the presentation to Steve Witkin. For that, I’m very sorry. He’s not coming
up as a presenter and giving me the capability to have you see his presentation so we might be
able to come back to him.
Andy, are you standing by? We are going to skip to you. Andy Opperman, New Jersey who will
discuss his experience with TRI Tools and I apologize for the echo in advance. OK, I am ready to
go. I’m appreciative to EPA and ECOS for this opportunity to give a state perspective on TRI
Tools. TRI being an unfunded program for the states, while there is a fair amount of
partnership with the states, these tools are really important. So I want to give you a state
perspective on what I use. You have heard from the presenters previous to me about many of
these tools. My biggest use falls in the area of TRI Explorer, which unfortunately we did not get
to hear about yet, and Envirofacts. I will breeze over a few things. My primary applications are
from a state perspective in tracking annual TRI submissions for New Jersey facilities. Currently,
we have about 450 facilities reporting in the state. Tracking facilities reporting trends and
compliance and comparisons with the state reporting requirements — any facility subject to TRI
must complete a New Jersey release and pollution prevention report which is a materials
accounting approach. So we go beyond release, on-site management and off-site transfer of
waste to include what comes into the facility from the beginning of the year and goes out
through December 31. What a facility starts the year with in inventory, produces on site, brings
on site, consumes in processes, or incorporates in the product if it is shipped as or in the
product and all the waste management activities. So it is very important from a compliance
perspective that we keep all TRI facilities in compliance with New Jersey requirements as well. I
have been just dabbling with TRI.NET recently. So, I really don’t have much to say other that it
looks like it can be a useful tool for us here in the future. You heard earlier it is a data
assessment and analysis tool generating ad hoc queries, maps. I look to the opportunity to put
this tool to work for us. TRI Explorer is a really great tool. I generally focus in on the facility
aspect of the options. I will show you if I can do this. Over here on the left, we have the
options of reports for chemical facilities, federal facility, trends, etc. and I like the general use of
facility part of it (something happened to my screen). But in any case, I usually choose the
facility option, the release reports, and then skipping down from the United States when you
can chose … looks like it went to my last slide. I am going to try to recover from this. Give me a
moment. I seem to be at the last slide for some reason. Here we go. So, in this area of
geographic location, I like to select the state. Here is an example of a facility issue …I have a
facility here in the state that was formerly Wheaton Glass that became Gerresheimer. I noticed
that they reported in 2004, then 2007, then 2008. Every year we do an annual facility
reconciliation project. So when I started looking at this facility I noticed they did not report on
2006, at least under that TRI FAC ID Number. And then I found out they were somehow
assigned a new TRI ID number when I ran a report for that zip code. So under the geographic
location you can pick the United States, you can pick a specific state, or a zip code. So I picked
the zip code and found out that we had a facility here. It has now been corrected because of
some information sharing between us here in New Jersey and EPA. But we had this facility, as
you can see on the left Gerresheimer, and they had a different TRI fact ID. So these tools
become very valuable in trying to identify the facility in the state that I expect to be
reporting and I have spent the better part of my career here in this state, 21 years now working
with TRI Facilities in New Jersey that are required to report. So, the names change, the owners
change, companies come into business, go out of business. So you spend a lot of time trying to
keep track of who is who.
And particularly TRI Explorer and EnviroFacts Warehouse is very helpful. You can look at
trends. What I did here is look at total releases, the release report and then rank them in
trends for the state. This is a simple example showing the total air emissions and the others in
descending order. So we can see how these have compared over the years. You saw a
presentation about Envirofacts and this is another tool that comes in really handy…within a
matter of minutes or so you can have the results. We were shown by Kara that you can use the
toxic icon. I generally go to the left there in what I call the table of contents. I use the query
maps and reports button and quickly go down to that toxic release inventory section, hit TRI EZ
(easy) query, and in the EZ (easy) query there are three easy steps to generate your search. I
look at some issues very frequently… Step 1, Step 2 is to pick a few fields I am interested
in. This helps me to identify facilities… again getting back to Gerresheimer, you put beginning
with, you put the zip code and pick a couple of fields. I like to rank them by reporting year and
by the chemical in the reporting year…it is a nice sort for me to see the data and you see kind of
hidden underneath the drop down of the zip code it says reporting year 2005 so I get a report…
no 2005, but a 2006 and 2007, and again, this is been corrected data…you can see this was run
on September 18 on the upper left hand corner, that was after I communicated with EPA about
the two different TRI fact IDs, so I make a quick switch, use the back button, change the
reporting year to 2004 and I see that there is a 2004, 2006, 2007, but there is no 2005. That
makes us wonder what happened to the facility in 2005 and we are looking it to that. It also
assists us in identifying facilities that may submit their TRI Reports under a different facility
name than we have them registered here in New Jersey. The top little picture on that slide
shows facility reported as Victory Refrigeration under TRI. In New Jersey we know them as
Glenwed Victory Inc. So with the TRI ID No and other information, particularly physical location
information, it helped us to figure out who the facility is that should be reporting. Particularly
challenging sometimes with Federal facilities because of the long names they provide. Here is
US Army Headquarters Fort Dix but if you look…the middle section of the TRI ID No has SRMY
for United States Army and the H from beginning of Headquarters. To the lower left you see a
facility same first five characters and the same last five characters in the TRI Facility ID but it
says VPRTM and that is from the Department of the Military I believe. I think Ft Dix has two
separate reports as a partial facility. So I am not sure. I discovered this the other day when I
was preparing this presentation. So I’m not sure exactly what the story is, but when I looked in
EnviroFacts there was no results in the search for that 08640VPRTM5417A TRI fact ID No so
that is another follow-up for compliance issues. So let me see is there one more prior. No. So
that’s it for me, I find these tools to be very valuable in helping to determine exactly who the
facilities are who should be reporting for us each year. That is it Kelly. (57:31)
Ok, we have a few questions come in I think we have time for…only a couple of minutes
for. We are going to have Steve Witkin come up after you so sorry about that everybody but
we had a couple of technical difficulties. So the question for you is…I see that TRI Explorer
describes the data with a title. I would like to know if TRI.NET shows the same description as a
header after building and running a query? Thank you. I’d have to turn that question over to
Bill. Yeah, that is what I thought. Not a main user yet of TRI.NET. No. Not on the grid sheet,
but you can send it to a browser, it will give you a title, not as detailed as TRI Explorer but
usually enough. Ok, and I think this is for you again Bill, where can I download TRI.NET? Do we
have someone that can send them a link by email? Steve Witkin a way to get to all of these
tools is to go to www.epa.gov/tri and the middle of that page there is a tab for data tools. And
you can get to the whole sweet of TRI tools from that page. OK, and one last question and
anyone can jump because I see I have all my panelists on the line. Can you give an example
how the regulated community (i.e., industry community) can use these tools in a useable
manner? This is John Scalera and I will be talking about TRI-CHIP in a few minutes I guess. One
of the things of concern of releases or adverse affects where industry could pull information on
level effects, the concentrations and adverse effects associated with them, that may be
valuable information to the industry. Kelly Ann this is Mort. One thing facilities could do that
are in particular SIC or NAICS codes is to in sure they are reporting correct, they could canvass
all the other facilities that report to TRI under their same SIC or NAICS Code and see what
chemicals they report for. Granted it could be different processes going on at facilities but they
could get sort of a ball park of what other facilities are reporting for, and they could go whoops
maybe we are using this chemical above threshold and we have not reported for it and,
therefore, if they do discover that, they could use the EPA audit policy to self-disclose that
violation and therefore save their facility a lot of money and penalties. OK thank you
Mort. (1:01:42)
With that I’ve changed the presentation over to Steve. Steve this you right now TRI Explorer I
see on my screen. That’s correct. Are you ready to rock and roll? Ready to go. Thanks Steve.
Ok, TRI Explorer over the past year we were able to get some funding to rebuild a lot of the
back end and cleanup the software in the back to make it run more efficiently. Along the way,
we were able to benefit from some of the software enhancements of the underlying software,
and bring these enhancements up to the user interface. Now what you will notice on the left is
what we call the enhanced TRI Explorer and on the right what Explorer looks as it exists today.
The main difference is the look and feel with and without the enhancements is virtually the
same. Someone who is experienced with Explorer today will have no problem with using the
enhanced version. What the enhanced version does is it lets us get to the data much quicker
and actually we get to more of the data, which has always existed but has been buried for users
that were not fully experienced with using the software. Now currently we still have one more
administrative hurdle until we make the enhanced version of Explorer public. And we expect
that unfortunately it can be anytime between tomorrow to maybe next month. But it is down
the road in the near term. I will periodically be working the same item through the enhanced
and the existing. One of the features that the enhanced version has is on a report…. I will
generate a chemical report for both versions. Currently the first column in all the TRI reports,
except for facility, is just a data column. In the enhanced version, the first column is always
going to be a linkable, drill-down column. The drill down will always go…I should say in most
cases…will always go to the facility report. We have a new report that has a slight exception to
that. When you drill down, it will retain all the parameters. So in this chemical report, I will
click on the chemical and it will drill down to a facility report just with that chemical. In the past,
you would have to identify a chemical …it might be one of the top ten…you would then have to
run an entirely new report to find out which facilities released that material. Now if you do that
it is a one-step process. Another new feature we have which is at a direct request of our
regional compatriots is a facility report or regional report I mean. If you do geography report,
we have two new options. We can now do an option of the entire US by region, or the entire
US by zip code. When we go US by region, that will give us a report …actually, let me pick a
chemical too. Right now this is running on a different server. I’ll pick a chemical report. It came
up. I’ll do lead and lead compounds. I’m doing a report by EPA Region for 2007 since that is
the latest data we have out there. Now this report is lead/lead compound by Region. If I drill
down through the Region, Region 3, will then give me the report for lead/lead compound by
Regions, 2007, just for the states within Region 3. I will continue to drill down to MD, my home
state, and it will then take me to a facility report just for lead/lead compounds for 2007. And if
I do an industry selection, it will keep those parameters throughout the entire drill down
process.
Another new feature we have is the Federal Facility Report. Again, to make life interesting…I’ll
keep in for all of US to be easier… I generated a report for all Federal facilities and in the past
the Federal Facility Report was a fairly dry report that did not allow drill down to which facilities
were in these Agencies. Now, these are all linkable items. Clicking on TVA will now give me a
facility report just as in a facility report. In the past, one could do it, but it was like pulling nails
trying to get this detail. Now we have made it a fairly easy, straightforward report. Another
change that we’ve made, and I’ll pick facilities again…there is actually two changes have been
made to speed things up, unfortunately you’re look at a live site on our development server,
and we are still making changes as we are talking. In the past when you have resorted a
column…any time you resort a column it would only resort the data which was present on the
screen at the time, so if you wanted to sort all the facilities for total on-site releases, you had to
display all 21…let me go back because we are not seeing 2008 data yet…it shows that the 2008
data we are debugging with our software now. You would have to display all 2775 facilities and
this is different than what you would pull up now because this has the updated corrections over
the past year. You would display in order to do a valid sort. Right now this screen is showing
the top 100 facilities but if I do a sort, lowest to highest, the reason I am doing lowest to highest
is the lowest will be 0 to 8. We now go back to the entire data base doing a sort, so when we
sort it is a much more valid and quicker way of sorting. The other feature we had last week
actually, and somehow it got undone, instead of displaying the top 100 facilities we are going to
display the top 10 facilities. And in any of the extensively long reports, we are only going to
display the top ten facilities. And you will have the option to make it the top 20, top 15, top
5. We are trying to let you, the user, customize what they see on the screen. It also will give
you a complete table on the screen at one time, and if I sort all facilities for federal releases, I
just get an easier number and totals will be what I see, which makes it a much cleaner
report. And you may want just a report of these facilities. In order to make it nicer to present a
report, all the TRI Explorer options now have new report capabilities. We have PDF option, Rich
Text Option, and we have a spreadsheet option that goes to Excel. So if I click PDFs, it will give
you a Web View I can save as a PDF file. So here is that Web Report I can now output to a PDF
File. I can also save it as a Rich Test file depending on the software you have on your machine,
it will load up with what ever you want it to. Our machines have Word, so it loads up as a word
document. I can now save this as a Word document, I can add to it, modify it, whatever I would
like to do with it. And by given the option of selecting the top 10, 15 you can create near
finished products directly from the Explorer Web Site. Let me go back to some of the other
pages to show you some of the fun things we have done. OK another item we have done is
tucked more information into reports people were already used to seeing. But more data is
there now. I am picking places at random in all honesty. So, I cannot say exactly what I’m going
to see, but I should be able to display for you. Anytime you do a facility report at the zip code
or county level, you get the facility name plus the chemical name. See what we have
today. Florida, Brevard County. What we have added to this report on the right is what we
have today. On the left is the enhanced version which will be out in the near term. We have
added the county name to the report. In the past we did not have this. This will make it much
easier. In several other reports, the county name is in the facility report now. Another item we
have added in this line right here. After the chemical name, we have added the industry code
that TRI Explorer uses for any analyses which is done on TRI Explorer when you do industry
reports. In the past, we gave you this information, but not at this point at time. Where this
comes in handy is when there are TRIFIDs which are multi-facilities. Multi-facility locations are
where a single company can report under multi-industry codes. It does not happen a lot but it
does happen, and this will help explain when you see the same chemical listed twice for s single
company. Another important piece of data we have brought up to the surface a little higher is
the codes that a facility reports plus the codes that TRI Explorer uses for the analyses. Again,
going down into the TRI Explorer most of the options have been there, but not used always
used very much. The facility Profile Report in a lot of ways is one of the most powerful reports
in TRI Explorer. Unfortunately, it has not been used to the extent it should be used. We can
forget what is on the right; what we did today in the current Explorer is we give you this
information just highlighted. We let you see the full NAICS or the full NAICS codes of the
facility. We never gave this industry sector code that TRI Explorer uses. It was buried in the
downloaded reports. Today this is what you get. You get this first part. What we are giving you
in the enhanced version is what the facility reported and what TRI Explorer is using for the
analysis. For this facility it is fairly simple. Some facilities report under multiple codes and all
their codes will be listed and one or more multiple industry codes Explorer maybe using during
analyses. I think that wraps up what we have done to Explorer. Some of the numbers of TRI
Reports with the enhanced version – most of files are smaller in size that are being delivered to
the desk top. You will not see this as a feature so much but you will notice it in response
time. In the past, a typical facility report file was 180 kilobytes of data delivered to the
desktop. The enhanced version, they are down 70 K bites. So we have cut the size of the file
brought to the desktop, down by a 1/3. If you do a facility report with every option you can,
we’ve actually reduced the load to the desk top to a quarter to what it was in the past. That
doesn’t mean the response time is 4 times faster but response time typically will be quicker. I
will entertain any questions you may have now. (1:19:56)
Thanks Steve. I do not see any specific questions come in….there was one comment. Just a
note that it would be very helpful to sort this information by watershed. As a State
environmental Agency we use this type of data frequently for watershed
analysis. Unfortunately, watershed is not that we have currently, but that is something we can
consider as an option for geography to break out.
Ok, if there are no other questions for Steve, I’m going to turn it over to John Scalera who will
be doing a demonstration of TRI-CHIP (Toxic Release Inventory-Chemical Hazard Information
Profiles). John, just give me a few minutes to change presenters and you should be good to go.
This is a tool we have developed. It is a tool a little different from the others in that this tool
gives you information like what is so bad about these particular chemicals that these industries
are releasing. Really the first step in identifying a risk, is identifying and understanding the
hazards associated with these chemicals. So what we have done with TRI-CHIP (Toxic Release
Inventory-Chemical Hazard Information Profiles System) is we’ve collected information across
multiple sources, many government entities, on the hazards of these chemicals and looked at
the critical effects…those effects that occur at the lowest exposure to these chemicals and we
have put them into a data base with built-in queries. And there are a lot of features so let me
get started. First of all, we do have a documentation and tutorial to TRI-CHIP and I can click
right there and again TRI-CHIP is based upon a Microsoft Access Platform and it is based upon
2003 or 2007, and it is my understanding, unfortunately I have not been able to test it, because
all my machines have micro-soft access at those modes, but if you do not have Microsoft Access
it will look for the 2007 freeware if you have Internet Access and download the free-ware
automatically so you can play around with TRI-CHIP. Now there is an overview, and again in the
documentation I want to go to the overview real quick and just indicate we have IRIS
Information on TRI-CHIP – Integrated Risk Information System — and we have pesticide
information from their registration and re-registration program documents, ATSDR information,
information from California EPA, Office of Environmental Health Hazards Assessment, we have
National Toxicology Program, and International Agency for Research on Cancer (IARC), and our
very own Toxic Releases Inventory (TRI) information from the Federal Register Notices we have
generated over the years in reference to the TRI Program chemicals. Now I want to exit out of
this page, I am being blocked over here, so let me click over there and keep that open. Besides
in the documentation and tutorials if you want to know about the information sources in more
detail, we have a rather comprehensive document over here to support you, including tutorials
with screen shots on how to get through TRI-CHIP, and we try to make it user friendly as
possible. So let’s get started. If I hit this button over here, Search by Source (that is the first
screen that comes up) here we have the Search by Source Option in TRI-CHIP. Is there anyway
we can minimize this screen over here Kelly? I will work thru it. But here at the very top, first
of all, you select the source of data…here’s IRIS or OPP. The default is IRIS. These fields over
here, up top are unique to IRIS type information. If I hit OPP, it has some similar fields. These
are toxicity parameters. In fact, if you want to find out what this…like what is an acute RFD, we
have user friendly information like reference dosage, estimate to the daily oral exposure to the
human population and it has the definition of reference dose. This is just a facilitating tool on
these particular acronyms. Bill came by and helped me on that. We have ATSDR inhalations. As
I click, these fields change according to the information source. If we go to the NTP. What you
are going to see in the visual screen again is the NPT cancer classifications, which is also true of
your IARC, and so to change to view, these view screens, you can change the sources. Now I am
back to IRIS. Within TRI-CHIP we have 716 records. These are chemicals or chemical
compounds or in some cases we have added an example of a chemical compound. If I wanted
to look at IRIS Data only…records that have IRIS information…some of these records may not
have information particular to IRIS at all. Just hit IRIS Data Only and that actually that gives me
308 records. Of the information in TRI-CHIP, only 308 records are relevant to the IRIS
information. Now these fields being in Microsoft Access they are all sortable, so if I wanted to
sort by CAS number, you just click on top there and you can sort by CAS number. If you want to
go alphabetically or numerically alphabetically, you click up top. If you want to precipitate like
what is the lowest observed averaged effect level of a chemical and you want to precipitate
lowest to the highest you just click on that. It is very user friendly in that feature where you can
start pulling out data and finding which chemicals again people may be more toxic or may have
a very sensitive toxicity end point relative to other chemicals. Another feature in TRI-CHIP here
real quick, is if I click on the chemical itself, that is a hot button and it takes me instantly to the
web link associated with data in TRI-CHIP as well as a few other web links like the Hazardous
Substance Data Bank. Example, if I wanted to go to the IRIS information associated with
arsenic, immediately I go into the arsenic IRIS write-up summary on arsenic. And if I close it
out, I’m right back where I started. So I can go in and out of the web very readily and pull that
information. These buttons on the side… say you are interested in silver and selenium only,
then you hit select and you will only get silver and selenium. And you’ll look at the information
there. Got this good old reset button her to go reset any time I want to get everything back in.
Now, another set of information here…you’ll notice in this section here we can set up
quantitative parameters toxicity parameters for these chemicals. An example, if we are looking
for a reference dose …the amount of mg/kg per day according to IRIS that you can intake
without a observing an adverse effect in a human over a lifetime and you want the values that
are greater than one, you just can enter the value one there and hit enter and it will give the
chemicals with the RFD’s of intake greater than one and precipitate them out. So you have all
types of screens available there and you can do screens across various sources. And this is an
"and" button, so if you apply something for IRIS and then you apply something for OPP data set
it must meet both criteria and it will screen accordingly. Now I have done a reset over here. You
can search by chemical name if you want a specific chemical, and it actually has a user
friendly…like say you don’t know how to spell toluene, I think it should. I have not tried it yet
and misspelled it and hit that, and it says yes would you like to match chemical name, would
you like to try variations, and I hit yes and well it did not help me that close, but it does give me
some toluenes, but this will allow you to precipitate chemicals of interest by name here and
type in toluene, or you can do it by CAS number. And what we also have here, let me do a reset
here real quick, is the TRI category chemical. Example beryllium. What chemicals do we have in
TRI-CHIP associated with the beryllium compounds reporting category. We have beryllium
compounds and we also have beryllium which is not really a member of the category but very
directly associated, we have beryllium oxide and beryllium sulfate and you can see that in IRIS
we have no information on these two here. I believe the only source that gave us information
on beryllium oxide and beryllium sulfate was California EPA. I can click through those and again
if I want further information on that I can go here and hit the hot link and go Cal EPA and it has
a cancer assessment of that particular chemical. Now, say I am interested in beryllium selection
and I want to export this… one feature we are working in TRI-CHIP here to export into TRI.NET.
Here I have beryllium and I want to export to TRI.NET you come up with this page and can hit
go, and actually will do a little demo later when I get to the second page… another feature of
TRI-CHIP which I will get to in a second. I am going to close this page out.&n
bsp; This is a search by source screen that is available in TRI-CHIP. I am talking a little fast here
to save time. I am going to close that out. I want to go to the second option. Again we have
Search by Source. And I told you a little bit about our documentation and tutorials here. Let’s
talk about Search by Effect. This screen comes up and it is Search by Effect, and has cancer as
the default, and these are all the chemicals and the various sources who identified cancer as an
issue for these particular chemicals. Now lets pick, we have non-cancer oral inhalation. Let’s
say if we are just interested in inhalation. By the way, when we hit the non-cancer effects we
get a set of effects that are available to check by and these are the 17categories, actually ATSDR
categories. Examples, if something affects body weight as the adverse effect or affects your
heart (cardiovascular) or dermal, these will pop up and we can screen accordingly. So let us
take an example… say I am interested in non-cancer effects that are caused by inhalation and it
is through acute exposure – very short term acute exposure and the effect I am interested in is
something that gives me an endocrine disruption of my endocrine system. Actually, I did not
pull up anything, let’s try there we go, we get these four chemicals here, and that is for chronic
exposure…not acute, but long term exposure through inhalation something that will effect our
endocrine system. Based upon TRI-CHIP, which again is looking at the exposures to the lowest
level of these chemicals what effects occur, we get 5 chemicals here and I can print this report
which will be a duplication of this information here or I can go back to my source search where I
can get additional information on these five chemicals by clicking this button here. So, I click
that button and there are my five chemicals of interest. These are endocrine disrupters through
chronic exposure through inhalation. Again, I can get more toxicity info. Say I want a report on
these chemicals. Well in TRI-CHIP, you hit the reports, you get multiple report options. You can
generate this in Microsoft Excel. There is a lot of information hidden in Excel. Literally, it would
be like 1000 pages for those 5 chemicals. So user beware. You may want to customize your
Excel page before you print it out. By the way, I was looking at the TRI data in IRIS coming up as
default but if you want OPP information you can select these individually and take those off,
those fields you do not want to see in the Excel spreadsheet. If you do not have Microsoft Excel
it will print it out in a text format. But one thing we developed to make it user friendly in TRICHIP are Chemical Profile Reports. So if I click chemical profile reports, I am going to get a page
per chemical front and back… front end page non-cancer effects, back end page cancer. Here is
hydrogen cyanide. Here is the IRIS information for non-cancer oral intake. Here is non-cancer
inhalation intake from IRIS. Here is ATSDR, here is OPP and here you have Cal EPA info
here. This whole page is dedicated to the non-cancerous effects, it will tell you NOAELs
benchmark dose level here, the species the experiment was done on, and it will also give you
again experimental values here. It gives you the critical effects here that were observed for
these chemicals. In this case, hydrogen-cyanide was affecting body weight, an endocrine
disrupter and also neurotoxin. If I go to the back end of this page I get whether there was any
cancer assessment. And as you can see, none of the agencies we worked with did a cancer
assessment for hydrogen-cyanide, probably because the creatures died before they could do it.
So how about ethyl benzene…again non-cancer on the front of the page, and on the back of the
profile cancer. And again IRIS classification for ethyl-benzene… not classifiable as to human
carcinogenicity. IARC classification 2B, the agent is possible carcinogenic to humans. So there
are your profile reports. Very user friendly. Front and back page. Back page cancer, front non
– cancer. One page front and back, dedicated to each chemical. Those are your profiles. One
last thing, I’d like to show you real quick in TRI-CHIP is, say I wanted to find out where these
endocrine disrupters that are being released in the United States. We are working on this
export to TRI.NET. Let’s see if I can get that working here. And it gives you a little
explanation… this segway page. And if the chemicals are reported like say it was barium
sulfate, well barium sulfate is under the TRI program, it is reported as the compound class –
barium compounds. So if it was barium sulfate, that’s the TRI-CHIP record selected. It would be
exported to TRI.NET as the compound category barium compounds. We hit the go button here,
and that will enter me into TRI.NET and let me do a sort here and get chemicals outputs above
100,000 pounds per year and that is this group here and let me hit this here. I’ll do this
mapping real quick. I think I have to hit allow block content, say yes, and I should get mapping
so these should be the facilities releasing those chemicals that we’ve identified, at least from a
critical endpoint as having the hazard endocrine effect for inhalation over chronic exposure. So
I just ran through very quickly the utilization of this tool, and again we have consolidated a
significant amount of information and are in the process of QAing. (1:37:08)
So are you ready for a few questions. Yes, I’m ready for a few questions. Almost at the end of
your time limit. You did a fantastic, really great job. We have three questions come
in. Hopefully we can zip through them so we get back to Bill and wrap everything up. First
question is that can they identify HPV chemicals. High production volume chemicals. No, we
do not have a field set up for HPV chemicals as part of the HPV program, nor do we have one
for the HAPs for the air, so we don’t have a specific designation for chemicals associated with
various programs in the Agency. Ok, second question is, I may have missed this but where
does the health data come from? Is it industry reporting the health hazard data? Most of the
data is not industry generated. It is my understanding the International Agency for Research on
Cancer, the support from that is from industry and precipitating information on the cancer
classification of these chemicals. Otherwise, this is EPA here, the Office of Research and
Development; they do some of the best reports basically in the world on the Integrated Risk
Information System. The Office of Pesticides EPA generates the OPP data. The Agency for Toxic
Substances for Disease Registry, Cal EPA State government entity, the National Toxicology
Program and our own TRI program and our own in house assessment for chemicals generally in
response to petitions or the additions of chemicals to the TRI from the initiation of the program
back in 1987. Any other questions? I think we may have time for one more. Someone is
making a comment that says the link between TRI-CHIP and TRI.NET is an excellent addition –
when, and how is TRI-CHIP is available to the public. TRI-CHIP is undergoing a robust QC of the
data. We’ve just about finished the data review and we are doing a system review. We are
hoping maybe in the next 30 days having it in pretty good shape to put out the public. (1:39:46)
Great. And I’m going to change presenters to Bill Smith who will talk to us about TRI mobile
applications. Give me a second. OK can everyone hear me? Yes we can hear you Bill. At EPA
there is an initiative to put the EPA applications up on mobile devices. Of course we want to
put TRI applications up on mobile devices. We want to put it on the iPhone as well as the
blackberry. We want them to have coverage for the other devices such as non-smart phones
etc. that are not iPhones and blackberries. So initially the application we are coming up with is
something that is TRI based and we are calling it MyRTK, which is my right to know. And right
now there are three versions. One for the web, which will handle all mobile phones. The other
one is a native app for the iPhone and native for the blackberry. So this MyRTK will be
developed on three different platforms. Right now we are making progress with the web
mobile. We have a working version of that up and we are testing out. And we are trying to
make it as close to a native looking application as we can get. We put together a prototype for
the iPhone as well. And this is what bit will look like. This prototype. This is the interface. This
button on the upper left would be the GPS button. If you were to click on that, it would display
facilities at your GPS location. The magnifying glass is for searching. You can enter an address,
zip code etc. lat long, and it will send you a map and do a search and fill the map with all the
facilities within a few miles of the map center. On the lower part would be the map. The next
one is details. If you click on that you will get a table or a list of all the facilities you see on the
map. These map pins stand for facilities. If you were to click on a map pin, you would get a
balloon that would that would tell you about that and then there would be a call-out so you
could get content for that facility. The next button would be for settings where you could for
instance define what type of facility you wanted to see. Maybe you wanted to see facilities
with high releases or TRI facilities because we are showing TRI facilities as well as major
facilities that do not report to TRI but are still very big. The other one would be the information
button. But let me show you prototype we have put together. I have a Powerpoint. I have
demonstrated this on the iPhone simulator. So let me…. Ok, Mobile TRI on the iPhone. I
actually put this application together on the iPhone. You would click the icon and it would start
up and show you the facilities at the GPS location since this is for a iPhone it will have GPS
capability. Initially, we were thinking of splitting the icons based on color according to some
scheme, it could be facility type, or it could be high releases, low releases. If you click on the
information button, it would show you a little bit about the application and more on how to use
it. The map legend, we go over that. If you were to click on a facility name it gives you a
balloon. You click on a call out. And that will give you context information – it compares to
other facilities nearby. Some context information and a breakdown of releases by media. It
also has chemical release and some cancer and non-cancer effects. It tells people a little bit
about how much chemical is released. Whether it is cancer or non-cancer. Also some
compliance data. Is the facility in compliance with the different Acts of EPA. Clean Air Act,
Clean Water Act, RCRA, TRI . And a little bit about compliance and non-compliance
information. It has search capability, by zip code, you can go to a traditional map. From
satellite to ordinary maps. Throw in some street information. Do a search on cities, addresses
and for instance this right here. What happened here was if I was to click list, I would get a list
of all the facilities. That is what this is. And it orders them by in the distance from map
center. Click on each one of these things and you get content of facility. You can search on
proper names like World Trade Center and it would find things like that, or information like
Love Canal. Anything that has been in the news or already geo-coded – you could find
information about it. And something on the… we are going to put in a facility to go out and get
EPA services link, for instance, it will bring up air quality within that map window and tell you
about it. That is pretty much it. We expect the mobile web, myRTK, will be done next month –
released to the public early next year. The I-Phone and Blackberry version are behind and
probably will be soon thereafter. At EPA we cannot release an application with one platform;
we have to develop it across platforms. So that is why we have three major platforms. Any
questions? (1:47:58) Yes several came through. I have a gentleman that asking the question
who would want to use this map? He is basically saying I can get this information from my
computer; who is this really for? This is for someone who is mobile, carries his cell phone
around and sees a facility where he is at or wants some information about it. Unless he wants
to carry around his laptop, a cell phone is a lot more convenient. Ok, there is another
question. Is the data only 2008 or all years? That’s a good question. Right now we will use
latest year of data. But it has not been decided upon yet. I know the latest year of data will be
there – probably by default. It could be that you could look at earlier years of data so it’s hasn’t
been entirely determined yet. And the last question is where do you get the compliance
information for these facilities? The compliance information is from OECA – the Office of
Enforcement Compliance and Assistance. They keep records of all compliance information and
if we go to OTIS has access to the database. You can gather the information fro OTIS and that’s
where we go it. Public information is available form OTIS and of course internally we use ISIS. I
like those stickpins Will; put those in TRI.NET. See if I can grab a couple more off of here if I
have a couple seconds. I think it is fantastic it’s going on my iPhone. Thanks. Another comment
for clarification, the mobile application is for a laptop? It can be used on a laptop, but is
primarily for a cell phone. The last question, the Air Quality Index does not show air quality
impacts; did you consider accessing NATA to look at air risks? There was a section on that page
that did present NATA data. And if you were to pan over, you could see that but this is juts a
screen shot, but that information is part of what I showed. (1:51:17)
Ok and I think I’m going to close it there because we are almost perfectly at 4:00 for the East
Coasters back here. And I know there are more comments coming in, but I’m going…I’m have
one question for Bill, this is John Scalera, just on TRI.NET. Bill, recall my memory, but isn’t there
a feature on TRI.NET where you can pull those chemicals we are working on into TRI-CHIP to get
their adverse effects associated with them. Yes, you can go both ways. So John showed you a
way to go from TRI-CHIP to TRI.NET, but in from TRI.NET, you can go to the other way to find
out information about chemicals that come up in a query in TRI.NET. Thank you.
Ok, there is one other quick question. It is from folks in NJ. It is a question for John regarding
TRI-CHIP. Given the various sources for toxic data, is there a schedule in place or plans for one
to update the data on any type of regular basis. Yes, I think we are looking at update of the
data between October and January on maybe a calendar year basis to crank out the update
effort, which won’t be significant given the amount of time required to update a chemical for a
new assessment for a chemical. So I think if we start in October, we will probably be able to
look at the database for any changes in values and revise that out in the calendar year –
January. (1:53:07)
Ok, since for a quick wrap up. Thanks to all the presenters. You’ve all done a fantastic job. I
know it was touch and go for the first 5-10 minutes as to whether we could get the presenters
up on the screen and connected to us all. And thank you to all the attendees for listening out
there. You asked some very good questions. And I just want to remind you that we didn’t get
to everyone’s questions because of the time limitations, so I’ve taken copious notes and we are
going to sort these all out, and get them answered for you and they will be posted on our web
site. Couple other very quick reminders. We will be hosting another TRI focused webinar this
coming spring, and we ask you to submit topics and suggestions for the spring webinar through
our web site and I just want to say the web site one more time because I know everyone has
mentioned in a lot in the last two hours. It is www.chemicalright2know.org. I also want to
remind everyone that a survey will be generated by an automated email within the next 24
hours on this webinar. Please take a few minutes to take this survey. There are only 5 quick
questions. We just want to know what you think. If you thought it was well worth your
time. Any areas for improvements. Any suggestions for future webinars. The last reminder is
that we did record this webinar and it will be posted on the chemical right to know web site
hopefully by early to mid December. So with that, I’d just like to again thank you all for
participating and I will now officially close out the webinar. Thank you. (1:55:07)