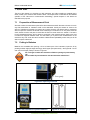
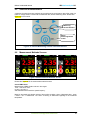
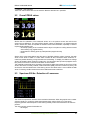
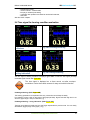
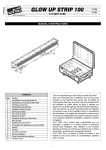
1
IRD Mechanalysis® Limited
Vibration Diagnostic SmartMeter
model IRD449
Operation & Maintenance Manual
V2.1 Mar12
IRD Mechanalysis® Limited
Customer Details
1/5, Marol Co-op Ind. Estate Ltd
Off. M. Vasanji Road, Marol
Andheri (E), Mumbai – 400 059
Date Purchased:
Tel: 91-22-2852 2906, Fax: 91-22-2852 1814
Email : [email protected]
Web. : www.irdmechanalysis.com
Organisation:
IRD Serial Number (s):
P.O. ref:
End User:
Next Calibration Due:
IRD Mechanalysis® Ltd
IRD449 VDSM O&M Manual
IRD Mechanalysis Limited
www.irdmechanalysis.com
IRD Mechanalysis® Limited continues to be the industry leading provider of
Condition Management Solutions. With 35 years’ experience in machinery vibration
and associated condition monitoring technologies, the company designs and
manufactures proven instrumentation suitable for rugged industrial environments. A
comprehensive range of products and services are available from the offices below.
Location
Address
Delhi
Sagar Deep, Plot No.11, LSC Saini Tel: +91-011-22373916
Fax: +91-011-22370778
Enclave, Vikas Marg,
Email: [email protected]
New Delhi 110092
Kolkata
153/A, 2nd Floor, VIP Road,
Kolkata 700 054
Contact Numbers
Tel: +91-033-23559214
Fax: +91-033-23559214
Email: [email protected]
Mumbai
1/5 Marol Co-op. Industrial Estate
Tel: +91-022-28522906
Ltd, Off. Mathuradas Vasanji Road,
Fax: +91-022-28521814
Marol, Andheri (East)
Email: [email protected]
Mumbai 400 059
Chennai
7-C Chesney Nilgiri Apartments
65, Commander-In-Chief Road
Chennai 600 105
1/5 Marol Co-op. Industrial Estate
National
Ltd.,Off. Mathuradas Vasanji
Service Centre
Road, Marol, Andheri (East),
& Works
Mumbai 400059
International
1/5 Marol Co-op. Industrial Estate
Ltd.,Off. Mathuradas Vasanji
Road, Marol, Andheri (East),
Mumbai 400059
Tel: +91-044-28230726
Fax: +91-044-28234702
Email: [email protected]
Tel: +91-022-28520178
Tel: +91-022-28596214/6573
Fax: +91=022-28521814
Email: [email protected]
Tel: +91-22-2852-0178
Fax: +91-22-2852-1814
[email protected]
[email protected]
condition management solutions
1
IRD Mechanalysis® Ltd
IRD449 VDSM O&M Manual
TABLE OF CONTENTS
Page Number
Getting you Started
1.
Why perform vibration diagnostics…………………………………………....4
2.
Why IRD449 Vibration Diagnostic SmartMeter?.........................................5
3.
3.1
3.2
3.3
3.4
3.5
3.6
3.7
3.8
3.9
3.10
3.11
Vibration Diagnostics - Basic Information…………………...……………...6
Introduction
Basic Rules
Machine and bearing condition diagnostics
Methods for ball bearing condition diagnostics
The relation between gears and ball bearings
Fault Source Identification and Diagnostics Tool
Measurement Points
The preparation of the measurement point
Listening to Vibrations Using Headphone
Relationship of Measuring in Acceleration and Speed
Abbreviations used in the guide
4.
4.1
What Will You Get with Your Instrument……………………………………11
Instrument and accessories
5.
Before You Start…………………………………………………………………12
6.
6.1
6.2
Standards for vibration measurements……………………………………..13
Setting Vibration Limits in IRD449 VDSM
Dominant Frequency
7.
7.1
7.2
7.3
7.4
7.5
7.6
7.7
7.8
7.9
7.10
7.11
Quick Start………………………………………………………………………..18
Preparation of Measurement Point
Putting in Batteries
Plugging in Vibration Sensor
Connectors - top panel
Vibration Measurements
Temperature measurement
Automatic detection of the machine speed
Evaluation of the machine and bearing conditions
Fault Source Identification and Diagnostics Tool
The Stroboscope
The Torch
8.
8.1
8.2
8.3
8.4
8.5
8.6
Instrument Operation…………………………………………………………...23
LIGHT
STROBO
VOLUME
SETUP
SPEED
ALARMS
condition management solutions
2
IRD Mechanalysis® Ltd
IRD449 VDSM O&M Manual
8.7
8.8
8.9
8.10
8.11
8.12
8.13
UNITS
ESC
Error Messages
Sensor connection Error
Display Value Overload
Input Overload Error
Measurement Error
9.
How to evaluate the failure…………………………………………………….35
9.1
9.2
9.3
9.4
9.5
9.6
Overall RMS values
Overall PEAK values
Spectrum 200 Hz– Detection of Looseness
Time signal for bearing condition evaluation
Vibrations in frequency bands – gearboxes/bearings
Fault Source Identification and Diagnostics
10.
Response Specification………………...………………………………………40
10.1
10.2
10.3
10.4
Vibration velocity measurement frequency response
Vibration acceleration measurement frequency response
Velocity measurement amplitude response
Acceleration measurement amplitude response
11.
Calibration …………………………………………………………………….....41
11.1
11.2
Calibration Procedure for IRD449 VDSM
Sensor Calibration
12.
Specifications…………………………………………………………………….44
12.1
12.2
IRD449 Specifications
IRD511 Sensor Specifications
Keeping you Going
13. SUPPORT SERVICES………....……………………………………………………48
13.1
13.2
13.3
13.4
Benefits and Features
Products supported
How the National Service Centre optimises clients’ investments
How to Get Service
Taking you Further
14. VIBRATION BASED CONDITION MONITORING SOLUTIONS…………….....52
condition management solutions
3
IRD449 VDSM O&M Manual
IRD Mechanalysis® Ltd
1. Why perform vibration diagnostics
Vibration diagnostic allows checking the condition of all your machinery. You will be informed early
about potential failure before the machine gets damaged and you will be able to order only real
specific required maintenance (instead of expensive overhauls). The periodical measurements will
allow you to keep your machines in good health.
condition management solutions
4
IRD449 VDSM O&M Manual
IRD Mechanalysis® Ltd
2. Why IRD449 Vibration Diagnostic SmartMeter (VDSM)?
You always ask before you make a decision to buy the new instruments what unit is the best for your
needs. Is it an instrument with a large amount of functions, including specialized software for data
processing (which you will not ever use), or is it an instrument which is easier to use and contains all
required functions? You should pay only for functions, which you will use in the field. The IRD449 is
just that instrument. The instrument uses standard external accelerometer with the magnetic base. It
enables correct repeatable measurements. You should not equate our unit with "vibration pens".
The IRD Mechanalysis model IRD449 is a multi-function portable meter that bridges the gap between
the basic and advanced FFT data collector/ analyser. It is a complete machine condition expert
system than gives results without the use of a computer or lap top. It is designed for the technician,
engineer and consultant who need to analyse a rotating machine on-site without investing and
carrying expensive instruments to site.
This single meter undertakes overall vibration measurement, three band spectrum, 200lines
spectrum, Time Wave Form, temperature, tacho for speed, strobe scope. In addition it incorporates a
handy inspection torch.
The IRD449 caters to ISO 10816-3 with expert rules covering machine health vibration levels: that
identify the prime machinery faults: Unbalance, Looseness and Alignment. An anti-friction bearing
health level indication is also incorporated. Many informative screens are available.
Do your machines work under optimum conditions? The IRD449 will:
- Determines the condition of your bearings, including slow-running ones.
- Identify insufficiently lubricated bearings.
- Indicates unbalance, looseness, misalignment.
- Check unbalance, alignment and loose foot
- Check machine speed by built-in stroboscope.
- Check machine temperature by Non-contact temperature meter.
- Measures in either Metric or English units.
Operation of IRD449 is easy to use. Colours green, orange and red display the status. Determination
of individual machine or bearings defect types is done directly during operation, without need of use
a computer or software. Despite the IRD449 is very compact and rugged, it is designed and fits in the
palm of a small hand. Nevertheless the IRD449 is big in performance.
The IRD449 is supplied complete set with an accelerometer, coiled cable, magnetic base, transit
case and earphones. You can connect earphones to listen to machinery noise related to vibration
and process. When measuring transmissions or slow-running bearings, you will quickly appreciate
the benefits of the earphone accessory.
condition management solutions
5
IRD449 VDSM O&M Manual
IRD Mechanalysis® Ltd
3. Vibration Diagnostics - Basic Information
3.1
Introduction
What is it the vibration diagnostics? This chapter explains the basic steps and you will be able to
begin practical measurements. More information you can find in the literature.
When we are talking about the vibration diagnostics, we mean regular measurements (usually every
2-4 weeks), whose objectives primarily are:
1. Finding of change of vibration level, it means change of machine operational condition.
2. Determining reason of this change.
3. Recommending maintenance (repair, adjustment, lubrication etc.).
4. Checking of maintenance success (including revision of dismantled part to confirm the analysis).
The machine vibration diagnostics solves two basic tasks:
1. Diagnostics of machine mechanical failure (imbalance, misalignment, mechanical looseness etc.).
2. Diagnostics of rolling bearing condition.
3.2
Basic Rules
1. If the measured value of vibration increases in time, it is a change indicator - worsening of
the machine condition.
2. If the measured values do not change, the machine works in stable operation condition.
This doesn’t necessarily mean good condition. For example if a bearing was installed incorrectly,
then there will be high signal value immediately. This value will remain stable for some time (the
bearing will be able to withstand it), but then there will be a fast increase and destruction of the
bearing. This short bearing life can take hours, days, weeks or even months.
3. Reliability of the diagnostics will never be 100%.
There will always be defects, which develop in time shorter than regular measurements. The defects
caused by material fatigue can develop in several seconds only (cracks, breaks). The proof of the
diagnostic performance is primarily a decrease in maintenance costs (not to absolute zero) and a
significant decrease in unexpected breakdowns (not their complete elimination).
4. Using of standards is possible only with special machines, for which the special standards
exist.
It is not possible to simply define limit vibration values in general for a wide range of machines.
However, it is possible to create the standards for special machines (e.g. turbines), and these
standards are a strong diagnostic tool. General standards have a character of recommendation on
how to define the limit values. The way how to find the good condition values is to use measured
values of new or repaired machine. Also you can ask the machine producer for them.
5. Shortening of an interval between measurements means more successful prevention of
unexpected failures.
3.3
Machine and bearing condition diagnostics
Basic defects which we’d like to find out are
- Unbalance (heavy spot on the rotor causes vibrations),
- Misalignment (machinery parts are not in alignment),
- Looseness (machine is not properly connected with its base - soft foot),
- bearing defect (wear of bearing, bad assembly, bad lubrication or overload).
condition management solutions
6
IRD449 VDSM O&M Manual
IRD Mechanalysis® Ltd
First three defects influence the whole machine (e.g. the vibration caused by unbalance we can take
from any point on the machine). We use the vibration velocity [mm/s] measurements for that.
Roller (ball) bearing condition we can detect only on the nearest point. This is the local failure. We
measure always vibration acceleration only [g].
3.4
Methods for ball bearing condition diagnostics
We can find out several methods for bearing condition detection in literature. We should repeat
again:
We have to measure vibration acceleration in [g] for correct data acquisition. All methods must
satisfy the conditions.
We can choose different procedures for evaluation of the acceleration signal. Measured signal can
be imagined as a level of the river. It flows with appropriate speed and there are little or big waves. If
we want to measure the stream we can measure the flow per hour or prompt wave's level. The value
of the flow will be stable and it will change slowly. But the wave's levels are unstable because
measurements have significant variety of values.
The similar effects occur for bearing condition measurements. You can measure RMS value (the
total energy in signal) or PEAK value (the highest peak in signal). We can use both types for
evaluation, just have to realize of advantages and disadvantages.
RMS measurement
- advantages
- disadvantages
PEAK measurement
- Advantages
- Disadvantages
- stable and well repeatable, time trends are well readable
- if wear increases the response is slower then PEAK, but sufficient for
maintenance.
- fast response for any condition change.
- not stable and well repeatable (extremely sensitive), time trends are not
well readable.
From these two basic measurements further measurements are derived:
- gENV
- envelope signal modulation. Advantages and disadvantages are in the
middle of RMS and PEAK measurements.
- gSE BCU, SEE, SPM - measurements are performed usually on the sensor resonance frequency.
These methods have the same advantages and disadvantages like the PEAK measurement.
3.5
The relation between gears and ball bearings
For gearboxes diagnose it is also necessary to measure acceleration signal like for ball bearings.
When the balls are rolling over the damage tracks (pitting), the shock pulses occur in signal.
Unfortunately similar shocks are also in signal from on worn or damaged gears. So if we measure
gearbox with roller bearings then higher vibration values can be caused by both sources.
More information for this kind of analysis you can find in chapter Vibrations in frequency range gearboxes/bearings.
3.6
Fault Source Identification and Diagnostics Tool
This tool is included in the IRD Mechanalysis IRD449 VDSM. It is good message for users, because
such function has never been built in the instrument in this price category. This function displays
several bar graphs with traffic light colours. Two major (largest) bars are allocated to general
machine condition (on the left side) and ball bearing condition (on the right side).
condition management solutions
7
IRD449 VDSM O&M Manual
IRD Mechanalysis® Ltd
The next three bars are located in the middle. They display the severity level of UNBALANCE,
LOOSENES and MISALIGNMENT (from the top).
3.7 Measurement Points
The measurement location must enable repeatable measurements under the same conditions as the
previous measurement. Also the direction of sensor (radial, axial for rotated machines) is important.
That is why you should determine measurement points on the machine. The typical machine
together with the measurement points are shown in Figure1.
Figure 1 Typical measurement points on a rotating machine
For the measurement in radial direction, we are going to place the sensor perpendicularly to the axis
of rotation, for axial measurement along the axis. The radial measurement can be usually performed
horizontally, vertically or in another angle. The importance of the angle choice should not be
overstressed; choose any radial direction with easy access.
The measurement points need to be prepared for the measurements. The best is to place measuring
pads on a machine (see the chapter Preparation of Measuring Location).
3.8
The preparation of the measurement point
On the measurement point we make a measurement. To obtain a quality measurement, the points
for measurements must be prepared in advance. For regular measurements the sensor must be
condition management solutions
8
IRD449 VDSM O&M Manual
IRD Mechanalysis® Ltd
always fixed in the same way at the same point. For diagnostics of bearings it is necessary to fix the
sensor with a magnetic base. Do not push the sensor only by hand - high frequencies cannot be
measured in this way.
The magnetic base is firmly screwed to the sensor and then it is magnetically fixed to the metal
surface of the machine. Hence the sensor is fixed and a measurement is possible. Quality of fixation
markedly influences the result of your measurement. If the sensor swings or jumps about etc., your
measurement is pointless. A layer of paint is also a big obstacle for higher frequencies. The magnetic
base has ground surface and the same surface quality must be created on the machine. In practice,
it is not possible. A flat surface 3x3 cm in size can be ground only in a workshop. Anyway, quality of
the bearing’s housing steel is not high and such a surface can quickly succumb to corrosion. Then it
becomes unusable.
Solution to this problem is to use measurement pads. These are the cylinders with the diameter
approx. 26 mm and height 10 mm with a ground surface, made of a magnetic stainless steel. They
are fixed to chosen points with special glue, which ensures a perfect transmission of the high
frequency vibrations. The pad is covered with a plastic cover, which is removed only for the
measurement. Another advantage of the cover is that when the machine is painted, your
measurement point is preserved. The paint would devalue the pad. It is sufficient to coarsely grind
the machine’s surface and degrease it before the pad is glued. Durability of the pads in time is
unlimited. In practice, it is always until a forcible removal.
You will need mainly the following aids: angle grinder, set of files, sand paper, degreaser (ethanol,
solvent), measurement pads and glue.
Prepare the surface in the following way:
- remove the paint, corrosion or unevenness from the surface by grinding,
- degrease the surface.
The pad is being fixed on measurement point with the glue. We usually use the METAL TECH SG
cement, also other glues with similar properties may be used.
The METAL TECH SG cement is a 2-component epoxy cement with properties best suited for this
task. The two components, after mechanical mixing, chemically react and after drying they form a
hard material resistant to pressure, temperature and humidity.
In the case of the simple pad the procedure is as follows: cut-off a disc approx.3 mm thick from the
cement with a sharp knife. Wet your fingers and work the disc into a homogenous lump. Roll a
cylinder with the diameter approx. 2-3 mm from this lump and put it on the side, which is not
roughened.
Push the pad with glue to the prepared place and, while constantly pushing and turning the pad there
and back with circular movements, observe that the cement is being evenly pushed out along the
circumference of the pad. The purpose is to make the layer between the pad and the surface as thin
as possible.
condition management solutions
9
IRD449 VDSM O&M Manual
IRD Mechanalysis® Ltd
ATTENTION
CEMENT MUST NOT BE PUSHED OUT COMPLETELY!
Pushed out cement may be removed or levelled out around the pad. In the end you put a cover on
the pad. When using the T pad, amount of the cement is dependent on the size of the gap between
the motor ribs and it is not so easy to determine amount of the cement to process. As with the
simple pad, the surface between the ribs must be well cleaned and degreased. The space shall be
filled with the necessary amount of the cement so that only the cylindrical part of the pad remains
visible after drying of the cement. In the end put the cover on the pad.
3.9 Listening to Vibrations Using Headphones
A user can connect headphone to the IRD449 – Vibration Diagnostic SmartMeter instrument, since
listening to a measurement signal also enables a differentiation of a problem type. People can think
that this is an old method, which does not have a place in this modern world. The opposite is true.
Analysis of gears and low speed bearings (e.g. in paper mills) gain better quality by using the
listening method. The listening can easily be done by any maintenance person without deeper
knowledge of diagnostics. If there is a defective bearing, distinct rumbling sound is audible in the
earphones then. If the bearing is OK, then you can hear only a weak noise.
HEADPHONE WARNING
Listen at moderate volumes to avoid hearing damage. Always remove the
headphone from the ears when you move the sensor or re-connect cable.
3.10 Relationship of Measuring in Acceleration and Speed
Maintenance staff usually measure vibrations in mm/s or inch/s (velocity) only and not vibrations in
g = 9.81 m/s2 (acceleration). This is a relic of the past, when old equipment enabled the vibration
speed measurement only. Bearing defects are not recognizable by using velocity measurements. If
the velocity value increases due to a bearing defect, then the defect is already serious and there is
an acute danger of unexpected breakdown. The measuring of the velocity vibration does not give
early enough warning before failure of a rolling bearing.
NOTE:
For accurate bearing condition measurement you have to measure the
acceleration vibration!
3.11 Abbreviations used in the manual
RPM
CPS
RMS
PEAK
– Revolutions per minute
– Revolutions per second
– RMS value of the measured signal
– Peak value of the measured signal
condition management solutions
10
IRD449 VDSM O&M Manual
IRD Mechanalysis® Ltd
4. What Will You Get with Your Instrument
4.1
Instrument and accessories
The instrument package consists of the following standard accessories:
SNo.
ITEM
3,
4.
5.
Sensor Accelerometer, model IRD511, Standard, 2-10KHz, 100mV/g, Top Exit, Mil
2 Pin, 1/4"-28UNF Female Mounting Thread with National Traceable Cal. Cert.
Cable Assembly Coiled, for model IRD944/ IRD449 Binder to accelerometer Mil
spec 2-Pin connector, expandable to 1.6m
Headphones
Magnetic Portable Base, IRD500 Series Accels
Carrying Case for model IRD449
6.
Manual Operating instructions in English and CD
1.
2.
PART NO.
Qty
M5111005001000
1
M60164
1
M91208
M24828
M25352
1
1
1
M44999
1
The standard package for IRD449 consisting of the meter, cable, sensor, headphones, Carrying
Case & manual is depicted in Figure 2.
Figure 2 IRD449 – Vibration Diagnostic SmartMeter with standard
accessories
condition management solutions
11
IRD449 VDSM O&M Manual
IRD Mechanalysis® Ltd
5. Before You Start
Ignoring any of the recommendations mentioned below may cause failure
of the instrument.
Handling voltage higher then +24 VDC can cause an accident.
1. Always connect only ICP type sensors into an ICP marked socket! If unsure, consult the procedure
with your supplier.
2. Never plug this instrument into 230 V household voltage!
3. To power this instrument, use batteries with max. nominal voltage of 1.5 V!
4. To power this instrument, use only alkaline or rechargeable (NiCd, NiMH) batteries. Regular
carbon-zinc batteries are not suitable.
Use correct battery polarity.
Incorrect polarity will cause destruction of the instrument!
HEADPHONES WARNING!
Listen at moderate volumes to avoid hearing damage.
Remove the earphones from the ears when you move the sensor or
re-connect cable.
condition management solutions
12
IRD Mechanalysis® Ltd
IRD449 VDSM O&M Manual
6. Standards for vibration measurements
Vibration measurements without a standard for comparison are seldom of any use. There
needs to be some guide to show how much is too much. Table 1, provides a guide for
Machine Tool Vibrations. The values listed merely indicate the range in which satisfactory
parts have been produced. Actual tolerances must be determined by your own experience
as to what vibration levels permit the meeting size and finish tolerance.
Table 1 Tentative guide to vibration tolerances for machine tools
Type of machine
Displacement of vibration as read
with sensor spindle bearing housing
in the direction of cut
Grinders
Tolerance Range
Thread Grinder
0.25 - 1.5 microns
Profile or contour Grinder
0.75 - 2.0 microns
Cylindrical Grinder
0.75 - 2.5 microns
Surface Grinder (Vertical Reading)
0.75 - 5.0 microns
Gardner or Besly type
1.25 - 5.0 microns
Centreless
1.0 - 2.5 microns
Boring Mill
1.5 - 2.5 microns
Lathe
5.0 - 2.5 microns
These values come from the experience of IRD personnel who have been trouble shooting
machine tools for over 10 years with the IRD equipment. They merely indicate the range in
which satisfactory parts have been produced and will vary depending upon size and finish
tolerance.
NOTE:
The above tolerance ranges consist of machine vibration
displacement values at which acceptable parts can generally be
produced and are supplied as a guide for judging the indicated
vibration as a warning of impending trouble. The measurements
were obtained with the vibration sensor mounted on the spindle
bearing housing in the direction of the machine cutting.
The units in which vibration severity may be measurement displacement, velocity or
acceleration – are interrelated to one another. Displacement is used for measuring the
condition of slower speed machinery, particularly where displacement standards have been
established or where excessive unbalance is present. However, Velocity measurements
provide a measure of the combined effects of vibration frequency as well as displacement
and can be universally applied regardless of machine speed or type of trouble. This type of
measurement provides a direct indication of the vibration severity and is generally the best
indicator of the machine balance or condition. Acceleration is generally used when
vibration occurs at high frequencies and often where the frequency of the source is many
times the shaft RPM.
condition management solutions
13
IRD Mechanalysis® Ltd
IRD449 VDSM O&M Manual
The vibration amplitude should be obtained in velocity and in whatever other units are
desired. Measurements in displacement or acceleration will provide an indication of the
vibration severity only if the dominant frequency of the machine vibration is known. Since
the vibration velocity is consistent with rotational speed, vibration severity measured in
terms of vibration velocity is most common. One such machine vibration severity chart is
tabulated in Table 2A for general machines and in Table 2B for large machines.
Table 2A General Machinery Vibration Severity Chart (metric) for Medium and
Large Industrial Machines
Vibration Severity Guidelines for Medium & Large Industrial Machines - Ref: ISO 10816-3
Group 2
Group 1
Medium Size Machines
Large Size Machines
Vibration
Rated Power
Velocity
15 KW to 300KW
300KW to 50 MW
mm/sec RMS
Shaft height 160mm-315mm
Shaft height >315mm
Generally with Antifriction Bearings
Generally with Sleeve Bearings
11
DAMAGE MAY OCCUR
7.1
SHORT TERM OPERATION
4.5
3.5
2.8
2.3
1.4
CONTINUOUS LONG
OPERATION
NEWLY PUT INTO OPERATION
0.71
Foundation
Rigid
Flexible
Rigid
Flexible
Table 2B A general machinery vibration severity chart (metric) for General
Machines.
Vibration
Velocity
mm/sec
RMS
0.28
0.45
0.71
1.12
1.80
2.80
4.50
7.10
11.20
18.00
28.00
45.90
Vibration Severity Guidelines for General Machines - Ref: ISO10816-1
Class I
Class II
Class III
Class IV
Large Machines (>
Large Machine
Small Machines
Medium Machines
75KW)
(>75KW)
(< 15 KW)
15KW to 75 KW
Rigid Foundation
Flexible Foundation
GOOD
ACCEPTABLE
TOLERABLE
UNACCEPTABLE
condition management solutions
14
IRD Mechanalysis® Ltd
IRD449 VDSM O&M Manual
6.1
Setting Vibration Limits in IRD449 VDSM
It’s possible to set up these values directly in the unit. Then the measured values are displayed in
traffic light colours. You can choose IRD Mechanalysis limits (recommended) or ISO10816 limits
tabulated in Table 2A & 2B. Setting up is in menu under the mode SETUP (see instrument
operation).
Coloured marks according to ISO10816 are ranges A and B, displayed by green colour. Range C is
amber and range D is red. This is tabulated in Table 3A and Table 3B for machine groups 1&3 and
2&4 respectively. It’s necessary to choose a type of evaluation R13, F13, R24 or F24.
Table 3A Classification of vibration values for machines groups 1 and 3
Foundation
class
Rigid (R13)
Flexible (F13)
RMS velocity values
mm/s
in/s
2.3
4.5
7.1
3.5
7.1
11.0
0.09
0.18
0.28
0.14
0.28
0.43
Border Zone
A/B
B/C
C/D
A/B
B/C
C/D
Table 3B Classification of vibration values for machines groups 2 and 4
Foundation
class
Rigid (R13)
Flexible (F13)
6.2
RMS velocity values
mm/s
in/s
2.3
4.5
7.1
3.5
7.1
11.0
0.09
0.18
0.28
0.14
0.28
0.43
Border Zone
A/B
B/C
C/D
A/B
B/C
C/D
Dominant Frequency
It is sometimes useful to know the Dominant Frequency of Vibration of a machine that has
several rotating parts, consider, for example, a belt driven blower. The dominant frequency
will reveal which part of the machine is causing the most vibration. Vibration measurements
taken with the Model IRD306DI are overall vibration readings or the vector sum if all the
vibration at the point the sensor is applied. Measurements taken on the motor bearings
would include vibrations of the motor plus vibration from the pump transmitted through the
gear box and mounting structure. Conversely, measurements taken on the pump bearings
would include vibrations of the gear box plus vibrations transmitted from the motor (See
Figure 3). In many cases the point with the most vibration would pinpoint which part has
the trouble, but not always.
condition management solutions
15
IRD449 VDSM O&M Manual
IRD Mechanalysis® Ltd
Figure 3 Discrete machine frequencies show different defects
The Figure 3 can be used to find the dominant frequency of vibration provided the readings
taken are steady, i.e. the readings do not fluctuate more than 10%.
Use the following sequence to find the dominant frequency.
1.
Measure and record the displacement (D) at a given point.
2.
In the same manner and at the same point, measure and record the velocity (V)
Be sure to use the exact same measuring point holding the sensor steady
for both the displacement and velocity readings.
3.
The Dominant Frequency can be found by dividing the velocity measurement (V)
by the Displacement Measurement (D) and multiply by the constant 19,120. The
answer will be the Dominant Frequency of Vibration is cycles per minute.
Dominant Frequency (CPM) = Velocity V (millimeters/second x 19.120 (Metric units)
Displacement (D) micrometers
For example, in Figure 3, the motor runs at 1,750 RPM and the fan at 2,60
For example, in Figure 3, the let us assume motor runs at 1750 RPM and the pump at 5250
PM. If the measurements taken on the motor are: displacement (D) = 24 microns and
velocity (V) = 6.59 mm/s. Then the dominant frequency is:
(V) 6.59 x 19,120 = 5,250 CPM
(D) 24
This is equal to the pump speed. Thus the pump is the dominant part and is causing the
largest vibration.
condition management solutions
16
IRD Mechanalysis® Ltd
IRD449 VDSM O&M Manual
Generally the dominant frequency will be equal to the rotating speed of the part causing the
vibration, assuming that the trouble is unbalance. In any event the dominant vibrating
frequency will normally be some multiple of RPM of the part. After determining the
dominant frequency, the type of machine fault present may be assumed from the following
table2.
Table 3 Dominant machine excitation frequencies and most likely causes
DOMINANT FREQUENCY
MOST LIKELY TROUBLE
1 X RPM
Unbalance and / or misalignment
If axial vibration is large
Check for bent shaft or Misalignment
Looseness, misalignment
Misalignment
Bad roller or ball bearings or gears
Oil whirl (Less than ½ RPM)
2 X RPM
3XRPM
Many times RPM
Less than 1XRPM
Synchronous (AC Line
frequency)
2X Synch. Frequency
Many times RPM (Harmonically
related)
High frequency (Not
harmonically related)
Electrical problems
Torque pulses
Bad gears
Aerodynamic forces
Hydraulic forces
Mechanical looseness
Reciprocating forces
Suspect antifriction bearings
NOTE: This table is just a guideline for root cause analysis of
a machine problem. There are many other causes of vibration
not listed. To pinpoint all but the simplest requires a thorough
analysis and interpretation of the vibration patterns of a
machine using a IRD Vibration Analyser.
.
condition management solutions
17
IRD Mechanalysis® Ltd
IRD449 VDSM O&M Manual
7. Quick Start
The aim of this chapter is to introduce you this instrument, and, without reading a complete User’s
Guide, enable you to measure first vibration values. This chapter does not describe full and detailed
operation of this instrument or measurement methodology. Special chapters in this Guide are
intended for this purpose.
7.1
Preparation of Measurement Point
We have to select a measurement point before the measurement itself. We want to choose it in such
way that transmission of vibrations would not be attenuated. Usually this means as close to the
source of vibrations as possible (for instance at a bearing housing). We always have to measure at
solid, firm part of a machine. We should not be measuring on covers and so on. The place should be
clean, without corrosion and paint. It should also be flat so a sensor would not “wobble”. The best is
to use a measurement base, which is glued on a machine. It has a perfect surface, plastic cover, and
is made from magnetic stainless steel. This will enable you to perform the measurements on the
machine at any time under the same conditions. Measurement repeatability means that you will be
able to compare values well.
7.2
Putting in Batteries
Batteries are accessible after opening a lid at a bottom part of the instrument. Open the lid by
pressing its lower edge (the edge with hinge), the lid upper part opens easily - see Figure 4B. Do not
ever use force! Proper polarity is shown in Figure 4C
Do not forget to switch the instrument off before opening the power battery
lid!
Never handle the power batteries with the instrument switched on!
2. Open
1. Press gently
Figure 4A Opening of the lid
Figure 4B Placement of power batteries
Figure 4C Proper cell polarity
condition management solutions
18
IRD Mechanalysis® Ltd
IRD449 VDSM O&M Manual
7.3
Plugging in Vibration Sensor
To measure a vibration signal we need to plug in the vibration sensor with ICP power. The plugged in
sensor must be a standard accelerometer with 100 mV/g sensitivity. The instrument is equipped
by its own source of ICP power for connected sensor. The sensor needs to be connected at the right
input plug by a supplied cable. Figure 5 depicts the instrument connected by a coiled cable to the
sensor.
Figure 5 The instrument with a sensor connected
The headphones output is on the left (3.5mm jack). The accelerometer input is on the right side. The
contact-less temperature sensor is on the bottom. Four LEDs of strobo are in the top of panel. This is
depicted in Figure 6
Stroboscope
LEDs
Headphone
connection
Accelerometer
Connection
Temperature Sensor
Figure 6 The instrument with a sensor connected
7.4
Vibration Measurements
Screw the sensor onto the magnetic base. Do not forget to remove the plastic cover and a metal
washer (it closes a magnetic field for longer service life of the magnet) before measuring. Place the
plastic cover and the metal washer back on the magnet after measuring.
Place the magnet on a measuring point very carefully. Best is to rest the edge of the magnet on its
side and then slowly lower the sensor onto a machine. If you bring the magnet near to the machine
with its whole area hitting the machine all of the sudden, then the strong impact can irreversibly
destroy the sensor.
condition management solutions
19
IRD Mechanalysis® Ltd
IRD449 VDSM O&M Manual
In case you use a measuring tip instead of the magnet, measured values are not going to be stable.
This in not surprising. The measured values depend to a large extent on a pressure of the tip at the
measurement point. The magnet that attaches the sensor generates a constant pressure so the
values are stable.
ATTENTION
Use the measuring tip only in hard to reach places, where it is not
possible to place the magnetic base
7.5
Temperature Measurement
Infrared sensor for temperature measurement is aside from accelerometer input. Measurement angle
is about 45 degrees around the sensor centre axis. Best results are taken with sensor distance 10-20
cm from measured surface. The relation of the sensors sensitivity Vs. the angle is shown in Figure
7A along with the size of the scanned area Vs. distance shown in Figure 7B. The accuracy of result
depends of emissivity; this is typical property of IR temperature sensors.
100mm / dia 200mm
80mm / dia 160mm
60mm / dia 120mm
40mm / dia 80mm
20mm / dia 40mm
FOV sensor / 90deg
Fig 7A. Sensor sensitivity vs.
the angle
Fig 7B. The size of the scanned area vs.
distance
Figure 8 The temperature measurement zones in IRD449
Measured temperature is displayed in Celsius and Fahrenheit degrees. Also the coloured bar is
used. The bearing symbol on the other displays is also coloured according to the actual temperature
value. The ranges of colours are for less then 30°C - green, 30-45°C - yellow, 45-60°C - orange, 6075°C - red and for greater then 75°C – dark red. A typical case is depicted in Figure 8.
condition management solutions
20
IRD449 VDSM O&M Manual
7.6
IRD Mechanalysis® Ltd
Automatic detection of the machine speed
It’s important to know the speed for evaluation of the machine condition. Instrument is looking for
speed in the frequency spectrum (200Hz range).It is assumed that most of the vibration energy is
located on the speed frequency. If the instrument finds significant energy level on one frequency
(that means in very narrow band) then this frequency is labelled as the speed frequency. From this
description is clear that the speed has not to be found always. If the higher level of energy is located
in the spectrum on other line then speed frequency (for example frequency of the fan blades), then
the wrong result can be displayed. However the correct speed, which must be defined for condition
levels, can be entered manually as well..
7.7
Evaluation of the machine and bearing conditions
Diagnostician is always asking a basic question after measurement: “What condition of the machine
should I assign to this measured value?”
Machine conditions are divided into 3 levels, which have the same colours like traffic lights:
1. GOOD – GREEN COLOR
Machine is in good condition, no defect is found. The operation is without restrictions.
2. ALERT - AMBER COLOR
The beginning defect has been found on the machine. It is possible to operate with paying more
attention and planning of repair.
3. DANGER – RED COLOR
Serious defect has been found on the machine. Machine shouldn’t be in operation.
Special functions are included in the instrument for detection of that three states. The overall
vibration values are coloured with appropriate colour. The vibration limits IRD Mechanalysis for
each state are determined from the graphs, which are printed in the IRD Mechanalysis Limit
Values of Machine and Bearing Vibrations chapter.
7.8
Fault Source Identification and Diagnostics Tool
Press the left arrow on the screen No.1 and the Fault Source Identification and Diagnostics screen
appears. For correct evaluation the speed must be defined. The instrument can do it automatically or
by user manual entry.
In the left bottom corner you see the Machine icon. The vertical bar displays the general (overall)
machine condition. This condition can be evocated by many reasons. The unit evaluates the severity
of 3 sources, which are the most occurred in the practice:
- Unbalance (circle with heavy spot icon),
- Looseness (shoe icon),
- Misalignment (clutch icon).
Correspondent faults horizontal bars are in middle. On the right bottom corner you find the rolling
bearing icon. The vertical bar displays the bearing condition.
condition management solutions
21
IRD449 VDSM O&M Manual
7.9
IRD Mechanalysis® Ltd
The Stroboscope
The build-in stroboscope inside the IRD449 VDSM represents the unique innovation in the handheld
vibration analyzer field. We use the high lighting LED technology, which low power consumption
enables to use the stroboscope in our instrument.
Stroboscope or stroboscopic lamp, commonly called a strobe, is the device which produces regular
flashes of light. When we have to study or to visually inspect the machinery, which have cyclically
moving parts, then the stroboscope enables to froze the moving ( usually rotation). Imagine the
simplest form, a rotating disc with one-spaced hole. When the flashes of light are synchronized with
the rotational speed of the disc, then just one flash is made during one rotation. It means, the disc is
lightened up when the hole is always in the same position. It is the principle of illusion of frozen
movement. A typical measurement is shown in Figure 9..
Figure 9 The Stroboscope measurement employing IRD449
7.10 The Torch
You sometimes need to inspect or read the dark corners. In that time you are lucky with IRD449
VDSM, because this instrument has built-in torch in front panel. Please refer Figure 10.
Figure 10 The IRD449 Torch operation
condition management solutions
22
IRD Mechanalysis® Ltd
IRD449 VDSM O&M Manual
8.
INSTRUMENT OPERATION
8.1
Switching on and off
The instrument is switched on by pressing of the middle button
(shown in Figure 11)
Instrument
ON/OFF
Figure 11 IRD449 Power ON
Provided that batteries with sufficient voltage are placed in the instrument then a display will show an
instrument Logo. If the batteries are weak the IRD449 sign is bordered in red (Please refer Figures
12A, 12B & 12C)
VDSM
VDSM
Fig 12A Switching on
Figure 12 IRD449
Power ON
Fig 12B Switching off
Fig 12C Switching on
with weak batteries
Description of numbers in initial screen:
1. The sensor sensitivity mV/g times 10 ( 983 means 98,3mV/g)
2. Firmware version ( V2.05dtH)
3. HP filter frequency for bearing in kHz ( 0,5 kHz)
The instrument is switched off by pressing and holding the same button
for a longer time. The
POWER OFF appears on the display. Release the button and the instrument switches off.
8.2
Standby Mode
When the user does not press any button for 10 minutes, the instrument changes the standard run
mode to the Stand by mode - the screen is darkened. When the user does not operate with the
instrument next 30 minutes, the instrument switches off.
condition management solutions
23
IRD Mechanalysis® Ltd
IRD449 VDSM O&M Manual
8.3
Information line
After powering on the display shows measured data. Beyond descriptions of the measured values
and their actual values the display shows an information line in its upper part.Please refer Figure
Figure 13 Information Line on display
Meaning of Displayed Symbols:
- moving “wave” signifies measurement in progress,
- setting of earphone output volume is indicated by yellow coloring of the
bars,
- this symbol shows an approximate battery status. If the battery symbol is
filled more, then more battery power remains. If the status goes under 20 %, the remaining energy
shows in red, if it is insufficient, the symbol is red and the instrument switches itself off.
Battery status symbol:
100%
8.4
approx. 50%
under 20%
just before switching off
Using of Headphone
The instrument is equipped by a 0.5 W amplifier for connecting of earphones and listening to a
measured signal. We can connect the headphone by a stereo 3.5 mm jack marked phones on the
top of the instrument. After connecting we can hear a signal from the vibration sensor in the
earphones. Advisable volume can be set-up by the VOLUME item from the instrument menu (Please
refer Figure 14 for details)
Increase Volume
button
Decrease Volume
button
Switch
measuring/volume
control
Figure 14 IRD449 Headphone Control
condition management solutions
24
IRD449 VDSM O&M Manual
8.5
IRD Mechanalysis® Ltd
Selection of Measurement
A selection of measuring screen (method) can be performed by arrow buttons ▼ ▲. After press of a
button an “empty screen” is shown without measured data, and the measuring starts. Please refer
Figure 15 for the controls.
Measuring
Screen Selection
Switch
measuring/volume
control
Figure 15 IRD449 Measuring Screen Selection Buttons
8.6
Measurement Methods Screens
Figure 16 Measurement Methods Screen
Please refer Figure 16 for the measurement method screens.
Overall RMS values
Measurement of RMS vibration values in the ranges:
10 Hz - 1000 Hz in mm/s,
0.5 kHz - 16 kHz in g,
with estimated value of machine speed frequency.
Based on the speed and vibration values of the machine condition, colour of displayed value - green
/ amber / red - is determined. The colour of bearing is determined regarding to the measured
temperature.
condition management solutions
25
IRD Mechanalysis® Ltd
IRD449 VDSM O&M Manual
Fig 17A Overall Peak
Values
Fig 17B Spectrum
200Hz Looseness
Fig 17C Time Signal for
Roller Bearing
Please refer Figure 17A, 17B and 17C for the measurement screens.
Overall PEAK values
Measurement of peak vibration values in the ranges:10 Hz - 1000 Hz in mm/s,0.5 kHz - 16 kHz in g
Spectrum 200 Hz–looseness detection
FFT analysis of vibrations in the range: 2 Hz - 200 Hz in mm/s RMS, with display of 3 maximum
peaks found .The peaks are ranked according to amplitude vibration size.
Time signal for roller bearing diagnosis
Measuring of time signal and vibrations in the range: 0.5 kHz - 16 kHz in g.
Displays actual measured time signal and gENV value.
Fig 18A Vibration in
Frequency Range
Gearbox/Bearing
Fig 18B FASIT Screen
Fig 18C FASIT Screen –
No RPM
Please refer Figure 18A, 18B and 18C for the measurement screens.
Vibrations in frequency ranges – gearbox/bearing
Measurement of RMS vibration values in the ranges:
0.5 kHz - 16 kHz in g,
1.5 kHz - 16 kHz in g,
5 kHz - 16 kHz in g.
FASIT Expert System
The FASIT screen. It displays the severity levels of machine faults. Also the temperature bar is
displayed on the right side.
When the RPM is not found then no results are displayed (from ver.2.05).
condition management solutions
26
IRD Mechanalysis® Ltd
IRD449 VDSM O&M Manual
Fig 19A Overall RMS Displacement
Fig 19B Overall Peak Displacement
Overall RMS and Peak displacement values in the range 2-200 Hz in mm. From ver.2.05, the
displacement is displayed in microns. This is depicted in Figure 19A and 19B.
8.7
Speed detection and definition
After switch on of the instrument the Screen depicted in Figure 20A appears and the automatic
speed detection begins. The detection procedure is displayed as running bar in the bottom of screen.
The result is also displayed on the bottom.
Fig 20A Start-up screen for
automatic speed detection
Fig 20B Automatic Speed
Detection- Last Speed Value
When the automatic speed detection is not successful (see Automatic detection of the machine
rotation chapter), the last speed value is loaded from the memory and displayed together with the
message (Figure 20B)
Push arrows, it changes the value of speed with the step 250 RPM. When the correct speed (or the
value near the correct speed) is defined, push Enter button for confirmation.
If no pushbutton is used for approx. 4 seconds, then the displayed value is accepted. The word
<set> is changed to! MAN!, then this word informs all the time the user, that speed is entered
manually.
When you need to set exact value and the 250 RPM step is too much, then use the STROBO item
from the MENU.
condition management solutions
27
IRD Mechanalysis® Ltd
IRD449 VDSM O&M Manual
Figure 21A RPM set manually
Figure 21B RPM detection switched
OFF
If the automatic detection is switch on, this procedure of speed detection runs always when the
Screen No.1 appears. !RPM OFF! is displayed when the RPM detection is switched off. Please refer
Figure 21A and Figure 21B
8.8
Menu for functions selection
By pressing
button, the instrument menu appears. If the instrument is in the error stage (for
example “SENSOR ERROR“), then some functions are not available.
LIGHT
STROBO
VOLUME
SETUP
SPEED
ALARMS
UNIT
ESC -
- Torch mode
- Stroboscope mode
- Phone output volume adjustment
- This item opens next item selection:
- Set of speed detection
- Selection of standard, which will define limit values
- Unit options for a measuring of a velocity signal (mm/s vs. ips)
- Return to the measuring screen
If the error is detected (e.g. “SENSOR ERROR"), then some item are not available. Move between
items by pressing ▼ ▲ buttons. Select item by pressing
button. Use - ESC for return from Menu.
Please refer Figure 22 A, B & C for details.
Menu
Selection
Buttons
Figure 22A IRD449 Instrument
Menu
Menu
Enter/Escape
Button
Figure 22B IRD449 Instrument
Menu (in error stage)
Figure 22C IRD449 Measuring Screen
Selection Buttons
condition management solutions
28
IRD Mechanalysis® Ltd
IRD449 VDSM O&M Manual
8.8.1 LIGHT
In LIGHT mode it’s possible to use instrument like a torch. Select the LIGHT mode and press
button. White LEDs on the front side begins to light. Symbol of a torch appears on display as shown
in Figure 23. Press any button to switch off the light and the instrument starts to measure again.
Figure 23 Torch Mode
8.8.2 STROBO
In STROBO mode you can use the instrument as a stroboscope. White LEDs on the front side
begins to flash with a frequency, which is set up on the screen. If the speed detection is known, then
frequency of flashes is set to that value. By pressing ▼ ▲ buttons you can also change that
frequency manually. The step (1, 10,100 RPM) is displayed on the bottom line of the screen. Press
button and the STROBO menu appears. You can switch-off (STOP) the stroboscope or
the
change the step frequency tuning. Please refer Figure 24A and 24B for details.
Escape STROBO
Preset
Frequency in
RPM & Hz
Options for
frequency
step
Preset Step ▼▲
Increasing/Decreasing
Fig 24A RPM set manually
Fig 24B Strobo Mode Menu
condition management solutions
29
IRD Mechanalysis® Ltd
IRD449 VDSM O&M Manual
8.8.3 VOLUME
The volume bars appear. The volume is changed by buttons ▼ ▲. When the maximum volume is
reached, the symbol will become orange otherwise the amount of yellow filling shows the actual
volume. If the earphones are off, the symbol is grey. Next press of the button
returns the
instrument back to the measurement mode. Please refer Figure 25 A and Figure 25B for details.
Swicthed Off
CCA 50%
Maximum
Figure 25 A Volume Adjustment
Figure 25 B Displayed Volume
During the instrument is switched on or off, the range is changed, the sensor is connected or
disconnected, the short unpleasant crack can be heard. This is not a defect of the instrument.
ATTENTION
Be careful not to overload the headphone amplifier by excessive volume.
This will distort a signal in the headphone.
You can use any stereo or mono headphones with nominal impedance higher than 8 Ω. Both output
stereo channels are connected to the signal.
8.8.4 SETUP
Further functions menu appeared. Choose requested function using arrows and confirm by
condition management solutions
Enter.
30
IRD Mechanalysis® Ltd
IRD449 VDSM O&M Manual
8.8.5 SPEED
Fig 26A Speed Menu Setting
Fig 26B Speed Menu AUTO
Please refer to Figure 26A and 26B for menu screens. Switch on (AUTO ON) or switch off (AUTO
OFF) automatic detection of RPM. The manual enter is required, when AUTO OFF. For ver.2.05 and
higher more options are available:
AUTO - automatic speed detection
MANUAL - always manual entry of speed
OFF - speed value is ignored, no limits with relation to speed are used.
8.8.6 ALARMS
Standards setup, Alert limits (amber colour) and Danger (red colour) will be defined. Please refer to
Standards for vibration measurements.
Fig 27A Alarm Setting
Fig 27B Alarm Setting with Machine
Symbol
Chosen standard is displayed in the Figure 27B above, the machine symbol (F13 in this case). If IRD
Mechanalysis standard is chosen, nothing is displayed.
8.8.7 UNITS
Vibration speed unit can be chosen here. mm/s (millimetres per second) and ips (inch per second)
are available. Device remembers chosen unit even after switch off.
condition management solutions
31
IRD449 VDSM O&M Manual
IRD Mechanalysis® Ltd
8.8.8 ESCReturn to the MENU screen.
condition management solutions
32
IRD449 VDSM O&M Manual
8.9
IRD Mechanalysis® Ltd
Error Messages
8.9.1 Sensor connection Error
When incorrect connection of a sensor, unsuitable sensor type, broken cable etc. is detected, then
the temperature screen occurs and the error message is written upon the values.
8.9.2 Display Value Overload
When the value exceeds the range of display, then OVR is displayed.
8.9.3 Input Overload Error
If an input signal is too strong (higher than 12V peak), the instrument cannot process it, the overload
error is displayed. The instrument is not capable of measuring this signal.
condition management solutions
33
IRD449 VDSM O&M Manual
IRD Mechanalysis® Ltd
8.9.4 Measurement Error
If there is a break in communication between measuring and display boards inside of the instrument,
this measurement initialization error is displayed (MEAS INIT). If you see this error, it means that the
instrument is malfunctioning and we recommend to send it to the manufacturer for repair.
condition management solutions
34
IRD449 VDSM O&M Manual
IRD Mechanalysis® Ltd
9. HOW TO EVALUATE THE FAILURE
The instrument shows measurement results on several separate screens. We shall describe basic
rules for their use.
9.1 Overall RMS values
- Machine symbol - this line shows RMS velocity vibration value in mm/s or ips, which is
excited on the machine by mechanical phenomena related to:
- imbalance of rotational parts of the machine (fan wheel, impeller, clutch wheel etc.),
- incorrect axis alignment of the assembly – misalignment,
- mechanical looseness of individual machine parts,
- large free play in seating of rotational machine parts (shaft - bearing, shaft – bearing
housing),
- clutch free play (e.g. free play on a shaft, pressed out grooves and tongues),
- loose or worn out machine anchor bolts,
- defective base,
- insufficient frame or anchoring flange rigidity,
- damage to machine rotation parts - (bent shaft).
- Bearing symbol – this line shows RMS acceleration vibration value in g, which is excited by
a condition of bearing. This condition is related to:
- time wear of the bearing,
- bad lubrication (with new bearings as well),
- incorrect installation (with new bearings as well),
- abrading of bearing.
The thermometer symbol is drawn together with the bearing. The temperature color is used
according the actual measured value.
SPEED - The machine speed is displayed at the bottom part of the screen (if it is available). RPM
means revolutions per minute. The instrument performs automatic detection of machine revolutions
using a spectrum analysis. This function does not have to be always successful, because the
revolutions may not be possible to read for every spectrum. If the speed is not determined, it is not a
malfunction. It is hard to do it, for example, in machines with gears.
If the speed is available, then
and
vibration values have been coloured corresponding to
vibration limits. Machine conditions are divided into 3 levels, which have the same colours like traffic
lights:
1.GOOD – GREEN COLOUR
Machine is in good condition, no defect is found. The operation is without restrictions.
2.ALERT - AMBER COLOUR
The beginning defect has been found on the machine. It is possible to operate with paying more
attention and planning of repair.
condition management solutions
35
IRD449 VDSM O&M Manual
IRD Mechanalysis® Ltd
3. DANGER – RED COLOUR
There is an serious defect found on the machine. Machine shouldn’t be in operation
9.2
Overall PEAK values
Similar rules for evaluation of the measured values, as in the previous screen are valid for this
screen with one difference. The peak (PEAK) vibration values are displayed. It is highest measured
value in certain time, which is important for transient shock events evaluation, especially in cases of
incipient bearing defects, like:
- microscopic peeling off of a hardened surface layer in the place of a rolling element contact
with a bearing ring (regular shocks),
- contamination of bearing space by metal particles (irregular shocks),
- cracks.
Shocks which cause these defects are also parts of the RMS vibration values. However, the peak
value of such shock is hidden in a value which contains all other information about vibrations, i.e.
noise from possible abrading, wrong lubrication and overloading. To simplify, the RMS is an average
value of all vibration values achieved in certain time. If a large peak value (one shock) appears in this
time period, it will be lost in the final recalculation of all the values.
This practically means that during increasing of this bearing defect that causes the shock, the PEAK
value of this shock will visibly increase, while the effective (RMS) value will increase only slowly. We
can discover the initial defect time of the bearing sooner. But PEAK value is not so stable as RMS
value. For bearing condition measurement is the RMS measurement sufficient.
9.3
Spectrum 200 Hz– Detection of Looseness
This screen is important for detection of the mechanical looseness. When the graph shows a number
of lines (typically 3 or 4) with the same space between them and the first line is on the speed
frequency (see the value description on the bottom) probably mechanical looseness is the machine
problem.
The most common causes of this defect are:
- soft flanges,
condition management solutions
36
IRD Mechanalysis® Ltd
IRD449 VDSM O&M Manual
- loose anchoring bolts,
- cracks in frames – cracked welds,
- free play in rotational part seating,
- or possibly other problems not related to mechanical looseness,
- bent shaft.
See also FASIT chapters.
9.4 Time signal for bearing condition evaluation
Fig 28A Time Signal for bearing
vibrations
Fig 28B Undamaged Bearing
Fig 28C Undamaged Bearing –
wrong lubrication
Fig 28D Damaged Bearing
The time signal of bearing vibrations is displayed. gENV value is under the time signal (envelope
modulated signal. Please refer Figure 28A
The time signal is displayed as a direct record, not after envelope
modulation. Look at three basic screens for easy work with this function.
Undamaged bearing: (Refer Figure 28B)
This bearing generates a low amplitude noise only, whose time record shape is steady.
It’s necessary to have a look on the range of the graph (left side). Signal could look high but it’s not
when the graph range is low (for instance 0,5 g).
Undamaged bearing – wrong lubrication: (Refer Figure 28C)
The time record shape is steady too but it has bigger amplitude then previous case. You can clearly
see different (bigger) range of the graph (1,0 g)
condition management solutions
37
IRD449 VDSM O&M Manual
IRD Mechanalysis® Ltd
Damaged bearing: ((Refer Figure 28D)
There are clearly visible shocks caused by a rolling element coming across the damage like pitting or
crack here. The shocks repeat themselves regularly. The range of the graph is different again (2,0 g
in this case).
9.5
Vibrations in frequency bands – gearboxes/bearings.
Figure 29 Gearbox Vibration- Acceleration in three frequency bands
When we need to find the failure on not simple machines (e.g. gearbox) then it is very useful to know
the vibration values in several frequency bands.
Figure 29 shows measurement acceleration values in three frequency bands:
0.5 – 1,5 kHz, 1.5 – 5 kHz and 5 kHz – 16 kHz.
Example:
We are going to show the analysis procedure on a signal obtained on a seating of an inlet
transmission shaft with the speed frequency 25 Hz (1500 rpm) and with a gear with 65 teeth. So
called tooth frequency can be obtained by simple multiplication of the shaft revolution frequency (in
Hz) by the number of teeth.
fGMF = fspeed * z
fGMF gear mesh frequency
fspeed speed frequency
z
number of teeth
In our example the tooth frequency is 1625 Hz (so approx. 1,6 kHz).
What are the possibilities?
The transmission is OK and tooth frequency of 1,6 kHz slightly increases vibrations in the second
frequency band.
Bearing failure - vibrations are concentrated in the last frequency range 5 – 16 kHz
9.6 Fault Source Identification and Diagnostics
Description of FASIT has been described in the beginning of this manual. For correct evaluation the
speed must be defined. The instrument can do it automatically or by user manual entry.
The machine condition is divided into 3 levels, which have the same colours like traffic lights. The
same approach we also use for fault detection. This screen is depicted fault diagnosis screen in
Figure 30,
condition management solutions
38
IRD449 VDSM O&M Manual
IRD Mechanalysis® Ltd
Figure 30 Machine Fault Diagnostics Screen
In the left bottom corner you see the Machine icon. The vertical bar displays the overall machine
condition. This condition can be evocated by many reasons. The unit evaluates severity of 3 sources,
which are the most occurred in the practice:
- Unbalance (circle with heavy spot icon),
- Looseness (shoe icon)
- Misalignment (clutch icon).
Correspondent faults horizontal bars are in middle.
On the right bottom corner you find the rolling bearing icon. The vertical bar displays the bearing
condition. The meaning of Machine and Bearing bars was described earlier in this manual.
The temperature bar is displayed quite on right side. The ranges of colours are for less than 30°C green, 30-45°C - yellow, 45-60°C - orange, 60-75°C - red and for greater than 75°C – dark red.
9.6.1
What do the colours means in fault bars of machine and bearing?
GREEN COLOR
It may surprise somebody, because why to think about faults when the colour is green. But also from
low level signal the procedure can read the beginning of the fault. But the operation is without
restrictions.
AMBER COLOR
The beginning level of defect is found on the machine. It is possible to operate with paying more
attention and planning of repair.
RED COLOR
There is the serious defect level found on the machine. Machine shouldn’t be in operation.
condition management solutions
39
IRD Mechanalysis® Ltd
IRD449 VDSM O&M Manual
10. Response Specification
10.1 Vibration velocity measurement frequency response
3
0
-3
-6
A [dB]
-9
-12
-15
-18
-21
-24
-27
1
10
100
1000
10000
log F [Hz]
Measurement accuracy (10 mm/s RMS input signal) is +/- 2.5 % (5-500 Hz frequency range) and
+/- 5% (500 – 2000 Hz range).
10.2 Vibration acceleration measurement frequency response
3
0
-3
-6
A [dB]
-9
-12
-15
-18
-21
-24
-27
-30
0,1
1
10
100
log F [kHz]
Measurement accuracy (1 g RMS input signal) is +/- 2.5 % in 0,2 -20 kHz frequency range.
10.3 Velocity measurement amplitude response
Measurement accuracy for RMS vibration velocity (0.1 – 100 mm/s range) on 80 Hz reference
frequency is +/- 2.5 %
10.4 Acceleration measurement amplitude response
Measurement accuracy for RMS vibration acceleration (0.1 – 10 g range) on 8kHz reference
frequency is +/- 2.5 %
condition management solutions
40
IRD449 VDSM O&M Manual
IRD Mechanalysis® Ltd
11. CALIBRATION
The calibration procedure described herein is supplied for the customer
information only. No attempt to disassemble or calibrate the unit should be
made except by an experienced, qualified technician using the proper test
equipment. IRD Mechanalysis assumes no responsibility for the operation
or units repaired or calibrated outside the factory or at an unauthorized
service centre.
The following test equipment are required for calibration:
1. Standard 4 ½” Digit Digital Multi-meter
2. Standard Function Generator
3. Electrodynamic Shaker
NOTE:
Please ensure that the test instruments used for calibration are
calibrated with references traceable to National / International
Standards and have valid calibration status.
11.1 Calibration Procedure for IRD449 VDSM
11.1.1 Sensor Sensitivity
Before any calibration you need to know, what exact sensitivity of sensor is set in the instrument.
See the initial screen, which contains this information.
Description of numbers in initial screen:
1. The sensor sensitivity mV/g times 10 ( 983 means 98,3mV/g)
2. Firmware version ( V2.05 dtH)
3. HP filter frequency for bearing in kHz ( 0.5 kHz)
The sensor sensitivity is not equal 100mV/g very often. The sensitivity of sensor is usually in 95-105
mV/g range. Let suppose the sensitivity which is set in the instrument is equal S. Then all calibration
measurements, which are adjusted to the sensitivity 100mV/g must be multiplied by 100/S.
11.1.2
Basic test with Electrodynamic Shaker
If you have an elctrodynamic shaker, you can regularly test the unit on two frequencies 80Hz and
8kHz. On the initial IRD449 screen are displayed RMS values of velocity and acceleration. The
velocity value should be 10 mm/s and the acceleration should be 0.5g.
The signal from the shaker with the reference sensor is adjusted for exact 100mV/g sensitivity. When
the sensitivity of IRD449 unit is e.g. 95mV/g, then the higher values (10.5mm/s and 0.53g) will be
displayed. Expected values from the A4801 should be multiplied by 100/95 coefficient.
11.1.3
Basic test with sensor and shaker
Set on the shaker 10mm/s on 80Hz and check the RMS velocity value on the initial screen. Then set
0.5g on 8kHz and check the RMS acceleration. If you have trouble to generate the 8 kHz, you can
use lower frequency, but not lower then 1200Hz. Bellow this limit the LP filtering is applied and the
result would be distorted.
11.1.4
Advanced tests of velocity measurement
Use the shaker and sensor. You can make the frequency response and the amplitude response.
condition management solutions
41
IRD449 VDSM O&M Manual
IRD Mechanalysis® Ltd
Use the amplitude 10mm/s for frequency response test. Change the frequency from 6 to 1200 Hz
and check the filtration curve, which is drawn in previous chapter. Also the accuracy is mentioned
there.
Set the 80Hz for amplitude response. Change the amplitude from 0.1 to 100 mm/s and check the
accuracy (+/- 2.5%).
11.1.4
Advanced tests of acceleration measurement
Use the shaker and sensor if you are able to shake high frequencies (10 kHz or more). If your shaker
system does not allowed it, use the signal generator and switch the ICP off.
Use the amplitude 1g for frequency response test. Change the frequency from 500 to 12000 Hz and
check the filtration curve, which is drawn in previous chapter. The accuracy is +/-2.5%. Set the 8kHz
for amplitude response. Change the amplitude from 0.1 to 10g and check the accuracy (+/- 2.5%).
11.1.5
Envelope demodulation test
The envelope value is RMS value. Do not use comparing with peak values. Use the 8kHz pure sine
signal with 1g (100mV) amplitude. The ENV should display 1.33g +/- 2.5%.
11.2
Sensor Calibration
The calibration of the IRD511 Piezoelectric sensor supplied with the instrument or any other
vibration sensor out of the wide range of IRD500 Sensor Series can be done at the state of
the art Calibration Lab at IRD, Mumbai (Figure 31).
Figure 31 State of the art IRD Calibration Lab, Mumbai
This Lab has a state of the art TransCal system from Beran Instruments UK. It is an
automatic digital sensor calibration system. It undertakes calibration of a sensor throughout
condition management solutions
42
IRD449 VDSM O&M Manual
IRD Mechanalysis® Ltd
its frequency range. The master reference sensor is traceable to National Standards.
Calibration Certificates are generated and stored for each sensor tested. IRD has
constructed an environmentally controlled Lab environment for all sensor calibration tests.
This service could be availed by all users irrespective of sensor manufacturer. For each
calibrated sensor, a traceable calibration certificate is generated which is a full frequency
calibration with phase response depicted on the certificate. The certificate also lists down
the validity of the calibration, which is 12 months. Last but not the least; it states the
national standard to which the calibration is traceable. A typical certificate is reproduced in
Figure 32.
Further details could be obtained from our regional offices in the four metros, Works or
National Service Centre, Mumbai. The addresses and contact details are given at the start
of this manual.
Figure 32 A typical National Traceable IRD Sensor Calibration Certificate
condition management solutions
43
IRD Mechanalysis® Ltd
IRD449 VDSM O&M Manual
12. SPECIFICATIONS
12.1 IRD449 Vibration Diagnostic SmartMeter
The IRD449 is a portable multi-function SmartMeter that bridges the gap between the overall level
vibration meter and the advanced FFT data collector / analyser and associated analysis software.
It is a complete machine condition diagnostic tool that produces results on-site without the need
for a computer. It is designed for the technician, engineer and consultant who require portability,
ease of use and speed to identify prime machinery faults without taking expensive delicate
instruments to plant sites. It is the ideal replacement for the IRD838 basic analyser.
This single instrument undertakes overall Vibration Measurement, Three Band FFT
Spectrum, Time Wave Form, Diagnostics, Temperature, a Tacho for speed and
Stroboscope. In addition it incorporates a handy inspection torch.
The IRD449 caters to ISO 10816-3 with expert rules covering machinery health vibration levels:
that identifies prime machine faults: Unbalance, Looseness and Alignment. An anti-friction
bearing health level indication is also incorporated. Below is a selection of the many informative
screens available:
Set Up
Menu
RMS Vibration
& High Temp
3 Spectrum
Bands
Time Wave
Form
Fault
Diagnostics
3 Band
Alarms
Do your machines work under optimum conditions? The IRD449 will:
•
•
•
•
•
Determine the condition of your bearings, including slower-running rotors (120rpm)
Identify insufficiently lubricated bearings
Indicate unbalance, looseness, misalignment
Check machine speed, unbalance and alignment etc by built-in stroboscope
Measure in either Metric or English units
Operation of IRD449 is easily learned. The screen displays machine status in colours green,
orange and red. Determination of individual machine or bearings defect types is undertaken
directly during the measurement process without the need of a computer or software.
While the IRD449 is big in performance, it is compact, rugged and fits in the palm of the hand.
The model IRD449 takes a variety of measurements as selected:
•
•
•
•
Overall RMS and PEAK velocity (10 - 1000 Hz)
Overall RMS and PEAK acceleration (500 - 16 000 Hz)
Overall RMS and PEAK displacement (2 - 100 Hz)
Velocity Spectrum (200 Lines FFT)
The IRD449 is supplied complete with standard accessories: accelerometer, coiled cable, magnetic base, headphones and
carry case. The headphones enable one to listen to machinery noise related to vibration and effects of the process. When
measuring transmissions or slow-running bearings, the benefit of the headphone accessory is readily appreciated.
condition management solutions
44
IRD Mechanalysis® Ltd
IRD449 VDSM O&M Manual
TECHNICAL SPECIFICATION
Measurements:
Input
Input Range
- 1 x ICP powered accelerometer
- 60g PEAK, with standard 100mV/g sensor
- (e.g. for 600g PEAK 10mV/g senor, sensitivity is programmable in the IRD449.
DETECTION
RMS
PEAK
RMS
RMS
RMS
RMS
PEAK
Time Wave Form
FFT Spectrum
Temperature
UNITS
mm/sec, ips
mm/sec, ips
G
G
G
um, mil
um, mil
G
mm/s, ips
oC, oF
Display
Stroboscope
Torch
Output
Power:
Environmental
Packaging
FREQUENCY - RANGE
10-1,000 (opt. 1-1,000) Hz
10-1,000 (opt. 1-1,000) Hz
500-16,000Hz
1500-16,000Hz
5000-16,000Hz
2-200Hz
2-200Hz
500-16,000Hz
4-200Hz
0-380 oC, (32-716 oF)
DISPLAY
0-999
0-999
0-999
0-999
0-999
0-999
0-999
0-999
0-999
oC, oF
- Colour OLED, 128 x 128 pixels, diagonal 1.5” (38mm
- High intensity LED, 10 – 18000RPM (0.17-300Hz)
- High intensity LED
- 1 AC signal 8 Ω /0.5W for external headphones (signal listening)
- 2xAA 1.5V (alkaline, NiMH, LiFe), Battery condition indicated on meter display
- Operating temp -5°C to 50°C, Storage temp: - -20°C to 65°C
- Aluminium with dust and splash proof seal; quick access for change of batteries
Carrying case with internal protective foam
Weight & Dimensions
Instrument only:
Instrument with Accessories:
Dimensions (Instrument):
- 350g. (with batteries)
- 1 Kg. (complete with accessories in carrying case)
-150mm (L) × 60mm (W) × 35mm (H)
BILL OF MATERIALS
Model IRD449 Vibration Diagnostic SmartMeter
Sensor Accelerometer, model IRD511, 2-10KHz, 100mV/g, Top Exit, Mil 2 Pin, 1/4"-28UNF Female
Mounting Thread with National Traceable Cal. Cert.
Cable for model IRD449 Binder to accelerometer IRD511 expandable to 2.5m
Magnetic holder for IRD511 Accelerometer
Prod (Stinger) Al Straight for Sensor
Headphones with Ear Defenders
Carrying Case
Manual - Operating instructions in English and CD
Qty
1
Part Number
M449001
M5111005001000
1
1
1
1
1
1
M60164
M24746
M11030
M91208
M25352
M44999
IRD Mechanalysis® Ltd continues to be an industry leading provider of Condition Management
Solutions. With a heritage of over 60 years experience in machinery vibration and associated
technologies, IRD designs, manufactures and supports proven instrumentation suitable for harsh
industrial environments.
The Vibration People of IRD Mechanalysis can be contacted at the following branches or your local distributor:
Mumbai
Delhi
Kolkata
Chennai
International
1/5, Marol Co-op. Industrial
Estate Ltd, Off. Mathuradas
Vasanji Rd. Marol, Andheri
(East), Mumbai 400 059
Sagar Deep, Plot No.11
LSC Saini Enclave,
Vikas Marg
New Delhi 110 092
153/A, 2nd Floor
VIP Road
Kolkata 700 054
7-C, Chesney Nilgiri Apts
1/5, Marol Co-op. Industrial
65, Commander-In-Chief Rd Est. Ltd, Off. Mathuradas
Vasanji Rd. Marol, Andheri (E)
Chennai 600 105
Mumbai 400 059, INDIA
Tel: +91(0)22-2852-0178
Fax: +91(0)22-2852-1814
[email protected]
[email protected]
Tel: + 91(0)11-2237-3916
Fax: +91(0)11-2237-0778
[email protected]
Tel: +91(0)33-2355-2062
Fax: +91(0)33-2355-9214
[email protected]
Tel: +91(0)44-2823-0726
Fax: +91(0)44-2823-4702
[email protected]
Tel: +91-22-2852-0178
Fax: +91-22-2852-1814
[email protected]
®
IRD is the Registered Trademark of IRD Mechanalysis® Ltd.
condition management solutions
45
IRD Mechanalysis® Ltd
IRD449 VDSM O&M Manual
12.2 IRD511 Accelerometer Specifications
The IRD Mechanalysis model IRD511 is a standard accelerometer for measuring vibration on industrial rotating
machinery. It has a top exit Mil 2 Pin Connector. This sensor is primarily used with portable vibration meters. A
magnetic round base is available as optional accessory for portable vibration measurements.
Applications: Applies to most Process Plants using Compressors, Blowers, Conveyors, Cooling Tower Fans,
ID, FD, PA Fans, CW Pumps, Gear Boxes, Motors, Paper Machinery, Turbines etc.
Supplied Accessories
Qty
Part Number
Optional Accessories
Sensor Mounting Adaptor
Stud, M6
Calibration Certificate
Qty
1
M60154
1
CCIRD511
Cable 15 m Length with Mil 2Pin connector
Magnetic Portable Base,
IRD500 Series Accels
Part No.
M60048
1
M24828
Dimensions & Connections
Plan
View
Side
View
Pin A
18-30 Volts
Pin B
0 Volts
0.5-8.0mA
Current diode
Typical Connection
+18 to 30 Volts
2.2 F
Pin A
White
Sensor
Input
Volts out
A.C.
DC Bias
Readout /
Monitoring
System
470K
Pin B
Black
0 Volts
Technical Performance
Mounted Base Resonance
Sensitivity
Frequency Response
Isolation
Measurement Range
Transverse Sensitivity
22 kHz (nominal)
100 mVg + 10% Nominal 80 Hz at 22°C
2 Hz to 10 kHz ± 5%
0.8 Hz to 15 kHz + 3 dB
Base isolated
+ 80g
Less than 5%
Electrical
Electrical Noise
Current Range
Bias Voltage
Settling Time
Output Impedance
Case Isolation
0.1 mg max
0.5 mA to 8 mA
10 – 12 Volts DC
2 seconds
200 Ohms max
8
>10 Ohms at 500 Volts
Environmental
Operating Temperature Range
Sealing
Maximum Shock
Emissions
Immunity
-55 to 140°C
IP67
5000 g
EN61000-6-4:2001
EN61000-6-2:1999
Mechanical
Case Material
Sensing Element /Construction
Mounting Torque
Weight
Maximum Cable length
Connector
Mounting
Options
Stainless Steel
PZT / Compression
8 Nm
110 gms (nom)
1000 meters
2-pin Mil-C-5015
¼” – 28 UNF Female
Filters, Other sensitivities, Various connector assemblies
Other Mountings
condition management solutions
46
IRD Mechanalysis® Ltd
IRD449 VDSM O&M Manual
Mounting & Frequency Response
Part Number Selector
M = IRD Mechanalysis
Product Prefix
Cable/Conn Type
M
08 – Fire Retardant
connector
50 – Mil 2 Pin Connector
Integrated Cable Length
54 – M12 Connector
000 – not applicable
Product Series IRD511
Accelerometer Standard, Top Exit
5
1
1
1
0
0
5
0
0
1
0
0
Sensor Output
Mounting Threads
010 – 10 mV/g
030- 30 mV/g
01 – ¼”-28 UNF Female
02 – ¼”-28 UNF Male
050 – 50 mV/g
05 – Quick Fit Female
100 – 100 mV/g
250 – 250 mV/g
06 – M6X1mm Male
08 – M8X1.25mm Male
500 – 500 mV/g
10 – M10X1.5mm Male
0
12 – M12X1.75mm Male
Note on Sensor Output
•
•
•
•
•
Most machinery applications are suitably covered by a sensor with a sensitivity of 100mV/g. However, you may wish specify
different sensitivities because of the unique dynamic range of the particular machine to be monitored.
A high sensitivity sensor, 500mV/g or 1V/g would be used for those machines operating at low speeds (say below 600 rpm)
with high mass structures where vibration levels signals will inherently be of a low amplitude .
For high dynamic ranges such as a high speed gearbox, you would use a lower sensitivity e.g. as low as 10mV/g, 50mVg
etc.
To ensure sensors are matched to specialised applications we recommend a detailed vibration analysis is undertaken first
IRD Mechanalysis Consultancy Services can assist you in the best sensor solution.
The Vibration People of IRD Mechanalysis can be contacted at the following branches or your local distributor:
Mumbai
Delhi
Kolkata
Chennai
International
1/5, Marol Co-op. Industrial
Estate Ltd, Off. Mathuradas
Vasanji Rd. Marol, Andheri
(East), Mumbai 400 059
Sagar Deep, Plot No.11
LSC Saini Enclave,
Vikas Marg
New Delhi 110 092
153/A, 2nd Floor
VIP Road
Kolkata 700 054
7-C, Chesney Nilgiri Apts
65, Commander-In-Chief
Rd
Chennai 600 105
1/5, Marol Co-op. Industrial
Estate Ltd, Off. Mathuradas
Vasanji Rd. Marol, Andheri
(East), Mumbai 400 059 India
Tel: +91(0)22-2852-0178
Fax: +91(0)22-2852-1814
[email protected]
[email protected]
Tel: + 91(0)11-2237-3916
Fax: +91(0)11-2237-0778
[email protected]
Tel: +91(0)33-2355-2062
Fax: +91(0)33-2355-9214
[email protected]
Tel: +91(0)44-2823-0726
Fax: +91(0)44-2823-4702
[email protected]
Tel: +91-22-2852-0178
Fax: +91-22-2852-1814
[email protected]
[email protected]
®
IRD is the Registered Trademark of IRD Mechanalysis® Ltd
IRD Mechanalysis, an ISO9001:2008 company, continuously improves its products. It therefore retains the right to change the above specification without notice
condition management solutions
47
IRD Mechanalysis® Ltd
IRD449 VDSM O&M Manual
Keeping you going
13. Support Services
Keeping you going is a IRD
Mechanalysis® commitment. Product
support is an essential aspect of any
progressive
business.
IRD
Mechanalysis® Limited (IRD) is no
exception; the company has been
supporting former IRD, then Entek well
as IRD’s products for the past 25
years. Indeed the acceptance and
usage of these products by Indian
industry is directly attributed to the
dedicated support IRD has provided.
IRD continues to invest in Customer
Support. Just ‘keeping you going’ is
not enough; we have facilities to
National Service Centre, Mumbai
ensure
systems
match
world
standards. Our instruments and systems are calibrated to National Standards.
The very nature of industrial electronic instruments, both portable and permanent, demands
regular calibration. From time to time it becomes necessary to repair of damaged items
such as cables, sensors, power supplies and occasionally electronic circuitry etc. IRD
Mechanalysis® is well equipped for such eventualities
When equipment is in need of repair, a reliable repair centre that is responsive, convenient,
and cost effective is required. IRD Mechanalysis® Ltd offers in-house as well as site
calibration (traceable to National Standards) and repair services. This also covers our
partner’s product range; IRD also supports many obsolete products where components are
still available or have been indigenised.
As the original equipment manufacturer (OEM), we are the most knowledgeable and the
qualified to service our products. Supported by more than 50 combined years of technical
service experience, our repair technicians provide the highest quality service for your IRD
products. At our National Service Centre in Mumbai we stock a comprehensive supply of
spare parts to ensure a quick turnaround.
13.1
BENEFITS and FEATURES
For IRD Mechanalysis® Ltd’s customers, the National Service Centre offers the following:
•
•
•
•
•
•
•
•
•
Fast in-house turnaround options
Expert factory technical assistance
Industry competitive repair charges
In-house calibration of vibration sensors (traceable to National Standards)
Regular cleaning and calibration to extend product life and reliability
Instrument hire during repair period to minimize programme interruption
1 Year warranty on Product Exchange Programme
Fixed Price Repair – Whole Product 3 months warranty
90-day parts warranty on all repair and calibration services
condition management solutions
48
IRD449 VDSM O&M Manual
13.2
IRD Mechanalysis® Ltd
PRODUCTS SUPPORTED
The National Service Centre has the capability to support the following products:
•
Data Collectors: IRD817, IRD818, IRD890, IRD Fast Track®, dataPAC®1000,
dP1250, dP1500; Enpac® series. Also Commtest VB series of vibration analysers
and profiler
Portable Instruments: IRD306, MIL306, MIL306C, MIL306D, MIL306DD, IRD308,
IRD350, IRD355, IRD360, IRD810, IRD811, MIL811, MIL811D, IRD820, IRD838,
IRD870, IRD880, IRD885
Protection Monitors: 5802, 5806, 5815, 5915, 5800 Cards, 6100, 6600 Series,
MIL8700 Series, MIL8800 Monitor
Machinery Diagnostic Systems: Beran 766, 767, 768
Machinery Protection Transmitters: IRD7100 Series, IRD7200 Series, IRD7300
Series
Balancing Systems: 245, 246, MILB50 and MILB150
•
•
•
•
•
TM
dataPAC, Enpac, and Fast Track are trademarks or registered trademarks of IRD Mechanalysis
Turnaround time and repair capabilities are dependent upon condition of equipment and
spare parts availability at the time of the product assessment.
13.3
How the National Service Centre Optimises Clients Investments
•
Annual Maintenance and Calibration ensures years of trouble free operation to
maximize the investment in your condition monitoring equipment.
•
A complete in-house supply of spare parts assures quick turnaround for product
repairs.
•
State of the art Sensor Calibration automatically over the full frequency range traceable
and up to date to National Standards of the UK.
•
IRD Mechanalysis® Ltd’s ISO 9001 certification guarantees quality repairs and service.
•
Our highly qualified Repair Centre technicians, supported by more than 50 combined
years of technical service experience, give you the best available service and results.
•
As the only authorized service centre for IRD Mechanalysis Ltd Products, our National
Service Centre provide the most knowledgeable, experienced and committed support
for all of our products.
•
We offer a IRD Product Exchange Programme, Fixed Price Repair or Standard Repair
and Calibration Only Services: the applicable warranty benefits are given below:
condition management solutions
49
IRD Mechanalysis® Ltd
IRD449 VDSM O&M Manual
Service Options & Process
RMA issued:
Instrument arrives
at NSC
13.4
Calibrate
it ?
Fixed Price
Repair ?
Exchange
Unit ?
Repair
Specific Fault ?
ISO9000
Requirement
3 month
Warranty
12 month
Warranty
3 months Parts
Warranty
HOW TO GET SERVICE?
1. Before dispatching any instrument, cable, sensor etc it must be given an RMA
number issued by the NSC, see below
2. For a Return Material Authorization number (RMA) this can be downloaded from our
web site: www.irdmechanalysis.com
3. To discuss any instrument servicing issues please call Tel: +91(0)22-2852-0178 or
one of our Regional Offices
4. Alternatively Email us at : [email protected]
5. Complete the RMA and fax back to IRD Mechanalysis® at Fax: +91(0)22-2832-1814
6. When the RMA has been issued, the Client sends the instrument with all
accessories together with the Purchase Order making reference to the RMA
Number.
7. Upon receipt, IRD will evaluate the instrument and make a recommendation to the
Client (if no instructions on type of service have been received earlier).
8. Only when the repair has been completed and payment has been received, will the
instrument be returned to the Client.
9. Warranties will apply depending on the Repair Category option
LOCATIONS
National Service Centre
1/5, Marol Co-op. Industrial Estate Ltd,
Off. Mathuradas Vasanji Rd,
Marol
Andheri (East)
Mumbai
400 059
INDIA
Tel: +91(0)22-2852-0178
Tel: +91(0)22-2859-6214 / 6573
Fax: +91(0)22-2832-1814
Email: [email protected]
Email: [email protected]
Head Office (Registered)
47 – 48 Jolly Maker Chambers II
Nariman Point
Mumbai
400 021
INDIA
Tel: + 91(0)22-2202-7430
Fax: +91(0)22-2285-0480
Email: [email protected]
www.irdmechanalysis.com
condition management solutions
50
IRD Mechanalysis® Ltd
IRD449 VDSM O&M Manual
RMA (Return Materials Advisory) Form
ATTN: IRD Mechanalysis Ltd, National Service Centre, 1/5 Marol Co-op, Industrial Estate Ltd, Off
Mathurdas Vasanji Road, Marol, Andheri (E), Mumbai 400 059, India. +91(0)22-2852 0178 / 2906
FAX BACK RMA FORM: +91(0)22-2852 1814 or Email to : [email protected]
Product Model:
Serial No:
Fault details (if applicable):
Please tick appropriate box
Warranty
Calibration
Fixed Price Repair
Exchange Units
Standard Repair
This is to advise that we are planning to dispatch the above instrument for Calibration /
Repair,
as detailed above, on (date):______________________
Customer’s Purchase Order No:
P.O. Value: Rs. (if agreed)
AMC Contract No (if applicable):
Date:
A purchase order must be provided before inspection will commence unless an AMC Contract
is in place.
When NSC receives the Return Material Authorisation it will issue an RMA number. Only then
send in the instrument with its RMA Nos tagged on the instrument for tracking purposes. A PO
must accompany the instrument referencing the RMA Nos.
Please complete the details below to enable us to process your requirements as quickly as
possible.
MUST BE COMPLETED IN ALL CASES
Invoice Address
Delivery Address
Company:
Department
Address:
Company:
Department
Address:
City
State
PIN
Contact Name:
Telephone:
Mobile:
Fax:
Email
City
State
PIN
Contact Name:
Telephone:
Mobile:
Fax:
Email
Users Name:
Designation
Signature
Date
NSC RMA NUMBER ISSUED:
RMA/
condition management solutions
51
IRD Mechanalysis® Ltd
IRD449 VDSM O&M Manual
Taking you Further
14. Vibration Based Condition Monitoring Solutions
IRD Mechanalysis Ltd (IRD) is a leading provider of condition management solutions with
35 years’ experience in machinery vibration measurement. IRD is credited with pioneering
the concept of vibration based condition monitoring programmes in India. With the advent
of computerization, IRD has established and maintained over 250 automated vibration
based CM systems and has a user base of over 2200 major Producers and OEMs in India.
IRD will continue to introduce new technologies to match your needs and reduce the cost
of Condition Management. IRD is now rapidly expanding its International Export Division
globally.
We take you further by providing reliable, easy to use, rugged and a comprehensive range
of vibration monitoring products & solutions (as depicted in the chart given below) and
enable you to enhance your productivity and investment. We look forward to your
continued support and patronage.
MONITORING
SOLUTIONS
OFF-LINE
METERS
ON-LINE
FFT
ANALYSER
PROTECTION
Overall
Vibration Levels
Volume
Data Collector
Sound & Noise
Level
Two Channel
Vibration
Analyser
2 Plane Balancing
Bearing
Demodulation
or gSE & Leak
Detection
AE Bearing &
Lubrication
Distress
Fixed, Variable &
Very Low RPM
SERVICE
TRAINING
CALIBRATION
CONSULTANCY
COMMISSIONING
Four Channel
Vibration Analyser
4 Plane Balancing
Decision
Support
Diagnostics
TRANSMITTER
Multi- Channel
API670
Compliant
Single & Dual
Channel
Fibre Optics
Vibration &
Temperature
Multi-Channel
Simultaneous
Diagnostics
SURVEILLANCE
Vibration
Protection
to 4-20mA
Vibration Signal
to 4-20mA
Intelligent
Machine
Condition
Network
Software
WAN& LAN
32 Channel+
Surveillance
Pods
Distress
Monitoring on
Variable Speed
Machines
System
Integrates
with Data
Collectors
********************************************************************************
condition management solutions
52