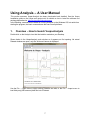
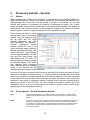
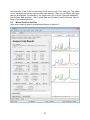
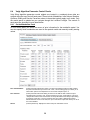
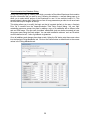
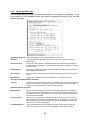
1
Vespa – Analysis User Manual and Reference Version 0.8.4 Release date: June11th, 2015 Developed by: Brian J. Soher, Ph.D. Philip Semanchuk Duke University Medical Center, Department of Radiology, Durham, NC Karl Young, Ph.D. David Todd, Ph.D. University of California, San Francisco Department of Radiology, San Francisco, CA Developed with support from NIH, grant # EB008387-01A1 1 Table of Contents Overview of the Vespa Package ................................................... 4 Introduction to Vespa-Analysis ...................................................... 5 Using Analysis – A User Manual ................................................... 7 1. 2. Overview – How to launch Vespa-Analysis ..................................................... 7 The Analysis Main Window ............................................................................. 9 2.1 2.2 2.3 2.4 2.5 2.6 3. Processing Sub-tab – Raw ............................................................................ 16 3.1 3.2 4. General ..............................................................................................................19 On the Spectral – General Parameters Sub-tab .................................................19 Mouse Events in the General Parameters Plot ...................................................21 Eddy Current Correction Control ........................................................................21 Signal Filtering Control .......................................................................................21 On the Spectral – SVD Filter Parameters Sub-tab .............................................22 Mouse Events in the Spectral – SVD Filter Parameters Plot ..............................24 Processing Sub-tab – Fitting ......................................................................... 25 6.1 6.2 6.3 6.4 7. General ..............................................................................................................17 Summed FID Preprocess Sub-tab .....................................................................17 Processing Sub-tab – Spectral ...................................................................... 19 5.1 5.2 5.3 5.4 5.5 5.6 5.7 6. General ..............................................................................................................16 Raw Data Sub-tab..............................................................................................16 Processing Sub-tab – Preprocess ................................................................. 17 4.1 4.2 5. The Dataset Notebook .......................................................................................10 Dataset Tabs .....................................................................................................10 Mouse Events in Plots .......................................................................................12 User Defined Prior Spectrum Dialog ..................................................................13 User Defined Metabolite Information Dialog .......................................................14 Dataset Presets Menu .......................................................................................15 Fitting Method – Voigt ........................................................................................25 Voigt Fitting Sub-Tab .........................................................................................26 Mouse Events in the Plot ...................................................................................27 Voigt Algorithm Parameter Control Panels .........................................................28 Results Output .............................................................................................. 38 7.1 7.2 Plot results to image file formats ........................................................................38 Plot results to vector graphics formats ...............................................................38 Appendix A. Tutorials .................................................................. 39 A.1 Importing a data file into a dataset ................................................................ 39 2 A.2 A.3 A.4 A.5 A.6 Importing multiple files into a datastack ........................................................ 40 Opening and comparing multiple datasets .................................................... 41 Applying ECC correction using an associated dataset .................................. 42 Interactive SVD filtering of unwanted signals ................................................ 43 Example of a fitted short TE PRESS data set ............................................... 44 Appendix B. Importing Data into Vespa ...................................... 46 Appendix C. Supported Data Formats ........................................ 47 3 Overview of the Vespa Package The Vespa package enhances and extends three previously developed magnetic resonance spectroscopy (MRS) software tools by migrating them into an integrated, open source, open development platform. Vespa stands for Versatile Analysis, Pulses and Analysis. The original tools that have been migrated into this package include: GAVA/Gamma - software for spectral simulation MatPulse – software for RF pulse design IDL_Vespa – a package for spectral data processing and analysis The new Vespa project addresses current software limitations, including: non-standard data access, closed source multiple language software that complicates algorithm extension and comparison, lack of integration between programs for sharing prior information, and incomplete or missing documentation and educational content. 4 Introduction to Vespa-Analysis Vespa-Analysis is an application written in the Python programming language that allows users to interactively read, process and analyze MR spectroscopic data. Analysis allows users to: 1) Read one or more single voxel data files from various standard formats. 2) Perform typical spatial and/or spectral Fourier processing steps. 3) Apply HLSVD methods to remove unwanted signal components. 4) Apply iterative time domain + frequency domain metabolite and baseline models to fit MRS data and estimate metabolite signal areas. 5) Observe graphically the results of processing steps ‘on the fly’. 6) Store processed results and processing settings into a human readable XML format. 7) Do side-by-side comparison of results from two or more data sets. 8) Output results in text or graphical format 9) Exchange data and processing settings between users. What is a Dataset? A ‘Dataset’ consists of one or more raw single voxel data sets. Single voxel data can be ‘stacked into the screen’ by selecting multiple files or from a single file with multiple 1D data sets stored in a 2D format. All Datasets can be traversed using a simple voxel widget selectors. The ‘Dataset’ also contains information about all processing steps that have been performed on the data. What is the Dataset Notebook? This is the main window of the Analysis application. It contains one or more tabs, each of which contains the data and processing for an entire Dataset. Multiple Datasets can be loaded into the tabs of the Analysis application, but all the data loaded must have the same spatial and spectral dimensions. This is necessary to allow proper comparison between tabs. Datasets are processed through a progression of pipeline steps which are shown as sub-tabs of the Dataset tab. These sub-tabs currently include ‘Raw Data’, ‘SVD’, ‘Spectral’, and ‘Fitting’ steps, although only the raw data and spectral tabs are required. Each processing tab contains a series of processing steps, known as its functor chain, and also maintains the current state for 5 all processing parameters within its widgets. Upon output, a full provenance for parameters and functor algorithms applied to the data is created as part of the Analysis XML output data format. A variety of graphical and text-based methods are available for saving results, as well. The following chapters run through the operation of the Vespa-Analysis program both in general and widget by widget. In this manual, command line instructions will appear in a fixed-width font on individual lines, for example: ˜/Vespa-Analysis/ % ls Specific file and directory names will appear in a fixed-width font within the main text. References: Examples of spectral analysis using simulated spectral priors: Young K, Govindaraju V, Soher BJ and Maudsley AA. Automated Spectral Analysis I: Formation of a Priori Information by Spectral Analysis. Magnetic Resonance in Medicine; 40:812-815 (1998) Young K, Soher BJ and Maudsley AA. Automated Spectral Analysis II: Application of Wavelet Shrinkage for Characterization of Non-Parameterized Signals. Magnetic Resonance in Medicine; 40:816-821 (1998) Soher BJ, Young K, Govindaraju V and Maudsley AA. Automated Spectral Analysis III: Application to in Vivo Proton MR Spectroscopy and Spectroscopic Imaging. Magnetic Resonance in Medicine; 40:822-831 (1998) Soher BJ, Vermathen P, Schuff N, Wiedermann D, Meyerhoff DJ, Weiner MW, Maudsley AA. Short TE in vivo (1)H MR spectroscopic imaging at 1.5 T: acquisition and automated spectral analysis. Magn Reson Imaging;18(9):115965 (2000). Online Resources: The Vespa project and each of its applications have Trac Wiki sites with extensive information about how to use, and develop new functionality for, each application. These can be accessed through the main portal site at http://scion.duhs.duke.edu/vespa/ 6 Using Analysis – A User Manual This section assumes Vespa-Analysis has been downloaded and installed. See the Vespa Installation guide on the Vespa main project wiki for details on how to install the software and package dependencies. http://scion.duhs.duke.edu/vespa. In the following, screenshots are based on running Analysis on the Windows OS, but aside from starting the program, the basic commands are the same on all platforms. 1. Overview – How to launch Vespa-Analysis Double click on the Analysis icon that the installer created on your Desktop. Shown below is the Vespa-Analysis main window as it appears on first opening. No actual Dataset windows are open, only the ‘Welcome’ banner is displayed. Use the File → Open menu to open existing Datasets into tabs, or the File → Import menu to load third party (MR scanner) data files into a Dataset. 7 Shown below is a screen shot of a Vespa-Analysis session with two Dataset tabs opened side by side for comparison. Note that the data from Dataset2 has also been selected to be displayed in PlotB of Dataset1. The difference between the top and middle plots of Dataset1 is shown in the bottom plot. Also note that while Dataset1 tab has a SVD sub-tab, the Dataset2 tab does not, and similarly for the Fitting sub-tab in Dataset2. The functionality of all processing tabs will be described further in the following sections. 8 2. The Analysis Main Window This is a view of the main Vespa-Analysis user interface window. It is the first window that appears when you run the program. It contains the dataset Notebook, a menu bar and status bar. The dataset Notebook can be populated with one or more dataset tabs, each of which contains input data and results from one dataset. As described above, a Dataset is comprised of raw data plus a number of blocks of processing. Each processing block has its own sub-tab in the respective dataset tab. Sub-tabs are organized along the bottom edge, while dataset tabs are organized along the top edge. The dataset Notebook is initially populated with a welcome text window, but no datasets are loaded. From the File menu bar you can 1) open a dataset that has previously been processed by Analysis and then saved into the Analysis VIFF XML format, or 2) import data from a variety of MRS formats into a new dataset. In either case a tab will appear for each dataset that is opened or imported. The Processing menu allows users to add certain processing sub-tabs to each dataset that is opened such as for SVD analysis or for timedomain/frequency-domain metabolite fitting. The View menu items set the plotting options for whichever sub-tab is active. The Help menu provides links to useful resources. The status bar provides information about where the cursor is located within the various plots and images in the interface throughout the program. During plot zooms or region selections, it also provides useful information about the cursor start and end points and the distance between. Finally, it also reports short messages that reflect current processing while events are running. On the Menu Bar File→Open Opens an existing VIFF dataset XML file into a new dataset tab in the dataset Notebook. The state of the dataset as it was saved, including all sub-tabs and results, are restored as the dataset is opened into its tab. File→Import→<various> This will allow the user to select one or more MRS data file, from a variety of data formats, that can be imported into the Analysis program and concatenated into a new dataset Tab. More information about importable data formats is given below. File →Save Saves the state of the dataset as it currently exists, including all sub-tabs and results, into a VIFF (Vespa Interchange File Format) XML file. File →Close Closes the active dataset tab. File→Presets→LoadFromFile Load parameter settings from a file and apply to the dataset in the active Tab. File→Presets→SaveToFile Save parameter settings from the dataset in the active Tab to a VIFF file. File →Exit Closes the application window. 9 Processing →Add Voigt Fitting Tab Adds a Voigt model fitting sub-tab to the active dataset tab. Processing →Edit User Spectral Information… Launches a modal dialog in which the user can create a simplified representation of the spectral lines in the data. User can add and delete lines of various line width, area and ppm location. This spectrum is used in automated B0 shift and Phase 0/1 estimation routines. Parameters for these routines can also be set in this dialog. See Section 2.4 for details. →Edit User Metabolite Information… Launches a modal dialog in which the user enter general information about the metabolites that might be used in the program, such as Full_Names, Abbreviations, Number of Spins, and Literature Concentration and T2 Decay values. User can add and delete metabolite info lines. Note – changes only take effect when user hits the OK button. No changes are applied if user hits Cancel. View→<various> Changes plot options in the plots on each sub-tab of the active dataset tab, including: display a zero line, turn x-axis on/off or choose units, select the data type (real, imag, magn) displayed, and various output options for all plot windows. Help→User Manual Launches the user manual (from vespa/docs) into a PDF file reader. Help→Analysis/Vespa Online Help Online wiki for the Analysis application and Vespa project Help→About 2.1 Giving credit where credit is due. The Dataset Notebook The dataset notebook is an “advanced user interface” widget (AUINotebook). What that means to you and me is a lot of flexibility: Multiple tabs can be opened up inside the window. They can be moved around, arranged and “docked” as the user desires by left-click and dragging the desired tab to a new location inside the notebook boundaries. In this manner, the tabs can be positioned side-by-side, top-to-bottom or stacked (as shown in Section 1). They can also be arranged in any mixture of these positions. There is only the one Notebook in the Analysis application, but it can display multiple MRS data sets by loading them into Dataset tabs. 2.2 Dataset Tabs The dataset notebook can be populated with one or more dataset tabs, each of which contains the data, setting, and results of one dataset. Tabs for datasets are arranged along the top of the notebook and can be grabbed (left-click and drag) and moved to different locations inside the notebook as you like. Tabs can be closed using the X box on the tab or with a middle-click on the tab itself. When a tab is closed, the dataset is removed from memory, but can be restored to its current state at a future time - assuming it was saved to Analysis VIFF format. Each dataset tab has one or more sub-tabs that represent blocks of processing. Dataset tabs are automatically populated with a 10 ‘Raw’ sub-tab, which reflects the import and organization of one or more MRS file(s) into the Analysis program, and a ‘Spectral’ tab, in which a variety of time and frequency domain spectral processing steps can be applied. Other types of tabs which can be added interactively by the user include those for fitting a spectral model to metabolites in the data. Each processing subtab is described in more detail in the following section. The figure right shows an Analysis application with two datasets open in the notebook. The active dataset tab has two processing sub-tabs open, Raw and Spectral, and the Spectral sub-tab is active. A new dataset tab is typically created by importing an MRS data file and then processing it tab by tab to create the desired results. Dataset are only saved to file when specifically requested by the user. On selecting File → Save, the current state of the dataset, ie. all data, settings and results in all tabs, is saved into a file in the Vespa Interchange File Format, or VIFF. This file can be updated when desired by the user by again hitting Save, or a new filename can be used to save different states in different files. When a VIFF file is opened in Analysis, all tabs and results are restored to the state they were in upon save. Each processing sub-tab display the filename of the displayed data, the x-voxel index, and the y-scale of the plot in the sub-tab. As discussed in more detail in the following section, one or more MRS files can be loaded into a single dataset tab. When multiple files are selected, the dataset organizes them by stacking the data “into the screen”. You can step through each spectrum in the dataset by increasing or decreasing the index in the ‘x-voxel’ widget. Parameter values specific to each spectrum are automatically updated in the widgets of each sub-tab. The View menu on the main menu bar can be used to modify the display of the plots in the active sub-tab. The state of plot options in each sub-tab is maintained in each sub-tab as the user switches between them. The following lists the functions on the View menu item: On the Menu Bar View (this menu affects the plots in the currently active Dataset tab) →ZeroLine→Show toggle zero line off/on →ZeroLine→Top/Middle/Bottom display the zero line in the top 10% region, middle or bottom 10% region of the canvas as it is drawn on the screen →Xaxis →Show display the x-axis or not →Xaxis→PPM/Hz x-axis value in PPM or Hz →Data Type select Real, Imaginary, or Magnitude spectral data to display →Area Calc→Plot A/B/C when the right mouse button is used to define a region along the x-axis, the status bar displays the area in the plot between the start/end of this region. This option selects whether the area is calculated from plot A, B or C. →Plot C Function the plot in the bottom canvas (aka plot C) of the spectral sub-tab can be either None, A-B or B-A. If ‘None’ is selected, plot C is not displayed on the canvas →User Button Function User can select different functionality button at lower left in General Param tab →Auto Phasing Applies an algorithm to automatically phase data in plot →Output Area Value Writes areas under curve and between span selectors to a CSV text file selected by the user. If file already exists, the values are appended. →Output→View→<various> writes the entire plot to file as either PNG, SVG, EPS or PDF format →Output→PlotA→<various> [Spectral sub-tab only] writes the values of the complex64 array displayed in PlotA (top plot) into either an ASCII or binary file using the numpy.tofile() method. User is prompted for a filename. The entire vector in the plot is saved, not just the zoomed in portion (if zoom is applied). Note this functionality is provided as a convenience to users only. This output format is not crossplatform compatible and can not be read back into Analysis 11 2.3 Mouse Events in Plots Most processing sub-tabs have plots in their right hand panels. These plots may contain one or more axes which may change dynamically. For example, the SVD pane always has three axes displayed, but the Spectral tab may have one, two or three axes drawn. We will typically refer to these as top, middle and bottom plots, OR as Plot A, Plot B and Plot C respectively. You can control a number of functions by using your mouse interactively within the plot area of most sub-tabs. Vespa-Analysis is best used with a ‘two-button’ mouse that has a roller ball, but can also work fine with a ‘two-button’ mouse, as most mouse-driven features for the roller ball also have a corresponding widget that can be clicked on or typed in to cause the same effect. The following describes the typical actions that can be effected using the mouse in a plot window. Any variations from this will be noted in the following sub-tab sections. The mouse can be used to set the X-axis and Cursor values in sub-tab plots. Where there are two or more plots, the same X-axis or Cursors are set on all three. The left mouse button sets the X-axis zoom range. Click and hold the left mouse button in the window and a vertical cursor will appear. Drag the mouse either left or right and a second vertical cursor will appear. PPM value changes will be reflected in the status bar. Release the mouse and the plot will be redisplayed for the axis span selected. This zoom span will display its range in a pale yellow that disappears when the left mouse is released. Click in place with the left button and the plot will zoom out to its max x- and y-axis settings. In a similar fashion, two vertical cursors can be set inside the plot window. Click and drag, then release, to set the two cursors anywhere in the window. This cursor xpan will display as a light gray span. Click in place with the right mouse button and the xursor span will be turned off. The cursor values are used to determine the “area under the peak” values that are displayed in the status bar. While performing a right-click and drag to create a cursor span the status bar will also display the start/end location of the span and the delta Hz and delta PPM size of the span. The roller bar can be used to increment/decrement the Y-axis scale value. A maximum value for the Y-axis scale is determined the first time a dataset is loaded and displayed. That max value is the value displayed in the scale widget (top right in the dataset) and used when you zoom all the way out. As you roll the ball up/down (or you click on the SpinCtrl widget next to the scale field) the scale value changes and the plot is updated. (Note. It may be necessary to actually click in the plot window to move the focus of the roller ball into the plot, before the roller ball events will be applied to the Scale value.) Roller balls can typically be used also as a ‘middle button’ but pushing down on it without rolling it up or down. You can click and drag the middle button in a plot to change the values of the zero and first order phase (Phase0/1) of the data plotted in the window. Note that the Phase0/1 value that is set in any sub-tab is also updated in all other sub-tabs (and store internally in just one location). Thus, there is effectively only one Phase0/1 regardless of however many plots and sub-tabs there are in a dataset. Click and release the left mouse button in place and the plot will zoom out to its max setting. Click and release the right mouse button in place and the cursor span will be turned off 12 2.4 User Defined Prior Spectrum Dialog This dialog is a bit of a catch-all for spectral information that is user-derived (or at least user editable) but that needs to be available for use in processing sub-tabs. As of this release, this dialog contains the User Defined Prior Spectrum (a.k.a. User Prior) control panel. This is shown in the figure right and described in more detail in the following paragraph. The User Prior control panel allows you to manually create prior information about the structure of the data to be analyzed that will enable automated B0 shift and Phase 0/1 routines to better estimate these values. The methods used in the automate phase and B0 shift routines need a model spectrum to compare to the corrected phased data. It is often not desirable to have a full blown model such as would be provided by the metabolite prior information (i.e. We may not want multiplet resonance structures). Often a simpler model is more effective, such as one that only contains singlets or other prominent metabolite features. The plot to the right displays the spectrum you are designing. The top plot shows each individual line you add. The bottom plot shows the sum of all lines. You can zoom in/out of this plot the same as described in Section 2.3. You will likely need to zoom in to clearly see the lines you are creating. 2.4.1 On the User-Defined Prior Spectrum Dialog Model Lines Use the Add and Delete buttons to create however many lines you want in your AutoPrior spectrum. As you change values in the PPM, Area, Phase and Linewidth controls, this will be reflected in the plotted spectra. Restore Defaults (button) Resets the Model lines to a set of default 1H values (ie. NAA, Cr, Cho singlets). Algorithm Parameters Auto B0 Range (spin controls) This is the range over which the B0 shift is optimized. Auto Phase 0 Range (spin controls) This is the range over which the zero order phase is optimized Auto Phase 1 Range (spin controls) This is the range over which the first order phase is optimized. Phase 1 Pivot (spin control) float, ppm. This is the pivot point used in the phase 1 calculation. 13 2.5 User Defined Metabolite Information Dialog This dialog contains metabolite information that is typically user-derived (or at least user editable) but that needs to be available for use in processing sub-tabs. The widget is shown in the figure right and described in more detail in the following paragraph. User Defined Metabolite Information dialog allows you to provide information about the metabolites to be analyzed in the application. The Metabolite Full Name (unique value) and Abbreviation (non-unique value) allow you to map metabolites created and used in VespaSimulation Experiment that have nonstandard Full_Name. For example, you might have created a slightly changed version of myo-inositol called “mIns_bob”. In this dialog, you would hit Add Metabolite and fill in “mIns_bob” as Full Name and then put “m-ins” into the Abbreviation field. Vespa-Analysis would then know to use the myo-inositol initial values algorithms when fitting your data. The Number of Spins field accepts only integer values 1 or greater. These are used to map peak search peak heights to starting areas based on simulation peak areas normalized to the number of spins in a peak. For example, if a creatine simulation had a single peak with 3 protons and also a choline simulation that contained 9 spins, then the areas would differ by a factor of three to have initial peaks that were approximately the same height. The Literature Concentrations are in milli-molar values. These get used in Fitting initial values routines where there are no distinct peaks that can be searched for by a metabolite (e.g. taurine). In this case the program has the option to create starting values that are in proportion to literature NAA values. The Literature T2 Decay values are planned for use in constraining the exponential decay parameter in the Voigt line model, but this is currently under construction. When finished, the T2 Decay value listed here will serve as a default value for a given metabolite when it is read in as a part of a basis set. 2.5.1 On the User-Defined Metabolite Information Dialog Metabolite Lines Use the Add and Delete buttons to create however many lines you want. Each line contains an entry for a unique Metabolite Full_Name, a non-unique Abbreviation, integer Number of Spins, and floating point Literature values for Concentration in mM and T2 Decay in ms. Changes will not take effect until use selects the OK button. Select All (button) Marks all check boxes at left side of Metabolite Lines as On. De-Select All (button) Marks all check boxes at left side of Metabolite Lines as Off 14 Add Metabolite (button) Adds a Metabolite Line to the bottom of the list box. Populates all entries with default values. Remove Selected (button) Deletes all currently selected lines in the Metabolite Lines list and adjusts widget size as needed. OK (button) Saves all values into the Metabolite Information object used in the main program and quits the dialog. Cancel (button) Quits the dialog without saving any changes to the main program. 2.6 Dataset Presets Menu The FilePresets menu allows users to save dataset processing settings to a file, or retrieve processing settings from a file. In both cases, Save or Load, it is the active dataset tab that is being acted upon. Be sure to select the one that you want before using the Presets menu. Preset files are created from a dataset in an existing tab. Preferably, one in which processing and/or fitting are going well. When you have all the widgets set the way you want them, you select FilePresetsSave to File and give the preset file a name. Conversely, to use a Preset file, you load your dataset into a tab first, and then go to FilePresetsLoad from File and select the Preset file you want to apply. Settings are then applied to the active dataset tab. When you save processing values to a Preset file, only the ‘input’ parameters for each processing tab are saved. And only general parameter values are saved, no dataset specific values or results are saved. For example, if you have an ECC (eddy current correction) algorithm selected in the Spectral tab that also has a specific water spectrum dataset selected, the algorithm selection would be saved to the Preset file, but the water spectrum dataset value would be left blank. In using the Preset file, you would load it and then have to go and select a specific water spectrum in the Spectral Tab for the algorithm to use on the active dataset. The one exception to the ‘No dataset specific data’ is in the Spectral Tab, where the B0 frequency shift and zero and first order phase values are also used as inputs to the Fitting Tab. These three Spectral parameters are saved into a Preset file as arrays, but if their array shape (ie. The number of voxels) is different from the array shape for the dataset into which they are next loaded, then these values are set to 0.0 and do not act as preset values for that dataset. Preset files are stored as VIFF (Vespa interchange file format) XML format. They are actually XML representation of ‘dataset’ objects just like are stored when you save Analysis results from the FileSave menu. The only difference is that the ‘behave_as_preset’ flag is set to true, and as stated above, no data/results are stored. It is possible for a user to inadvertently select one of these files to try to load it back in as a Dataset, rather than as a Preset. In this case, an error dialog will be displayed. 15 3. Processing Sub-tab – Raw 3.1 General When a dataset tab is added to the Notebook, it automatically has two sub-tabs added to it called Raw and Spectral. The Raw tab contains information about the data that was imported into the Analysis program. Due to the variety of MRS single-voxel spectra (SVS) data formats, we have created Appendix B to provide information about the details of each format. 3.2 Raw Data Sub-tab The Raw tab is used to display data file names and header information. Standard raw data formats can typically be loaded as one or more files. If multiple files are selected, then the data is loaded “into the screen” and you can move navigate through the stack of SVS data using the Location–X widget (top right). The filenames of all the data loaded are displayed in the list on the right side of the sub-tab. When you click on a filename, the corresponding header information for that file is displayed in the text box on the right side of the sub-tab. Plot Information: There is NO plot in this tab because there are no processing steps. (Note. The raw data can typically be viewed in the Spectral tab by turning off all processing and scaling the plot to display the FID data) On the Standard Raw Data Sub-tab Filenames (list select) list of filenames for the one or more SVS data files loaded into this dataset. Header information (text box) header data for the filename selected in the Filenames list. 16 4. Processing Sub-tab – Preprocess 4.1 General When a dataset tab is added to the Notebook, it automatically has two sub-tabs added to it called Raw and Spectral. The Raw tab contains information about the data that was imported into the Analysis program. In some cases, it is necessary to further process the Raw data in order for it to be processed by the Spectral sub-tab. This is the case for data that needs preprocessing to combine raw data from multiple files into a single SVS data FID. We call this the Summed FID Preprocess sub-tab. 4.2 Summed FID Preprocess Sub-tab When SVS data is saved as individual FIDs it needs to be added together to form the summed single FID that is the actual raw data for the dataset. In some cases, the quality of the data can be improved by adjusting the frequency shift and/or phase each FID prior to summing. In this case the data is opened into the Raw sub-tab shown right. For summed FID data files, only one SVS voxel can be loaded into a dataset. This is because you usually have to select multiple files, each of which contains one FID to be summed. Thus it would be unclear which files were FIDs to be summed and which files were to be loaded “into the screen”. The panel on the left of the Preprocess sub-tab contains controls that set the parameters for routines that sort the data and apply frequency shift and phase corrections to each FID prior to summing. You can navigate through the FIDs using the FID index widget. The action for other controls are listed below. Plot Information: This Preprocess sub-tab contains a plot because pre-processing occurs to sum the FIDs into the SVS data to be processed in the dataset. The top plot if for data from a single FID, as selected by the FID index control. Peak shift and phase 0 values are updated in their controls as you change this index. The bottom plot is the sum of all FIDs with the peak shift and phase 0 corrections applied as they are currently stored. Mouse controls in the plot act as described in the previous section, except that the only phase 0 can be applied to the FIDs and this phase 0 value is only applied in this sub-tab. The phase 0 value used in all other processing sub-tabs is not changed by mouse or widget events in this sub-tab. Peak shift and phase 0 values can be edited manually in the control panel. Phase 0 can also be edited using the mouse. If you start your phase 0 mouse event in the top plot (single FID), then the phase 0 value for only that FID is changed. If you start your phase 0 mouse event in the bottom plot (summed FIDs) then all FID phase 0 values are changed by a delta phase 0 amount 17 caused by the mouse motion. In both cases, the summed FID plot is updated after each mouse (or control widget) event. On the Summed FID Preprocess Sub-tab FID index (spin control) Selects the index of the FID data to display in the top plot. This is also the index of the data whose peaks shift and phase 0 values are displayed in the respective widgets below. Gauss (spin control) Controls the width of the Gaussian apodization function that is applied to the data shown in the plots. This apodization value is also used in the peak search routine. The apodization applied in this tab is NOT applied to the final summed FID that is used by subsequent processing tabs. It is only applied in the Raw sub-tab to improve data visualization by the user. orentz [Hz] FID left shift [pts] (spin control) Controls number of points dropped from the beginning of the FID data. To maintain the total number of points, the last data point is repeated. Peak shift [Hz] (spin control) Each FID data set has a separate value for peak shift. This control lets you set the shift value in Hz for the FID index data set displayed. It is updated as you click through the different FID data. Phase 0 [deg] (spin control) Each FID data set has a separate value for phase 0. This control lets you set the phase 0 value in degrees for the FID index data set displayed. It is updated as you click through the different FID data. Apply peak shift (check) Sets a flag off/on to indicate if the Peak Shift correction algorithm should be applied. Changing this control does not trigger the calculation for this correction. Reset Peak Shifts (button) Sets all peak shift values for all FID data sets to 0. This action is reflected immediately in the other controls and plots. Ref peak center [ppm] (spin control) Controls the value of the reference peak around which the peak shift algorithm searches for a maximum value in the magnitude data. Pk search width [ppm] (spin control) Controls the width of the search region around the reference peak in which the peak shift algorithm searches for a maximum value in the magnitude data. Apply phase 0 (check) Sets a flag off/on to indicate if the Phase 0 correction algorithm should be applied. Changing this control does not trigger the calculation for this correction. Reset Phase0 Values (button) Sets all phase 0t values for all FID data sets to 0. This action is reflected immediately in the other controls and plots. Calculate Corrections (button) runs the algorithms to calculate peak shift and phase 0 corrections for each FID data set in the tab. Only runs the respective algorithms if the Apply check boxes are checked. 18 5. Processing Sub-tab – Spectral 5.1 General When a dataset tab is added to the Notebook, it automatically has two sub-tabs added to it called Raw and Spectral. The top line of controls includes (as in all sub-tabs) the filename of the displayed data, the x-voxel index, and the y-scale of the plot in the sub-tab. You can step through each spectrum in the dataset by increasing or decreasing the index in the ‘x-voxel’ widget. Parameter values specific to each spectrum are automatically updated in the widgets of each sub-tab. The y-scale on the plot can be adjusted by clicking on the arrows in the Scale control, typing in a value or using the roller ball on the mouse while in the plot. There are two sub-tabs (or maybe sub-sub-tabs?) here on the Spectral sub-tab. They are displayed along the top edge and are called ‘General Parameters’ and ‘SVD Filter Parameters’. The Spectral – General Parameters sub-tab provides controls for most of the typical processing steps involved in spectral processing including: eddy current correction, signal filtering, zero fill, signal apodization, B0 shift, zero and first order phase, first order phase pivot, DC offset, left shift and other convenience settings for interactive display of the results from changing these processing steps. Most results from changing setting in the Spectral tab are displayed in the plot windows as they are made. As shown in this figure, the eddy current correction and signal filter controls can be set to ‘None’ and have no sub-panel of controls showing. Or, a filtering method can be selected from the drop menu and a sub-panel of controls displayed for that particular algorithm. Due to the complexity of user interactions with the eddy current correction and signal filter panels, these controls are described in more detail in subsequent sections. However, due to the many possible ways of applying the results of the SVD filter, we have created an interactive sub-tab, SVD Filter Parameters, for you to use to visually examine the results of applying various results before applying them in the actual data processing. 5.2 On the Spectral – General Parameters Sub-tab Sync (check) Flag for whether to sync changes made to the main data to whatever data is selected in the PlotB drop menu. Not all controls are bound by Sync, see wiki for more details. PlotB (drop menu) You can select a comparison dataset to plot in the middle plot (Plot B) from all the open datasets in the notebook. If None is selected, then the plot automatically reconfigures to not show Plot B. The Sync flag has no effect if None is selected. Plot B can be used to visualize simple comparisons in plot C such as A-B or B-A as set in View→Plot C Function. 19 Flip X-axis (check) Flag for whether to flip the spectral plot along the X-axis. This value must be the same in all voxels in all datasets, thus changing it in one dataset tab will change it in all dataset tabs. FFT (check) Flag for whether to perform FFT on spectral data. May have to resize x/y axes after turning this off/on. This value must be the same in all voxels in all datasets, thus changing it in one dataset tab will change it in all dataset tabs. Chop (check) Flag for whether to apply a chop filter to the FID data prior to FFT. This will shift the data halfway along the X-axis This value must be the same in all voxels in all datasets, thus changing it in one dataset tab will change it in all dataset tabs. Eddy Current Filter (drop menu) Selects the filter used to correct for eddy currents. See section below for more details. Same method for all voxels. Signal Filtering (drop menu) Selects the filter used to correct for unwanted water and other signals. See section below for more details. Same method for all voxels. Zero Fill Multiplier (drop menu) You can select to zero fill up to 32 times the raw data size. This value must be the same in all voxels in all datasets, thus changing it in one dataset tab will change it in all dataset tabs. Apodize (drop menu) Selects apodization filter to apply [None, Gaussian, Lorentzian]. Same value for all voxels. Width [Hz] (spin control) Width of the selected apodization filter. Same value for all voxels. B0 Shift [Hz] (spin control) Control to perform phase roll on FID prior to FFT, effectively shifts frequency data either left or right by any amount. Value can vary for each voxel. Area Multiplier (spin control) Control to scale FID FFT by some floating point amount. Same value for all voxels. Phase0 [deg] (spin control) Control to set phase 0 for the displayed data plot. Value can vary for each voxel. Phase1 [deg] (spin control) Control to set phase 1 for the displayed data plot. Value can vary for each voxel. Pivot [ppm] (spin control) Control to set phase 1 pivot value. This value must be the same in all voxels in all datasets, thus changing it in one dataset tab will change it in all dataset tabs. DC Offset (spin control) Control to set phase 1 pivot value. Same value for all voxels. Left Shift [pts] (spin control) Control the number of points dropped from the front of the FID data before FFT. To maintain the same number of points, the last data point is repeated. Same value for all voxels.. Correct Phase 1 (check) When the number of left shift points are known, a time varying phase roll can be applied to the data to correct for the phase 1 added by dropping points. Do Automatic Phasing (button) Performs automatic set of Phase01 values. The Lock B0 and Lock Ph01 check boxes allow these parameters to be changed simultaneously of all data that has been loaded “into the screen” in the main dataset (in Plot A). With Lock off, the B0 Shift and Phase0/1 changes (in widgets or by mouse) are applied only to the active voxel (shown in the plot). With Lock on, all parameter values are changed by whatever delta is applied to the active voxel. Checking Sync synchronizes values between Plot A and Plot B. Only Frequency Shift, Phase 0 and Phase 1 are synchronized using the Sync option. Parameters in the comparison dataset are changed by the delta of the value being changed in the main dataset. 20 5.3 Mouse Events in the General Parameters Plot The Spectral sub-tab may have one, two or three axes drawn. We will typically refer to these as top, middle and bottom plots, OR as Plot A, Plot B and Plot C respectively. Most mouse events in the plot are as described above in Section 2.3. However, one difference is that when an interactive phase 0/1 event (middle mouse click and drag) starts within Plot B, then the phase of the dataset shown in Plot B is changed, not that for the main dataset (Plot A). To change the phase of the main dataset, start the interactive phase event within Plot A. If the Sync box is checked both plots will be phased. If an interactive phase event starts within Plot C, no phase changes will be made. 5.4 Eddy Current Correction Control The eddy current correction drop menu can be set to ‘None’ and have no sub-panel of controls showing. Or, a filtering method can be selected from the drop menu and a sub-panel of controls displayed for that particular algorithm. The main Spectral panel automatically reconfigures itself to accommodate any additional controls. Note. Widgets near the bottom of the main panel may be pushed below the visible edge of the tab when an ECC filter panel is opened. All of the following filters (except where noted) require a lineshape FID to use as a reference to correct the main dataset. This reference must already be loaded into a dataset in the notebook. When a filter is selected, the Browse Dataset button is displayed. This allows you to select a dataset from a list of open Datasets to use as a reference in the algorithm. The following ECC filters are provided as part of the Analysis application: Klose – based on the paper by Klose (MRM 14, p.26-30, 1990). This method simply subtracts the phase of the reference from the phase of the data. However, this correction only partially restores the Lorentzian lineshape since only B0(t) distortions are corrected Quality – based on the paper by deGraaf et.al. (MRM 13, p.343-357, 1990). Performs a simple division of the main data by reference dataset. This method can cause artifacts where the denominator in the complex division is too close to zero. Strong apodization can reduce these artifacts, but broaden the effective lineshape. QUECC – based on the paper by Bartha et.al. (MRM 44, p.641-645, 2000). A combination of both the Quality and Klose’s ECC algorithms, this method preserves the strengths of each while overcoming their respective limitations. The main limitation in this filter is that a crossover point between the two methods must be selected. At the moment, this is hard coded. Simple – variation on the Quality method. This algorithm takes the reference dataset and optimizes a frequency shift to best position the reference signal on-resonance. This simplifies the signal decay to look more like a Gaussian shape, with fewer zero crossings and thus less chance for an artifact to occur. B0 shifts in the main dataset are not corrected for by the method. Strong apodization can reduce any remaining artifacts, but broaden the effective lineshape. Traff – developed by Jerry Matson and Lana Kaiser. Similar to the QUECC method, however it determines the cross-over point automatically based on an estimate of signal T2 decay. Also, a Traff filter is applied to the data after the reference signal has been deconvolved in order to restore a Gaussian lineshape. Typically, no additional apodization is necessary. 5.5 Signal Filtering Control The signal filter drop menu can be set to ‘None’ and have no sub-panel of controls showing. Or, a filtering method can be selected from the drop menu and a sub-panel of controls displayed for 21 that particular algorithm. The main Spectral panel automatically reconfigures itself to accommodate any additional controls. Note. Widgets near the bottom of the main panel may be pushed below the visible edge of the tab when a signal filter panel is opened. The following signal filters are provided as part of the Analysis application: FIR – the raw FID data is convolved by a finite impulse response filter to remove high frequency signals (ie. Non-water signals). This low-pass signal is subtracted from the original to remove the water. The FIR kernel is calculated by the scipy.signal.firwin algorithm based on the filter length, half width, and ripple controls. Because the kernel performs poorly at the beginning of the FID, you can choose to extrapolate these values using a linear model using the Extrapolation drop menu. At the moment, the AR Model method does not work. Hamming – the raw FID data is convolved by a Hamming filter to remove high frequency signals (ie. Non-water signals). This low-pass signal is subtracted from the original to remove the water. The FIR kernel is calculated by the numpy.hamming algorithm based on the filter length control. Because the kernel performs poorly at the beginning of the FID, you can choose to extrapolate these values using a linear model using the Extrapolation drop menu. At the moment, the AR Model method does not work. SVD Filter – This method is a black-box estimation of the time domain FID using a model composed of summed Lorentzian lines. A Hankel-Lanczos singular value decomposition of the FID signal onto this model is performed. Subsequently, the subset of model signals that correspond to the water signals to be removed are summed and subtracted from the original signal. Note the results and all user interactions for this filter take place on the Spectral – SVD Filter Parameters sub-tab. To apply SVD results you select this option from the Signal Filtering drop list. Then on the SVD Filter Parameters sub-tab select which signal model peaks to remove. When you switch back to the Spectral – General Parameters tab, you will see that the filtering has been applied with the selected lines. 5.6 On the Spectral – SVD Filter Parameters Sub-tab The SVD Filter Parameters sub-tab is always active in each Spectral processing tab. This subtab allows you to set the input parameters for the HLSVDPro algorithm and visualize the results and compare them to the original spectrum. As in the General Paramters sub-tab, the top line of controls are still visible and includes the filename of the displayed data, the Location-X index, and the y-scale of the plot in the sub-tab. You can step through each spectrum in the dataset by increasing or decreasing the index in the ‘Location-X’ widget. Parameter values specific to each spectrum are automatically updated in the widgets of each sub-tab. The y-scale on the plot can be adjusted by clicking on the arrows in the Scale control, typing in a value or using the roller ball on the mouse while in the plot. The algorithm is run for the active voxel as the you click on the Location-X widget. If the voxel has already been run once, and the input parameters have not changed, then the algorithm is not run, rather the current results are displayed in the plot. Each voxel can have different settings for the HLSVDPro algorithm. These default to typical values but can be set by navigating to the desired voxel (via the Location-X widget) and setting the widgets in the left panel. Most results from changing HLSVDPro parameters or results widgets are reflected in the widgets and plots within a few seconds. 22 You can sort the results by clicking on the column labels in the Results table. Clicking more than once on the same label will sort by either ascending or descending order. Note, the “Rank” column indicates the order that the model signals were returned from the HLSVDPro algorithm. This order is based on the scale of the singular value for that line and is ordered from largest to smallest singular value for rank values 1 to N respectively. The processing in the SVD sub-tab is based on the HLSVDPro algorithm from the paper by Laudadio (JMR 157, p. 292-7, 2002) which is an extension of the HLSVD algorithm presented in the the paper by Pijnappel (JMR 97, p.122-134, 1992) The code for both algorithms were kindly contributed by the jMRUI project (http://sermn02.uab.es/mrui/). The HLSVD algorithm was replaced by the HLSVDPro algorithm in Vespa-Analysis from version 0.5.0 onward. Reset All Voxels (button) Sets algorithm input values back to default values for all voxels. Data Pts (slider) number of data points of the FID to use in the calculation. May not be more than the spectral points in the raw data. Exponentials (slider) Integer between 1 and 50 for number of exponential lines allowed in model. Results Model Peaks (check matrix) This matrix acts similarly to a spreadsheet. Column widths can be adjusted. Rows can be sorted by a particular column by clicking on the column label. The HLSVDPro algorithm returns a frequency, phase, area and damping term for each exponential line in the model. We provide a conversion of frequency to ppm for convenience. You can add lines to be plotted (and used by manual setting in the HLSVD water filter) by checking the box at the left of each row. You can use the “All On” and “All Off” buttons to set/reset all check boxes at once. 23 Peak Selection Methods This section provides a number of ways to select model peaks to remove from the data. All On (button) Checks all boxes in all rows in the results matrix. All Off (button) Unchecks all boxes in all rows in the results matrix. Check Box (radio box) does not actively change any peak selections. Just indicates that you can manually turn check boxes on/off by clicking on them. You may also do this while cursor span is selected, too, but no manual selection can be done under threshold. Use Cursor Span (radio box) When this box is checked and the you draw a cursor span (right mouse click and drag) the tab calculates all model peaks that are within the PPM range of the span and check their boxes in the results list. Checks are additive in that the next cursor span you draw does not turn off any check boxes, it just checks any additional lines in the new span. Use the “All Off” button to start over. Threshold [Hz] (radio box) When this box is selected, all check boxes are set off, then only the peak results whose frequency values are at or below the threshold amount (spin control to right) are set on. This option is de-selected when you click manually on a peak’s box. The threshold value works in conjunction with the frequency shift value set in the General Parameters sub-tab. Because the SVD is applied before the data is shifted, the cumulative effect is as if the threshold was equal to the threshold minus the frequency shift value. This can be seen visually in the plot, but is not reflected in the peak frequencies or threshold widget, itself. 5.7 Mouse Events in the Spectral – SVD Filter Parameters Plot The SVD Filtering Parameters sub-tab has a plot that always has three axes drawn. We will typically refer to these as top, middle and bottom plots. The top plot displays the dataset without any water filtering. The middle plot displays an overlay plot of green lines of all the model results that are checked. The bottom plot displays the middle (results) plot subtracted from the top (data) plot. Most mouse events in the plot are as described above in Section 2.3. 24 6. Processing Sub-tab – Fitting 6.1 Fitting Method – Voigt This sub-tab allows you to estimate metabolite signal contributions within your data while accounting for nuisance signals such as unsuppressed water, lipids and macromolecular resonances. The Fitting sub-tab makes use of algorithm we call the Voigt method. 6.1.1 Background and General Algorithm The Voigt method and is based on the papers by Young, Soher, et.al. : Young K, Soher BJ and Maudsley AA. Automated Spectral Analysis II: Application of Wavelet Shrinkage for Characterization of Non-Parameterized Signals. Magnetic Resonance in Medicine; 40:816-821 (1998) Soher BJ, Young K, Govindaraju V and Maudsley AA. Automated Spectral Analysis III: Application to in Vivo Proton MR Spectroscopy and Spectroscopic Imaging. Magnetic Resonance in Medicine; 40:822-831 (1998) The Voigt method is an automated spectral analysis procedure that combines a parametric model of signals of interest with a non-parametric characterization of the unknown signal components. A least-squares fit, using a priori knowledge of the MR observable compounds (from Vespa-Simulation results), is first used to create a parametric model that is optimized to the known spectral contributions (spectrum minus baseline signal estimate) in the MR signal. This is then followed by a wavelet filtering of the residual data signal (spectrum minus metabolite signal estimate) to characterize the so-called baseline contributions. Use of wavelets allows us to dial in the scale of features in the baseline estimate to be more slowly changing than the more narrow signals in metabolite model. The repeated application of these operations rapidly converges to obtain an optimum fit of both signal components. These features are used in the iterative procedure described below. Each step above is explained in more detail below, but first let’s look at an outline of the procedure itself. Iterative Algorithm for Fitting 1) Initial spectral parameter estimation from raw data, and formation of a model spectrum 2) Subtraction of the spectral model from a copy of the raw data 3) Baseline characterization using the wavelet filtering procedure 4) Subtraction of the baseline characterization from a copy of the raw data 5) Spectral parameter optimization of the metabolite model (create spectral model for next iteration) 6) Repeat (2) – (5) for N iterations Voigt Model Starting Values The best fitting results occur when voxels are already corrected for B0 shifts and zero and first order phase in the Spectral sub-tab. A priori metabolite knowledge is very useful for determining the initial starting values for frequency, B0 shift, zero and first order phase, and line width; however, at the moment all of these value are set manually within the parameter panels of the Fitting sub-tab. 25 Voigt Model a Priori Information The Voigt model uses a priori information selected from Experiments stored in the Vespa data base to create a metabolite basis set. It is very important that the Experiment used to build the basis set be matched to the actual pulse sequence used to acquire the data. Metabolite resonance patterns in an Experiment are described as collections of individual resonances, with relative amplitude, frequency, and phase values for each line in the pattern. Parametric Model of Metabolite Signal Contributions For complete characterization of each metabolite in the data to be analyzed, only two additional parameters were required beyond the metabolite database, an amplitude multiplier, and frequency shift value. The complete parametric model used for the metabolite portion of the signal is shown below. The metabolite portion of the spectrum was modeled as the sum of decaying sinusoids over time t, Fourier transformed into the frequency domain. Terms indexed over m comprise the actual metabolites being analyzed in the spectrum, with each metabolite modified by amplitude scal e Am, and frequency shift ωm. This latter term was used to account for minor frequency shifts only, since a preprocessing stage was used to initially align the whole spectrum with respect to the theoretical frequency offsets defined in the database. Terms indexed over Nm comprise the a priori information describing the resonances structures for each metabolite, with amplitude, An, ωn, and phase, φn, that do not change in the course of the analysis. Four additional parameters were applied over the whole spectrum, the zero and first order phase terms, φ0 and φ1, and two decay constants in L(t), Ta and Tb used to describe a Voigt (Lorentz-Gauss) lines shape. By making use of all available spectral information for each metabolite, the procedure is better able to separate contributions from overlapping multiplets, while also using maximum available signal energy. In addition, by defining a fixed relationship between all resonances for each compound, the model above is greatly simplified and the number of parameters is minimized. 6.2 Voigt Fitting Sub-Tab The Voigt Fitting sub-tab has a top line of controls that includes (as in all sub-tabs) the filename of the displayed data, the Location-X voxel index, and the y-scale of the plot in the sub-tab. You can step through each spectrum in the dataset by increasing or decreasing the index in the ‘xvoxel’ widget. The y-scale on the plot can be adjusted by clicking on the arrows in the Scale control, typing in a value or using the roller ball on the mouse while in the plot. An example of a fitted short TE PRESS spectrum is shown in the figure below with the results tab displayed. The Fitting sub-tab can display between one and four axes drawn in the plot panel to the right. These are typically referred to as Plots A through D. The plot number is set in 26 the View menu. Each of the four plots has its own control menu in the menu bar. This allows you to individually set the plot type and data type displayed. There are 14 different plot types that can be displayed. For example, in the figure below, Plot A shows “Raw and InitialModel” , Plot B shows “Raw and Base” , Plot C shows “Raw and (Fit+Base)” and Plot D shows “Raw-FitBase” or the residual spectrum. 6.3 Mouse Events in the Plot Most mouse events in the plot are as described above in Section 2.3. 27 6.4 Voigt Algorithm Parameter Control Panels Voigt fitting algorithm parameter control widgets are located in a notebook whose tabs are arrayed along the top of the left hand panel. These include: Metabolites, Initial Values, Baseline, Optimize, Quality and Results. Parameter values in these tabs typically apply to all voxels. Only the results panel is updated as you navigate through the Location-X widget. The controls in each panel are described in more detail below 6.4.1 On the Metabolites Panel On this control panel you select the source of prior information for the metabolite model. You can also specify which metabolites are used in the spectral model and manually modify starting values. Prior from Database (button) Activates a dialog from which you select a Simulation-Experiment that contains the prior information that you want to use. Then, a second dialog pops up to allow you to select which portion of the Experiment to use if it has multiple Loops in it. Prior from File (button) Activates a file select dialog to browse for an XML file that contains the prior information that you want to use. The file should have a “prior” node inside it. It can be a ‘Analysis Prior’ file that was created from the Vespa-Simulation Third Party Output dialog, an Analysis ‘preset’ file, or even an Analysis VIFF file in which a different processed dataset has been saved. In all cases, the ‘prior’ node will be copied into memory for use in the current dataset. Source (text box) Read only. Displays the name of the prior information source. 28 Peak Include Range (spin controls) The start and end PPM values for spectral lines to be included in the metabolite model. Note. All spectral information from the prior source is read into Analysis, but can be limited to a specific range as it is used in the fitting algorithm using these widgets. Dynamic Metabolite List (list) All metabolites in the prior source are displayed in a list that resizes itself for each prior source you load. Check the box in front of each metabolite you want to include in your model. Descriptions for the other widgets associated with each metabolite are given below. Lineshape Model (drop list) You can choose to use a Voigt, Lorentzian or Gaussian line shape in your metabolite model. Note. The Voigt line shape uses two internal parameters in the model, called Ta and Tb, to simulate T2 and T2* effects on the ideal FID model. The Lorentzian and Gaussian line shapes are enforced by setting either Tb or Ta, respectively, to very large values that contribute insignificantly to the lines shape model. However, they may have some minimal effect on the eventual line shape modeled. Update Initial Values (button) Most initial value parameter changes are automatically reflected on the plot. This button allows you to force a recalculation of these values. Fit the Spectrum (button) Triggers a fit of the data using the current set of parameters. Progress messages about the various steps of the fitting process are displayed in the status bar. Plots and the Results tab are updated automatically at the end of each fit. Settings in the Dynamic Metabolite List Widget There are a variety of settings that are associated with each metabolite that can be set from the dynamic list. Not every setting is always applicable, but will only be used if needed. Most of these affect how the initial value routines search for starting values, but some affect the metabolite model itself. 1) Area Scale – Scale the starting peak amplitude using the Area Scale Factor widget for each metabolite (initial value routines). 2) Peak PPM Location – this widget is initially set by finding the ppm of the max value of an ideal plot of each metabolite in the basis set. The program uses this value to search for a peak on which to set the starting peak area in the initial values routine. The default value is the PPM calculated from the DB basis spectrum. You can change the region it searches for a particular metabolite peak by changing this widget (initial value routines). 3) Peak Search Width – this widget limits how far from the peak center the algorithm searches (initial value routines). 4) Use DB PPM Value – Check the box to force the initial values routines to use the max peak value calculated from the DB spectrum rather than peak search. This is the default value set in the “Peak PPM Location” widget (initial value routines). 5) Fixed Ta Value – This setting is only applied when the Gaussian line shape model is chosen. The Voigt model parameterizes Lorentzian and Gaussian model elements using the Ta and Tb parameters, respectively. To approximate a Gaussian model, the Ta parameter of the Voigt model is set to a very high fixed value making it essentially insignificant. The Fixed Ta Value widget allows you to set a smaller value that may be more physiologically relevant (metabolite model). 6) Peak Search Phase0 – The widget is used to apply zero order phase to the spectrum prior to performing a peak search. In spectra that have significant first order phase, this widget can be used to set a phase for each peak that best approximates an absorption spectrum before estimating starting values. One application is for FID data from ultrashort TE routines (UTE data). This phase value does not affect the final fitted zero order phase value (initial value routines). 29 Prior Information from Database Dialog Hitting this button pops up a dialog from which you select a Simulation-Experiment that contains the prior information that you want to use. Following this selection, a second dialog pops up to allow you to select which portion of the Experiment to use if it has multiple Loops in it. This second widget is shown here. Select the one set of Loop parameters you want to use as a basis set from the Loop list widgets at the top. This dialog allows you to modify the basis set that is imported similarly to the way a ‘Analysis Prior’ file is created from the Vespa-Simulation Third Party Output dialog. You can ‘split’ metabolite resonance groups into parts by adding a copy of a metabolite with a different start and end PPM range. You can scale ‘truncated’ metabolites (such as choline-truncated) to have the proper areas using the Scale widget. You can add ‘metabolite mixtures’ such as Glx which could be defined as a 5:1 ratio of glutamate to glutamine. Once all additions and changes have been made, hitting the OK button sets these new values into the Analysis-Fitting-Metabolite tab. Click on the Cancel button to default back to the current values in the Fitting-Metabolite tab. 30 6.4.2 On the Initial Values Panel On this control panel you select the methods for calculating starting values for the Voigt model optimization. Values for each starting value are displayed in the respective section. Data Pre-processing These steps are performed prior to metabolite value estimation. B0 Shift (drop list, spin control) This control sets the method for B0 shift evaluation. Methods are Manual and Auto Correlate. This is the same value that is shown on the Spectral tab. Changes to this spin control will also be reflected on the Spectral tab. The Auto Correlate algorithm compares the data spectrum to the AutoPrior spectrum in the range listed on the AutoPrior panel. The offset with the highest correlation is selected as the B0 value. Baseline Estimate (drop list) This control selects the algorithm used to estimate initial baseline signals using either a Lowess or Savitzky-Golay filtering technique. Prior to the application of the filter, regions known to have metabolite peaks (from the ppm list in AutoPrior) are modified by estimating a straight line across the bottom of the metabolite peak region. Peak Ignore Width (spin control) Sets the width (in Hz) of the metabolite region that is modified prior to the filter application. The region(s) are centered on the ppm values in the AutoPrior basis set. Filter Window Size (spin control) Sets the filter window width (in Hz) used to smooth the baseline signal estimation. Area and PPM These values are obtained by a peak search and some calculations based on peak height and linewidth. Area from abs(Real) (check) Perform peak search routines on abs(Real) plot rather than the Real data plot. Cho/Cr 0.2 PPM Separ. (check) Force Cho and Cr peak PPM values to be at least 0.2 PPM apart. Small peaks Area (drop list) Select small peaks (any other than NAA, Cr, Cho) area estimation method from NAA Ratio or Peak Search. NAA ratio will use literature values to set small peak areas based on a ratio to the NAA peak area. Peak search will locate the max data value at the Peak PPM Location listed for the metabolite in the Metabolite tab and convert this peak height into an estimated area. 31 Small peaks PPM (drop list) Select small peaks (any other than NAA, Cr, Cho) PPM estimation method from Peak Search or Reference Peak. Ref peak will use literature values to set small peak PPMs based on an offset to the NAA peak area. Peak search will locate the max data value near the Peak PPM Location and use that PPM value. Linewidth (drop list, spin control) This control sets the method for peak linewidth evaluation. Methods include Manual, Deconvolution and Auto Correlate. Deconvolution creates an ideal ‘impulse’ spectrum using AutoPrior peak ppm values and performs a deconvolution on the data in the region set in the Calculation range widgets. The FWHM of the max peak in the deconvolution spectrum is used to set the linewidth value. Similarly, Auto Correlate performs an auto-correlation of the spectral region listed in the Calculation range widgets with itself. Again the FWHM of the max peak sets the linewidth value. Initial width multiplier (spin control) Used to modify the linewidth value from Deconvolution and Auto Correlate methods. Phase 0/1 (drop list, spin controls) These controls set the method for zero and first order phase values. These are the same values shown on the Spectral tab. Changes to these spin controls will also be reflected on the Spectral tab. Methods include Manual, Correlation and Integration. Both automated methods can be applied to phase 0 only or both phase 0 and 1. Automated phasing method parameters are set in the User-Defined Prior Spectrum dialog on the Processing menu. Apply Truncation Filter (check) Truncate the data FID by N points prior to doing peak search for peak heights to use in calculating starting peak areas. Algorithm used a bootstrap method to account for peak height loss due to T2* decay at N points duration. Linewidth Min (spin control) Line width estimate will affect bootstrap algorithm. This control allows the user to set a minimum line width to use. Truncation [points] (spin control) Integer number of points to lop off of the FID data array prior to the initial area estimation. 6.4.3 On the Baseline Panel On this control panel you select the algorithm to non-parametrically estimate baseline signal contributions. Selections include wavelets, splines or none. You can also specify whether smoothing filters should be applied to the data as part of the estimation. Note. The typical Voigt model uses wavelets for baseline estimation, but spline options are included for convenience. or Baseline Method (drop list) Options include None, Wavelet filter (basic), B-spline (fixed knot), and B-spline (variable knot). The panel below the Smoothing Parameters panel will reconfigure depending on the method selected. Note that the variable knot option can take considerably more processing time than the other two methods. Smoothing Parameters Smooth whole region (check) flag, turns smoothing off/on in the metabolite region during iterations for the baseline estimation. 32 OFF for last iteration (check) flag, turn on to NOT apply filtering to baseline on the final iteration of baseline and metabolite signals fitting. Lowess window size (spin control) float, in Hz. Window width for the lowess algorithm to estimate outliers and apply regional spline filtering. First pass underest. (spin control) float, percent. You can force the baseline signal estimation on the first pass to be more or less than the algorithm calculates. This can be useful if you know that the initial value routines for the metabolites consistently over- or under-estimates. Wavelet Filter Parameters Scale Multiplier (drop list) integer 1-16. Wavelet contributions to the baseline are filtered to be greater than a specified threshold. This threshold is based on this widget’s multiplier times the calculated metabolite signal line width. Higher values result in a smoother baseline. Wavelet Dyad Min Scale (spin control) float, Hz. Sets the minimum scale wavelet element that can be used in the baseline estimation in Hz. This value overrides the multiplier scale in the event of very narrow metabolite peaks which might result in baseline elements that change too swiftly. B-spline Parameters Smoothing Factor (spin control) integer. Only used for Variable Knot option. Range from1-100 apply less or more smoothing of the spline estimation, respectively. See notes below. Spline Spacing [pts] (spin control) float, points. Only used for Fixed Knot option. Describes how closely knots should be spaced across the frequency domain. Number of knots depends on the sweep width and hertz-per-point. Order of B-splines (spin control) int, power value. Used in both Fixed and Variable Knot options. Polynomial power value of the splines used in the model. Notes on Baseline Algorithms Use of the wavelet filter baseline estimate requires that you have installed the pywavelet module. Details on this can be found in the Analysis wiki, here: http://scion.duhs.duke.edu/vespa/analysis/wiki/PyWavelets Wavelets are a great way to ‘dial in’ a baseline estimate that has a fixed amount of smoothness relative to a reasonable range of metabolite linewidths. That is, the baseline rate of change is fixed by the minimum dyad scale being used, which in turn is determined by some multiple of the calculated FWHM linewidth for a metabolite singlet peak. In some cases, typically when there are a few areas with very narrow linewidths, the minimum dyad scale can ‘jump’ up and down leading to small but noticeable regional differences in peak areas. The Wavelet Dyad Min Scale control can be used to mitigate this effect. Both fixed and variable spline baseline methods use the scipy.interpolate.splrep() method, which is based on the FORTRAN routine curfit from FITPACK. It finds the b-spline representation of a 1-D curve given the set of data points (x[i], y[i]) it determine a smooth spline approximation of degree k on the interval xb <= x <= xe. The fixed spline representation places knots based on the user set spacing. The farther apart the knots, generally the smoother the spline baseline estimate. The variable knot representation uses the 's' smoothing condition that splrep can take to determine the tradeoff between closeness of knots and smoothness of the fit. Larger s means more smoothing while smaller values of s indicate less smoothing. See scipy docs for scipy.interpolate.splrep for more details. Note. In Analysis baseline smoothing factor widget value (for variable knot) is directly related to the ‘s’ value. Generally, the allowed range of 1-100 (unit-less) is mapped internally to a semilinear increasing value of ‘s’ that was determined empirically for a variety of MRS single voxel 33 data. In general, we only recommend the use of the variable spline baseline if the wavelet filter and fixed spline baseline routines have failed, due to the non-linear performance of this routine. 6.4.4 On the Macromol Panel On this control panel you select the a model for accounting for macromolecular signal components (at the moment, there is only one) and set the parameters for applying that model. Depending on the model chosen, different parameter panels may be displayed below the drop list. Macromolecule Model (drop list) Selects the model to use to account for Macromolecular signals from None or Single Basis Function from Dataset list. Model 1) Single Basis Function – from Dataset Parameters below pertain to this model. This model uses the data from another Dataset that is open in Analysis to fit macromolecule signals in the current Dataset. The FID for the chosen macromolecular FID is used as another basis function in the fit. The data is scaled initially by the value in the ‘Starting Area’ spin widget. Browse Datasets (button) This button opens a dialog that allows you to select a Dataset from a list of open datasets. This is the data that will be used as the model to fit macromolecular signals in the global fitting optimization. Starting Area (spin control) float. This is the starting value for scaling the basis function to fit the macromolecular signal contributions. 34 6.4.5 On the Optimize Panel On this control panel you select the general parameters for the optimization algorithm, set up the constraints on the Metabolite model, and create a Weighting schema to use in the least squares calculation. Optimization Algorithm These settings pertain to the optimization algorithm in general. Algorithm (drop list) Selects the optimization algorithm from None or Constrained LevenburgMarquardt list. Parameter Scaling (check) If checked, maintains a workable range between parameters in optimization by scaling prior to the fit, and then un-scaling after the parameters are optimized. This does not affect results. Global Iterations (spin control) Sets the total number of baseline/metabolite iterations that are performed before stopping the optimization. Stop Tolerance (spin control) float. Tolerance between iteration inside LM algorithm (recommend 0.01 to 0.001). Max Matrix Iter (spin control) For iterations inside the LM algorithm (recommend only 20-100). Constraints for Metabolite Model Parameters <various> (spin control) These controls set the range +/- around the initial value that the optimization searches to find a result. The Ta and Tb ranges show what the min or max line width range would be when both have the same min and max range. Optimization Weight Calculation Weight Scheme (drop list) Select the weight array creation from Equal Weighting and Local Weighting methods. Equal method sets all weights to be equal to 1 at all points in the optimization. Local method uses the controls below to set up regions that are weighted more or less in the least squares calculation. Local scale factor (spin control) The local region is defined as the region near to any spectral lines in the prior information used to create the metabolite basis set. All points within +/- line width times a multiplier (see below) are included. These points are weighted according to the value in this Local Scale Factor widget. Line Width Multiplier (spin control) Multiplier to determine width of the region around spectral lines that in included in the ‘local ‘ region. This value is multiplied by the estimated line width. 35 Min in Water region (check, spin controls) Modifies the weight array. A region affected by water suppression pulses can be selected using the start/end values and weighted to a minimum value to minimize its effects on the least squares calculation. Min in Lipid region (check, spin controls) Modifies the weight array. A region affected by lipid signals can be selected using the start/end values and weighted to a minimum value to minimize its effects on the least squares calculation. Small peaks scale (spin control) Metabolite peaks other than NAA, Cr and Cho can have this additional scale multiplier added to the weights in their local regions. This causes the fits to these smaller peaks to have more emphasis in the least squares calculation. Recommend (1-5). 6.4.6 On the Quality Panel On this control panel you set up the calculation of Confidence Limits and Cramer-Rao bounds for the current data set. Both are used as measures of goodness of fit. Cramer-Rao bounds are calculated using only the metabolite model and a measure of the noise in the data. They provide a measure of the range of uncertainty if the absolute best fit has been achieved. Cramer-Rao bounds do NOT tell you if this fit has been achieved. The Confidence Intervals method makes use of both the data and the metabolite model to measure the variation about the given fit for a given threshold of goodness. Ie. the Confidence Intervals measure the variation around a parameter’s value for which the least squares measurement changes only by a given percentage. More details to this method can be found in: Young K, Khetselius D, Soher BJ and Maudsley AA. Confidence images for spectroscopic imaging. Magnetic Resonance in Medicine; 44:537-545 (2000) Do Confidence (check) flag. Select whether to calculate confidence interval values. Alpha (spin control) float. The threshold about the parameter across which the variation is measured. 0.85 shown above means a +/- 15% variation about the fitted value. Calculate for You can select to calculate limits for specific parameters in order to save on calculation time. Do Cramer-Rao (check) flag. Select whether to calculate Cramer-Rao bounds. Noise Measure Range (spin controls) Allows you to specify a region of the data from PPM start to end that an RMS noise calculation can be made from. 36 6.4.7 On the Results Panel On this control panel can see a text based report on the results of fitting the data. Output to HTML (button) Creates an HTML file to display the text shown above with the plots currently selected in the plot window (left). User must select a filename. Output to CSV (button) Creates a text file to store the result values shown above in a single line with each value separated by commas. User must select a filename. The last used filename is stored for use as the default the next time the button is hit. If the file does not exist, it is created and a separate header line containing all result column names is added before the result values. If the file exists, the number of comma separated entries in the last line is calculated. If this number differs from the number of result values to be added, then a separate header line containing all result column names is added before the result values. 37 7. Results Output 7.1 Plot results to image file formats The plots displayed in all sub-tabs which contain View panels can all be saved to file in PNG (portable network graphic), PDF (portable document file) or EPS (encapsulated postscript) formats to save the results as an image. The Vespa-Analysis View menu lists commands that only apply to the active Dataset tab and selected processing sub-tab. Select the View→Output→ option and further select either Plot to PNG, Plot to PDF or Plot to EPS item. The user will be prompted to pick an output filename to which will be appended the appropriate suffix. 7.2 Plot results to vector graphics formats The plots displayed in all sub-tabs which contain View panels can all be saved to file in SVG (scalable vector graphics) or EPS (encapsulated postscript) formats to save the results as a vector graphics file that can be decomposed into various parts. This is particularly desirable when creating graphics in PowerPoint or other drawing programs. At the time of writing this, only the EPS files were readable into PowerPoint. The Vespa-Analysis View menu lists commands that only apply to the active Dataset tab and selected processing sub-tab. Select the View→Output→ option and further select either Plot to SVG, or Plot to EPS item. The user will be prompted to pick an output filename to which will be appended the appropriate suffix. 38 Appendix A. Tutorials Data referred to in these tutorials need to be downloaded from the Vespa Analysis wiki at: http://scion.duhs.duke.edu/vespa/analysis/wiki/Tutorials Data is in a zipped file called analysis_tutorial_data.zip. The zipped data file contains a parent directory called tutorial_analysis. The sub-directories are numbered to correspond to the sections below. For the most part, the data that we will import will be in the VASF (VA San Francisco) data format because it is a simple format to understand and that is what we have our de-identified data stored in. A.1 Importing a data file into a dataset Tutorial Data: ~/tutorial_analysis/tutorial_01_import-file Goal: In this tutorial we will learn how to import data from a single data file into Analysis. We will examine the basic functionality of the Raw and Spectral tabs. We will save and open the processed data into an Analysis VIFF (Vespa Interchange File Format) file. Run Vespa-Analysis, you will see the Welcome screen stating that no datasets are loaded Select File→Import→VASF and navigate to the directory above, select the press_cp0.rsd file A dataset tab will appear populated with Raw and Spectral sub-tabs. The Spectral sub-tab should be active. Select the Raw sub-tab, note that the header information on the right is for the filename listed on the left. Select the Spectral sub-tab. Click once in the plot to make that active. Click and drag the left mouse button to zoom in on the plot. Left click in place to zoom back out. Click and drag the middle mouse button (or scroll ball) moving the mouse up-down to set the phase 0 and left-right to set the phase 1 values. Note that the Phase0 and Phase1 widget values on the left change interactively as the mouse moves. Right click and drag to set a reference span in the data plot. Note that the area value and cursor location values in the status bar change interactively. Roll the scroll button up-down to change the y-scale value for all plots. Select File→Save, enter a file name or use the default, press_cp0.xml Select File→Open, and navigate to the tutorial directory, select the xml file you just saved. This should open up in a separate dataset tab. While this data comes from the same file into which the original dataset was saved, the data in this tab is a unique copy and will not affect or be affected by changes made to the other dataset. If you choose to save both datasets to the 39 original file name, this will overwrite the data in that file and only the last tab saved will be available in the future. Use File→SaveAs to save a dataset tab to a new name. Note. For convenience, each time you import data of a particular type (VASF, Siemens DICOM, etc) the program will by default start in the last directory you used to get a file of that type. A.2 Importing multiple files into a datastack Tutorial Data: ~/tutorial_analysis/tutorial_02_import-stack Goal: In this tutorial we will learn how to import data from multiple data files to create a datastack in an Analysis dataset. We will learn to navigate and process individual voxels. Run Vespa-Analysis, you will see the Welcome screen stating that no datasets are loaded Select File→Import→VASF and navigate to the directory above, select all three files shown press_cp0.rsd, press_cp4.rsd and press_cp7.rsd A dataset tab will appear populated with Raw and Spectral sub-tabs. The Spectral sub-tab should be active. The press_cp0 data set should be displayed. Select the Raw sub-tab. You should see three filenames listed in the left panel. Click on each filename and carefully examine the (small) differences in the header information. Select the Spectral sub-tab. Click on the Location-X widget to scroll through the three spectra. Use the mouse to set different Phase 0/1 values for each spectrum. Zoom in on the 1-4.5 ppm range. Set a reference span from 1.5 to 2.01 ppm. Click through the three spectra and note how far the NAA peak is frequency shifted from its proper location at 2.01 ppm. Use the B0 widget in each voxel to line up the NAA peaks. Select File→Save and give this dataset a name. You can use the default (which is press_cp0.xml because it is the first of the three files selected) or choose your own. Use your file browser to check the tutorial directory and note that the data from all three data files have now been stored into one Analysis VIFF file. Select File→Open and select the file you just saved. This should open into a different dataset tab, but contain the same data as in your original tab. This file has the same data dimensions as the first dataset that you opened, so the program allowed it to be loaded into a new dataset tab. Select File→Import→VASF and select only the press_cp7.rsd file. You should see a warning dialog open that looks like this. 40 Go ahead and select File→Import→VASF and select all three *.rsd files again. These should open up into a new dataset tab with no error message. The dimensionality of the data you want to load has to match that in any datasets already open. However, the dimensionality is determined not by the number of files (if you are loading a stack) but by the actual dimensions of the final dataset/datastack created just prior to it being loaded into a dataset tab in the notebook. A.3 Opening and comparing multiple datasets Tutorial Data: ~/tutorial_analysis/tutorial_03_open-multiple-datasets Goal: In this tutorial we will learn how to open multiple datasets into tabs in the notebook. Run Vespa-Analysis, you will see the Welcome screen stating that no datasets are loaded Select File→Open and navigate to the directory above, select press_cp0.xml. After this dataset tab opens, click on File→Open and select the press_cp4.xml file. This will open into a second dataset tab. Note that both of these files are VIFF format and contain phased data in their Spectral tabs. At this point, you should have Dataset1 and Dataset2 tabs in the notebook. In Dataset1, click on the PlotB drop menu, you should see that there are three values, None, Dataset1 and Dataset2. Select Dataset2 and the plot will reconfigure to show three axes. The top is the data for Datase1, middle is Dataset2 data and bottom is the subtraction of top-middle. Position the mouse in the top spectrum. Middle-click and drag and the top spectrum will be phased. The Phase 0/1 widgets to the left will show the interactive change of these values. The bottom (subtraction) plot will reflect the phase changes interactively as well. Position the mouse in the middle spectrum. Middle-click and drag and the middle spectrum will be phased regardless of where the mouse travels (so long as you don’t release the middle button). The Phase 0/1 widgets to the left will not show any changes because we are changing 41 the Dataset2 phase values. If you switch to Dataset2 tab, you will see that it has the same phase as that shown in the middle plot for Dataset1. Conversely, if you change the phase in Datase2, this will be reflected in the middle plot of Dataset1. The bottom (subtraction) plot will reflect the phase changes interactively as well. Close Dataset2 by clicking on the X in its tab. Note that the Dataset1 tab reconfigures itself to set PlotB to None and have only one Plot. A.4 Applying ECC correction using an associated dataset Tutorial Data: ~/tutorial_analysis/tutorial_04_eddy-current-correction Goal: In this tutorial we will learn how to open multiple datasets into tabs and then associate them so that the eddy current correction (ECC) algorithm will have the water data needed to correct the water-suppressed data. Run Vespa-Analysis, you will see the Welcome screen stating that no datasets are loaded Select File→Import→VASF and navigate to the directory above, select press_cp4.rsd. Select File→Import→VASF and select press_cp4_wref.rsd. At this point you should have two dataset tabs open, Dataset1 with the metabolite (water-suppressed) data and Dataset2 with the water data. Click on Dataset1, and select the Spectral tab. From the Eddy Current Correction Filter drop menu select ‘Traf’. The widgets will reconfigure to show a Ecc Data Browse … button with no file name in the field to the right. Click on the Browse button and in the dialog that appears, select the press_cp4_wref.rsd file from the list of open datasets (you may need to resize the dialog to see the entire filenames). The algorithm is applied directly after you select the water file. You can switch back and forth between None and Traf in the drop menu to see the change in the data due to the ECC filter. Note. In this example data the change is not very significant … if you want to send us poor data with a better improvement, please feel free! Click on File→Save and give the output file a name. Check in the tutorial directory and you will see that only one xml VIFF file has been created. Since the water file is used in the ECC processing of the metabolite data, it is assumed to be associated with that dataset. When we saved it, both sets of data were written to the VIFF file. Note. In the tutorial directory, I have already saved a file called press_cp4_with_ecc.xml. I recommend that you annotate the default filename to indicate that a VIFF file contains associated data as well as the main dataset. Close both dataset tabs. Click File→Open and select the VIFF file that you just created. This will open up two dataset tabs, showing both the metabolite and water data files stored in the VIFF file. 42 A.5 Interactive SVD filtering of unwanted signals Tutorial Data: ~/tutorial_analysis/tutorial_05_interactive_svd_filtering Goal: In this tutorial we will learn how to use the Spectral – SVD Filter Parameters subtab in order to filter unwanted signals from a short TE spectrum. Run Vespa-Analysis, you will see the Welcome screen stating that no datasets are loaded Select File→Import→VASF and navigate to the directory above, select press_cp0.rsd. This file will open into a tab called Dataset1 and default to displaying the Spectral – General Parameters sub-tab. The SVD algorithm was run when this voxel was displayed (either on opening or when the Location-X widget was clicked). Select the SVD Filter option from the Signal Filtering drop list. Now click on the SVD Filter Parameters sub-tab to start working with the results displayed. In the SVD tab on the left panel are all the controls for setting parameters for the SVD algorithm. For each voxel in a dataset you can define how many points of the FID to use, how many exponential lines to allow in the model, the Hankel matrix size and the maximum number of iterations allowed internally in the algorithm. As you change the parameter values the algorithm is automatically re-run and results are displayed in the scroll window at the bottom of the left hand panel. There should be 6 columns displayed in the results widget: Line, PPM, Freq, Damping, Phase, and Area. Checking a box in the Line column will select it to be removed from the original spectrum. Damping values are given in ms, phase is in degrees. Clicking on the All On or All Off buttons will set or de-select all check boxes respectively. Try changing some parameter values and seeing how results differ. Make sure to hit the All On button on the bottom of the panel after you change each parameter. This will display all the SVD calculated lines in the middle plot. The residual signal will be displayed in the bottom plot. You can zoom in to different regions to better see the lines in the SVD model. If you click in the Threshold radio box, then the value in the Threshold spin control widget will be used to decide which SVD results to remove from the spectrum. For example, if the spin control is 11, then all SVD results that are less than the center frequency + 11 Hz will be removed from the spectrum. This can be a bit confusing to visualize since the x-axis is typically shown in PPM values, but it is more easily seen in the SVD tab where the center frequency is shown in the Freq column as 0 Hz. So, all SVD lines at 11 Hz or less would be removed. Note that if the Apply Threshold radio box is not checked then the values manually selected in the SVD tab will be used to remove signals from the Spectral plot. You can also use the mouse to select lines in regions of the plot. Just check on the Cursor span radio box. Then as you click-drag with the right mouse button, any SVD lines in the reference span region will be selected as on in the results list. Note that this can only be used to turn on lines, not turn them off. Click on the All Off button to reset the results list and start over if necessary. 43 A.6 Example of a fitted short TE PRESS data set Tutorial Data: ~/tutorial_analysis/tutorial_06_fitting_press_te24 Goal: In this tutorial we will demonstrate what a fitted short TE PRESS data set looks like. We will see how to load prior information from file. We will interactively set initial values and we will generally introduce the other tabs in the Fitting sub-tab. Run Vespa-Analysis, you will see the Welcome screen stating that no datasets are loaded Select File→Open and navigate to the directory above, select press_cp0.xml. This file is saved in VIFF format and will open into a tab called Dataset1. There will be five sub-tabs populating the dataset tab, but the Spectral sub-tab will be active. Note in the Spectral tab we have removed water signals using HLSVD. We have also adjusted the phase and B0 shifted NAA peak to be at 2.01 ppm. Click on the Fitting sub-tab. Zoom in on the metabolite region in the plot (approx. 4.5 to 1.5 PPM) if you have not already set up your default plot types for plots A-D, I recommend the following A) Raw and InitialModel, B) Raw and Base, C) Raw and (Fit+Base), D) Raw-FitBase. When you quit the Analysis program, these selections will be saved as your preferred plot setup. You should see: The initial values (green) overlaid on the raw data (black) in the top plot. The baseline (purple) overlaid on the raw data (black) in the second plot. The overall fit (green) overlaid on the raw data (black) in the third plot. The residual spectrum is at the bottom plot in black. Click on the Results parameter tab. You will see a tabular printout of metabolite areas and ppms and global phase and lineshape values. The Cramer-Rao (CrRao) and confidence interval (CnInt) calculations for the fit are also shown. Click on the Output to HTML … button to select a filename to save the table and plots into in HTML format. This can be accessed using any modern browser. The Metabolites parameter tab can be used to select prior data from either a file or database. Click on the Prior Information from File … button and select the _prior_for_press24_forCP0.xml file from the directory listed above. The program will repopulate the metabolite list and maintain any checked boxes that correspond to metabolites previously selected (yes, since this is the same prior file, all boxes should still be checked, but it’s an example). If you had the original experiment saved into the Vespa database from Simulation you could also get the prior directly from there, also. Click on the n-acetylaspartate Area Scale Factor spin control. You should see the NAA singlet grow or shrink as you change this value. Note that some of the Peak Search Width values have been set to very small values (e.g. 0.01). This is to keep their starting locations at prior ppm values rather than searching for the nearest max peak which might not be accurate for small multiplet structures. The View menu can be used to select how many plots are shown in the plot window. You can also output these plots to a number of image formats using the View→Output menu. 44 This is the official end of the tutorial. However see the notes below about the other parameter tab options. Initial Values – there are a number of automated routines for setting B0 shift, phase and linewidth values. These are selected by their pull down menus. Clicking on the spin controls for the actual values for these parameters will set the method back to Manual. Note. The Baseline Estimate option is used sometimes to better estimate actual peak heights in the spectrum if it is known to have baseline signals underlying the metabolites. The Savitzky-Golay algorithm is fairly quick, but the Lowess algorithm can take considerable time if the data has a lot of points. Baseline – The bottom panel will change as you select the Baseline Method. Smoothing Parameters are applied regardless of method (other than for None) Optimize – Use this panel to better constrain the fit for parameters by setting reasonable ranges in which to search for an optimization. You can set more or less Global Optimizations depending on whether you are testing a setup or running actual data fits. You can emphasize the small metabolite ppm region fits by increasing the Small peaks scale factor, but this can also allow linewidth to increase in some cases. Quality – You must choose a valid Noise range for Cramer-Rao calculation to be accurate. In Confidence Intervals, you must both turn on the option AND select which parameters to do the calculation for. Just checking the Do Confidence Intervals box is not sufficient. 45 Appendix B. Importing Data into Vespa Analysis can import data from a number of 3rd party formats. If you need Analysis to import data from a format that it doesn't currently understand, it's not too difficult to do so as long as you're willing to write some Python code. We’ve done our best to set up a template which leads you through all the necessary steps. It takes care of interactions with the main program. But, we need you to know how your data is organized and accessed. In Analysis' Python code, every 3rd party import format has a specific Python class associated with it. That class knows how to read the format and turn it into a Vespa DataRaw object. Appropriately enough, all of the classes that know how to read files and turn them into a DataRaw are subclasses of a Vespa class called RawReader. You can implement your own RawReader subclass by following the example in this template: http://scion.duhs.duke.edu/vespa/project/browser/trunk/analysis/src/fileio/template.py Download that file to your hard drive to a location where it can remain (semi-)permanently so Analysis can find it each time it starts. Rename it to reflect what data you are going to import. Read the comments in the file for hints on how to make it work for your file format. Note. If someone gives you a 3rd party format I/O file with a RawReader class already written, then all you have to do is install it. Copy the python I/O file to wherever you are storing your other 3rd party format filters. If this is your first, you should create a directory on your computer that will be around semi-permanently so Analysis can always find it. Now follow the rest of the directions below. When you're ready to test your code, you can add your format to the Analysis menu by editing an INI file. The file is called analysis_import_menu_additions.ini and it's in the Vespa data directory. See this page for instructions on how to find Vespa's data directory: http://scion.duhs.duke.edu/vespa/project/wiki/VespaDataDirectory Follow the instructions in analysis_import_menu_additions.ini to make your format appear on Analysis' menu. 46 Appendix C. Supported Data Formats The following data formats are built into the Analysis “import” function. File Format Notes Bruker Uses NMRGlue routines to read in Bruker acqus and fid files. Returns one dataset. Currently supports JCAMPDX v4.24 and 5.x formats. GE PROBE (*.7) Extracts averaged FID data and acquisition parameters from GE P-file format data. Currently only works for PROBE-P acquired data. If there is both unsuppressed and suppressed data in the file, then two datasets will be returned. Each will contain the averaged FID data for the respective stack of FIDs. If there are multi-coil data in the P-file, the averaged data for each coil will be averaged together using the phase from the first point of the water data (unsuppressed FIDs) to correct for coil phase, but no coil weighting factor will be applied. Philips (*.spar/sdat) Extracts averaged FID data and acquisition parameters from Philips spar/sdat file pairs. Returns one dataset. Philips Sum FIDs Extracts individual FID data and acquisition parameters from Philips spar/sdat file pairs. Returns one dataset. Siemens DICOM Extracts averaged FID data and acquisition parameters from Siemens DICOM file. A DICOM browser is used to select a file from a given directory using exam and series information. Returns one dataset. Siemens VB data is well tested, but Siemens VD data is still in beta. Siemens DICOM Sum FIDs Extracts individual FID data and acquisition parameters from Siemens DICOM file. A DICOM browser is used to select a file from a given directory using exam and series information. Returns one dataset. Siemens VB data is well tested, but Siemens VD data is still in beta. Siemens Export (*.rda) Varian Uses NMRGlue routines to read in Varian procpar and fid files. Returns one dataset. VASF (*.rsd/rsp) VA San Francisco file format. Paired files, a text header (*.rsp) and binary data file (*.rsd) that were used to store MRS data. Returns one dataset. VIFF Raw Data (*.xml) Vespa Interchange File Format is an XML format that is used to exchange data between Vespa applications. In this case, it allows Analysis to read Priorset files. Returns one dataset. See Appendix B for if you need Analysis to import data from a format that it doesn't currently understand, it's not too difficult to do so as long as you're willing to write some Python code. . 47