1
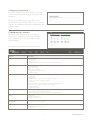
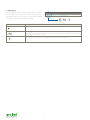
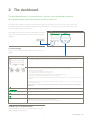
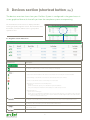
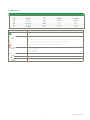
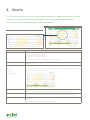
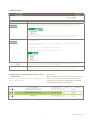
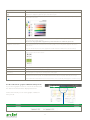
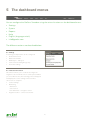
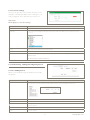
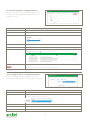
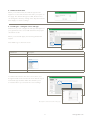
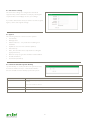
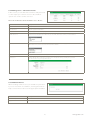
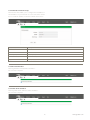
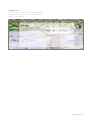
User Manual MultiSensor GROSENS ® Makes precision irrigation possible www.grodan.com/grosens Precision Growing With its focus on using the minimum input materials to generate the maximum output, Precision Growing is the most efficient and effective form of growing. It not only reduces growing costs but increases crop yield and quality. What’s more, this form of growing actively contributes to sustainable horticulture. Table of contents 1Introduction 6 1.1Login 6 1.2 Forgotten your password? 7 1.4Dashboard page - menu bar 7 1.4Navigation 8 2 The dashboard 9 2.1 Section display 9 2.2 How to get to the detailed charts 9 3Devices section 10 3.1 Irrigation section and Sensors 10 3.2Other devices 11 4 Charts 12 4.1 Chart display 12 4.2 Chart navigation 13 4.3 Chart settings – set the desired scales, colours and fixed axis 14 4.4 Go to historical – graphs of different time periods 15 5 The dashboard menus 16 5.1 Settings 16 16 5.1.1 Create new section 5.1.1.1 Section settings 17 5.1.1.2 Monitoring - adding and configuring a Sensor 17 5.1.1.2.1Adding Sensors 17 18 5.1.1.2.2 Row and offset - configure a Sensor 5.1.1.3 Irrigation control - connecting a Converter 18 5.1.2 Measurement units 19 5.1.3 Media types - setting the correct slab type 19 5.1.4 Sunrise/sunset and lighting setup 21 5.1.5 Converter settings 22 5.2 System 22 5.2.1 GroSens Smartbox System Identity 22 5.2.2 Manage users - authorisation levels 22 5.2.3Add new devices 23 5.2.4 Update 24 5.2.5 Smartbox auto-backup 24 5.2.6 System date, time and time zone 24 5.2.7 Smartbox network setup 25 5.2.8 Restart Smartbox 25 5.2.9 Shut down Smartbox 25 5..3Reports 26 26 5.3.1Download all data 5.4 Help 27 5.4.1 Enable remote assistance 27 5.4.2 Help function 27 5.4.3Download software tools - free version downloadable version of chrome 27 5.5 Language menu 28 5.6 “[email protected]” 28 5.6.1 Change password 28 5.6.2 Sign-out 29 www.grodan.com 1 Introduction This User Manual describes the various features of the GroSens Smartbox and how to use them. The GroSens Smartbox can be accessed via a web application using a modern web browser. The GroSens Smartbox supports Google Chrome and Firefox. These browsers are recommended. It will also run on Internet Explorer 10 or higher. 1.1Login Log in with a computer plugged into the router or connected to the network switch with an ethernet cable. Go to the IP address listed on the Smartbox LCD screen (e.g. http://192.168.1.58/). It takes about 20 seconds to load the login screen. On the start page, your preferred language can be set using the drop down menu in the top right-hand corner. Access to the GroSens Smartbox is protected with a username and password. Usernames and passwords are created at installation. Clicking the “log in” button will redirect you to the “dashboard page” or “starting page”. If you use a valid email address to create a user, don’t forget to set the notification level at none! this can be done in the manage users function (see 5.2.2) 6 1.2Forgotten your password? If you have forgotten your password, click on “click here to reset your password”. The dialogue box shown right will appear: Enter your email address (as in registration). A new password will be generated and sent to you. You can then change your password by clicking the “[email protected]” in the menu bar. 1.3Dashboard page – menu bar The dashboard page allows you to access various features of the Smartbox (see the screenshot right). It has a navigation pane. The functionality is briefly described below. More details can be found in the following sections: Button Description Dashboard The dashboard contains the navigation pane items. It allows you to navigate to: - The dashboard - The device screen - The irrigation screen – this will take you to the graph in the first section Settings In this section you will find the main items that need to be defined to enable you to use the software properly: - Create New Section - Measurement Units - Media Types – slab types - Sunrise/Sunset and Lighting Setup - Converter Settings System This allows you to manage the settings of the GroSens Smartbox and the GroSens System: - Site Identity - Manage Users - Add New Devices – only needed for installing new hardware - Update (to check for new software updates) - Auto Back-up - Date, Time and Time Zone (important for setting the appropriate time) - Network Set-up (to give the Smartbox a static address) - Restart (Smartbox) - Shut Down (Smartbox) Reports This will allow you to export data to an Excel file: - Section & Device Historical (in development) - Download All data (all data will be downloaded by irrigation section) Help - Enable VPN - Help files (for future use) - Download Software Tools Language Bar Select the language you require here [email protected] - Change your password - Manage alerts (for future use) - Sign out 7 www.grodan.com 1.4Navigation A small navigation pane is displayed below the menu bar. This navigation pane allows you to easily switch between the dashboard screen, the devices screen and the graphs. Clicking on an item will reveal the following: Button Description This icon represents the dashboard. Clicking it will take you to the dashboard. This icon represents the devices screen. Clicking it will take you to an overview that shows whether the various devices are working properly. A number next to it indicates an alert that a device is not functioning properly. Clicking it will take you to the devices screen. The water drop icon will take you to the graph of the first irrigation section you defined. 8 2 The dashboard The dashboard contains an overview of all sections that are defined and active. Each graph displays the measurements of the last 36 hours. To enable easy comparison between sections, please make sure that the axis for each section is set to the same EC and WC range. This is explained in Chapter 4.3, Chart Settings – Set the desired scales and and colours and fixed axis. Apply settings to all sections. Click “Add Sections” at the bottom of the window to create a new section. Details of how to set this up are provided in Chapter 5. 2.1Section display In this section we explain what is displayed in the section graphs. Field/Function Description The line graph displays the last 36 hours of measurements in EC and WC. If there is no data for the chosen date, no chart will be displayed. Instead, you will see a dialogue box warning you of the absence of the data The data is described in more detail below the graph: - The values in the circles display the averages over the last 36 hours for WC, EC or temp. - The dotted half circle displays: - The lowest value in the last 36 hours at the bottom - The maximum value in the last 36 hours at the top. - The biggest dot displays the average of the last Sensor readings in that section. - Smaller dots represent the last reading from a Sensor in that section. - The differences between Sensors expressed in the dots indicate whether the Sensor measurements are close or far apart. If readings from individual Sensors are similar, individual dots will overlap. This can be seen in the temperature readings in the example on the left. If only one Sensor is used in a section, there will only be one dot and the average will be the last reading from that Sensor. If a yellow triangle is displayed in the top left corner, this indicates a device error. Check the devices screen to see what has caused this and solve the problem. Clicking the section name in the top left corner takes you to the “bigger – detailed” charts. This symbol indicates that Converter C013C035 is connected to section 1. Clicking the cogwheel icon in the top right corner takes you to the configuration section menu, where you can adjust the section settings (slab type, assigning Converters). This function can also be used to delete a section created previously. 2.2How to get to the detailed charts Clicking the picture or the section name takes you to the detailed graph for that section. 9 www.grodan.com 3 Devices section (shortcut button ) The devices overview shows how your GroSens System is configured in the greenhouse in a non-graphical format. It also tells you how the complete systems are operating. The information from the Sensors is displayed in table format, grouped by irrigation section. The information from the Reader, Converters and Receivers is grouped in a separate section. 3.1Irrigation section and Sensors Field/Function Description Clicking the section name takes you to the graph of that section (see Chapter 3). Clicking the cogwheel takes you to the section settings (see Chapter 4). The Status section provides information about device errors: - A green dot is shown if data from the GroSens Sensor has been received by the GroSens Smartbox. - A yellow triangle is shown if the Sensor has not delivered data in the last 10 minutes. - A red icon is shown if the device is not working or not connected. - The battery icon indicates the Sensor battery status: - green: ok - yellow: less than 30% capacity – it is advisable to replace the batteries - red: you should replace the batteries immediately as no data is being received - Signal strength icon: - green: Sensor is working ok - yellow: Sensor is working but it is advisable to move it closer to the Receiver or you might lose the connection - red: signal strength is low – move the Sensor closer to the Receiver. Data might not be received because the Sensor is too far from the Receiver This column displays the name of the GroSens Sensor. Clicking the Sensor number takes you to the section, where you can enter a row and offset for this Sensor. WC, EC, T These columns show the latest values received from the GroSens Sensor. Clicking any of the values takes you to the detailed chart for that Sensor. This column displays whether the data from the GroSens Sensor has been used to calculate the average WC, EC and T for the section. This shows the date and time when the values from the GroSens Sensor were last checked and updated. 10 3.2Other devices Field/Function Description Clicking the cogwheel takes you to the section settings (see Chapter 4). The Status section provides information about device errors: - A green dot is shown if the data from the GroSens Sensor has been received by the GroSens Smartbox. - A yellow triangle is shown if the device has not delivered data in the last 10 minutes. - A red icon is shown if the device is not working or not connected. This column displays the name and serial number of the GroSens device. - CO is a Converter - HE is a HandHeld - RE is a Receiver This column displays the type of device: Reader, Receiver or Converter This column displays the device’s IP address (n/a = not applicable). This shows the date and time when the values from the GroSens devices were last checked and updated. 11 www.grodan.com 4 Charts The Chart environment is the main measurement information page of the GroSens System. It allows you to view and to navigate through current and historical measurements. The features of the dashboard page are described below. 4.1Chart display Field/Function Description Line graphs The chart displays line graphs of the measurement for the selected day(s). The lines display: • WC measured (blue in above example) • EC measured (red in above example) • Temperature (green in above example) The colours of the lines can be changed in the chart settings (see below). Date/time axis Depending on the visible period of time, the axis will display several dates and times in the format “Week day Date” and “Time”. Value axis The default display has two axes: WC on the left and Temperature on the right. WC axis Temp axis To view and display the EC axis on the right, click on the EC bar in the chart settings pane (see below). The axis you have selected will be highlighted in green. Displaying the EC axis Sunrise and Sunset indicators A vertical yellow block is shown on the chart for each day of measurements. This represents the period between sunrise and sunset for that day. The sunrise and sunset times are shown at the top of the graph. Artificial light indicators If in the set points for artificial lighting are chosen (see chapter 5), the yellow part displays the period of artificial lighting set. The times at the top of the graph represent the start and stop times for the artificial lightening. Zoom in on smaller time period Within the chosen display (1.5, 3 and 7 days), you can zoom in on a smaller time period using the bar at the top of the graph: 12 4.2Chart navigation Field/Function Description Section display You can select a section for which you want to display measurements. The chart only shows one greenhouse section at a time. You can select this section from a drop-down menu containing all available sections. You can select a section for which you want to display measurements. The chart only shows one greenhouse section at a time. You can select this section from a drop-down menu containing all available sections. Go to Historical Clicking “Go to historical” will display the individual Sensors in that section. Click a Sensor number to display the graph of that Sensor. The chart only shows one Sensor at a time. You can select this Sensor from a drop-down menu containing all available Sensors in that section. In this environment you can create graphs of different time periods. More information about the historical display is given in section 4.5. You can select 1.5, 3 or 7 days of measurements in the chart. The period always ends with the selected date. So a chart for 7 days shows the selected date and the 6 days before. Select Section The chart only shows one greenhouse section at a time. You can select this section from a drop-down menu containing all available sections. Please note: the selection of the section is stored between sessions. 4.3Chart settings – setting the desired scales, colours Important! After entering the desired axis values, you should press and fixed axis The chart settings can be used to set the scales of the “Enter” on your keyboard. This will activate the new graphs for WC, EC and T. settings and store them. The graph will be refreshed and displayed with the new axis values. 13 www.grodan.com Field/Function Description Check box The chart contains three lines displaying WC, EC and Temperature. If you uncheck one of these lines, it will not be displayed. To display the graph line again, check the box again. Colour / selection The colours in the chart settings represent the various values. Colours can be changed by clicking the drop-down menu next to the colour. Setting Axis Min / Axis Max This sets the minimum value and maximum value for each line graph. The settings for WC and EC apply to the measured values and the set points. Please note: the graphs will be clipped if they contain values that are outside the given scale. Apply Axes to all Sections If you click this button, the set values for the axis in the graph you are viewing will be applied to all Sensors and sections. If you use this function, the axes of the graphs in the dashboard function will have the same axis settings. Reset Axes This function sets the axes to the max and min values over the selected time periods + 10%. The min and max values are presented in the menu bar: Min (value) This gives the lowest value displayed in the graph. Max (value) This gives the highest value displayed in the graph. Avg (value) This displays the average WC, EC and Temperature in the graph. CV or covariance CV stands for covariance, the internationally accepted standard for indicating the deviation between the presented measurements in the graph - the standard deviation of the values in the graph divided by the average. This means that the standard deviation of the measurements can be calculated by multiplying the CV and the average. 4.4Go to Historical – graphs of different time periods If you select a graph of a Sensor or click “Go to Historical”, the chart environment will be displayed as below. In this environment you can create graphs of different time periods. 14 Important Note: If you want to display data over a larger time period (a If more years of data is stored, finding a certain period full year fe), a large amount of data needs to be uploa- in history might require even more time to upload due ded, this might take several minutes. to the extend of the database. Field/Function Description Selection of section or Sensor to be displayed By clicking this drop-down menu, you can select which graph or Sensor you want to be displayed. Setting time frame By clicking in the two date fields, you can select the start and end date for which you want the graph to be displayed. Please note that a period will only be displayed if data is available for it. If you select January-August but there is only data for July and August, only these two months will be displayed. Download selected data When you click download, all data of all Sensors will be downloaded from the system in an excel file. Data of each Sensor is displayed in an individual tab 15 www.grodan.com 5 The dashboard menus You can configure the GroSens Smartbox using the various functions on the dashboard menu: • Settings • System • Reports • Help • English (language switch) • [email protected] The different sections are described below. 5.1Settings In “Settings”, multiple items can be configured: • Create New Section • Measurement Units • Media Types – slab types • Sunrise/Sunset and Lighting Setup • Converter Settings 5.1.1 Create new section This function allows you to create and configure an irrigation section in which Sensors can be placed. When you select this function, the following picture will appear and display the section settings. There are three sub-screens to complete: • Section Settings • Monitoring - Add Sensor - Select Sensor - Row and Offset – configure a Sensor • Irrigation Control – connect a Converter 16 5.1.1.1 Section settings Here you can give the section a name and choose the slab type or media type. Make sure the slab type is correctly configured – this is described in section 5.1.3. Important! Click “Apply” to save the settings. Field/Function Description Section name Enter the name for this section Media type Choose the correct slab type for this section via the drop down menu. Make sure it is configured correctly – see 5.1.3. Cancel If you click “Cancel”, section creation will be aborted. Apply Saves the settings. Delete Section If you are configuring an existing section, e.g. section A, the “Delete” button will appear. This will enable you to delete a section. Be aware that all the information will be lost. 5.1.1.2 Monitoring - adding and configuring Sensors 5.1.1.2.1 Adding Sensors When you click “Monitoring”, the window shown right will appear. Field/Function Description Add Sensor Clicking this drop-down menu opens a list of all the Sensors connected to the system along with their sections. You can select a Sensor by clicking its number. After selecting a Sensor it will appear in the section Row This is the row in which the GroSens Sensor is located. If the field is blank, you can enter a number. Offset This shows the post in the row where the GroSens Sensor is located. If the field is blank, you can enter a number. Clicking the cross deletes a Sensor from that section and takes you back to the pool. It may take 20 seconds for it to appear in the pool. Cancel If you click “Cancel”, section creation will be aborted. Apply Saves the settings. 17 www.grodan.com 5.1.1.2.2 Row and offset – configuring a Sensor When you click the row or offset number on the screen, you will see the following window which allows you to configure a Sensor: Field/Function Description Row This is the row in which the GroSens Sensor is located. If this field is blank, you can enter a number. Offset This is the post in the row where the GroSens Sensor is located. If this field is blank, you can enter a number. Operation mode When you click this function, a drop-down menu will appear. The Sensor is set to normal mode. Cancel If you click “Cancel”, section creation will be aborted. Apply Saves the settings. Alerts Clicking this button opens a window which gives you detailed information on recent alerts. Clicking the dashboard icon ( ) returns you to the dashboard. Delete Device Activating the delete function completely removes the Sensor from the Smartbox System. After deleting you can restore the Sensor by clicking the test button. 5.1.1.3 Irrigation control – connecting a Converter Clicking the “Irrigation Control” tab takes you to the following window, in which you can configure a Converter: Field/Function Description Required Irrigation Supply For future use, in development Converter If you click the dropdown menu, the following screen will appear with connected Converters. Select the Converter you want to attach to this section from the list. Irrigation Priority For future use, in development Cancel If you click “Cancel”, section creation will be aborted. Apply Saves the settings. 18 5.1.2Measurement Units When you click this menu, the window opposite will appear. You can set the measurement units you require on this page. The default settings are % WC, EC and T. You can change the values by clicking on the drop-down menu. Click “Apply” to save the settings. 5.1.3Slab types – setting the correct slab type In this menu you can configure the slab type that applies to your greenhouse. The correct slab determines the proper calculation model. When you click “Slab Types”, the following window will appear: Click “Add” to go to the next screen. Field/Function Description Name Give the slab a name such as “Section 1”, “Location 1” or “2016 season”. Copy From Select the appropriate slab type from the dropdown menu: Apply Click “Apply” to save the settings. You will be taken back to the main screen, where your designated slab can be found in the menu bar. Click your named slab type and then “Edit”. This will take you to a menu bar where you can enter the correct settings. (Description can be found on the next page) 19 www.grodan.com Field/Function Description Length You can select the appropriate length from the drop-down list: Width You can select the appropriate width from the drop-down list: Height You can select the appropriate height from the drop-down list: Slab type Confirm the slab type from the drop-down list: Crop Type Select the crop type from the drop-down list: Pepper Spacer If you use a “pepper spacer” please check the appropriate spacer: Apply Click “Apply” to save the settings. After clicking “Apply”, you will see a summary of the configured slab type: 20 5.1.4Sunrise/sunset and lighting setup In this menu you can select whether you use artificial or natural lighting: • For natural light, you will need to enter the longitude and latitude to display sunrise and sunset in the graphs (yellow blocks and time). Data is gathered every 3 minutes during daylight hours and every 30 minutes during the night. • When artificial light is chosen, lighting time intervals can be set. During the set lighting time period, data will be gathered every 3 minutes. Field/Function Description Natural Lighting Check this option if you are using natural lighting. Latitude Shows the latitude. Longitude Shows the longitude. Get Latitude Longitude When you click this function, you will be taken to Google Maps to help you find the appropriate latitude and longitude. You can copy and paste the values into this page. Artificial Lighting Check this option if you are using artificial lighting. Lights on time Time when lights go on. Lights off time Time when lights go off. Apply Click “Apply” to save the new values. 21 www.grodan.com 5.1.5 Converter settings The Converter settings are configured as described opposite. They can be edited if necessary by entering the required values. Click “Apply” to save your settings. If you have edited values and you want to reset the original figures, click “Load original settings”. 5.2System The following functions can be found in “System”: • Site Identity • Manage Users • Add new devices – only needed for installing new hardware • Update (to check for new software updates) • Auto Back-up • Date, Time and Time Zone (important for setting the appropriate time) • Network Set-up (to give the Smartbox a static address • Restart (Smartbox) • Shut Down (Smartbox) 5.2.1GroSens Smartbox System Identity “System Identity” is used by the GroSens System (Sensors, Converters and Receivers) to communicate with the GroSens Smartbox and to identify a particular system. Field/Function Description Name The system identity can be specified in this field. GroSens System devices will automatically be given the new identity. Note: max. 8 characters allowed. Update Click “Update” to store the new System Identity name. Apply / Cancel Accept or reject changes. Click “Apply” to save the new name. 22 5.2.2Manage users – authorisation levels In this section you can add extra usernames and passwords so other employees can have access to the Smartbox System. You can also set the user level. Note: the notification level should be set to “None”. Field/Function Description Enter email address Specify the username in this field in the form of an email address. User Password Enter the password in this field. Verify password Verify the password by entering it again. Notification level Notification level should be set at “None”. If you select “All”, all alerts are sent to your email address User Level You can choose between “Read Only” – this will only enable you to view the graphs – or “Administrator”. In the administrator role you have access to all menus in the software. Create User Clicking “Create User” saves the settings for the defined new user. Modify User Clicking “Modify” after a defined user enables you to modify the settings, including the password. You can also remove a previously defined user. 5.2.3 Add New Devices When installing new devices in your Smartbox System and if you use more than one Smartbox, checking this function helps connect the new device to the appropriate Smartbox. Field/Function Description Enable Pairing Mode This should be checked if more than one GroSens Smartbox is used. Apply/Cancel Click “Apply” to save the new values. 23 www.grodan.com 5.2.4 Update When you click this function, the system will check whether there are any automatic software updates available. 5.2.5 Smartbox auto-backup When you click this function, the system will check whether there are any automatic software updates available. Field/Function Description Restore GroSens Archive Clicking this button will restore the system backup. Read the warning message above carefully. 5.2.6 System date, time and time zone Field/Function Description Time Zone The time zone where the GroSens System is located. Use Internet Time Use internet time as default (highly recommended). Date Current date. Time Current time. Update Click “Update” to save the new values. 24 5.2.7 Smartbox network setup This function will enable you to configure the IP address of the Smartbox on your network. You can connect the Smartbox to a static IP address instead of a DHCP derived one. Field/Function Description IP Address IP address of the Smartbox. Netmask Netmask address. Default gateway Default gateway. DHCP (auto-detect) Will automatically detect the DHCP. Apply Clicking “Apply” saves the changed settings. 5.2.8 Restart Smartbox Clicking “Restart” will restart the Smartbox – like a normal computer. 5.2.9 Shut down Smartbox Clicking “Shut down” will turn off the Smartbox – like a normal computer. 25 www.grodan.com 5.3Reports This function enables you to download data stored on the Smartbox to an Excel file and work with the data. There are two functions: • Data from a specific period via the “Go To Historical” page (already described in section 4.4) • Download All Data 5.3.1 Download all data When you click “Download All Data”, all data will be downloaded to an Excel file. When the download is complete, a small icon will appear in the bottom left corner containing a zip file. If you click on the zip file, a pop-up screen will appear. Field/Function Description Open Click “Open” to open the zip file. The data is stored by section. So if you have 4 sections, 4 Excel files are created. Store in folder By clicking on “store in folder” you can save the zip file to a folder on your computer: 26 5.4Help This function has three main items: • Enable Remote Assistance • Help function • Download Software Tools 5.4.1 Enable remote assistance Field/Function Description Enable Remote Assistance Check this box to enable remote support for the GroSens Smartbox via VPN. Apply Clicking “Apply” saves the changes made. 5.4.2 Help function Various useful documents such as manuals are stored in this section. 5.4.3 Download software tools – free downloadable version of Chrome Useful software programs that support the GroSens System will be stored in this function in the future. At the moment it contains a version of Google Chrome which you can download and install on your computer. 27 www.grodan.com 5.5Language menu This function enalbes you to select the appropriate language for your system. Click the language you require to run the language version. 5.6“[email protected]” There are two main items in this function: • Change Password • Sign out 5.6.1 Change password Field/Function Description Current Password Enter your current password. New Password Enter your new password. Re-enter New Password Re-enter your new password. Apply Click “Apply” to save the changes made. 28 5.6.2 Sign-out Click on “Sign-out” to log out of the software. You will be taken back to the log-in screen. You will need to log in again to use the software. 29 www.grodan.com Notes 30 31 www.grodan.com professional horticultural sector. Based on Precision Growing principles, these solutions are particularly applied to the cultivation of vegetables and flowers. In addition to its stone wool substrates, GRODAN also provides tailor-made advice and tools to support Precision Growing and thus facilitate the sustainable production of healthy, safe and tasty fresh produce for consumers. More information on the GroSens System can be found at www.grodan.com/grosens Rockwool BV - trading as Grodan T +31 (0)475 35 30 20 Industrieweg 15 F +31 (0)475 35 37 16 www.linkedin.com/company/grodan 6045 JG Roermond [email protected] www.twitter.com/grodan P.O. Box 1160, 6040 KD Roermond www.grodan.com www.3xsustainable.com The Netherlands GRODAN is a registered trademark of ROCKWOOL INTERNATIONAL A/S. GroSens is a registred trademark of Rockwool International AS. © ROCKWOOL B.V. GRODAN 2015 All rights reserved. 32 All our information and advice is compiled with the greatest possible care and in accordance with state of the art technology. However we are unable to assume any liability for the contents. – September 2015 GRODAN supplies innovative, sustainable stone wool substrate solutions for the