1
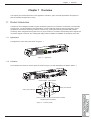
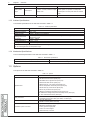
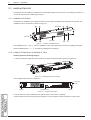
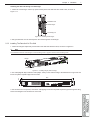
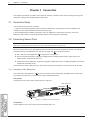
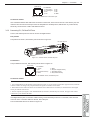
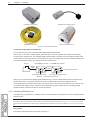
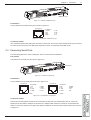
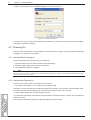
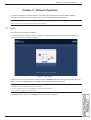
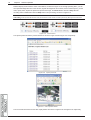
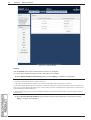
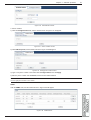
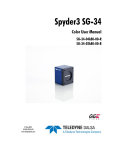
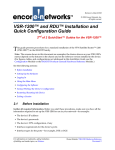
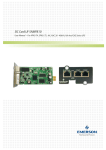
RDU-S Rack Data Unit User Manual Version Revision date BOM V1.4 December 13, 2011 31012350 Emerson Network Power provides customers with technical support. Users may contact the nearest Emerson local sales office or service center. Copyright © 2010 by Emerson Network Power Co., Ltd. All rights reserved. The contents in this document are subject to change without notice. Emerson Network Power Co., Ltd. Address: No.1 Kefa Rd., Science & Industry Park, Nanshan District 518057, Shenzhen China Homepage: www.emersonnetworkpower.com.cn E-mail: [email protected] Contents Chapter 1 Overview ............................................................................................................................................................ 1 1.1 Product Introduction .............................................................................................................................................. 1 1.1.1 Appearance ............................................................................................................................................... 1 1.1.2 Indicators ................................................................................................................................................... 1 1.1.3 Ports .......................................................................................................................................................... 2 1.2 Technical Specifications ....................................................................................................................................... 3 1.2.1 Input Specifications ................................................................................................................................... 3 1.2.2 Output Specifications ................................................................................................................................. 3 1.2.3 Ambient Specifications .............................................................................................................................. 4 1.2.4 Mechanical Specifications ......................................................................................................................... 4 1.3 Options ................................................................................................................................................................. 4 Chapter 2 Installation .......................................................................................................................................................... 5 2.1 Installation Preparation ......................................................................................................................................... 5 2.2 Installation Tool ..................................................................................................................................................... 5 2.3 Installing Data Unit ................................................................................................................................................ 6 2.3.1 Installation Hole Position ........................................................................................................................... 6 2.3.2 Installing The Data Unit In A Standard 19” Rack ....................................................................................... 6 2.3.3 Installing The Data Unit On The Wall ........................................................................................................ 7 Chapter 3 Connection ......................................................................................................................................................... 8 3.1 Connection Notes ................................................................................................................................................. 8 3.2 Connecting Sensor Ports ...................................................................................................................................... 8 3.2.1 Connecting 1-Wire Sensor Port ................................................................................................................. 8 3.2.2 Connecting DI1, DI2 And DI3 Ports ........................................................................................................... 9 3.2.3 Connecting IRM Sensor Port ................................................................................................................... 10 3.3 Connecting Serial Ports ...................................................................................................................................... 11 3.4 Connecting Relay Ports ...................................................................................................................................... 12 Chapter 4 Parameter Setting............................................................................................................................................. 13 4.1 Connecting Data Unit With Computer ................................................................................................................. 13 4.2 Setting HyperTerminal ........................................................................................................................................ 13 4.3 Powering On ....................................................................................................................................................... 14 4.3.1 Checking Before Powering On ................................................................................................................ 14 4.3.2 Checking After Powering On ................................................................................................................... 14 4.4 Logging Onto Data Unit ...................................................................................................................................... 15 4.5 Setting IP Address .............................................................................................................................................. 15 4.6 Restarting Data Unit............................................................................................................................................ 16 Chapter 5 Software Operation........................................................................................................................................... 17 5.1 Login ................................................................................................................................................................... 17 5.2 Monitor Interface Operation Description ............................................................................................................. 18 5.2.1 Environmental.......................................................................................................................................... 18 5.2.2 PDU ......................................................................................................................................................... 20 5.2.3 Camera .................................................................................................................................................... 25 5.3 Control Interface Operation Description .............................................................................................................. 27 5.4 Configure Interface Operation Description .......................................................................................................... 29 5.5 Events Interface Operation Description .............................................................................................................. 39 5.6 History Interface Operation Description .............................................................................................................. 41 5.7 System Information Interface Operation Description........................................................................................... 43 5.8 Logout ................................................................................................................................................................. 43 Chapter 6 Troubleshooting ................................................................................................................................................ 44 Appendix 1 Command Lines ............................................................................................................................................. 45 1. Overview ............................................................................................................................................................... 45 2. Main Command Lines ........................................................................................................................................... 45 Chapter 1 Overview 1 Chapter 1 Overview This chapter gives a brief introduction to the appearance, indicators, ports, technical specifications and options of RDU-S rack data unit (data unit for short). 1.1 Product Introduction The data unit is an intelligent acquisition system developed by Emerson to monitor the environment in rack and IDC machine room. It is also suitable for other applications, such as small base station environment monitoring, power equipment & environment monitoring in telecom machine room, power grid monitoring and bank ATM machine monitoring. When configured with a proper sensor or proper sensors, it can detect corresponding electric signals and non-electric signals in real time. The small profile design makes it suitable for installation in small space in the rack. 1.1.1 Appearance The appearance of the data unit is shown in Figure 1-1. COM1 DI1 DI3 DI2 TH_BUS D 12V GN DO1 POWE COM1 R ALARM DO1 TH_BU DO 2 Micro SD S COM2 USB1 USB2 IG USB CONF ETH COM2 RUN 12V GND DO2 V 100 - 240 a Input Figure 1-1 Appearance 1.1.2 Indicators The indicators are located on the front panel, as shown in Figure 1-2. Their descriptions are listed in Table 1-1. COM1 DO1 DI1 DI3 DI2 TH_BUS 12V GND DO1 POWER ALARM TH_BU DO 2 COM1 Micro SD S USB1 USB2 FIG USB CON ETH COM2 COM2 RUN DO2 12V GND Indicators V 100 - 240 a Input Power indicator Alarm indicator COM1 R POW E ALARM D O1 Serial port indicators Relay output indicators DO 2 S TH_BU COM2 RUN Running indicator TH_BUS communication indicator Amplified figure of indicators Figure 1-2 Indicator position RDU-S Rack Data Unit User Manual 2 Chapter 1 Overview Table 1-1 Indicator descriptions Silkscreen Definition Color DO1, DO2 Relay output indicators Yellow POWER Power indicator Green ALARM Alarm indicator Red RUN Running indicator Green TH_BUS TH_BUS communication indicator Green COM1, COM2 Serial port indicators Green Status On Off On Off On Blinking Off Blinking Off Blinking Off Blinking Off Descriptions The relay is closed The relay is open The data unit is powered on normally The data unit is not powered on The data unit has an critical alarm The data unit has an warning alarm The data unit is starting up or normal The data unit is operating normally The data unit is starting up The data unit is receiving or sending data The data unit is not receiving or sending data The serial port is receiving or transmitting data The serial port is not receiving or transmitting data 1.1.3 Ports The ports of the data unit are located on the front panel, as shown in Figure 1-3. 12Vdc power Micro SD output port card slot Ethernet port COM1 DI1 DI3 DI2 TH_BUS RJ45 ports DO1 12V GND COM1 R POWE ALARM DO1 TH_BU DO 2 S COM2 Micro SD USB1 USB2 IG USB CONF ETH COM2 RUN DO2 12V GND V 100 - 240t a Inpu Power input port Relay ports 12Vdc power ground port USB ports USB CONFIG port DI3 port 1-wire sensor port COM1 DI1 DI3 DI1 port Serial ports DI2 port COM2 DI2 S TH_BU IRM sensor port 1-wire sensor port Amplified figure of RJ45 ports Figure 1-3 Port position The definitions, functions and features of the ports are listed in Table 1-2. Table 1-2 Port descriptions Silkscreen Port 100-240V ~ Input Power input port DO1, DO2 12V GND Relay ports 12Vdc power output port 12Vdc power ground port Micro SD Micro SD card slot* USB1, USB2 USB ports USB CONFIG USB CONFIG port Functions and features Adopt power socket to feed power to the data unit. The power input range is 100Vac ~ 240Vac Output relay status Feed power to external sensor (12Vdc power) 12Vdc power ground Support 2G, 4G or 8G Micro SD card to store video information and configuration file Provide two A type ports of 2.0 standard; capable of recognizing standard U disk, getting USB camera image and connecting GPRS Modem Display the current IP and restore the default password RDU-S Rack Data Unit User Manual Chapter 1 Silkscreen Port ETH Ethernet port (RJ45 port) DI1, DI2, DI3 DI1, DI2, DI3 ports (RJ45 ports) TH_BUS IRM sensor port (RJ45 port) COM1, COM2 Serial ports (RJ45 ports) Overview Functions and features 10M/100M, half/full-duplex self-adaptive; cable auto-crossing function; supportive of IEEE802.3 protocol Connect to digital sensors. Each port can connect up to four digital sensors Connect to IRM series temperature sensor, temperature & humidity sensor COM1 serial port is compatible with RS485, RS422 and RS232 communication modes; COM2 serial port is compatible with RS485 and RS232 communication modes 1-wire sensor port (RJ45 port) Connect to 1-wire sensor Note*: After unplugging and plugging the Micro SD card, the data unit must be restarted to read the data Except for the Ethernet port, the pin definitions of the RJ45 ports are listed in Table 1-3. Table 1-3 Pin definitions of RJ45 ports RJ45 ports Pin No. (1-wire) VCC (5Vdc) 1-wire signal NC NC NC NC NC GND 1 2 3 4 5 6 7 8 DI1, DI2, DI3 TH_BUS COM1 COM2 12Vdc NC D1 GND GND D2 D3 D4 12Vdc NC NC GND NC NC D+ D- R+ RTXD GND GND RXD T+/D+ T-/D- NC NC TXD GND GND RXD D+ D- 1.2 Technical Specifications 1.2.1 Input Specifications The input specifications of the data unit are listed in Table 1-4. Table 1-4 Input specifications Input parameters Corresponding port Measurement accuracy 1-wire sensor port The final accuracy is determined by the used sensor Digital signal input DI1, DI2, DI3 ports - PDU input Serial ports - IRM sensor input IRM sensor port The final accuracy is determined by the used sensor 1-wire sensor input 1-wire signal Descriptions Capable of measuring temperature and humidity. The 1-wire sensor can also be connected with the digital signal from water sensor, door magnet sensor, and so on Capable of measuring the digital signal from door magnet sensor, smoke sensor and infrared sensor Capable of connecting Switched PDU, Metered PDU and Mps PDU Capable of measuring temperature and humidity 1.2.2 Output Specifications The output specifications of the data unit are listed in Table 1-5. Table 1-5 Output specifications Output parameters Route number Relay output Output contact Contact capacity Specification Two routes Relay normally open contact output 5A/24Vdc; 5A/220Vac RDU-S Rack Data Unit User Manual Descriptions Supportive of two triggering modes: level mode and pulse mode 3 4 Chapter 1 Overview Output parameters Sensor power output 12Vdc output USB port output Specification 11.5Vdc ~ 12.5Vdc, maximum output current: 0.8A Maximum output current: 500mA Descriptions The output current is the total current which the sensor power can provide. The total power consumption of 12Vdc power does not exceed 10W - 1.2.3 Ambient Specifications The ambient specifications of the data unit are listed in Table 1-6. Table 1-6 Ambient specifications Item Application location Working temperature* Relative humidity Requirement Indoor 0ºC ~ 45ºC 5%RH ~ 95%RH (non-condensing) Dust: compliant with GR-63 indoor standard. No corrosive gas, flammable gas, oily mist, steam, Working environment water drops or salt Air pressure 70kPa ~ 106kPa Storage temperature -40ºC ~ +70ºC Cooling Natural cooling Note*: It is the working temperature of the data unit, not including the sensors connected with it. Make sure that the used sensors will not be damaged within the temperature range 1.2.4 Mechanical Specifications The mechanical specifications of the data unit are listed in Table 1-7. Table 1-7 Mechanical specifications Dimensions (L × W × H) 440mm × 44.2mm × 55mm Weight ≤ 1.5kg 1.3 Options The options of the data unit are listed in Table 1-8. Table 1-8 Options Classification Digital sensors Relay connectors Cameras Installation options of sensors Optional model 1. ER-ST01P infrared sensor (RJ45 port) 2. EE-SD01S smoke sensor (RJ45 port) 3. ER-DR02J door magnet sensor (RJ45 port) 4. EW-WT01B water sensor (RJ45 port) 5. IRM-S01W (5m, 10m) water sensor(RJ45 port) 6. SN-TH temperature & humidity sensor (RJ45 port) 7. SN-2D door dry contact sensor (RJ45 port) 8. SN-3C dry contact sensor (RJ45 port) 9. IRM-S01T intelligent temperature sensor (RJ45 port) 10. IRM-S02TH intelligent temperature/humidity sensor (RJ45 port) 11. SN-L leak detection sensor (RJ45 port) 1. SL79LED stroboscopic alarm (two cables, non-RJ45 port) 2. HX-F8502 acousto-optic alarm (two cables, non-RJ45 port) 1. KS-188 USB camera 2. ICAM-01 camera (with PTZ control) 1. IDS-08 5cm simple installation support 2. Mushroom head magic paste 3. 16mm gummed magic paste 4. CT3Y 3cm round magnet 5. RJ45 three-way connector RDU-S Rack Data Unit User Manual Chapter 2 Installation 5 Chapter 2 Installation This chapter expounds the installation preparation, installation tools and installation method of the data unit. 2.1 Installation Preparation Notes To avoid personnel injury and damage to the device in installation and use of the data unit, take the following precautions: z Never put the data unit in watery places and always prevent liquid from entering the data unit. z In installation and connection, wear anti-static clothing and an anti-static wrist strap; if anti-static clothing and anti-static wrist strap are not available, wash your hands instead and dry them before installation and connection. z Arrange the wires properly. Do not put any heavy objects on the wires or stamp the wires. z Ground the data unit properly. z Always cut off the power before performing any hardware operation. Operating environment The data unit must be installed indoors. The temperature and humidity should meet the product specifications (see Table 1-6). EMI For EMI purpose, take the following measures: z Do not connect the working ground of the data unit to ground of electrical power equipment or lightning ground. Instead, place them away from each other as far as possible. z Keep the data unit away from large-power radio transmitters, radar transmitters and high-frequency large current electrical equipment. z Take electromagnetic shielding measures if necessary. Heat dissipation The heat dissipation requirements of the data unit are given as follows: z Keep the data unit as far as possible from heat sources. z Keep at least 10mm clearances around the data unit for adequate heat dissipation. 2.2 Installation Tool The installation tools of the data unit are listed in Table 2-1. Table 2-1 Installation tools Tool Crimping pliers for network cable Electrician diagonal cutting pliers Electrician long nose pliers Crossed screwdriver Specification Standard 150mm 150mm 100mm, 200mm RDU-S Rack Data Unit Tool Slotted screwdriver Wire cutter Digital multimeter Drill User Manual Specification 100mm, 200mm Maximum 300mm2 Three and a half digit With a Φ6 aiguille 6 Chapter 2 Installation 2.3 Installing Data Unit The data unit can be installed in a standard 19” rack through hangers (accessories) or a round hanger (accessory). It can also be mounted on the wall through hangers. 2.3.1 Installation Hole Position The hangers are installed on the side panels and the round hanger is installed on the back panel or top panel. The installation holes on the panels are shown in Figure 2-1. 3 Back panel 4 6 5 2 Left panel 1 10 Top panel 9 8 7 Figure 2-1 Positions of installation holes The installation holes ķ and ĸ (also two installation holes on the right panel) are used for installing the hangers and the installation holes Ĺ ~ ŀ are used for installing the round hanger. 2.3.2 Installing The Data Unit In A Standard 19” Rack Installing the data unit through hangers 1. Fasten two hangers respectively to both sides of the data unit with M3 screws, as shown in Figure 2-2. ᆹ㻵ᆄ Installation hole Hanger ᤲ㙣 Figure 2-2 Installing hangers (rack mounting) The completed status is shown in Figure 2-3. Fixing hole (4 pcs) Hanger Hanger Processing unit Figure 2-3 Completed status figure 2. Put the data unit onto the guide rails in the rack and push it into the rack completely. 3. Wrench M6 screws into the fixing holes (see Figure 2-3) of the hangers to fasten the data unit onto the rack. RDU-S Rack Data Unit User Manual Chapter 2 Installation 7 Installing the data unit through a round hanger 1. Fasten the round hanger onto the top panel or back panel of the data unit with an M3 screw, as shown in Figure 2-4. ᆹ㻵ᆄ Installation hole ശᤲ㙣 Round hanger ᮠᦞঅݳ Processing unit Figure 2-4 Installing round hanger 2. Hang the data unit onto the vertical pole in the rack through the round hanger. 2.3.3 Installing The Data Unit On The Wall 1. Fasten two hangers respectively to both sides of the data unit with M3 screws, as shown in Figure 2-5. Note The installation direction of the hangers in wall mounting mode is opposite to that in rack mounting mode. ᤲ㙣 Hanger Installation ᆹ㻵ᆄ hole Figure 2-5 Installing hanger (wall mounting) 2. Use a drill (aiguille: Φ6) to drill four holes (depth: 70mm) on the wall according to the dimensions in Figure 2-6 and knock four plastic expansion pipes into the holes. 31.3 45.8 Figure 2-6 Hole dimensions (unit: mm) 3. Put the data unit in the position, and wrench self-tapping screws into the plastic expansion pipes through the fixing holes of the hangers to fix the data unit on the wall. RDU-S Rack Data Unit User Manual 8 Chapter 3 Connection Chapter 3 Connection This chapter expounds the connection of the data unit, including connection notes, and connecting the sensor ports, serial ports, relay port and multiple signals of RJ45 ports. 3.1 Connection Notes The connection notes are given as follows: 1. The power and external signals that are connected to the data unit must be SELV circuits. The isolation and insulation must be enhanced between them and the power grid. 2. When making RJ45 port cables, pay attention to the pin definitions to avoid wrong connection. For the pin definitions, refer to Table 1-3 and the pin definition figures of the RJ45 ports in this chapter. 3.2 Connecting Sensor Ports Note Refer to the corresponding sensor instructions to carry out the installation and wiring operation. Before sent to the data unit, the site signals should be transformed into electrical signals by sensors. The data unit ) to connect the sensors. provides six sensor ports (silkscreen: DI1, DI2, DI3, TH_BUS and z The 1-wire sensor port (silkscreen: ) is supportive of 1-wire sensor. z The DI1, DI2 and DI3 ports are supportive of digital sensors, including infrared sensor, water sensor, door magnet sensor, smoke sensor, and so on. z The IRM sensor port (silkscreen: TH_BUS) is supportive of IRM series sensor, including temperature sensor and temperature & humidity sensor. If the used sensor needs 12Vdc power, the 12Vdc power output port (see Figure 1-3) of the data unit can be used. 3.2.1 Connecting 1-Wire Sensor Port The 1-wire sensor port (silkscreen: ) is used to connect the SN-TH temperature & humidity sensor, SN-2D door dry contact sensor, SN-3C dry contact sensor or SN-L leak detection sensor. Port position The positions of the 1-wire sensor ports are shown in Figure 3-1. 1-wire sensor port COM1 DO1 DI1 DI3 DI2 TH_BUS 12V GND COM1 R POWE ALARM DO1 TH_BU DO 2 S COM2 Micro SD US B1 USB2 IG USB CONF ETH COM2 RUN DO2 12V GND 1-wire sensor port 100-240V Input ~ Figure 3-1 Positions of 1-wire sensor ports Pin definition The pin definition of the 1-wire sensor port is described in Figure 3-2. RDU-S Rack Data Unit User Manual Chapter 3 1 234 5 6 78 Pin definition 1: VCC (5Vdc) 2: 1-wire signal 3: NC 4: NC Connection 5: NC 6: NC 7: NC 8: GND Figure 3-2 Pin definition of 1-wire sensor port Connection method Use a standard network cable with RJ45 connectors on both ends, insert one end into the 1-wire sensor port, and insert the other end into the RJ45 port of SN-TH temperature & humidity sensor, SN-2D door dry contact sensor, SN-3C dry contact sensor or SN-L leak detection sensor. 3.2.2 Connecting DI1, DI2 And DI3 Ports The DI1, DI2 and DI3 ports are used to connect the digital sensors. Port position The positions of the DI1, DI2 and DI3 ports are shown in Figure 3-3. DI1 port DI3 port COM1 DO1 DI1 DI3 DI2 TH_BUS 12V GND POWE COM1 R ALARM DO1 TH_BU DO 2 S COM2 Micro SD USB1 USB2 IG USB CONF ETH COM2 RUN DO2 100-240V Input 12V GND DI2 port ~ Figure 3-3 Positions of DI1, DI2 and DI3 ports Pin definition The pin definition of the DI1, DI2 and DI3 ports is shown in Figure 3-4. 1234 5 678 Pin definition 1: 12Vdc 2: NC 3: D1 (smoke sensor) 4: GND 5: GND 6: D2 (door magnet sensor) 7: D3 (water sensor) 8: D4 (infrared sensor) Figure 3-4 Pin definition of DI1, DI2 and DI3 ports Connection method Note 1. It is recommended to use the auxiliary sensors shown in Figure 3-5. If you want to connect other types of sensors, make the connection cables according to the port pin definition in Figure 3-4 and then connect them. 2. Both vibration sensor and water sensor use D3 channel. If the vibration sensor is selected, it cannot share the same digital sensor port with the water sensor. 3. The line sequence (see Figure 3-4 for detailed definition) of the DI1, DI2 and DI3 ports is fixed. The types of the sensors connected to a port cannot be the same. If the digital sensor (with a connection cable in factory) recommended by Emerson is connected, insert the RJ45 connector of the connection cable into the DI1, DI2 or DI3 port. The recommended sensors are shown in Figure 3-5. RDU-S Rack Data Unit User Manual 9 10 Chapter 3 Connection EE-SD01S smoke sensor ER-DR02J door magnet sensor IRM-S01W water sensor ER-ST01P infrared sensor Figure 3-5 Recommended sensors Connecting multiple signals of RJ45 ports DI1, DI2 and DI3 ports can be connected with multiple signals simultaneously. When a port is connected to multiple signals, RJ45 three-way connectors (optional) are required for transferring according to the signal amount. Use standard straight network cables to cascade-connect the signals in daisy chain mode and then connect them with the corresponding port. Figure 3-6 indicates the connection method that DI1 port is connected with infrared sensor, door magnet sensor and smoke sensor. RJ45 three-way connector й䙊 DI1 port ᮠᆇՐᝏಘ᧕ਓ Network 㖁㓯 cable RJ45й䙊 three-way connector Network 㖁㓯 cable Connecting infrared sensor 䘎᧕㓒ཆՐᝏಘ Figure 3-6 Connecting smoke sensor 䘎᧕✏ᝏՐᝏಘ Connecting door magnet sensor 䘎᧕䰘⻱Րᝏಘ Connecting multiple sensors When a port is connected with multiple signals simultaneously, you must note that the line sequence conflict of the signals cannot occur. For example, the DI1 port can be connected with four sensors simultaneously. The recommended sensors include smoke sensor, door magnet sensor, water sensor and infrared sensor. If the DI1 port is connected with vibration sensor and water sensor simultaneously, signal conflict will occur, resulting in signal acquisition failure, because both sensors use the DI3 channel. 3.2.3 Connecting IRM Sensor Port The IRM sensor port (silkscreen: TH_BUS) is used to connect the IRM series temperature sensor and temperature & humidity sensor. Note The address range of the IRM series temperature sensor and temperature & humidity sensor is 10, 11, 12, 13, 20, 21, 22 and 23; besides the above addresses, the address range of the IRM series temperature sensor also includes 30, 31, 32, 33, 40, 41, 42 and 43. Port position The position of the IRM sensor port is shown in Figure 3-7. RDU-S Rack Data Unit User Manual Chapter 3 Connection 11 COM1 DI1 DI3 DI2 TH_BUS D 12V GN DO1 POWE COM1 R ALARM DO1 TH_BU DO 2 Micro SD S COM2 USB2 USB1 IG USB CONF ETH COM2 RUN 12V GND DO2 100-240V Input IRM sensor port ~ Figure 3-7 Position of IRM sensor port Pin definition The pin definition of the IRM sensor port is shown in Figure 3-8. 12 345 67 8 Pin dfinition 1: 12Vdc 2: NC 3: NC 4: GND 5: NC 6: NC 7: D+ 8: D- Figure 3-8 Pin definition of IRM sensor port Connection method Use a standard network cable with RJ45 connectors on both ends, insert one end into the IRM sensor port, and insert the other end into the RJ45 port of IRM series temperature sensor or temperature & humidity sensor. 3.3 Connecting Serial Ports The serial ports (silkscreen: COM1, COM2) are used to connect Emerson serial PDU. Port position The positions of the serial ports are shown in Figure 3-9. COM1 DI1 DI3 DI2 TH_BUS Serial ports DO1 D 12V GN COM1 R POWE ALARM DO1 TH_BU DO2 S COM2 Micro SD USB1 USB2 IG USB CONF ETH COM2 RUN DO2 100-240V Input 12V GND ~ Figure 3-9 Positions of serial ports Pin definition The pin definitions of the serial ports are shown in Figure 3-10. 12 345 67 8 Pin dfinition 1: R+ 2: R3: TXD 4: GND 12 345 67 8 5: GND 6: RXD 7: T+/D+ 8: T-/D- COM1 Pin dfinition 1: NC 2: NC 3: TXD 4: GND 5: GND 6: RXD 7: D+ 8: D- COM2 Figure 3-10 Pin definitions of serial ports Connection method When Emerson serial PDU is required to be monitored by the data unit, use standard Cat5 cable to connect the RS485 port of PDU with the serial port of the data unit. If multiple PDUs need to be monitored, use standard Cat5 cable to connect the Link port of the upper PDU with the RS485 port of the lower PDU in daisy chain mode, as shown in Figure 3-11. RDU-S Rack Data Unit User Manual 12 Chapter 3 Connection DO1 D11 D13 COM1 D12 TH_BUS COM2 12V GND Data unit POWER COM1 DO1 ALARM 100-240V~ Input DO2 DO2 12V GND TH_BUS RUN COM2 Micro SD USB1 USB2 USB CONFIG ETH RS485 port PDU1 Link port PDU2 ĂĂ Connecting to the RS485 port of lower PDU At most eight PDUs can be connected. Connecting to the Link port of upper PDU PDU8 Figure 3-11 Connecting the data unit and the PDUs Note At most eight Emerson serial PDUs can be monitored by the data unit through the serial ports (COM1 and/or COM2). 3.4 Connecting Relay Ports Port position The positions of the relay ports are shown in Figure 3-12. COM1 DI1 DO1 DI3 12V GND COM1 POWER ALARM DO1 TH_BU DO 2 S COM2 Micro SD USB1 USB2 FIG USB CON ETH DI2 TH_BUS COM2 RUN DO2 D 12V GN ~ 100-240V Input Relay ports Figure 3-12 Positions of relay ports Connection method When the relay output specification reaches 5A/24Vdc, connect the required cables with the relay ports (silkscreen: DO1, DO2). The relay of the data unit is normally open passive dry contact. Properly arrange the wiring according to the site conditions. Note Pay attention to the port silkscreen before connection to avoid the wrong connection. Otherwise, the device may be damaged. RDU-S Rack Data Unit User Manual Chapter 4 Parameter Setting Chapter 4 Parameter Setting This chapter introduces the parameter setting, including connecting data unit with computer, setting HyperTerminal, powering on, logging onto data unit, setting IP address and restarting data unit. 4.1 Connecting Data Unit With Computer A computer is a must for commissioning the data unit. Therefore, before commissioning the data unit, connect the data unit with the computer using a standard network cable and set the communication parameters through the computer. 4.2 Setting HyperTerminal This section takes Windows XP as an example to illustrate how to set HyperTerminal. After the network cable is connected, set the HyperTerminal according to the following procedures: 1. Click Start -> Programs -> Accessories -> Communications -> HyperTerminal, and the HyperTerminal interface pops up, as shown in Figure 4-1. Figure 4-1 Connection description interface 2. Type the name ‘RDU-S’ in the Name field and click OK, as shown in Figure 4-2. -s Figure 4-2 Connect to interface 1 RDU-S Rack Data Unit User Manual 13 14 Chapter 4 Parameter Setting 3. Select ‘TCP/IP (Winsock)’ in the Connect using field, as shown in Figure 4-3. Figure 4-3 Connect to interface 2 4. As shown in Figure 4-3, type the host address (factory default IP: 192.168.0.10) and port number, and click OK to complete the HyperTerminal setting. 4.3 Powering On After the communication cable connection between the data unit and the computer, and the HyperTerminal setting are completed, you can power on the data unit. 4.3.1 Checking Before Powering On Ensure the following items before powering on the data unit: 1. The power cable and communication cable are connected properly. 2. The power supply voltage meets the device requirement. 3. The HyperTerminal setting is completed. Note Before powering on the device, confirm the location of the power input port (see Figure 1-3) to make sure that the power can be cut off in time in case of an accident. 4.3.2 Checking After Powering On Insert the power cable to power on the data unit and check that: 1. The indicators (see Figure 1-2) of the data unit are working normally. See Table 1-1 for the descriptions of the indicators during normal operation. If the indicators work abnormally, check the cable connection and the working status of the base site to which the data unit is connected. 2. The information displayed on the HyperTerminal is normal. If no information is displayed, check that the connection between the data unit and the computer, and HyperTerminal settings are correct. You can log onto the data unit through the HyperTerminal after the above checks. RDU-S Rack Data Unit User Manual Chapter 4 Parameter Setting 15 4.4 Logging Onto Data Unit The logging procedure is shown in the following figure. The detailed procedures are given as follows: 1. Power on the data unit. After it starts up normally, the HyperTerminal will display RDU-S login:. 2. Type the user name ‘rduadmin’ and press the Enter key, and the HyperTerminal will prompt Password:. 3. Type the password ‘rduadmin’ following Password:, and the HyperTerminal will display the command prompt RDU_admin#. Note Both the user name and the password are case-sensitive. 4.5 Setting IP Address After logging onto the command line, use the command ‘setip’ first to set the IP address of the data unit. The detailed setting procedures are given as follows: 1. Type ‘setip’ following the command prompt RDU_admin# and press the Enter key, as shown in the following figure. 2. Respectively type the new IP address, sub_net mask and default gateway in Please input IP_address, Please input Subnet_mask and Please input Default_gateway. 3. Type ‘Y’ or ‘N’ under Y/N [N] according to the system prompt. Typing ‘N’ will cancel the settings. Typing ‘Y’ will confirm that the network parameters are set successfully, then the system will prompt whether to save these network parameters. RDU-S Rack Data Unit User Manual 16 Chapter 4 Parameter Setting Note After the network parameters are set, the system will prompt whether to save them. If ‘Y’ is typed, the system will maintain the network parameters and reboot automatically; otherwise, the system will retrieve the factory default IP address after 5 minutes. 4.6 Restarting Data Unit Use the command ‘reboot’ to restart the data unit after all parameters are set. The detailed procedures are given as follows: 1. Type ‘reboot’ following the command prompt RDU_admin# and press the Enter key, as shown in the following figure. 2. Type 'Y’ or ’N’ according to the system prompt. Typing ‘Y’ will restart the data unit; typing ‘N’ will cancel the restarting operation. RDU-S Rack Data Unit User Manual Chapter 5 Software Operation 17 Chapter 5 Software Operation This chapter expounds the software operation of the data unit, including login, logout and detailed operation descriptions of Monitor, Control, Configure, Events, History and System Information interfaces. Note Java V1.6 or above is required for proper function of the software. 5.1 Login The login procedures are given as follows: 1. Type the IP address of the data unit in the address bar of Internet Explorer browser and press the Enter key to enter the login interface, as shown in Figure 5-1. Figure 5-1 Login interface 2. Select the correct user name (default: ‘admin’) from the User Name drop-down list and type the correct password (default: ‘emerson’) in Password, and click Login to enter the software operation interface. Note 1. Both the user name and the password are case-sensitive. 2. On one computer, only one user is allowed to log in the system at a time. 3. The system only supports IE7 or IE8 browser. The default interface after login is the Monitor interface, as shown in Figure 5-2. RDU-S Rack Data Unit User Manual 18 Chapter 5 Software Operation 5.2 Monitor Interface Operation Description After the user name and password are verified, you can enter the Monitor interface, as shown in Figure 5-2. Structure tree Operation area Figure 5-2 Monitor interface The structure tree in Environmental displays the devices connected with the data unit, including temperature sensor, humidity sensor, input contacts (digital sensor), output relays (relay port output). The operation area provides three tabs and you can click a tab to enter the corresponding operation interface. z Set temperature sensor and humidity sensor, and view the working status of input contacts & output relays and the last alarms through the Environmental tab. z View and set the working status of the PDU through the PDU tab. z View and set the working status of the cameras through the Camera tab. 5.2.1 Environmental Click the Environmental tab in the operation area, and the interface shown in Figure 5-2 will appear. You can set the temperature sensors and humidity sensors, and view the working status of the input contacts & output relays and the events through the interface. Temperature sensor 1. Setting temperature parameter 1) Click the Temperature Sensor node in the Monitor structure tree, and the window shown in Figure 5-3 will appear. Figure 5-3 Temperature sensor window 2) Double-click one sensor histogram to enter the edit mode; meanwhile, the serial number of the sensor is visible, as shown in Figure 5-4. RDU-S Rack Data Unit User Manual Chapter 5 Software Operation 19 Figure 5-4 Setting mode of temperature sensor 3) Drag the mouse to set the high and low thresholds and double-click the sensor name (‘SN Temp1’ shown in Figure 5-4) to change it. The length of the sensor name is up to 10 characters. The red, yellow and green areas on the histogram respectively indicate alarm, warning and normal range. 4) After setting, click Apply to confirm the setting. Clicking Cancel will cancel the preceding setting. If the temperature setpoint exceeds the normal range, the histogram will turn yellow or red; if it is within the normal range, the histogram will turn green, as shown in Figure 5-5. Warning status Normal status Figure 5-5 Status figure after setting 2. Displaying sensor information Move the mouse to one sensor histogram, and a prompt box, displaying sensor name and sensor location, will appear, as shown in Figure 5-6. Figure 5-6 Prompt box Humidity sensor The operation of the humidity sensor is the same as that of the temperature sensor. Input contacts Click the Input Contacts node in the Monitor structure tree, and the figure shown in Figure 5-7 will appear. You can view the working status of the connected digital sensors. If the working status (Open or Closed) of the digital sensor is displayed in black, it indicates that the digital sensor is normal and does not detect any alarm; if the working status is displayed in red, it indicates that the digital sensor detects an alarm or alarms. Figure 5-7 Input contacts window Output relays Click the Output Relays node in the Monitor structure tree, and the figure shown in Figure 5-8 will appear. This window displays the working status of the devices connected to the relay port. For example, the icon of DO1 (indicator alarm) turning red indicates that it generates an alarm. Figure 5-8 Output relays window RDU-S Rack Data Unit User Manual 20 Chapter 5 Software Operation Double click the icon of DO1 or DO2 to configure the output status of DO sensor, as shown in the Figure 5-9. Figure 5-9 DO control window Event list The monitor interface will display the latest 20 events in the event list, including High Critical, Low Critical, Critical, High Warning, Low Warning, Loss of Comms and Normal events. If you want to clear the Loss of Comms events in the event list, click the Comms Loss Reset button in the SN DI Sensor Configure window shown in Figure 5-46. Figure 5-10 Event list 5.2.2 PDU Click the PDU tab in the operation area to enter the PDU interface, as shown in Figure 5-11. Figure 5-11 PDU tab RDU-S Rack Data Unit User Manual Chapter 5 Software Operation 21 If there are PDUs connected, click the one you would like to monitor in the structure tree, the PDU page shown in Figure 5-12 will appear. The data unit supports three types of PDU: metered PDU, switched PDU and Mps PDU, through RS485 serial protocol provided by Emerson. Figure 5-12 PDU page Metered PDU For metered PDU, click Signal tab and Event tab to check the status of PDU and abnormal events; Click Control tab to set the address, upper load current and lower load current of the PDU. The tabs are shown in Figure 5-13. Signal tab Event tab RDU-S Rack Data Unit User Manual 22 Chapter 5 Software Operation Control tab Figure 5-13 Tabs of metered PDU In the Control tab, click the icon shown in Figure 5-14. in the Operation column to set the address or threshold for metered PDU, as Figure 5-14 PDU setting windows Switched PDU For switched PDU, the PDU page is shown in Figure 5-15. Figure 5-15 PDU page (switched PDU) RDU-S Rack Data Unit User Manual Chapter 5 Software Operation The items in Figure 5-15 are described in Table 5-1. Table 5-1 Switched PDU setting item descriptions Item Outlet Status Control Descriptions Out port of the Switched PDU The current ON/OFF status of the Switched PDU out port Click Turn On and Turn Off to control the On/Off status of the Switched PDU output port Click More>> on the lower right corner to enter the detailed information window, which also has three tabs: Signal, Event and Control, as shown in Figure 5-16. Signal tab Event tab Control tab Figure 5-16 Detailed information window In the Control tab, the setting method of switched PDU is the same as that of metered PDU (see Figure 5-14). RDU-S Rack Data Unit User Manual 23 24 Chapter 5 Software Operation Note 1. Setting address in the Control tab will change the address of switched PDU and metered PDU, and thus lose the communication between the PDU and the data unit. 2. To build the communication between the PDU and the data unit, the same address should be configured on the configure interface, please refer to PDU in 5.4 Configure Interface Operation Description for detailed method. Mps PDU The Mps PDUs are divided into different models depending on the PDU length and whether each outlet can be controlled, and the interface of each model differs. The following takes one model as an example to introduce the interface of Mps PDU, which contains three tabs. Click Signal tab and Event tab to check the status of PDU and abnormal events; Click Control tab to set upper load current and lower load current of the PDU. The tabs are shown in Figure 5-17. Signal tab Event tab RDU-S Rack Data Unit User Manual Chapter 5 Software Operation 25 Control tab Figure 5-17 Tabs of Mps PDU In the Control tab, click the icon in the Operation column to set the thresholds for metered PDU. 5.2.3 Camera 1. Click the Camera tab in the operation area to enter the Camera interface, as shown in Figure 5-18. Figure 5-18 Camera interface 2. Extend the USB Camera node. Click All Camera, and camera1 and camera2 images will be displayed simultaneously in the interface, as shown in Figure 5-18. Click Camera1 or Camera2, and the corresponding camera image will be displayed in the interface. RDU-S Rack Data Unit User Manual 26 Chapter 5 Software Operation Different display modes have the same control buttons, as shown in Figure 5-19. Through operating them, you can turn up/down/left/right direction of the camera, regulate the brightness and contrast, set the frame frequency, record video, replay video, capture the picture and preview the image. The Record button will turn to Stop after the recording action is initiated and click the Stop button to stop recording, as shown in Figure 5-19. Note If Rewriting is ticked, when the SD card is full, the foremost records will be covered by the newly-taken pictures and videos. Figure 5-19 Control buttons The capture picture list and the preview window are shown in Figure 5-20 and Figure 5-21 respectively. Figure 5-20 Capture picture list Figure 5-21 Picture preview window The record video list and the record video replay window are shown in Figure 5-22 and Figure 5-23 respectively. RDU-S Rack Data Unit User Manual Chapter 5 Figure 5-22 Figure 5-23 Software Operation Record video list Record video replay window Note 1. Do not pull out the SD card during recording. 2. For alarm event, the recording time is two minutes at most; for manual recording, the recording time is 15 minutes at most. 5.3 Control Interface Operation Description Click the Control tab to enter the Control interface, as shown in Figure 5-24. RDU-S Rack Data Unit User Manual 27 28 Chapter 5 Software Operation Figure 5-24 Control interface Reboot 1. Click the Reboot node in the Control interface, and the figure shown in Figure 5-25 will appear. Figure 5-25 Reboot window 2. Click Reboot, and the data unit will be restarted. Digital output control 1. Click the Digital Output Control node in the Control interface, and the figure shown in Figure 5-26 will appear. Figure 5-26 Digital output control window Select the control mode (including ‘On’ and ‘Off’) in DO1 Output and DO2 Output, and click Apply. Firmware update 1. Click the Firmware Update node in the Control interface to upgrade the firmware file of the data unit, and the window shown in Figure 5-27 will appear. RDU-S Rack Data Unit User Manual Chapter 5 Figure 5-27 Software Operation 29 Updating window 2. Click Browse…, select the firmware update file (firmware.rdus) of the data unit in the pop-up Select file dialogue box and click Upload to update the firmware update file (firmware.rdus) into the data unit. Configuration file 1. Click the Configuration File node in the Control interface to upgrade the configuration file of the data unit, and the window shown in Figure 5-28 will appear. Figure 5-28 Configuration file window 2. Click Browse…, select the configuration file of the data unit in the pop-up Select file dialogue box and click Upload to update the configuration file into the data unit. Restore factory defaults Click the Restore Factory Defaults node in the Control interface to restore the system default setting, and the window shown in Figure 5-29 will appear. Figure 5-29 Restore factory defaults window Click Restore to restore the system default setting. 5.4 Configure Interface Operation Description Click the Configure tab to enter the Configure interface, as shown in Figure 5-30. RDU-S Rack Data Unit User Manual 30 Chapter 5 Software Operation Figure 5-30 Configure interface Network Click the Network node, and the window shown in Figure 5-31 will appear. You can set the IP address through the window. Two methods are available: z Select Obtain IP address automatically (DHCP), and click Apply to complete the configuration. Note 1. If DHCP is selected, there are two conditions as follows: 1) The system cannot obtain the IP address in five minutes, the IP address will be restored as 192.168.0.10. 2) The system obtains the IP address in five minutes, and then the system will be restarted automatically. Wait five minutes, and then you can view the dynamic IP address in the ‘Current_DHCP_IP.txt’ file in the background computer that is connected to the data unit through the USB CONFIG port. 2. Before using the DHCP service, please check that the DHCP server has been started normally, or else, the DHCP can not be used normally. z Select Use the following IP address, type IP address, subnet mask and gateway in the textbox, and click Apply to complete the configuration. RDU-S Rack Data Unit User Manual Chapter 5 Figure 5-31 Software Operation 31 Network window Email Click the Email node, and the window shown in Figure 5-32 will appear. You can configure the Email sending function, including Email server IP address, port, using SSL or not, and Email addresses of sender & receiver, and separately test the Email serving function of the data unit through the window. Email server port default: If SSL is not used, the port number is 25; If SSL is used, the port number is 465. z If you have not modified the port number, when you check or uncheck SSL, the port number will be switched between 465 and 25. z If you have set other port number manually, when you check or uncheck SSL, the port number will always be the user-defined value, not being changed. 1. SMTP server Click the SMTP Server tab, and the window shown in Figure 5-32 will appear. As shown in Figure 5-32, type the corresponding configuration values of the parameter items and click Apply to complete the configuration. Figure 5-32 SMTP server window 2. Recipients 1) Click the Recipients tab, and the window shown in Figure 5-33 will appear. Figure 5-33 Recipients window RDU-S Rack Data Unit User Manual 32 Chapter 5 Software Operation 2) Click Add Recipient, and the figure shown in Figure 5-34 will appear. Figure 5-34 Adding recipient window 3) Type the Email address in Recipient Address and click Apply. Adding recipients is completed. Clicking Reset can re-type the E-mail address, and clicking Cancel can cancel the adding operation. 4) Select one Email address and click Delete, and the Email address will be deleted. Note 1. At most eight Email addresses can be added. 2. If ‘Enable emails for all events’ is ticked, the system will send you an Email under any event (generated by all sensors) except the event generated by the third party intelligent devices, for example, PDU. 3. Test Click the Test tab, and the window shown in Figure 5-35 will appear. Figure 5-35 Test window Click Test, the data unit will send a test Email to the recipient address. SMS Click the SMS node, and the window shown in Figure 5-36 will appear. You can set the SMS function of the data unit through the interface, including receiving the SMS reminding function through SMTP mode (note that the mobile phone is required to apply mobile mailbox function), receiving SMS sending function through Wireless Modem and adding & deleting phone numbers. 1. Wireless Modem Click the Wireless Modem tab, and the window shown Figure 5-36 will appear. RDU-S Rack Data Unit User Manual Chapter 5 Figure 5-36 GPRS Modem window 3. Phone numbers 1) Click the Configure Phone tab, and the window shown in Figure 5-37 will appear. Figure 5-37 Phone numbers window 2) Click Add Recipients, and the window shown in Figure 5-38 will appear. Figure 5-38 Adding phone number window 3) Type a new phone number in the textbox after Configure Phone and click Apply. 4) Select a phone number and click Delete, and the number will be deleted. Note At most eight phone numbers can be added. SNMP Click the SNMP node, and the window shown in Figure 5-39 will appear. Figure 5-39 SNMP window RDU-S Rack Data Unit User Manual Software Operation 33 34 Chapter 5 Software Operation 1. Adding NMS 1) Click Add, the window shown in Figure 5-40 will appear. Figure 5-40 Adding new NMS 2) Select Enable traps for all events and click Apply to send traps for all events. 3) Select SNMP V2c, type a new NMS IP address in NMS IP and keep other parameters in default. 4) Click Apply, the setting is successful; Click Cancel, the setting is cancelled. 5) Select SNMP V3, the window shown in Figure 5-41 will appear. Figure 5-41 Select SNMP V3 6) Click Apply, the setting is successful; Click Cancel, the setting is cancelled. 2. Deleting NMS Select one NMS and click Delete, and the NMS will be deleted. RDU-S Rack Data Unit User Manual Chapter 5 Software Operation 35 Note 1. At most 20 NMSs can be added. 2. If ‘Enable emails for all events’ is ticked, the system will send you an Email under any event (generated by all sensors) except the event generated by the third party intelligent devices, for example, PDU. Time Click the Time node, and the window shown in Figure 5-42 will appear. You can calibrate the system time of the data unit through the window, including automatically getting local time and getting time through NTP server. You can also set the calibration interval through the NTP server, and select the Time Zone. In addition, you can disable and enable Daylight Saving Time (DST) by the following method: z Select Disable to disable Daylight Saving Time. z Select Automatically adjust clock for daylight saving time only when ‘-5:00 ~ -8:00’ is selected for Time Zone. z Select Manual Set, you can set DST Start Time, DST End Time DST and Adjust Hours. Figure 5-42 Time window Users Click the Users node, and the window shown in Figure 5-43 will appear. Figure 5-43 User window 1. Adding new user. 1) Click Add, and the window shown in Figure 5-44 will appear. RDU-S Rack Data Unit User Manual 36 Chapter 5 Software Operation Figure 5-44 Adding new user window 2) Type a new user name in User name, select the authority for the new user in Authority and type the password respectively in Password and Confirm. 3) Click Apply. Note At most three users of administrator level, five users of Manager level and five users of Reader level can be added. 2. Deleting user. Select the user to be deleted and click Delete. Sensors 1. Click the Sensors node, and the window shown in Figure 5-45 will appear. Figure 5-45 DI sensor configure window Note For third-party equipment, ‘Custom’ must be selected in the Type column in the DI sensor configure window. 2. Select the DI Sensor Configure tab, and the window shown in Figure 5-45 will appear. You can enable or disable the DI channels, and set the DI type and name of the DI channels. Click Apply to complete the configuration. 3. Click the SN DI Sensor Configure tab, and the window shown in Figure 5-46 will appear. You can enable or disable the SN DI channels, and set the SN DI type and name of the SN DI channels. Click Apply to complete the configuration. Click the Comms Loss Reset button to clear the Loss of Comms events in the event list. RDU-S Rack Data Unit User Manual Chapter 5 Software Operation 37 Figure 5-46 SN DI sensor configure window Note 1. At most three SN-3C dry contact sensors, three SN-2D door dry contact sensors and one SN-L leak detection sensor can be configured. 2. The serial numbers of the sensors will be displayed in the Address column automatically. 4. Select the TH Sensor Configure tab, and the window shown in Figure 5-47 will appear. You can set the positions of the temperature and humidity sensors. Click Apply to complete the configuration. Figure 5-47 TH sensor configure window Note 1. At most ten SN-TH temperature & humidity sensors can be configured. 2. The serial numbers of the sensors will be displayed in the Address column automatically. 3. At most eight IRM series temperature sensors and eight IRM series temperature & humidity sensors can be connected with the system. After NForm is connected, when IRM series sensors are used, the system supports at most ten temperature monitoring points and eight humidity monitoring points. The address range of the ten temperature monitoring points is 10, 11, 12, 13, 20, 21, 22, 23, 30 and 31. The temperature monitoring points beyond this address range will not be displayed in the NForm. PDU Click the PDU node, and the window shown in Figure 5-48 will appear. RDU-S Rack Data Unit User Manual 38 Chapter 5 Software Operation Figure 5-48 PDU management window Click Add to configure PDU and the windows shown in Figure 5-49 will appear. Click Modify to revise the PDU setting by selecting the PDU you want to revise. Click Delete to delete the configured PDU. Figure 5-49 Adding PDU Note 1. The address to be input should be the same as that of serial PDU you want to monitor. The address and current will be displayed alternately on the LED display screen of the PDU for your reference. 2. After finishing all actions such as adding, modifying and deleting, click Apply to enable all the settings and the system will be rebooted. Auto logout Click the Auto Logout node, and the window shown in Figure 5-50 will appear. Type the time, such as ‘15’ (the setting range is 0min ~ 15min), in Auto logout (mins) and click Apply. You may set the value as ‘0’, and the system will never logout automatically. If you do not have any operation on the WEB interface within 15 min, it will automatically exit and return to the login interface (see Figure 5-1). Figure 5-50 Auto logout window Change password Click the Change Password node, and the window shown in Figure 5-51 will appear. RDU-S Rack Data Unit User Manual Chapter 5 Software Operation Type the old password in Current Password, and the new password respectively in New Password and Confirm, and click Apply. Figure 5-51 Changing password window 5.5 Events Interface Operation Description Click the Events tab to enter the Events interface, as shown in Figure 5-52. Figure 5-52 Events interface Digital input actions Click the Digital Input Actions node, and the figure shown in Figure 5-53 will appear. You can configure the output mode of alarm events for the digital sensors through the interface. When an alarm is generated, you can select the alarm output mode according to the severity of the alarm event, including EventLog, Email, SMS, Camera USB, Relay out and SNMP TRAPS. Figure 5-53 Configuration interface of alarm notification RDU-S Rack Data Unit User Manual 39 40 Chapter 5 Software Operation Note 1. At most 64 alarm events can be configured. 2. The logical operation (‘and’, ‘or’) will be processed from left to right. 3. Several Email addresses can be selected by clicking them one by one. Temp & Hum Click the Temp & Hum node, and the window shown in Figure 5-54 will appear. You can configure the output mode of alarm events for the temperature and humidity sensor through the interface. When an alarm is generated, the system can selectively output it according to the alarm class. The output mode includes Email (Email notification), Camera USB (video through USB Camera) and DO (audible and visual alarm through the relay). Figure 5-54 Temp & Hum action window Note Among the selections in , the sensor whose name is ‘SN Temp XX’ or ‘SN Hum XX’ belongs to 1-wire mode; the sensor whose name is ‘SerialTXX’ or ‘SerialHXX’ belongs to RS485 mode. Event history Click the Events History node, and the figure shown in Figure 5-55 will appear. You can view the alarm records, including critical alarm, warning and notification in the interface. You can click Time to list the events in time sequence. Figure 5-55 Event history window RDU-S Rack Data Unit User Manual Chapter 5 Software Operation 41 Click the Export CSV File button to export the history events in CSV format and the figure shown in Figure 5-56 will appear. Figure 5-56 File list window Right-click the file to be exported, and select the command. For example, select ‘Save Target AS…’ to save the file. Clear event history 1. Click the Clear Event History node, and the window shown in Figure 5-57 will appear. Figure 5-57 ‘Clear Event History’ window 2. Click Clear Event History, and the historical events will be cleared. 5.6 History Interface Operation Description Click the History tab to enter the History interface, as shown in Figure 5-58. Chart Click the Chart node to enter the historical data interface in chart mode, as shown in Figure 5-58. The chart of two sensors will be displayed by default. After the sensor types on upper side of the interface are selected, the corresponding chart will appear. Figure 5-58 shows the historical data charts after all sensor types are selected. Clicking and buttons can scroll down and up the historical data charts. RDU-S Rack Data Unit User Manual 42 Chapter 5 Software Operation Figure 5-58 Historical data interface in chart mode Table 1. Getting historical data Click the Table node to enter the historical data interface in table mode, as shown in Figure 5-59. You may click Time, Name, Value and Unit to list the data in the corresponding sequence respectively. Figure 5-59 Historical data interface in table mode RDU-S Rack Data Unit User Manual Chapter 5 Software Operation 43 2. Export CSV file Click Export CSV File to export the historical data. The exported historical data will be saved in local computer. Interval 1. Click the Interval node, and the window shown in Figure 5-60 will appear. Figure 5-60 Interval window 2. Type the interval and click Apply, and the interval of the acquisition data is changed. Clear history data 1. Click the Clear History Data node, and the window shown in Figure 5-61 will appear. Figure 5-61 ‘Clear History Data’ window 2. Click Clear History Data, and the historical data will be cleared. 5.7 System Information Interface Operation Description Click the System Information tab to enter the System Information interface, as shown in Figure 5-62. You can view the version information of the system and hardware through the interface. You can also define the Site Name according to your preference by inputting the name and clicking Apply. Figure 5-62 System information interface 5.8 Logout Click the logout button on the upper left corner of the interface or the exit button on the upper right corner of the interface to exit the software. RDU-S Rack Data Unit User Manual 44 Chapter 6 Troubleshooting Chapter 6 Troubleshooting The chapter introduces the troubleshooting of the data unit. See Table 6-1 for the troubleshooting. Table 6-1 Troubleshooting Fault phenomenon After the data unit is powered on, the power indicator is off and the running indicator (see Figure 1-2) is not blinking After the network cable is connected, the indicator on the Ethernet port is off No response occurs after the Micro SD card is inserted No response occurs after the corresponding sensor is connected SMS message error without response No communicating for PDU Treatment Check that the host board is powered on 1. Check that the network cable is normal. 2. Check that the device in upper network is working normally 1. Check that no obstructs exit in the Micro SD card slot. 2. Check that the Micro SD card is inserted in place. It is recommended to insert it again. 3. Restart the data unit. After unplugging and plugging the Micro SD card, the data unit must be restarted to read the data 1. Check that the sensor is working normally. 2. Check that the configuration file is configured correctly. 3. Check that the channel used by the sensor does not have conflict 1. Check the model number of GPRS Modem, and make sure that the modem being used is supported by the system. 2. See supported modem list in RDU brochure 1. Check the model number of PDU. Make sure that it is Serial Switched PDU, Serial Metered PDU or Serial Mps PDU. 2. Check address of the PDU RDU-S Rack Data Unit User Manual Appendix 1 Command Lines 45 Appendix 1 Command Lines This appendix introduces the command lines of the data unit. 1. Overview The data unit provides command lines, which include a series of configuration commands. You can run commands to configure and manage the device. The command lines provide the function of helping, loading, uploading files, testing, changing password and command setting. The command lines provide the following features: z Support simple command line editing function. z Type ‘?’ or ‘help’ to get online help information at any moment after logging. z Provide the relative commissioning information help to diagnose network malfunction. z Support key word input mode. You only need to input part of the key word related to a command and the shell can recognize the command, for example, to run the command ‘lookstatus’, just type 'look’. 2. Main Command Lines (1) ? or help Type ‘?’ or ‘help’ under the command prompt RDU_admin# and press the Enter key to get the help information, as shown in the following figure. (2) Download The download command is used to download the software or delete the files and subdirectory under the data unit directory. Type ‘download’ under the command prompt RDU_admin# and press the Enter key, as shown in the following figure. RDU-S Rack Data Unit User Manual 46 Appendix 1 Command Lines You can type ‘0’ ~ ‘4’ to realize the different operation functions: z Type ‘0’ and press the Enter key: show the download command interface. z Type ‘1’ and press the Enter key: download software package (firmware.rdus) (with recommended size of no more than 2M) and decompress to RDU directory. z Type ‘2’ and press the Enter key: delete all contents in the directory of data unit. z Type ‘3’ (or ‘q’) and press the Enter key: exit the download command and return to the main interface of command line. If you do not have any operation for the command within five minutes, the software will automatically exit and return to the main interface of command line. Note 1. If you log onto the data unit through a remote terminal or HyperTerminal, and 1 or 2 is selected, the system will display: rz ready. Type ‘sz file’ to your modem program. Then you can choose a file to download by selecting Send -> Send File and send the file using the zmodem protocol. 2. If you log onto the data unit through RS232 serial port, you can download files through data unit configuration port; if you logs into the data unit through a remote terminal, you can download files through Ethernet port. It is recommended to use a network that offers a high speed. 3. After a file is downloaded, upload the file to check if the download is successful. 4. For upgrading the firmware successfully, command 2 (Delete all the files in RDU directory) should be processed before command 1 (Download firmware.rdus files and decompress to RDU directory). (3) Logout The logout command is used to exit the data unit. Type ‘logout’ under the command prompt RDU_admin# and press the Enter key to exit the system. (4) Password The password command is used to change the logging password. Type ‘password’ under the command prompt RDU_admin# and press the Enter key, as shown in the following figure. You can type the new password under the command prompt Enter new password: (5) Reboot The reboot command is used to restart the data unit. Type ‘reboot’ under the command prompt RDU_admin# and press the Enter key, as shown in the following figure. Type ‘y’ or ‘Y’ and press the Enter key, and the data unit will be restarted. (6) Ipview The ipview command is used to display the IP parameters. Type ‘ipview’ under the command prompt RDU_admin# and press the Enter key, as shown in the following figure. (7) Setip The setip command is used to set the network parameters, such as IP address, mask and default gateway. Type ‘setip’ under the command prompt RDU_admin# and press the Enter key, as shown in the following figure. RDU-S Rack Data Unit User Manual Appendix 1 Command Lines 47 Type the IP address, mask and default gateway of the device following the instructions and press the Enter key, the new network parameters can take effect immediately. (8) Test The test command is used to test the network, serial port and display self-test information. Type ‘test’ under the command prompt RDU_admin# and press the Enter key, as shown in the following figure. You can type ‘0’ ~ ‘5’ to realize the different operation functions: z Type ‘0’ and press the Enter key: show the test command interface. z Type ‘1’ and press the Enter key: view start-up self-test information. z Type ‘2’ and press the Enter key: ping to network test. z Type ‘3’ and press the Enter key: start serial port test. z Type ‘4’ and press the Enter key: stop serial port test. z Type ‘5’ (or ‘q’) and press the Enter key: exit the test command and return to the main interface of command line. If you do not have any operation for the command within five minutes, the software will automatically exit and return to the main interface of command line. (9) Show The show command is used to display the product information. Type ‘show’ under the command prompt RDU_admin# and press the Enter key, as shown in the following figure. (10) Lookstatus The lookstatus command is used to display the system status and network status. Type ‘lookstatus’ under the command prompt RDU_admin# and press the Enter key, as shown in the following figure. You can type ‘0’ ~ ‘3’ to realize the different operation functions: z Type ‘0’ and press the Enter key: show the lookstatus command interface. z Type ‘1’ and press the Enter key: show the system status, as shown in the following figure. RDU-S Rack Data Unit User Manual 48 Appendix 1 Command Lines z Type ‘2’ and press the Enter key: show the network status, as shown in the following figure. z Type ‘3’ (or ‘q’) and press the Enter key: exit the lookstatus command interface and return to the main interface of command line. (11) Startmod The startmod command is used to start the DHCP service command. Type ‘startmod’ under the command prompt RDU_admin# and press the Enter key, as shown in the following figure. You can type ‘0’ ~ ‘2’ to realize the different operation functions: z Type ‘0’ and press the Enter key: show the startmod command interface. z Type ‘1’ and press the Enter key: start the DHCP client service. z Type ‘2’ (or ‘q’) and press the Enter key: exit the startmod command interface and return to the main interface of command line. If you do not have any operation for the command within five minutes, the software will automatically exit and return to the main interface of command line. Note 1. Upon the first startup of the system, a static IP address is assigned to the system, with DHCP disabled. Once the DHCP is started, a dynamic IP address is obtained each time the system starts. You can disable DHCP with the command stopmod. 2. If DHCP is enabled, there are two conditions as follows: 1) The system cannot obtain the IP address in five minutes, the IP address will be restored as 192.168.0.10. 2) The system obtains the IP address in five minutes, and then the system will be restarted automatically. Wait five minutes, and then you can view the dynamic IP address in the ‘Current_DHCP_IP.txt’ file in the background computer that is connected to the data unit through the USB CONFIG port. 3. Directly pressing the Enter key will leave the previous value unchanged. (12) Stopmod The stopmod command is used to stop the DHCP client service. Type ‘stopmod’ under the command prompt RDU_admin# and press the Enter key, as shown in the following figure. RDU-S Rack Data Unit User Manual Appendix 1 Command Lines You can type ‘0’ ~ ‘2’ to realize the different operation functions: z Type ‘0’ and press the Enter key: show the stopmod command interface. z Type ‘1’ and press the Enter key: stop the DHCP client service. z Type ‘2’ (or ‘q’) and press the Enter key: exit the stopmod command and return to the main interface of command line. (13) Setrtc The setrtc command is used to set the real time clock. Type ‘setrtc’ under the command prompt RDU_admin# and press the Enter key, as shown in the following figure. (14) Version The version command is used to show the device version information, including hardware version information and software version information. Type ‘version’ under the command prompt RDU_admin# and press the Enter key, as shown in the following figure. RDU-S Rack Data Unit User Manual 49