1
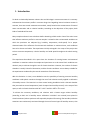
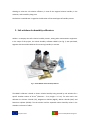
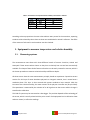
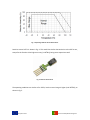
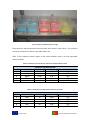
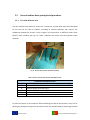
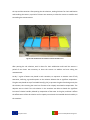
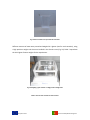
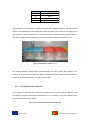
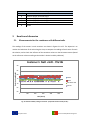
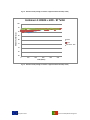
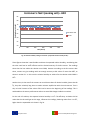
 PROJETOS DE INVESTIGAÇÃO CIENTÍFICA E DESENVOLVIMENTO TECNOLÓGICO
RELATÓRIO REFERENTE AO PROJETO PTDC/ECM/099250/2008
“Comportamento em serviço de estruturas de betão: uma abordagem multi-física das tensões
auto-induzidas”
Use of salt solutions for assuring constant relative humidity
conditions in contained environments
Autores:
Gonzalo Quincot
Miguel Azenha
Joaquim Barros
Rui Faria
Guimarães, UM, 2011
União Europeia – Fundos Estruturais
Governo da República Portuguesa
Content
1.
Introduction ................................................................................................................................ 3
2.
Salt solutions for humidity calibrators ........................................................................................ 4
3.
Equipment to measure temperature and relative humidity ....................................................... 5
2.
3.1.
Measuring systems .............................................................................................................. 5
1.2.
Preliminary sensor testing ................................................................................................. 12
Experimental program .............................................................................................................. 13
2.1.
2.1.1.
Containers ................................................................................................................. 13
2.1.2.
Testing the salts......................................................................................................... 13
2.1.3.
Preparing the salt solutions....................................................................................... 15
2.2.
5.
Environmental moisture control in containers ................................................................. 13
General outline: basic principle and procedure ................................................................ 17
2.2.1.
Test with different salts............................................................................................. 17
4.1.2.
Test with the same salt (NaCl)................................................................................... 20
Results and discussion ............................................................................................................... 21
5.1.
Measurements for the containers with different salts ..................................................... 21
5.2.
Measurements for the containers with the same NaCl salt ............................................. 25
5.3.
Water loss from the glasses placed inside the containers ................................................ 30
6.
Conclusions ............................................................................................................................... 31
7.
References ................................................................................................................................. 32
European Union
Governo da República Portuguesa
1. Introduction
To obtain a relationship between moisture loss and shrinkage in concrete structures it is necessary
to determine the moisture profile in concrete along time. Regarding internal moisture content in
concrete, there are several measurement methods, mostly based on the measurement of internal
water concentration and on relative humidity. According to the objectives of the project, both
kinds of methods will be used.
Many samples and tests have to be done before obtaining reliable results. One of the main issues
that influence moisture profiles in concrete samples is related to the environmental conditions to
which the specimens are subjected (e.g. humidity, temperature, wind speed). For a proper
characterization of the influence of environmental conditions on moisture losses, such conditions
have to be known and stable. The experiments initially envisaged in the scope of this project aim
to have constant temperature, relative humidity and wind speed throughout the whole testing
period.
The experiments described in this report have the intention of creating known environmental
conditions in containers where the samples and specimens are to be tested. Such conditions are
relatively easy to achieve through the use of climatic chambers. However, the number of climatic
chambers is usually limited in laboratories, and the climatic conditions are not always suitable for
the experiments conducted by the several researchers of the laboratory.
With this limitation in view, it was decided to test the possibility of assuring constant humidity
conditions inside plastic containers through the use of salt solutions usually applied in calibration
of humidity sensors. The intention is to have several testing humidities inside a climatic chamber
that just needs to control temperature (much cheaper than humidity control). In the scope of this
report, a walk-in climatic chamber with 20°C ± 0.2°C and RH = 60% ± 3% is used.
To achieve the necessary conditions, salt solutions with a known target relative humidity
(according to their use in humidity sensor calibration in Vaisala´s user manual) were placed in
closed containers (where specimens will expectably be placed for testing).The humidity inside the
containers was continuously monitored through the use of several types of humidity sensors, thus
European Union
Governo da República Portuguesa
allowing to relate the salt solution efficiency in view of the targeted relative humidity in the
container, and its stability along time.
Conclusions are withdrawn in regard to the behaviour of the tested types of humidity sensors.
2. Salt solutions for humidity calibrators
Vaisala is a company that sells relative humidity sensors, among other measurement equipment.
In the scope of this project, the Vaisala humidity calibrator HMK15 (see Fig. 1) was purchased,
together with the Vaisala HM44 set for measuring humidity in concrete.
Fig. 1. Vaisala HMK 15 relative humidity calibrator
The HMK15 calibrator is based on known relative humidity being assured by salt solutions for a
specific chamber volume of 20 cm3 (diameter = 5 cm, height = 3.5 cm). The salts used in the
calibrator are Lithium chloride (LiCl), Magnesium chloride (MgCl2), Sodium chloride (NaCl) and
Potassium sulphate (K2SO4). The salt solution and the expected relative humidity values in the
chamber are shown in Table 1.
European Union
Governo da República Portuguesa
Table 1. Salt solutions and expected relative humidity in the Vaisala´s calibrator
Salt
Water content Expected relative humidity
15g LiCl
12 ml
11%
30g MgCl2
3 ml
33%
20g NaCl
10 ml
75%
30g K2SO4
10 ml
97%
According to these proportions the same salts solutions were poured in the containers, expecting
to obtain relative humidity values close to those ones established in Vaisala´s calibrator. The effect
of the amount of salt used in each container was also checked.
3. Equipment to measure temperature and relative humidity
3.1.
Measuring systems
The measurements were done with three different brands of sensors: Sensirion, Vaisala and
Honeywell. These sensors where chosen as they have a relatively low cost and are commercially
available. The shape of these kind of sensors allow them to be easily inserted in concrete, which is
the chosen procedure to measure relative humidity at different depths.
All these sensors have the same measurement principle, based on capacitance. Capacitive sensors
consist of a thin layer of water absorbent polymeric or inorganic material, that is coated onto a
conductive base. This layer is then covered with porous conductive layer material. With the
increase of the relative humidity, the water content of the polymer increases too (Physics 2010).
The capacitance is measured by the variation of an AC signal across the sensor and this change is
transferred to a RH value.
This kind of system may be connected to a data logger. The precision depends of the technology of
the sensor, which is usually related with the price as well. Each equipment has its calibration sheet
and user manual, to refine the readings.
European Union
Governo da República Portuguesa
3.1.1. Sensirion sensors
The Sensirion sensors SHT21 and SHT71 were used in this experiment. These sensors are fully
calibrated (every sensor is individually calibrated and tested), have low power consumption, long
term stability and digital output, which is measured through the Sensirion Evaluation Kit EK-H4.
Sensirion sensor SHT21 is shown in Fig. 2; this model does not come with a pin connector, so the
connectors were adapted by the company as a request at the moment of purchasing the
equipment.
Fig. 2. Sensirion sensor SHT21
The accuracy of the sensors is ± 3%RH, with a response time of 8 seconds (the time that the sensor
takes recognize and read changes in the RH). Regarding the operating conditions, the sensor works
stable within the recommended normal range reproduced in Fig. 3. According to the
manufacturer, long term exposures to conditions outside the normal range, especially at humidity
higher than 90%RH, may temporary offset the RH signal (± 3%RH after 60 hours). After return to
normal range, the sensors slowly returns to normal behaviour and response time, according to the
Sensirion SHT21 data sheet. A reconditioning procedure may be used to accelerate the elimination
of the offset. The procedure is as follows: baking in the oven at 100–105°C and less than 5%RH for
10 hours. Then Re-Hydration at 20–30°C and 75%RH for 12 hours (John Newman 2003).
European Union
Governo da República Portuguesa
Fig. 3. Operating conditions for the SHT21 sensor
Sensirion sensor SHT71 is shown in Fig. 4. This model has similar characteristics to the SHT21 one,
except for the fact that it has higher accuracy (± 1.8%RH), being more expensive as well.
Fig. 4. Sensirion sensor SHT71
The operating conditions are similar as for SHT21, but the normal range is higher (until 95%RH), as
shown in Fig. 5.
European Union
Governo da República Portuguesa
Fig. 5. Operating conditions for the SHT71 sensor
The experimental set-up and the interface of the software for Sensirion sensors are shown in Fig.
6. The data logger has 4 channels, which is connected to a computer with the data logging
software.
a)
b)
Fig. 6. a) Schematic evaluation kit EK-H4 for Sensirion system; b) EK-H4 software window (sensors are displayed in
different colours)
European Union
Governo da República Portuguesa
3.1.2. Vaisala sensor
The Vaisala sensor HM44 has been designed specially to measure relative humidity inside concrete
(see Fig. 7). This sensor operates with an analogue signal, instead of digital, but the measure
principle is the same as Sensirion sensors, which is a capacitive sensor. The measurement range
for relative humidity is from 0 to 100% RH, with an accuracy of ± 2% RH for 0 to 90% RH) and ± 3%
RH for 90 to 100% RH. The response time is 15 seconds, that is, lower than in Sensirion sensors.
a)
b)
c)
Fig. 7. a) Vaisala´s HM44 sensor; b) Data logger; c) Kit for measuring RH inside concrete
For measurements in fresh concrete the procedure is as follows:
First, a hole is bored at the required depth, cleaned out, and a plastic sleeve is inserted.
European Union
Governo da República Portuguesa
The probe is inserted into the sleeve and sealed. The material at the bottom of the hole
releases humidity into the space around the probe until the equilibrium is reached.
When the humidity in the hole has reached equilibrium, the probe is inserted and left to
stabilize for a short time before a reading is taken.
1.1.1. Honeywell sensors
The Honeywell sensors HIH 4000 and HIH4010 have been used on this experiment (see Fig. 8).
These sensors have a nearly linear voltage output in regard to moisture variations. The input
current is 5V and each individual sensor has a calibration data sheet available (see Fig. 9).
Fig. 8. Honeywell sensors HIH4000 and HIH4010 series 003 and 004 from left to right
European Union
Governo da República Portuguesa
Fig. 9. Example of data calibration printout
The HIH4000 and HIH4010 sensors have an accuracy of ± 3.5% in a humidity range from 0% to
100%. The response time is 15 seconds for the HIH4000 sensor, and 5 seconds in the case of
HIH4010. The supply voltage range varies from 4V to 5.8V for HIH4000, and 2V to 5V in the case of
HIH4010. The operating temperature range is from -40°C to +85°C.
Data collection from the Honeywell sensors can be made with a general purpose data logger (with
capacity to measure potential in V). In the case of this research, a Data Taker DT515 (see Fig. 10)
together with a CEM20 expansion module was used (with a total of 30 measuring channels). The
interface used for these sensors is called DeLogger which belongs to the Data taker® suite.
Fig. 10. Data taker DT515 and CEM20 expansion module
Fig. 11a shows the wire scheme for Honeywell sensors and Fig. 11b shows the wires already
connected with a Honeywell 4010 sensor.
European Union
Governo da República Portuguesa
a)
b)
Fig. 11. a) Wire scheme of Honeywell sensors; b) wires installed on the sensor
1.2.
Preliminary sensor testing
Before the beginning of the experimental program envisaged in this report (test of salt solution
performance in order to assure constant humidity conditions), the sensors were exposed to
controlled environmental conditions, to compare differences between them and check the
accuracy of the readings.
The 4 types of sensors mentioned in Section 3.1 (Sensirion SHT21, Sensirion SHT71, Vaisala and
Honeywell HIH4000-4010) were placed in the controlled chamber at 60% RH and 20 °C.
Fig. 12 shows the readings during a period of 48 hours, starting 2 hours after the sensor´s
installation. As it is observed, the measurements were close to the target value of 60% RH given by
the climatic room. The range of the sensors goes from 58.6%RH for Vaisala sensor to 65.45%RH for
Sensirion SHT71. Considering the accuracy for Sensirion SHT71 of ±1.8%RH and for Vaisala of ± 2%,
an average relative humidity in the climatic room could be considered as 62%RH considering also
the accuracy of Sensirion SHT21 and Honeywell HIH4010.
After this test the sensors were ready to start the measurements.
Relative Humidity (%)
Environmental Conditions
75
70
65
60
55
50
45
40
SHT21
SHT71
Honeywell
Vaisala
0
10
20
30
40
50
Time (hours)
European Union
Governo da República Portuguesa
Fig. 12. Readings for environmental conditions
2. Experimental program
2.1.
Environmental moisture control in containers
2.1.1. Containers
Controlling the environmental conditions for the cement paste/mortar/concrete specimens is an
important issue. Fig. 13 shows the dimensions of the containers used for the specimens.
13.2 cm
10.7 cm
22.8 cm
Fig. 13. Containers dimensions
2.1.2. Testing the salts
The environmental moisture control in the containers was achieved through the use of salt
solutions, as referred before. As the volume of the used containers is different from the one in the
calibrator chamber by Vaisala (mentioned in Section 3.1), different proportions of salt were tested.
The salts from Vaisala´s calibrator are expensive; hence a local store of chemical products was
chosen to order the same salts. Lithium chloride (LiCl), Magnesium chloride (MgCl2), Sodium
chloride (NaCl) and Potassium sulphate (K2SO4) were purchased, and common cooking salt (NaCl)
was purchased as well to compare the behaviour against the Sodium chloride. The flasks
containing the salts used in this experiment can be seen in Fig. 14.
European Union
Governo da República Portuguesa
Fig. 14. Salts used for environmental control in the containers
Before starting the experiments, the chemical reaction of the salts had to be evaluated (see Fig.
13). Different salts have different chemical reactions and some of them can be dangerous. In this
case, the LiCl, the MgCl2 and K2SO4, are known to have aggressive reactions with water, according
to Vaisala´s Calibrator user guide. Especially, Lithium chloride, that is very corrosive and can easily
cause skin burn. Sodium chloride and the cooking salt were not tested because the behaviour is
known.
Fig. 15. Corrosive salts safety testing
European Union
Governo da República Portuguesa
The salts were placed with care and without skin contact in a glass slab and leaved there for 5
minutes to stabilize with the environment. Then small amounts of water were poured in each salt.
Magnesium chloride (MgCl2) and Potassium sulphate (K2SO4) did not present aggressive reaction
when the water was poured. Lithium chloride (LiCl) presented a high heat release which can be
really corrosive if enters in contact with skin. Based on this test, the heat release of Lithium
chloride reaction with water last between 6 to 8 minutes.
2.1.3. Preparing the salt solutions
The salt solutions were used to obtain different relative humidity values in each container. Two
groups of 5 containers each were used. In one group different salts in the same quantity were
used. In the second group the same NaCl salt was used in each container, but in different
quantities. Fig. 16 shows the containers numbered from left to right. Both groups respect the
same order. The proportions for the salt solutions and the expected relative humidity were
presented in Table 1. The quantities actually used in the containers are reproduced in Table 2 and
in
Table 3, and fulfil the target values of Table 1 for each expectable relative humidity.
1
European Union
2
3
4
5
Governo da República Portuguesa
Fig. 16. Containers numbered from left to right
The proportions and the expected relative humidity were shown in table Table 1. The quantities
used in the containers are shown in the table Table 2 and
Table 3. The proportion remains respect to the values showed in table 1 for each expectable
relative humidity.
Table 2. Proportions for the salt solutions used in the containers (different salts)
Containers with different salts
Container
Salt
Salt content (g) Water Content (g) Expected relative humidity
1
NaCl
53.33
27.28
75%
2
LiCl
53.33
43.64
11%
3
MgCl2
53.33
5.46
33%
4
K2SO4
53.33
18.19
97%
5
Cooking Salt (NaCl)
53.33
27.283
75%
Table 3. Proportions for the NaCl solutions used in the containers
Containers with equal salt (NaCl)
Container
Salt
Salt content (g) Water Content (g) Expected relative humidity
1
NaCl
20
10.23
75%
2
NaCl
30
15.35
75%
3
NaCl
40
20.46
75%
4
NaCl
50
25.58
75%
5
Cooking Salt (NaCl)
30
15.35
75%
European Union
Governo da República Portuguesa
2.2.
General outline: basic principle and procedure
2.2.1. Test with different salts
The salts solutions were placed in each of the 5 containers, and the latter were left undisturbed
for 24 hours for the salts to stabilize, according to Vaisala´s calibrator user manual. The
comparison between the sensors is also a target in this experiment, so different sensors were
placed in each container (see Fig. 17). Table 4 indicates the sensors that were placed in each
container.
Fig. 17. Sensors ready to place inside the containers
Table 4. Sensors used for each container with different salts
Containers with different salts
Container
Sensors
1
Honeywell HIH 4010 004, Vaisala, Sensirion SHT21, Sensirion SHT71
2
Sensirion SHT21, Sensirion SHT71
3
Sensirion SHT21, Sensirion SHT71
4
Sensirion SHT21, Sensirion SHT71
5
Honeywell HIH 4010 004, Vaisala
To place the sensors in the containers without affecting the internal environment, every hole or
opening for passing the wiring has to be sealed. In this case tape was used to seal the gap between
European Union
Governo da República Portuguesa
the cap and the container. After pouring the salt solutions, waiting 24 hours for their stabilization
and installing the sensors, a period of 2 hours was necessary to allow the sensors to stabilize and
start taking the measurements.
Fig. 18. Final distribution of the containers and the installed sensors
After pouring the salt solutions, wait 24 hours for their stabilization and install the sensors a
period of two hours was necessary to leave the sensors to stabilize and start taking the
measurements.
At day 7 a glass of water was placed in each container, to represent an extreme case of fully
saturation, enforcing a great disruption to the moisture balance due to significant evaporation.
The glass was placed on top of a suitable base (Fig. 20), to prevent the glass from being wet by the
salt solution, thus ensuring the mass loss of water to be uniquely associated to evaporation. The
objective was to check if the salt solution in the container was able to absorb the significant
increase of relative humidity induced by evaporation of the water in the glass, and how it affects
the effectiveness of the salt solution and its capacity to maintain the intended relative humidity in
the container.
European Union
Governo da República Portuguesa
Fig. 19. Glass and base to be put inside the containers
Different amounts of water were poured and weighed in 4 glasses (one for each container), using
a high precision weight scale that was installed in the climatic room (Fig. 20). Table 5 reproduces
the initial glass of water weights for the experiments.
Fig. 20. Weighing a glass of water in a high precision weight scale
Table 5. Glass of water content for each container
European Union
Governo da República Portuguesa
Container Glass of water content (gr)
1
44.23
2
45.99
3
44.89
4
44.82
Upon placement in the containers, the glasses of water were weighed regularly. Care was taken to
minimize the disturbance to the experiment caused by opening the container and weighing the
glass of water. In fact, the operation has to be relatively fast, and the container should be kept airtight while the glass is being weighed. Fig. 21 shows the glasses placed in containers 1 to 4.
Fig. 21. Glasses placed in containers 1 to 4
The relative humidity measurements continued after the water glasses were placed in the
containers. The idea was that ideally the stability of the environment created by the salt solutions
should not be affected because of the glass of water inside.
4.1.2. Test with the same salt (NaCl)
For this group of containers the procedure was similar to the first one, with the difference that
only Sensirion sensors were placed simultaneously in 1 to 4 containers, and only a Vaisala sensor
was used in container 5 (see Table 6).
Table 6. Sensors used for each container with the NaCl salt
European Union
Governo da República Portuguesa
Containers with equal salt
Container
Sensors
1
Sensirion SHT21, Sensirion SHT71
2
Sensirion SHT21, Sensirion SHT71
3
Sensirion SHT21, Sensirion SHT71
4
Sensirion SHT21, Sensirion SHT71
5
Vaisala
5.
Results and discussion
5.1.
Measurements for the containers with different salts
The readings of the sensors in each container are shown in Figures 21 to 25. The objective is to
monitor the behaviour of the salts along the time, to compare the readings of each sensor for each
salt solution, and to check the influence of the containers volume on the RH measurements (based
on the reference values according to the Vaisala´s relative humidity calibrator).
Container 1: NaCl + H20 - 75% RH
90
Relative humidity (%)
85
80
SHT21
75
SHT71
HIH 4010 - 004
70
Vaisala
65
60
0
100
200
300
400
500
Time (hours)
Fig. 22. Relative humidity readings in container 1 (expected relative humidity of 75%)
European Union
Governo da República Portuguesa
Container 2: LiCl + H20 - 11% RH
30
Relative humidity (%)
25
20
SHT21
SHT71
15
HIH 4010 - 004
10
5
0
100
200
300
400
500
Time (hours)
Fig. 23. . Relative humidity readings in container 2 (expected relative humidity of 11%)
Container 3: MgCl2 + H2O - 33% RH
50
Relative humidity (%)
45
40
SHT21
35
SHT71
HIH 4010 - 004
30
25
20
0
100
200
300
400
500
Time (hours)
European Union
Governo da República Portuguesa
Fig. 24. . Relative humidity readings in container 3 (expected relative humidity of 33%)
Container 4: K2SO4 + H2O - 97 % RH
100
95
Relative humidity (%)
90
85
SHT21
80
SHT71
75
HIH 4010 - 004
70
65
60
0
100
200
300
400
500
Time (hours)
Fig. 25. . Relative humidity readings in container 1 (expected relative humidity of 97%)
European Union
Governo da República Portuguesa
Container 5: NaCl (cooking salt) + H2O
85
Relative Humidity (%)
80
75
70
HIH 4010 - 004
65
Vaisala
60
55
50
0
100
200
300
400
500
Time (hours)
Fig. 26. Relative humidity readings in container 5 (expected relative humidity of 75%)
These figures show that it was feasible to achieve the expected relative humidity, considering that
the salts could not be 100% efficient and the limited accuracy of the RH sensors. The readings
show that the less stable salt solution was K2SO4, however according to the RH sensors data
sheet, sensors can give readings with not enough accuracy at RH values of more than 90%, as
shown in section 3.1. In this case the relative humidity to achieve for the solution with K2SO4 is
97%.
Another issue, is that even if the sensors can reach those values of relative humidity (more than 90
%), they take relatively long times to attain moisture equilibrium with the environment. That is
why an initial increase of the values of RH can be seen at the beginning of the readings. This is
attributable to the sensor performance and not to actual RH changes inside the container.
For the salt LiCl solution, the expected relative humidity is 11%. The efficiency to obtain this RH
value that the salt could get at this range, influence the readings, obtaining values from 1 to 2%,
higher than the expectable as is shown in Fig. 24.
European Union
Governo da República Portuguesa
Regarding the readings of the sensors, the most stable was the one from Vaisala. Its readings are
useful as a reference to compare the readings of the other sensors. Usually, the behaviour of the
sensors is as follows: Sensirion SHT71 gives the highest values and the lowest values are given by
Honeywell sensors HIH4010.Sensirion SHT21 readings are in the middle.
Finally, in regard to the use of the cooking salt, the readings have shown that is feasible to achieve
a constant relative humidity with this kind of solution. This is an important conclusion in view of
establishing low-cost solutions for moisture control and testing of cement-based materials.
5.2.
Measurements for the containers with the same NaCl salt
The readings of the sensor in each container are shown in Fig. 27 to Fig. 31. In these experiments
the NaCl salt is used in the solution, and the influence of the quantity of salt in humidity control is
to be assessed. The reference value is RH = 75% according to Vaisala´s relative humidity calibrator.
After the glass of water is placed in containers 1 to 4 at the age of 7 days, the measurements
continued from then on.
Container 1: 20 gr NaCl + 10.23 gr H20
90
Glass of water inside
Relative humidity (%)
85
80
SHT21
75
SHT71
70
Day 7
65
0
100
200
300
400
500
Time (hours)
Fig. 27. Relative humidity readings in container 1 (solution for 20 gr of NaCl)
European Union
Governo da República Portuguesa
Container 2: 30 gr NaCl + 15.35 gr H20
90
Glass of water inside
Relative humidity (%)
85
80
SHT21
75
SHT71
70
Day 7
65
0
100
200
300
400
500
Time (hours)
Fig. 28. Relative humidity readings in container 2 (solution for 30 gr of NaCl)
European Union
Governo da República Portuguesa
Container 3: 40 gr NaCl + 20.46 gr H2O
90
Glass of water inside
Relative humidity (%)
85
80
SHT21
75
SHT71
70
Day 7
65
0
100
200
300
400
500
Time (hours)
Fig. 29. Relative humidity readings in container 3 (solution for 40 gr of NaCl)
European Union
Governo da República Portuguesa
Container 4: 50 gr NaCl + 25.58 gr H2O
90
Glass of water inside
Relative humidity (%)
85
80
SHT21
75
SHT71
70
Day 7
65
0
100
200
300
400
500
Time (hours)
Fig. 30. Relative humidity readings in container 4 (solution for 50 gr of NaCl)
European Union
Governo da República Portuguesa
Container 5: 30 gr NaCl (cooking salt) + 15.35 gr H2O
85
Relative Humidity (%)
80
75
70
65
Vaisala
60
55
50
0
100
200
300
400
500
Time (hours)
Fig. 31. Relative humidity readings in container 5 (solution for 30 gr of NaCl "cooking salt")
All the containers could give values near to the expected relative humidity of 75% and the quantity
of salt solution did not really change the tendency to give readings near 75% RH. However, the
influence of the amount of salt solutions is clear in regard to the stability of the container RH after
the water glass is placed inside. The higher the amount of salt solution, the smaller the difference
between the sensor readings. Hence, containers 3 and 4 (40gr and 50gr of NaCl respectively)
showed more stability in the readings before placing the glass of water and a small difference
between the readings of relative humidity after that.
Container 5 revealed stable readings during 500 hours (~21 days), being able to maintain the
relative humidity, which confirms the feasibility of using cooking salt as an agent to create
controlled relative humidity.
European Union
Governo da República Portuguesa
5.3.
Water loss from the glasses placed inside the containers
While checking the stability of the salts solutions and the influence of the glass of water for the
relative humidity measurements, the loss of water from the glasses was monitored as well
through regular weighing. It is important to note that this kind of monitoring, considering the
limitations of the containers and the climatic room, could not be as frequent as for the RH
measurements.
Water loss through evaporation occurs associated to three main factors: environmental relative
humidity, temperature and wind speed. Handling the glass, opening the container to take out the
glass, waiting and placing the cup outside until the weighing is finished, will change the three
mentioned factors. This can affect the results, superimposing the loss of water due to the salt
solution and the one due to the environmental exposure.
For each container, Fig. 32 shows the loss of water mass from the glasses.
2
1.8
Water loss ratio (gr)
1.6
1.4
1.2
Container 1
1
Container 2
0.8
Container 3
0.6
Container 4
0.4
0.2
0
0
100
200
300
400
500
Time (hours)
Fig. 32. Loss of water in the glasses inside the containers
European Union
Governo da República Portuguesa
The loss of water is small during the first day of placement. After 2 days the loose of water is
higher because of the solutions adsorption. Finally, the loss of water decreases because the salts
finish the adsorption process.
Even with differences in the loose of water and in the behaviour of each solution, in 16 days 3.3 gr
have been lost in the container with more amount of salt, with a tendency to decrease the loose
as the salt solutions stabilize. The same for the other containers.
According to the measurements, if a concrete specimen is placed inside the containers, can be
predicted that the loss of moisture will not be affected significantly by the salt solution.
6.
Conclusions
On the present experiments, the possibility of creating controlled environmental conditions using
salt solutions in simple containers was studied with favourable results. Using simple containers
that are commercially available, and salt compositions that were not specifically designed for
environmental control, it was possible to create constant relative humidity conditions along time.
Different values of relative humidity could be reached, and the performance of the salt could be
analysed. At the same time, it has been of relevance to compare and to check the RH sensors
performance, to allow appropriate decisions about the type of sensor more suitable for particular
targets in the future (either inside laboratory or for in-field applications).
Reaching stability of sensor readings at low and at high RH values was difficult, because of the salt
solutions stability and of the accuracy of the sensors at these extremes. It is common that RH
sensors have limitations reaching relative humidity below or near 10% RH, and above 90% RH, as it
was observed on the readings for the salt solutions used.
Regarding the salt solutions, as larger the container the more salt would be necessary to reach a
stable environment. A good practice or visual technique to achieve this is to cover the base of the
container with at least 3 mm of salt, in the proportion which is required to obtain certain relative
humidity.
European Union
Governo da República Portuguesa
As it was showed in the results for the containers with cooking salt, it is feasible to achieve
constant RH with this kind of salt. This opens the possibility to create homemade controlled
environments when there are no other resources.
Finally, the glasses of water placed inside the containers made the relative humidity values to
increase, but with a smaller variation in the case of the containers with more quantity of salt
solution. This shows that this effect can even disappear or be disregarded putting a higher amount
of salt solution to control and reach certain relative humidity.
After this approach, the objective of creating a controlled environment for concrete or porous
material specimens to analyse the loss of moisture, shrinkage or any other phenomena requiring
known environmental conditions has been achieved in an economical way. The testing of concrete
specimens subject to different relative humidity in a controlled environment will be feasible with a
wide range of options that consider volume, size of the specimen and a specific value of relative
humidity.
7.
References
John Newman, B. S. C. (2003). "Advanced Concrete Technology : Concrete Properties."
Butterworth-Heinemann 1: 5-11.
Physics, C. (2010). "Relative humidity sensors": 1-3.
European Union
Governo da República Portuguesa