1
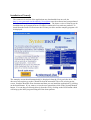
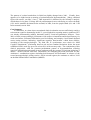
NeuroQ™
Quantitative Analysis for Neuroimaging Technology
Display and Analysis Program
Version 3.0
Operator Guide
rev’d June, 2008
Copyrights, Trademarks, Restrictions
© Copyright 2005-2008, by Syntermed, Inc.
All rights reserved.
Revision 07, Published 2008
Printed in the United States of America
Syntermed reserves the right to modify the design and specifications contained herein without
prior notice. Please contact your local Sales Representative for the most current information.
No part of this documentation may be reproduced or transmitted in any form by any means,
electronic or mechanical, without written permission of Syntermed.
NeuroQ™ is a registered trademark of Syntermed, Inc.
2
Table of Contents
OVERVIEW ................................................................................................................................................. 4
INSTALLATION OF NEUROQ................................................................................................................. 5
LAUNCHING THE PROGRAM ................................................................................................................ 6
PROCESSING .............................................................................................................................................. 7
NEUROQ™ ANALYSIS SCREEN ....................................................................................................... 10
NEUROQ™ DISPLAY SCREEN .......................................................................................................... 14
NEUROQ™ QUALITY CONTROL SCREEN ........................................................................................... 22
NEUROQ™ COPMARE DISPLAY SCREEN ............................................................................................ 25
NEUROQ™ PER/CT DISPLAY SCREEN .............................................................................................. 26
EQUAL™ ANALYSIS .............................................................................................................................. 27
DESCRIPTION OF EXAMPLE PATIENT’S ......................................................................................... 24
DEMO, CASE1 – NORMAL CASE ............................................................................................................. 24
DEMO, CASE2 – MILDLY ABNORMAL .................................................................................................... 25
DEMO, CASE3 – SEVERELY ABNORMAL................................................................................................. 27
REFERENCES FOR CASE STUDY 2........................................................................................................... 29
REFERENCES FOR CASE STUDY 3........................................................................................................... 29
REFERENCES RELATED TO NEUROQ DEVELOPMENT ........................................................................... 30
ADDITIONAL REFERENCES ............................................................................................................ 32
APPENDIX I – BRAIN PET SCAN VISUAL INTERPRETATION .................................................... 33
APPENDIX II – REGIONAL HYPOMETABLOSIM IDENTIFIED BY FDG-PET .......................... 36
APPENDIX III – MEDICARE CHECKLIST TO DETERMINE FDG-PET DEMENTIA................ 38
APPENDIX IV – USING CLINICAL BRAIN PET FOR EVALUATION OF DEMENTIA.............. 39
3
NeuroQ™
QUANTITATIVE ANALYSIS FOR NEUROIMAGING TECHNOLOGY
Version 3.0
OVERVIEW
The NeuroQ™ Display and Analysis Program has been developed to aid in the assessment of
human brain scans through quantification of mean pixel values lying within standardized regions
of interest, and to provide quantified comparisons with brain scans derived from FDG-PET
studies of defined groups having no identified neuropsychiatric disease or symptoms, i.e.,
asymptomatic controls (AC). The Program provides automated analysis of brain PET scans,
with output that includes quantification of relative activity in 240 different brain regions, as well
as measures of the magnitude and statistical significance with which activity in each region
differs from mean activity values of brain regions in the AC database. The new features of
version 3.0 include NeuroQ™ Quality Control Screen, PET/CT display screen, patient study
comparison analysis, and EQuAL™ a tool for evaluating temporal lobe Epilepsy. This manual
describes the display and analysis features of the Program, and their end-user operation.
Program Description
The NeuroQ™ Program is indicated to:
1) assist with regional assessment of human brain scans, through automated quantification of
mean pixel values lying within standardized regions of interest (S-ROI’s), and
2) assist with comparisons of the activity in brain regions of individual scans relative to normal
activity values found for brain regions in FDG-PET scans, through quantitative and statistical
comparisons of S-ROI’s.
The program requires the operator to select the patient’s FDG-Brain scan. Following a number
of internal checks on the data (e.g., accurate radiopharmaceutical), the operator has to initiate the
elastic spatial reformatting or normalization of the patient’s scan into a standardized volumetric
space. Following this step, the program determines the uptake in 240 ROIs, normalized to the
uptake in the subject’s sensorimotor cortical region (S-ROI). The uptake in the ROIs is then
compared to a normal data base of uptakes, based upon uptake in the corresponding S-ROIs
determined in 50 normal subjects without identified neuropsychiatric disease. Any region with
an uptake below 1.65 S.D of the mean, established from the normal data base is considered
abnormal.
4
Installation of NeuroQ
The commercial versions of the applications are downloaded from our web site
http://www.syntermed.com/downloads_NeuroQ.htm once the software has been purchased
the software license is sent to enable the applications. The demo version of NeuroQ can be
installed from our Syntermed Demo CD which contains all of our software products. To
install from the Demo CD first insert the CD into your drive and the autoplay program will
be displayed.
The Autoplay screen should automatically be displayed when the CD is put in the drive. If it
does not come up then go to the CD and click on the autorunNCTb.exe file to bring up the
screen. Read the Read Me First document and then you can install the applications by clicking
on the Install button. If you want to review the user manual then click on the NeuroQ Manual
button. You can then run NeuroQ directly from the CD by clicking on the RUN button which
will bring up the MCP program listing all of the demo patients.
5
LAUNCHING THE PROGRAM
1) There are multiple ways to launch the NeuroQ program. You can launch it
from the Windows operating system by double-clicking on the Syntermed
Icon on your desktop (shown on the left), or you can go to the C:\Program
Files\Syntermed\Syntermed Demo 2008\MCP folder and double-click on
the MCP.exe application.
Once MCP is launched the following screen will be displayed:
2) There are three demo cases numbered 1-3 which have not yet been processed. There is also
one study, Demo Case 3, that has already been reformatted that is included in the list and is
called NeuroQ (20 iterations). If you select the NeuroQ (20 iterations) study then it will
bring up the study that has already been processed. For the other studies you will need to
process them. There are also demo cases for EQuAL, PET/CT and Study Comparison.
6
PROCESSING
3) The PET FDG brain files in DICOM format need to be selected and imported into the
NeuroQ program. Once this is done the initial NeuroQ screen will be displayed which is
shown below. The image on the left is mid transaxial slice of the patient. The image in the
middle represents the mid transaxial slice of the normal template. The normal template
images are from a high-quality normal brain FDG PET scan acquired at UCLA and these are
the images in which the 240 standardized regions of interest were defined. Note: The
NeuroQ program can only handle brain data sets which contain actual brain data. If
slices are submitted to the NeuroQ program for reformatting which are outside of the
brain region then including these images along with the images containing brain
activity could result in inaccurate results.
4) The patient’s transaxial slices must be reformatted to fit the normal template transaxial slices.
This is performed from the Processing menu item: select Reformat from the drop down box
as shown below. The registration algorithm used for reformatting the patient’s data is a
robust spatial transformation method published by Henry Huang and Ed Hoffman, along with
their collaborators. It was originally described in IEEE (Tai et al., IEEE Trans. Nucl. Sci.
NS-44 1997; 4: 1606-1612.)
7
5) For the most standard use of the Program (i.e., comparing an individual scan from the enduser's site to NeuroQ's built-in database), it is recommended to use 20 iterations, and this is
the only option that normally will ever need to be selected. The other choices in the Iterations
pull-down menu (1, 2, 5, 10 and 15) have been retained in order to allow flexibility to use
the tool in other ways: for example, 1) rapid testing of software operability by selecting a
small number of iterations, 2) processing a batch of scans acquired at the end-user's site to
create a new database with whatever number of iterations is desired, 3) sequential use of the
reiteration routine, such as adding another 5 iterations to a scan that had already been reiterated 20 times in order to obtain a closer spatial fit in a case where the individual's original
scan is structurally very different from the normal template scan, 4) various research
applications, etc.
6) Once the Reformat option has been selected, an information box will be displayed informing
you of the number of iterations you have selected.
7) Click on the OK button and the patient’s study will be reformatted to align with the normal
template. On a current processor (1.7GHz) the reformatting will take approximately 2-3
minutes.
8
8) Once the study is reformatted the final quantitative analysis output will be displayed which is
shown below.
The left side of the window contains the “NeuroQ™ Analysis” screen and the right side
contains the “NeuroQ™ Display” screen. These displays are defined below.
9) Note: There is a possibility of 3 output files that can be created from the processing of the
NeuroQ study if the user selects to save the files. All of these files will be saved in the
patient’s folder which contains their imaging data. The files are as follows:
a. A file called NeuroQ Review File which contains the processed data for the
patient using the indicated number of iterations. When you enter the program the
next time you can select just this file which will show the results for that patient
with the number of iterations selected without having to reformat the patients
study again.
b. A file called patientname_ROIdata.dat which contains the information related to
the region of interests generated during the processing.
c. A file called patientname_ROImean.dat which contains the mean values
generated from the ROI analysis.
9
NeuroQ™ ANALYSIS SCREEN (Left Side)
2
3
4
5
6
7
8
9
1
12
13
17
14
16
15
18
19
1. File Menu – this allows the
user to print the current
screen, save the screen in
various formats, and allows
the user to exit. The
options for save screen
formats are listed to the
right. Note: The DICOM
Screen Capture allows the
data to be saved in a format
acceptable by PACS
systems.
10
10
11
2. Processing Menu – allows user to reformat the brain, the default number of iterations is 20
and that value will be used if the Reformat option is selected from the Processing drop down
list. This processing step is described above in the Processing section.
3. Display Menu – the display menu allows you to display the Color Scale and a list of region
abbreviations. The options are shown below.
a. “Show Color Scale” provides a legend of the
two-dimensional color coding. The number of
Standard deviations is listed on the Y axis and
the % below the mean normal value is listed on
the X axis.
b. “List Region Abbreviations” will list the various
abbreviations used in the application along with
their meaning, i.e. rAVC = right Associative
Visual Cortex.
4. QC – The Quality Control screen allows the user to apply some preprocessing steps including
setting axial planes limits, removing scalp activity, and performing a rigid registration. See
Quality Control section below for a further description.
5. Slices – When the Slices button is selected it will bring up a new display window which
initially will display the patients transaxial slices. From the Slice Display menu item you can
also select to display the sagittal or coronal slices. This display is shown below.
11
The initial display will show the patients slices in inverted
grey scale. An option is provided to display the slices using
other color tables by clicking on the CM (Color Map)
button located above the color table bar. A list of color
tables will be displayed, as shown to the left. You can select
any of these color tables and the display will change to
reflect this new table.
Changing top/bottom contrast – At the top of the color bar
is a value of 100 and at the bottom a value of 0. If you
position your cursor over one of these numbers, click left,
hold down, and move the value up or down you can adjust
the contrast in the image. The upper value (100) when
moved down will lower the upper value producing a
brighter image. The lower value (0) when moved up will
increase the lower value resulting in reducing counts in the
image at the low end of the scale or darken the image.
Note: to go back to the previous screen click on the Main
button.
12
6. Compare – The compare screen allows the user to compare two studies from the same patient
performed at different times. This analysis provides a Difference Image between the two
studies showing which regions showed a change in hypo or hyper metabolic activity between
the two studies. See the description of the Compare feature below.
7. PET/CT – The PET/CT screen allows the user to display both the PET and CT studies for the
same patient and fuse those two data sets using scroll bars. See the description of the
PET/CT feature below.
8. EQuAL – Reprint of article in JNM about Extent-Specified Quantified Asymmetry-of-Lobe
(EQuAL) analysis which is a program that will be helpful for evaluating temporal metabolic
asymmetry.
9. Data – this button will
display the data screen which
gives the “mean” (average
number of counts per second
per pixel in ROI) for each of
the 240 ROIs of the patient,
“norm” refers to the “mean”
normalized to the average of
all pixels in all ROI’s
(default). This screen is
shown below. This data can
be saved and then imported
into another application like
Excel for further analysis.
10. Save – this option when selected will save all of the reformatted data and analysis into a
single file called the NeuroQ Review File. This file can then be selected and the previous
reformatted data and analysis will be displayed. This avoids having to reformat the data if it
needs to be displayed at another time.
11. Help – this option will display the
version number of NeuroQ and also
a description of what the colors
mean in the NeuroQ display.
13
12. Patient Information – displays patient information.
13. Patient Brain Display – displays the original patient brain transaxial slices.
14. Left Plane Slider – controls the brain plane of the above patient brain display, the current
plane number is displayed above the slider, slide to the left or right to access lower or higher
planes respectively.
15. Normal Template Brain – based on an archetypal normal brain with no clinical or metabolic
signs of neurodegenerative disease; ROI values for each plane are drawn in with a white
outline.
16. Middle Plane Slider - controls the brain plane of the normal brain display and the reformatted
patient brain display at right; the current plane number is displayed above the slider, slide to
the left or right to access lower or higher planes respectively, simultaneously for both
displays.
17. Reformatted Patient Brain – brain is based on specified number of reiterations of the original
patient brain scan; this display only appears after reiteration of brain images. All abnormal
regions will be displayed in a two-dimensional coded color scale, click on the Help button for
color coding explanation.
18. Table of Abnormal Regions – displays all regions having internally normalized region of
interest (ROI) radiotracer uptake values falling more than 1.65 standard deviations below the
mean value (in the Hypometabolic operation) and more than 1.65 standard deviations above
the mean value (in the Hypermetabolic operation) for a symptomatic control group; regions
are displayed in abbreviated form with the plane number after the “.p”; the last row of the
table gives a total of the “Pt-M(AC)” and “#SD from M(AC)” columns.
19. Table of Cluster Values – the ROI cluster value is based on the average of the represented
region across all planes where it is assessed.
14
NeuroQ™ DISPLAY SCREEN (Right Side)
1
2
3
4
5
6
15
1. File Menu – user can choose the option to “Print”, “Save”, or “Quit”
2. Reference Region Menu – user can select which cluster (among “Pons”, “Cerebellum”,
“Sensorimotor”, “Thalamus”, or “Whole Brain”) to base the normalization of the regions on.
NOTE: the default normalization is based on the whole brain.
3. Metabolism Menu – “Hypometabolism” displays the most hypometabolic regions and
performs calculations accordingly, “Hypermetabolism” displays the most hypermetabolic
regions and performs calculations accordingly, NOTE: default is “Hypometabolism”.
From the Display menu item you can select “Show
Color Scale” to provide a legend of the twodimensional color coding.
4. Brain Plane Displays – includes schematic display of each of the 47 ROI clusters, shown at
the normal template planes numbered below each image. Refer to the “Show Color Scale”
description for color coding explanation. Clicking on a ROI causes the full name and
numerical characterization of that region to appear in the Data Display area (5).
5. Data Display – displays information based on the last ROI cluster the user clicked on.
6. Regional and Cluster Data – gives the most hypometabolic or hypermetabolic and most
significant regions and clusters.
16
NeuroQ™ QUALITY CONTROL SCREEN
The Quality Control Screen is comprised of three sections: Set Axial Plane Limits, Removal of
Scalp Activity, and Rigid Registration.
Set Axial Plane Limits
This feature allows the user to set the upper and lower limits for reconstruction by clicking the
up and down arrows to move the lines. The limits can also be set by moving the cursor to a point
on the image and click left to set the limit. The limits should be set so that only the brain images
are included in the reconstruction. When the limits are set to the proper location check the
Accept box.
17
Removal of Scalp Activity
This feature allows for the removal of the scalp activity around the brain. In some cases there is
excessive scalp activity which can interfere with the reformatting of the patients study to match
the normal template. Move the slider bar to the desired threshold and then click on the Process
button. The processed images are shown in the bottom row. Triangulation is enabled on these
images by clicking left on any image and it will show you the plane for that location on the other
two images. When the images are acceptable, check the Accept box.
18
Rigid Registration
The Rigid Registration allows for applying additional registration prior to the reformatting
process used in NeuroQ. This additional registration is helpful in cases where the patients head
has excessive tilt. The top row shows the normal template as the reference image the middle row
are the patients images and the bottom row are the fused reference and patient images after
realignment. Triangulation is enabled on these images by clicking left on any image and it will
show you the plane for that location on the other two images. When the images are acceptable,
check the Accept box.
19
NeuroQ™ COMPARE DISPLAY SCREEN
The NeuroQ Compare Screen is enabled by selecting the two studies from the MCP screen and
clicking on the launch button. Once NeuroQ is launched it will show the most recent study in
the main NeuroQ screen. Click on the Compare button and the Compare display screen will be
shown. The oldest study is displayed in the top row, the most recent in the middle row, and the
difference image is displayed in the bottom image to the right. Use the middle slider bar in the
middle row to step through the planes. All images with the exception of the patient’s images in
the left hand column will move when the slider bar is moved left or right. The difference image
shows the regions in which there is at least a 1 standard deviation difference between the original
and recent study. This analysis is helpful to monitor the progression of dementia over a period of
time.
20
NeuroQ™ PET/CT DISPLAY SCREEN
The PET/CT display allows for displaying both the PET and CT brain images from the same
patient. The PET brain images are contained in the top row. The PET brain images brightness
can be changed by sliding the PET Max Level slider up or down. The CT images are contained
in the middle row. The CT brain images window level can be changed by manipulating the
sliders for CT Level and CT Window up or down. The user also has the option picking preset
windows for Neuro or Bone in the Preset Windows drop down box. The bottom row contains
the fused images. The PET/CT slider bar allows the user to display only the PET (slider all the
way up), only the CT (slider all the way down), or fused (slider in the middle). Various levels of
fusion can be displayed by moving the slider up or down. Triangulation is enabled on the PET,
CT and Fused images by clicking left on any image and it will show you the plane for that
location on the other two images.
21
EQuAL™ ANALYSIS
The Extent-Specified Quantified Asymmetry-of-Lobe (EQuAL) Analysis will be included with
the NeruoQ 3.0. This program is useful for assessing maximal temporal asymmetry over a
specified proportion of the temporal lobe which may help to predict whether patients will likely
be free of seizueres during the years after neurosurgical resection of epileptogenic tissue
To use EQuAL, select the patient desired and launch NeuroQ from MCP. Process the study as
you would normally. Once NeuroQ is finished reformatting the data, select the EQuAL tab from
the top of the screen. Select the image that the user feels best exemplifies the asymmetrical
defect. Use the slider bar on the right hand side of the screen to see all slices. See example
above.
Once an image has been selected, the EQuAL ROI screen will appear. Follow the on screen
instructions to get the Asymmetry Index (AI).
22
The results of this study were by Lin et. al from the Department of Molecular and Medical
Pharmacology, David Geffen School of Medicine, UCLA Los Angeles was published in the May
issue of the Journal of Nuclear Medicine:
Tina W. Lin, Michelle A. Kung de Aburto, Magnus Dahlbom, Lynn L. Huang, Michael M.
Marvi, Michael Tang, Johannes Czernin, Michael E. Phelps, and Daniel H.S. Silverman.
Predicting Seizure-Free Status for Temporal Lobe Epilepsy Patients Undergoing Surgery:
Prognostic Value of Quantifying Maximal Metabolic Asymmetry Extending over a Specified
Proportion of the Temporal Lobe. J Nucl Med. 2007 48(5): 776-782.
23
Description of Example Patient’s
1. Demo, Case1 – Normal Case
This case demonstrates the quantitative
output produced by NeuroQ when it is
used to analyze a normal study. The blue
areas within the cluster regions indicate
that the metabolic uptake was all above the
normal limit of 1.65 standard deviation.
Mr. E was 71 years old when he was first
referred to the UCLA Ahmanson
24
2. Demo, Case2 – Mildly Abnormal
Patient History
Mr. E was 71 years old when he was first
referred to the UCLA Ahmanson
Biological Imaging Division in December
2001 with concern for worsening memory.
He reported that he always had a poor
memory, but that over the preceding seven
years, he began to notice his memory
getting worse, including forgetting where
he put his keys and forgetting names or
faces. Mr. E had worked as a physicist for
25 years and taught physics at the
University-level for the following 20
years.
He reported no psychiatric
hospitalizations, illness, or medication use.
Mr. E had no significant medical history,
including hospitalizations or illness, with
the exception of prostate surgery for
benign enlargement. He did not use
tobacco, alcohol or other drugs and had no
history of such use.
His physical
examination, neurologic exam and blood
laboratory values (including TSH, B12,
CBC, ALT and Cr) were within normal
limits.
Mr.
E
underwent
comprehensive
neuropsychologic testing at the time of his
first visit in 2001, and was found to be
cognitively normal for his age.
Why was a PET scan obtained at this time?
This patient is seeking a diagnosis for his chief complaint, a convincing history of cognitive
decline. His symptoms are unexplained by any factors identified in his history, physical or
laboratory work-up. Moreover, for patients possessing his apparent high level of pre-morbid
intellectual ability and education, it is common for loss of cognitive ability to be experienced,
while still being able to perform at levels considered to be within the normal ranges of standard
neuropsychological tests.
PET Interpretation
The scans from 2001 and 2004 each reveal mild parietal/temporal hypometabolism, more
pronounced on the left (right side of image). NeuroQ™ analysis identifies mild abnormalities
(purple to red shades) in parietal/temporal and posterior cingulate regions, with well-preserved
metabolism in other regions (blue shades)… a pattern very suggestive of early Alzheimer’s type
changes occurring in this patient’s brain.
25
The pattern of cerebral metabolism in 2004 has slightly changed since 2001. Visually, there
appears to be slight interim worsening of parietal/temporal hypometabolism. [Show combined
figure with arrows, on slide 3, here.] That impression is bolstered by the NeuroQ™ analysis,
which shows in its plane 22 image the left parietotemporal cortex advancing to a near-red shade
(12% and 4 standard deviations below normal) in 2004, from the purple shade (9% and 3 SD
below normal) seen in 2001.
Case Summary
To summarize, at a time when conventional clinical evaluation was not sufficiently sensitive
to document cognitive abnormality in this 71 year old physicist reporting memory problems, PET
was already documentably (mildly) abnormal, both by visual and quantitative analyses. From
2001 to 2004, neuropsychologic performance with respect to immediate and delayed memory for
word associations, contextual information, rote list learning, and complex visual stimuli declined
across testing sessions, indicating “significant cognitive deterioration” within those abilities,
according to the neuropsychologist. By 2004, Mr. E’s performance met criteria for “Mild
Cognitive Impairment,” performing between one and two standard deviations below the mean
established for his same age peers on at least 50% of the memory tasks. The combination of this
clinical progression, with the posterior-predominant pattern of hypometabolism affecting
especially parietal/temporal cortex is most consistent with the presence of incipient Alzheimer’s
disease. Armed with the FDG-PET information, his managing physician prescribed an antiAlzheimer’s combination regimen including both donepezil and memantine in advance of the
second neuropsychologic testing session. On his current regimen, he continues to achieve 30/30
on the Mini Mental State Examination (MMSE).
26
3. Demo, Case3 – Severely Abnormal
Patient History
Mr. F was 63 years old when he
underwent FDG-PET in August 1996 for
symptoms of decreased memory, language
and visual skills. The cognitive decline
had been noted for at least 2 years, as had
been sensory and motor deficits of his left
upper extremity. Mr. F’s past medical
history was positive for pyelonephritis,
prostatitis, and prostate surgery for benign
enlargement. The patient had a history of
heavy alcohol use in the past, but had
discontinued drinking, and did not use
tobacco or other drugs nor have a history
of such use. He was a lawyer, as was his
wife, and they had two small children. His
physical examination, other than his
neurologic exam was normal.
His
neurologist noted upon exam that the
patient got two of three items correct
regarding orientation and three of four
words remembered correctly at 3 minutes,
and that he had marked apraxia of the
upper extremities with left worse than
right, plus “mild Parkinsonism with a
mask face”; cranial nerves were intact and
reflexes were normal. Blood laboratory
tests obtained one month prior to PET
were normal, including CBC, electrolytes,
BUN, creatinine, glucose, calcium,
cholesterol, and liver enzymes; VDRL and TSH tests obtained the following year were also
normal. The neurologist following Mr. F, an internationally recognized expert on dementia and
Director of a university-based Alzheimer’s Disease Center, diagnosed him with corticobasal
degeneration and depression, for which he was treated with the antidepressant sertraline.
Structural Neuroimaging
1992 Brain MRI revealed “mild enlargement of the lateral ventricles… otherwise unremarkable.”
1994 Brain MRI with and without contrast revealed “progression of cerebral atrophy.”
1995 Brain MRI revealed “moderate generalized cerebral atrophy which is not significantly
changed when compared to the scan of 1994. The scan is otherwise within normal limits.”
1996 Brain MRI with and without contrast revealed “stable appearance of cerebral cortical
atrophy.”
1997 Head CT revealed “cerebral atrophy but is otherwise negative.”
Why should the patient get a PET scan at this point in his evaluation?
27
Mr. F has documented cognitive decline and motor symptoms noted on neurologic examination.
The symptoms are unexplained by his general history, physical examination, laboratory screen
and structural neuroimaging tests, which are largely unremarkable. Although he was evaluated
by a prominent dementia expert who did not suspect Alzheimer’s disease, there are no tests (short
of brain biopsy) documented to be as accurate as FDG-PET in the identification of Alzheimer’s
disease that the neurologist did, nor could do, to exclude the possibility of that now-treatable
condition.
Clinical Follow-up
Mr. F. continued to progressively deteriorate with respect to cognitive and motor symptoms, also
developing a seizure disorder before his death that proved resistant to medical therapy. An
autopsy was performed in 2000 at the Alzheimer’s Disease Center for which the patient’s
neurologist was Director, and the final diagnosis was “Alzheimer disease, [Braak and Braak
Stage VI, CERAD definite]” with abundant neurofibrillary tangles in the hippocampus,
entorhinal cortex and neocortex, as well as amyloid-beta(1-42)-staining plaques prominent
throughout all areas of hippocampus, entorhinal cortex and neocortex. (Synuclein staining to
check for the presence of Lewy bodies was not performed.)
Case Summary
To summarize, by the time of this PET scan, Mr. F. had undergone extensive evaluation of his
cognitive and motor symptoms, including history and physical examinations by his internist,
neurologic examination by a dementia expert, laboratory screening, as well as multiple brain
MRI studies, two of them including contrast, and subsequently a head CT. The clinical
examination led to diagnoses of corticobasal degeneration and depression, the laboratory screen
was negative, and the structural imaging studies demonstrated only atrophy.
None of the above studies pointed to the presence of Alzheimer’s disease, and the patient
correspondingly received no treatment specific to that diagnosis. The presence of Alzheimer’s
disease, however, was clearly evident on both PET and autopsy examinations. PET also revealed
profound hypometabolism of associative visual cortex (quantified by NeuroQ™ as falling as
much as 12 standard deviations below normal metabolic levels) suggesting Lewy body
involvement, which could also help to explain the prominence of the patient’s central motor
symptoms.
28
References For Case Study 2
Journal Articles
Knopman DS, DeKosky ST, Cummings JL, Chui H, Corey-Bloom J, Relkin N, Small GW, Miller
B, Stevens JC (2001) Practice parameter: diagnosis of dementia (an evidence-based review).
Report of the Quality Standards Subcommittee of the American Academy of Neurology.
Neurology. 56:1143-1153.
Hoffman JM, Welsh-Bohmer KA, Hanson M, Crain B, Hulette C, Earl N, Coleman RE (2000)
FDG PET imaging in patients with pathologically verified dementia. J Nucl Med. 41:19201928.
Silverman DHS, Small GW, Chang CY, Lu CS, Kung De Aburto MA, Chen W, Czernin J,
Rapoport SI, Pietrini P, Alexander GE, Schapiro MB, Jagust WJ, Hoffman JM, Welsh-Bohmer
KA, Alavi A, Clark CM, Salmon E, de Leon MJ, Mielke R, Cummings JL, Kowell AP,
Gambhir SS, Hoh CK, Phelps ME. (2001) Positron emission tomography in evaluation of
dementia: regional brain metabolism and long-term outcome. JAMA 286:2120-27.
Silverman DHS, Truong CT, Kim SK, Chang CY, Chen W, Kowell AP, Cummings JL, Czernin J,
Small GW, Phelps ME. (2003) Prognostic value of regional cerebral metabolism in patients
undergoing dementia evaluation: comparison to a quantifying parameter of subsequent
cognitive performance and to prognostic assessment without PET. Molec Gen and Metab:
80:350-355.
Chang CY and Silverman DHS (2004) Accuracy of early diagnosis and its impact upon the
management and course of Alzheimer’s disease. Expert Rev of Molec Diagnostics 4(1):63-69.
Silverman DHS (2004) Brain F-18-FDG PET in the diagnosis of neurodegenerative dementias:
comparison with perfusion SPECT and with clinical evaluations lacking nuclear imaging. J
Nucl Med. 45:594-607.
Silverman DHS and Alavi A (2005) PET imaging in the assessment of normal and impaired
cognitive function. Radiologic Clin North Am, Saunders, Philadelphia, 43:67-77.
References For Case Study 3
Chang CY and Silverman DHS (2004) Accuracy of early diagnosis and its impact upon the
management and course of Alzheimer’s disease. Expert Rev of Molec Diagnostics 4(1):6369.
Imamura, T., K. Ishii, M. Sasaki, et al., Regional cerebral glucose metabolism in dementia with
Lewy bodies and AD: a comparative study using positron emission tomography. Neurosci.
Lett. 1997;235:49-52.
Ishii K, Yamaji S, Kitgaki H, et al. Regional cerebral blood flow difference between dementia
with Lewy bodies and AD. Neurology 1999, 53: 413-416.
Knopman DS, DeKosky ST, Cummings JL, Chui H, Corey-Bloom J, Relkin N, Small GW,
Miller B, Stevens JC: Practice parameter: diagnosis of dementia (an evidence-based review).
Report of the Quality Standards Subcommittee of the American Academy of Neurology.
Neurology. 2001; 56:1143-1153.
29
Minoshima S, Giordani B, Berent S, Frey K, Foster NL, Kuhl DE. Metabolic reduction in the
posterior cingulate cortex in very early AD. Ann Neurol. 1997;42:85-94.
Silverman DHS (2004) Brain F-18-FDG PET in the diagnosis of neurodegenerative dementias:
comparison with perfusion SPECT and with clinical evaluations lacking nuclear imaging. J
Nucl Med. 45:594-607.
Silverman DHS and Devous MD (2004) PET and SPECT imaging in evaluating Alzheimer’s
disease and related dementia. In Nuclear Medicine in Clinical Diagnosis and Treatment, 3rd
edition, PJ Ell and SS Gambhir, eds., Churchill Livingstone, Elsevier.
Recent Textbooks
Silverman DHS and Melega WP (2004) Molecular imaging of biological processes with PET:
evaluating biologic bases of cerebral function. In PET: Molecular Imaging and Its Biological
Applications ME Phelps, ed., Springer-Verlag, New York, pp. 509-583.
Silverman DHS and Devous MD (2004) PET and SPECT imaging in evaluating Alzheimer’s
disease and related dementia. In Nuclear Medicine in Clinical Diagnosis and Treatment, 3rd
edition, PJ Ell and SS Gambhir, eds., Churchill Livingstone, Elsevier.
Silverman DHS, Strommer JL, Marseille DM, Gambhir SS (2004) PET Brain Atlas. In
Nuclear Medicine in Clinical Diagnosis and Treatment, 3rd edition, PJ Ell and SS Gambhir,
eds., Churchill Livingstone, Elsevier.
References Related to NeuroQ Development
Silverman DHS and Melega WP, Molecular imaging of biological processes with PET:
evaluating biologic bases of cerebral function, in PET: Molecular Imaging and Its Biological
Applications, pp. 509-583, Springer-Verlag, New York, 2004.
Minoshima, Satoshi, Frey, Kirk A., Koeppe, Robert A., Foster, Norman L., and Kuhl, David E.,
A diagnostic approach in Alzheimer’s disease using three-dimensional stereotactic surface
projections of fluorine-18-FDG PET. Journal of Nuclear Medicine, 36: 1238-1248, 1995.
Tai, Y.-C., Lin, K.-P., Hoh, C.K., Huang, S.-C., Hoffman, E.J., Utilization of 3-D Elastic
Transformation in Registration of Chest X-ray CT and Whole Body PET. IEEE Trans. Nucl.
Sci. NS-44 4: 1606-1612, 1997.
Silverman DHS, Phelps ME, Application of positron emission tomography to evaluation of
metabolism and blood flow in human brain: normal development, aging, dementia and
stroke. Molec. Genetics and Metab. 74:128-138, 2001.
Minoshima, S., K.A. Frey, J.H. Burdette, T. Vander Borght, R.A. Koeppe, D.E. Kuhl,
Interpretation of metabolic abnormalities in Alzheimer's disease using three-dimensional
stereotactic surface projections (3D-SSP) and normal database. Journal of Nuclear Medicine.
36:237P, 1995.
30
Ishii, K., Sakamoto, S., Sasaki, M., Kitagaki, H., Yamaji, S., Hashimoto, M., Imamura, T.,
Shimomura, T., Hirono, N., Mori, E., Cerebral glucose metabolism in patients with
frontotemporal dementia. J. Nucl. Medicine. 39:1875-1878, 1998.
Silverman D.H.S., Lu C.S., Wong G.R., Aung A.M.K., Czernin J., Phelps M.E., Small G.W.,
Dahlbom M. Comparison of methods for comparing brain images of individual cognitively
impaired patients to a normal group. Journal of Nuclear Medicine, 42(suppl):224P, 2001.
Silverman D.H.S., Marseille D.M., Peng N.X., Dahlbom M., Small G.W., Chen W., Czernin J.,
Phelps M.E. Comparing brain PET scans of individuals undergoing dementia evaluation to
co-registered normal databases: effect of varying how “Normal” is defined.. Journal of
Nuclear Medicine, 44(suppl):17P, 2003.
31
ADDITIONAL REFERENCES
1. Minoshima S, Giordani B, Berent S, Frey K Foster NL, Kuhl DE. Metabolic reduction in the posterior
cingulate cortex in very early Alzheimer’s disease. Ann Neurol 1997; 42:85-94.
2. Silverman DHS, Small GW, Chang CY, Lu CS, Kung de Aburto MA, Chen W, Czernin J, et al. Positron
emission tomography in evaluation of dementia: regional brain metabolism and long-term outcome. JAMA
2001; 286:2120-2127.
3. Silverman DHS, Gambhir SS, Huang HWC, Schwimmer J, Kim S, Small GW, Chodosh J, Czernin J, Phelps
ME Evaluating early dementia with and without assessment of regional cerebral metabolism by PET: a
comparison of predicted costs and benefits. J Nucl Med. 2002; 43:253-266.
4. Silverman DHS, Truong CT, Kim SK, Chang CY, Chen W, Kowell AP, Cummings JL, Czernin J, Small
GW, Phelps ME. Prognostic value of regional cerebral metabolism in patients undergoing dementia
evaluation: comparison to a quantifying parameter of subsequent cognitive performance and to prognostic
assessment without PET. Molec Gen and Metab: 2003; 80:350-355.
5. Silverman DHS. Brain F-18-FDG PET in the diagnosis of neurodegenerative dementias: comparison
with perfusion SPECT and with clinical evaluations lacking nuclear imaging. J Nucl Med.
2004;45:594-607.
6. Silverman DHS and Alavi A, PET imaging in the assessment of normal and impaired cognitive function.
Radiologic Clin North Am Saunders/Elsevier, Philadelphia, 2005;43:67-77.
7. Moulin-Romsee G, Maes A, Silverman D, Mortelmans L, Van Laere K. (2005) Cost-effectiveness of
18F-fluorodeoxyglucose positron emission tomography in the assessment of early dementia from a
Belgian and European perspective. Eur J Neurol. 12:254-263.
Daniel H. Silverman, MD, PhD
Nuclear Medicine Clinic, Div. Biological Imaging
Dept. Molecular and Medical Pharmacology
University of California, Los Angeles
Appendix I
BRAIN PET SCAN VISUAL INTERPRETATION
Examine for (and document where appropriate):
a) adequacy of the technical quality of scan acquisition, reconstruction, and display,
b) presence of any evident structural abnormality, including rating the degree of atrophy as
either none, slight, mild, moderate, or severe,
c) assessment of global level of cortical metabolism, relative to the levels visually evident in
basal ganglia, thalamus, and cerebellum,
d) presence of any focal cortical abnormalities (with locations specified as left or right
dorsolateral prefrontal, medial prefrontal, anterior cingulate, inferior frontal, sensorimotor,
superior parietal, inferior parietal, parietotemporal, superior temporal, mid-to-inferior anterior
lateral temporal, mid-to-inferior posterior lateral temporal, mesial temporal, primary visual
occipital, associative visual occipital, or posterior cingulate cortex),
e) presence of any focal non-cortical abnormalities, including in left or right caudate nucleus
head, lentiform nucleus, thalamus, cerebellar cortex, midbrain, pons, and
f)
any additional findings.
The cerebral metabolic findings noted from this systematic review of the PET should be
correlated whenever possible with the structural information documented on CT or MRI, with
respect to cerebrovascular disease, atrophic changes, and other structural imaging findings.
Metabolic evidence of neurodegenerative processes (e.g., Alzheimer’s disease, Pick’s disease,
and other frontotemporal dementia, dementia with Lewy bodies, dementia of Parkinson’s
disease, Huntington’s disease) is most strongly supported by identification of areas of regional
hypometabolism unmatched by structural findings (i.e., greater than could be expected for the
degree of any generalized structural atrophic changes noted, and not accounted for by
cerebrovascular changes).
BRAIN PET SCAN CATEGORIES FOR DEMENTIA EVALUATIONS
Scans obtained in the evaluation of cognitive impairment can be classified into one of 7 main
interpretive categories (Figure 1, adapted from Silverman et al., JAMA, 2001;
286:2120-2127) – normal (N1) or normal except for age-appropriate atrophic changes (N2);
abnormal only in a non-neurodegenerative pattern (N3); abnormal in a neurodegenerative
pattern involving posterior cortical hypometabolism consistent with presence of AD (P1);
abnormal in a neurodegenerative pattern that includes posterior cortical hypometabolism but is
nevertheless inconsistent with AD as the most likely or sole cause of cognitive impairment (P1+)
(e.g., due to involvement of brain regions known to be preserved in AD, and/or lack of
involvement of inferior parietal and posterior cingulate cortex); abnormal in a neurodegenerative
pattern that is most consistent with frontotemporal dementia (P2), or a predominantly subcortical
neurodegenerative process (P3).
34
PET-Dementia
Eval. Cases
n=284
(138H, 146L)
No progressive
process evident on
PET (N)
26%
n=74
(21H, 53L)
N1
Normal
metabolism
N2
Global
hypometabolism
Progressive process
evident on PET (P)
74%
n=210
(117H, 93L)
N3
Focal
hypometabolism
(not meeting ‘P’
criteria)
P1
Parietal /
temporal
P2
Frontal-predom.
hypometabolism
P3
Hypometabol.
of caudate
and lentiform
nuclei (both)
± frontal
No progressive
dementia found
80%
n=59
(14H, 45L)
Progressive
dementia
20%
n=15
(7H*, 8L)
No progressive
dementia found
9%
n=19
(4H, 15L)
Progressive dementia
91%
n=191
(113H**, 78L)
Figure 1. PET patterns and presence of progressive disease in patients undergoing evaluation for dementia.
PET scans typical of each of six categories of cerebral metabolic patterns (designated N1, N2, N3, P1, P2, P3) are demonstrated.
Images displaying N1, P1, and P3 patterns were acquired with a Siemens ECAT EXACT HR+ scanner; those displaying N2, N3, and P2
patterns were acquired with a Siemens ECAT 931 scanner. Image set in black background was acquired using a GE Signa 1.5 T MRI
scanner, TR=2100, TE=80. H, diagnosis established by histopathologic examination. L, outcome established by longitudinal monitoring.
*
**
3 AD, 1 AD + progressive supranuclear palsy, and 3 Creutzfeldt-Jakob cases.
86 AD, 4 AD + Lewy bodies, 1 AD + Parkinson’s disease, 1 AD + cerebrovascular disease, 1 AD + Lewy bodies + cerebrovascular disease; 7
frontotemporal, 6 Lewy body, 3 subcortical gliosis, 2 Creutzfeldt-Jakob, 1 progressive supranuclear palsy, and 1 Kuf’s lipofuscinois case.
Daniel H. Silverman, MD, PhD
Nuclear Medicine Clinic, Div. Biological Imaging
Dept. Molecular and Medical Pharmacology
University of California, Los Angeles
APPENDIX II
CLINICAL BRAIN PET:
DIFFERENTIAL DIAGNOSIS OF DEMENTIA SYNDROMES
Regional Hypometabolism Identified by FDG-PET
Etiology of Dementia
Alzheimer’s Disease
Parietal, temporal and posterior cingulate cortices affected early;
relative sparing of primary sensorimotor and primary visual
cortex; sparing of striatum, thalamus, and cerebellum.
Vascular Dementia
Hypometabolic foci affecting cortical, subcortical, and cerebellar
areas.
Frontotemporal Dementia
Frontal cortex, anterior temporal and mesiotemporal areas affected
earlier and/or with greater initial severity than parietal and lateral
posterior temporal cortex; relative sparing of primary
sensorimotor, posterior cingulate, and visual cortex.
Huntington’s Disease
Caudate and lentiform nuclei affected early, with gradual
development of diffuse cortical hypometabolism.
Parkinson’s Dementia
Similar to Alzheimer’s Disease, but less sparing of visual cortex.
In early, untreated Parkinson’s disease, basal ganglia may appear
hypermetabolic.
36
Dementia with Lewy Bodies Similar to Alzheimer’s Disease, but less sparing of occipital
cortex.
37
Daniel H. Silverman, MD, PhD
Nuclear Medicine Clinic, Div. Biological Imaging
Dept. Molecular and Medical Pharmacology
University of California, Los Angeles
APPENDIX III
CHECKLIST TO DETERMINE WHETHER FDG-PET DEMENTIA EVALUATION
IS INDICATED AND COVERED BY MEDICARE*
1. Does the patient have diminished memory and other cognitive deficits which have been present for at least 6 months,
and which now impair her or his ability to function as (s)he normally would (professionally, socially, or with respect to
activities of daily living)?
__Yes (continue to #2)
__No PET scan is not covered.
2. Based on history, physical examination, and blood labs, is evidence present for any of the following correctable
conditions:
Depression? Substance Abuse? Malnourishment? Medication Effects? Cardiopulmonary compromise? Anemia?
Hypoxemia? Infection? Thyroid dysfunction? Renal or hepatic disorder? Glucose or electrolyte/calcium dysregulation?
__Yes (continue to #3)
__No (continue to #4)
3. After treatment of the above condition(s), do the deficits still persist?
__Yes (continue to #4)
__No PET scan is not indicated.
4. Does the patient suffer from Alzheimer’s disease, in the judgment of a physician experienced in the diagnosis and
assessment of dementia who evaluated this patient, aided by:
a) cognitive scales or neuropsychological tests, b) corroborating history from a well-acquainted informant,
c) laboratory tests (including serum B12 and TSH levels) and structural imaging (MRI or CT)?
__Yes – the physician judges the presence of Alzheimer’s disease to be certain
PET scan is not covered.
__No – the physician judges the absence of Alzheimer’s disease to be certain
PET scan is not covered.
__Uncertain -- the physician judges that it is uncertain whether the patient suffers from Alzheimer’s disease (continue to
#5)
5. Does the patient exhibit symptoms (e.g., early onset or prominence of social disinhibition, awkwardness, difficulties
with language, loss of executive function) such that frontotemporal dementia is suspected as an alternative cause of the
patient’s cognitive deficits?
__Yes (continue to #6)
__No PET scan is not covered.
6. Is it reasonable to expect that information obtained through FDG-PET will help with diagnosis and management of the
patient?
__Yes (continue to #7)
__No PET scan is not covered.
7. Has the patient previously undergone SPECT or FDG-PET for the same indication?
__Yes – the results were conclusive and the patient’s condition has not substantially changed
PET scan is not covered.
__Yes – but the results were not conclusive and at least a year has elapsed
(continue to #8)
__Yes – but there have been important changes in scope or severity of the patient’s cognitive deficits since then
(continue to #8)
__No (continue to #8)
8. An FDG-PET scan is considered “reasonable and necessary” by CMS. The patient should be referred to a facility
accredited to operate Nuclear Medicine equipment and the scan should be read by an expert with experience interpreting
PET scans for the evaluation of dementia.
To request a color-coded electronic copy of this Checklist, e-mail Dr. Dan Silverman at [email protected].
38
Daniel H. Silverman, MD, PhD
Nuclear Medicine Clinic, Div. Biological Imaging
Dept. Molecular and Medical Pharmacology
University of California, Los Angeles
APPENDIX IV
USING CLINICAL BRAIN PET FOR EVALUATION OF DEMENTIA
Indication: Changes in memory, language function, personality, or behavior -- noted by the patient, friends and
family, and/or physician – for which the etiology is not evident, or the symptoms have not been reversed, within
a reasonable period of time after initial presentation.
Acquisition Protocol:
18
FDG (10 mCi for 2D acquisitions, 3.5-10 mCi for 3D acquisitions) administered i.v.,
40 min uptake period with eyes open in dimly lit quiet room; followed by transmission and emission scans,
reconstructed with attenuation correction.
Interpretation: A pattern of focal cortical inhomogeneities on PET, all accounted for by areas of infarction on
MRI, implies dementia secondary to cerebrovascular disease, which also often affects subcortical structures. A
pattern of focal cortical inhomogeneities on PET unmatched by MRI findings is consistent with a
neurodegenerative disorder (e.g., Alzheimer’s disease, Pick’s disease, other frontotemporal dementia, dementia
with Lewy bodies, dementia of Parkinson’s disease, Huntington’s disease, Creutzfeldt-Jacob disease, or
progressive subcortical gliosis – see Table on page 1, for differential diagnostic considerations.)
39