1
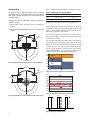
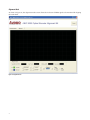
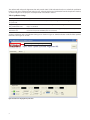
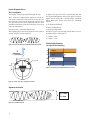
Alignment process for Single-Turn 17-Bit Absolute Encoders (AEAT-9000 Series) Application Note 5534 Introduction Theory of Operation Overview 1. The AEAT-9000 encoder consists of 13 differential absolute track signals. Twelve tracks are generated from the code wheel and track number 13 is generated from the analog sine of the incremental track. This application note describes the HEDS-8949/HEDS-8969 alignment software capability, code wheel setup, and alignment of an AEAT-9000-1GSH0 and AEAT-9000-1GSH1 absolute encoder. This alignment kit features real-time IC monitoring of the IC output during user alignment. The alignment kit consists of the IC interface hardware and its PC software application. The IC interface hardware is a microcontroller system that links the AEAT-9000 encoder to the PC through a USB cable. For further information on hardware setup and PC software setup, please refer to the user manual, AV02-3143EN UG HEDS-8949/HEDS-8969. This application note complements the user manual. Components 1. AEAT-9000-1GSH0 C-module, full version. 2. AEAT-9000-1GSH1 C-module Cut down version. 3. HEDG-9000-H13 code wheel with hub. 4. HEDS 8949 Alignment kit. 5. HEDS-8969 Alignment Kit 2. Eight photo sensors are used for analog Sine+, Sine-, Cosine+, and Cosine- signal generation with 90° phase shift. The analog signals are calibrated to correct the offset and gain via an SPI interface. The offset and gain values will be preloaded into internal memory. After signal conditioning, the encoder performs on chip interpolation to generate an additional 4-bit absolute output (D-1 to D-4) and synchronizes them with the 13 differential absolute track signals to construct a 17-bit absolute encoder. The analog signals are true differential signals with a frequency response of 500 kHz that enables absolute output position data to be read at high speed. 3. An additional sensor is used for radial alignment. Sensor Locate will output at LocTest pin and is enabled using the SPI interface during alignment mode. 4. The inner and outer tracks are used for tilt angle measurement by generating pulses at the TiltOut pin. TiltOut pulse width is used to determine the tilt angle. 5. The Zero_RST input pin is used to set the encoder zero position to any position. The encoder stores a preset value in internal memory and indicates the new position information with reference to the preset value every time data is read. The Zero reset function is enabled when the Zero_RST pin is pulled to ground. Alignment Mode Table 1. Unlock the register and turn on alignment mode. As shown in Figure 1, align the code disc to the read head by positioning the mid-point location of the code wheel hub about 17.5 mm away from the center point of the mounting hole. Table 1. Commands to enter alignment mode Through the SPI bus, command a switch to alignment mode as shown in 1. Write address 0x11 with 1010 1011 to unlock the register. 2. Write address 0x10 with 0001 0001 to turn on alignment mode. 37.10 ±0.05 (2X) Ø 3.10 + 17.50 ±0.05 29 1 30 2 0.05 0 Address Command + Address Data 0x11 01+001 0001 1010 1011 0x10 01+001 0000 0001 0001 1. Write address 0x11 with 1010 1011 to unlock the register. 2. Write address 0x10 with 0001 0001 to turn on alignment mode. The D1 signal will be output to the LocTest pin. When at a nominal location, the signal pattern will match that of Figure 3. The amplitude of the signal will depend on the total stack-up TIR of the code wheel. D1 is used to align the code disk to the encoder chip on the radial axes. Figure 3 shows the D1 output with a 10 m code wheel eccentricity. For sensor tilt alignment, the TiltOut signal is monitored. As shown in Figure 4, an output pulse is generated at the TiltOut pin. At a nominal position, the t/T percent ratio will be 0.78% for any motor spinning speed. After alignment is done, an SPI command is sent to set the same address (0x10) with 0000 0001, or a power cycle is performed to set the register to the default value of 0000 0001. Figure 1a. Alignment between read head and the code wheel (Full Option) 0.25 2048 cpr 0.25 16 cpr 0.25 16 cpr 0.25 8 cpr D1 37.10 ±0.05 0° (2X) Ø 3.10 + 0.05 0 15 1 16 2 360° Figure 2. Code wheel track 7 alignment to the D1 photodetector 2.80 17.50 ±0.05 180° V Nominal 2.70 2.60 2.50 2.40 2.30 2.20 2.10 2.00 1.90 0 45 90 135 180 225 270 315 360 Figure 3. D1 output with a code wheel eccentricity of 10 m Figure 1b. Alignment between read head and the code wheel (Basic Option) 0° 180° t T Figure 4. TiltOut signal in alignment mode 2 360° TiltOut Installation of the Code Wheel Assembling the code wheel to the shaft is required before alignment. Table 2 shows the handling and technical specifications for the codewheel. Table 2. Code wheel specifications Parameter Data Storage temperature -40° C to 115° C Operating temperature -40° C to 115° C Velocity 1000 RPM (recommended Shaft axial play ±0.050 mm Shaft eccentricity (includes module radial play) ±0.050 mm TIR Code wheel installation instructions 1. Place the code wheel on the motor shaft. See Figure 5. 2. Set the code wheel height using the set height tool: Figure 6. Set the two height tool guide pins into the two mounting holes a. Place the set height tool on the module mounting surface with the two guide pins being inserted into the two mounting holes. See Figure 6. b. Push the code wheel toward the set height tool until it touches the tool. The code wheel is now at the proper height. See Figure 7. c. Tighten both code wheel set screws. See Figure 8. 3. Remove the set height tool. See Figure 9. 4. Install the module. The distance between the IC module and the code wheel should be 250 m. See Figure 9. Figure 7. Push the code wheel until it touches the set height tool Figure 5. Mount the code wheel with hub to the shaft 3 Figure 8. Tighten both codewheel set screws Figure 9. Remove the set-height jig and install the module The recommended set height tool is specified in Figure 10. 42 A 20 15 ∅ 17 ∅ 45.8 ∅ 23 17.50 ± 0.05 17.50 ± 0.05 0 12.95 -0.05 2X∅ 1.8 PIN ∅ 55.8 Section A - A A Note : 1. All dimensions are in millimeter. 2. Tolerance: X.X ± 0.20 mm. Figure 10. Set height tool dimensions 4 18.55 ± 0.05 37.10 ± 0.05 Software Application Device Monitoring To open the application software, click the Start icon, and then click in sequence: “All Program”, “Avago AEAT-9000 Alignment Kit”, and finally “AEAT-9000 Alignment Kit”. When the software opens, the main screen, shown in Figure 11, will appear. The main screen has two tabs: Device Monitoring and Alignment. The Device Monitoring tab displays encoder data in real-time. The Alignment tab shows the interface for aligning the code wheel. From the main screen, click the ”Connect” button, and the alignment kit will be found and connect to the software. Once connected, real-time SSI angular data will be streamed to the software and displayed as raw 17-bit SSI data. The data will also be converted and shown as a mechanical degree position. This is illustrated in Figure 12. Selection of Device Monitoring and Alignment Mode Figure 11. Main screen 5 Press this button to link the software to the Alignment Kit. Selection of signal pairs for signal plotting Virtual Oscilloscope Figure 12. Device Monitoring tab with real-time encoder data display The Zero Reset button allows the zero offset of the encoder’s position data to be set. When the Zero Reset button is clicked, the alignment kit sends a short HIGH pulse of 10 ms to the Zero_RST input pin of the encoder. to the software through the USB bus. With the samples acquired, the software will calculate the frequency of the signal and derive the encoder’s code wheel rotation speed in RPM (Rotation per Minute). Check the “MSB Invert” box if inverted counting is required. When the “MSB Invert” box is checked, the alignment kit will output a HIGH level on “MSBINV” pin and vice versa. The time-base, signal amplitude scale (volt per division) and offset can be set by the controls at the bottom of the screen shown in Figure 12. The software contains a virtual oscilloscope to plot real-time encoder signals. Either of two signal-pairs can be selected: AB Incremental signal pairs or Sine/Cosine signal pairs. Signals are sampled at a 4000 Hz rate and transferred Four trigger modes are support: None, Single, Normal and Stopped. The trigger source is fixed to the A signal for AB Incremental signal pairs and to the Sine signal for Sine/ Cosine signal pairs. 6 Alignment Mode As shown in Figure 13, the alignment mode screen allows the LocTest and TiltOut signal to be monitored for aligning the code wheel. Figure 13. Alignment mode 7 The Alignment mode measures and analyzes the LocTest and TiltOut signals and provides the necessary alignment data to the user. The description of each alignment parameter is listed in Table 3. Table 3. Alignment data definitions Vp-p MAX (LOCTEST) The maximum peak-to-peak voltage for the LOCTEST signal. The amplitude of the signal will depend on the total stack-up TIR of the code wheel. 2.80 V Nominal 2.70 2.60 2.50 2.40 2.30 Vp-p 2.20 2.10 2.00 1.90 0 Duty % AVG 45 90 135 180 225 270 315 360 Duty % is calculated for the TiltOut signal based on the formula: Duty % = t x 100% T The average value of Duty % is then calculated based on number of valid TILTOUT pulse captures. V() SLO 0° 180° t 360° TiltOut T ON Pulse Width (t) The ON pulse width of the TiltOut signal is defines as t. Pulse Ratio The ratio of periods between pulses generated at the TiltOut pin is calculated by the formula: Pulse Ratio = V() SLO T1 T2 0° 180° T1 Results: PASS / FAIL: 8 360° T2 TiltOut The Results box provides a PASS / FAIL indicator based on the specification limits provided by the user. See Table 4. The software will analyze the alignment data and provide a PASS / FAIL indication based on user defined specification limits. To enter the specification limit setting screen, select the Tools menu Specification from the drop down selection, as shown in Figure 14. The purpose of each parameter is described in Table 4. Table 4. Specification Settings Specification Description Vp-p High Limit Vp-p Low Limit The maximum / minimum allowable peak-to-peak voltage for the LocTest signal. Duty % AVG Upper Limit Duty % AVG Lower Limit The maximum / minimum allowable PWM Duty % for the TiltOut signal. Table 3 defines how PWM Duty % is calculated. Pulse Ratio High Pulse Ratio Low The maximum / minimum allowable pulse ratio for TiltOut signal. The purpose of these parameters is to ensure the periods of TiltOut pulses are consistent. Set the specifications in the Specification Setting screen shown in Figure 15. A PASS indication results if all the specification limits set in Figure 15 are met. Select Tools > Specification to go into specification dialog Figure 14. Menu for selecting alignment specifications 9 Figure 15. Specification setting dialog The alignment “PASS” waveforms are shown in Figure 16. Figure 16. Correct waveforms of both LocTest and TiltOut 10 Encoder Alignment Process Three-Step Alignment The encoder can be aligned by following three steps. Axis Y needs to be adjusted first. Adjust axis Y until it is close to the center of the code wheel. The Y-axis is the one that shows the LocTest. On the alignment screen as soon as it gets closer to the center of the code-disk, the ideal waveform should have a “fish-like” waveform, as shown in Figure 16 and Figure 17. In general, the Vpp of LocTest is proportional with TIR. The recommended Vpp for the LocTest signal is less than 600mV and at 10TIR. TIR is correlated with "wobbling effect". Among the factors that cause the "wobbling effect" is:1) Code wheel installation; 2) Motor shaft spinning; Next, the X-axis is adjusted to align the Tilt. 3) Bearing misalignment. After adjusting the X-axis for Tilt, align the Y-axis again to see the "Fish-like" LocTest waveform. Therefore, to get at very low Vpp and low TIR, it is recommended to keep a spatial play of:1) ± 50μm – X-axis 2) ± 50μm – Y-axis Figure 17. Proper Y-axis alignment is signified by a “fish-like” waveform Y X 37.10 ±0.05 Ø 3.10 + 00.05 17.50 ±0.05 29 30 Full chip Radial Alignment ( at 16cpr, CW 10 eccentricity) 0.25 2048 cpr 0.25 16 cpr 0.25 16 cpr 0.25 8 cpr (2X) 0° 1 2 D1 180° Figure 20. Code wheel track 7 alignment the D1 photo detector. Figure 18. Location of “X” and “Y” to align the code wheel Alignment observation Vpp < 600mV TIR = 10μm Figure 19. A "Fish-like" waveform 11 360° Figure 21. Diagram showing the numerous type of waveform with different spatial play (5-50μm) From above diagram, the spatial play is shown from 5μm to 50μm. At nominal, the spatial play is at 0. Through observation, with more spatial play, the TIR will increase gradually as well. Good waveform Lower Vp-p is good for alignment as this shows lower TIR; Reaching ideal waveform critical for alignment. X-axis: LocTest must be in “Fish-shape” waveform. Spiking of waveform is being caused by high eccentricity on the shaft. Usually this is caused by coupling and bearing misalignment. Y-axis: Tilt Out should be in equal distance from one another. Figure 22. Example of a considerably good waveform from lab setup. 12 Alignment through SPI_SI, SPI_SO and SPI_CLK It is important to activate the SPI_SI, SPI_SO and SPI_CLK to do the alignment. Below is an example of the 3-waveforms. Figure 23. Example of SPI_SI Figure 24. Example of SPI_SO 13 Figure 25. Example of SPI_CLK For product information and a complete list of distributors, please go to our web site: www.avagotech.com Avago, Avago Technologies, and the A logo are trademarks of Avago Technologies in the United States and other countries. Data subject to change. Copyright © 2005-2012 Avago Technologies. All rights reserved. AV02-3236EN - February 2, 2012