1
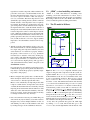
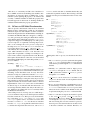
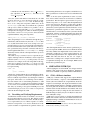
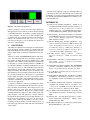
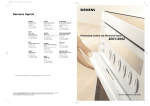
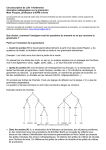
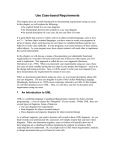
Multi-formalism Modelling and Model Transformation
for the Design of Reactive Systems
Thomas Huining Feng1
Electrical Engineering and Computer Sciences
U.C. Berkeley
California, USA
[email protected]
Keywords: Model transformation, computer automated
multi-paradigm modelling (CAMPaM), modelling and
simulation based design.
Abstract
This paper presents a development process based on modelling, simulation, and code synthesis. The DCharts formalism, a Statecharts variant with extensions, is used to model a
small application to demonstrate our approach: a traffic light.
The development of this system highlights the use of various formalisms with appropriate supporting tools: AToM3 , A
Tool for Multi-formalism and Meta-Modelling, is used as a
multi-formalism visual modelling environment; SVM is the
simulation engine used to experiment with prototype models;
SCC is the code synthesizer that generates reusable source
code in a variety of target languages. Transformation onto
the Communicating Sequential Processes (CSP) formalism
allows for model checking using the Failures Divergences
Refinement Checker (FDR2) model checker. We demonstrate
how using multiple formalisms as well as model transformations during the design process can drastically improve productivity, reliability and reusability.
1.
MODELLING, ANALYSIS AND SIMULATION BASED DESIGN
Compared to traditional software programming, modelling
and simulation based (software) design has many advantages.
By modelling the structure and behaviour of the system at an
appropriate level of abstraction in the most appropriate formalism(s), accidental complexity will be minimized, and the
designer can focus on essential issues instead of being bogged
down with implementation details at early stages in the development process.
1.1.
The process
Our modelling and simulation based design process is illustrated in Figure 1. The system designer starts from a set of
requirements, which constrain the design space. In the example given here, the requirements are not modelled explicitly
1 The work described in this paper was conducted while a graduate student
at McGill University.
Miriam Zia and Hans Vangheluwe
School of Computer Science
McGill University
Montréal, CANADA
{miriam.zia, hv}@cs.mcgill.ca
in an appropriate modelling language, but are rather used to
manually construct a design model of the system to be built.
It is noted that the process can be extended to include rigorous modelling of requirements and automatically verifying
consistency of these requirement, subsequently transforming
them into a first version of a design model. This approach is
described elsewhere [8, 10, 9, 11]. An appropriate formalism
for design models needs to be chosen. In our example, we
start with a DCharts simulation model. The use of a DCharts
simulator allows us to perform “what if?” simulation experiments. For given initial conditions and parameters, a simulation run will produce a simulation trace. Such traces can be
used to get insight into the system’s dynamics, or to verify
that the model conforms to the initial requirements. Performance metrics may also be obtained from simulation results.
This allows one to evaluate the efficiency of the system design (a typical non-functional requirement). As a result of this
evaluation, system parameters may need to be modified.
Simulation only allows one to explore a single behaviour
trace. To check properties of the design over all possible behaviours, formal verification or model checking are required.
We transform our simulation model into a model in the CSP
formalism for which a model refinement checker (FDR2)
exists. The correctness of the model can thus be formally
proved, or alternately, certain constraints on the system (derived from the requirements) can be verified. The model designer (or model tester) may generate a simulation model
from the original model.
The high-level design, once it has been established (through
model checking and simulation) that it satisfies the requirements, can be automatically transformed into an implementation (execution model) by means of a model compiler. This
implementation reacts to user input by modifying its state and
producing output. Provided that the high-level design is correct and the transformation tools are also correct, the resulting
low-level implementation is guaranteed to be correct. This approach relieves the designer of tedious and error-prone work,
and it greatly improves productivity, traceability and reliability.
Note that in our approach, meta-modelling is used to explicitly model the modelling formalisms used. From a metamodel, a formalism-specific modelling environment is auto-
Figure 1. Modelling, verification and simulation based design process.
matically synthesized.
1.2.
A Traffic Light (TL) system
A Traffic Light (TL) system is used to demonstrate the modelling, analysis and simulation based design process. The initial requirements are as follows:
1. The traffic light has three colours: RED, GREEN and
YELLOW. Initially, the light is RED. After being RED for
8 seconds2 , it turns GREEN. It remains in this colour for
5 seconds and then turns YELLOW. After another 2 seconds, it turns RED again. The traffic light autonomously
changes colours in this way, from then on.
2. During the first 6 seconds of being RED, a pedestrian may
press a “Crosswalk” button to request the traffic light to
turn GREEN early. If so, the light turns GREEN 2 seconds
after the button is pressed.
3. A policeman may pause and resume the traffic light.
When paused, the traffic light becomes YELLOW and repeatedly switches between ON and OFF every 0.5 seconds. When the light resumes its autonomous operation,
it starts RED.
Tools are used to assist in and partially automate the development of this system. AToM3 (A Tool for Multi-formalism
and Meta-Modelling) [1] is the environment in which the
starting point DCharts model of the system is visually designed. The SVM (Statechart Virtual Machine) is the engine
used to execute the simulation model. Note that in this case,
the starting point model and the simulation model are identical. On the one hand, this is a choice of the designer who
is familiar with the DCharts/Statecharts formalism. On the
2 The time modelled in this example is scaled for convenience during multiple real-time simulations and executions.
other hand, it is also convenient as both verification models and code can be generated from the simulation model
(the converse is not true as seen in Figure 1). Each simulation run of the same model produces a trace recording its
run-time behaviour. These traces can be checked and analyzed. Model checking and model verification of the conformance between the model design and the initial requirements
are done by mapping the DCharts model onto an equivalent
CSP [7] model, which is subsequently checked using the tool
FDR2 [4]. Model verification by means of multiple simulations and ERE (Extended Regular Expressions) is discussed
in [3]. The SCC (StateChart Compiler) is then used to synthesize executable code from the model. This process highlights
the use of automated tools and greatly reduces human labour.
The remainder of this article focuses on model design, simulation, analysis and code synthesis.
2.
MODEL DESIGN IN THE DCHARTS
FORMALISM
The TL system is modelled with DCharts, a Statecharts variant with extensions. A model satisfying the requirements is
explicitly designed by the model engineer, and this is the only
creative work the engineer needs to do.
2.1.
Introduction to DCharts
DCharts [2] is a formalism based on, and incorporates the
syntax of, David Harel’s Statecharts [5, 6]. Statecharts constructs, such as hierarchical states, transitions between those
states, orthogonal components and history, are all present in
DCharts. Its semantics conform to that of STATEMATE as
defined by Harel. However, the following extensions added
in DCharts improve the modularity and reusability of the formalism.
• Importation. A model designed in DCharts can also be
regarded as a reusable component, which can then be imported into a basic state of another DCharts model. All
the states and transitions in the submodel (or, imported
model) are copied to the inside of that state (importation state) at run-time. This means importation is done
dynamically upon entering the state (which is when the
internal structure of the importation state is required).
For example, the transition to an importation state triggers an importation, and the simulator/executor imports
the required submodel to obtain the default substates of
the importation state. This dynamic behaviour allows for
recursive importation, where a model imports itself directly or indirectly, and hence creates a theoretically infinite state hierarchy. In Statecharts, all states must be explicitly represented. Note that our analysis transformation (to CSP) in Section 3.2. does not support dynamic
importation. All other DCharts extensions will be supported.
2.2.
AToM3 , a visual modelling environment
AToM3
is a visual environment for modelling, metamodelling, and model transformation. It allows users to
graphically design meta-models (the models of formalisms).
By loading a meta-model in it, the AToM3 environment becomes a formalism-specific modelling environment.
2.3.
The TL model in DCharts
• Transition priorities. The transition priority solves conflicts between transitions, caused by multiple transitions
in a single orthogonal component enabled by the same
event. Each state of a model has a property related to
the priority of the transitions in its scope (transitions
from that state or substates of that state). If that property is equal to ITF (Inner-Transition-First), transitions
in its scope are inner-first (i.e., transitions from a state
at a lower level have higher priority). The opposite is
OTF (Outer-Transition-First) which corresponds to the
STATEMATE semantics.
For a state that does not explicitly specify this property,
it inherits this property from its parent state. However, it
may always override this property by explicitly assigning a value to this property.
• Macros. Designers may specify macros for their models.
In the description of the models, they may use the names
of those macros to literally represent their values.
Macros can be redefined by the importing model when
it imports a submodel into its importation state. On the
one hand, this mechanism increases reusability, since the
importing model can then fine-tune the behaviour of the
submodel; on the other hand, the modularity of the submodel is protected, because the importing model may
not change its behaviour in any other way.
• Ports and connections between ports. DEVS-like ports
and connections [12] are added as yet another extension.
Designers may connect multiple DCharts models via
well-defined ports. Those models influence each other
by sending messages via the established connections.
Figure 2. The TrafficLight component of the TL system
Figure 2 shows the main component of the TL system, designed in AToM3 : the TrafficLight component. It is a hierarchical DCharts model. It is also a Statecharts model, since
it does not use DCharts extensions. There are two top-level
states: ON and DEAD. The TrafficLight is functional when
it is in the ON state. The simulation/execution ends when the
QUIT event is received and the model goes to the DEAD (final)
state. The RED, GREEN and YELLOW substates of the model represent the three possible colours. The RED state has two substates: RED WAIT and GREEN SOON. When the model is in RED,
it stays in RED WAIT for at most 6 seconds. A pedestrian may
send the CROSSWALK event during that period to immediately
change the model to the GREEN SOON state. If no CROSSWALK
event is received, the model changes to the GREEN SOON automatically after 6 seconds (with an AFTER event, which schedules a transition after the given time interval).
At any time, the policeman may pause the traffic light
by sending a POLICE event. The model then goes to the
FLASHING state, and the light flashes with an interval of 0.5
• The TrafficLight component demonstrates the use of
several DCharts/Statecharts features, such as state hierarchy and the AFTER notation for scheduling events in
the future.
second. The model goes back to its default state with a second
POLICE event.
The complete behaviour of the traffic light is modelled in
this component. When it is simulated or executed, it autonomously changes colours. It also reacts to events such as
CROSSWALK and POLICE. These events are not generated by
the component itself. They are input by the user from the simulation environment (such as SVM) or execution environment
(in case code was synthesized by SCC). In those cases, the
user acts as the pedestrian and the policeman.
• The TrafficLight component is at the same time
autonomous and reactive. When it is treated as a
stand-alone model, it accepts input from the simulation/execution environment. When it is used as a component in a larger model (by means of DCharts importation), it communicates with other parts through event
broadcast.
• The Pedestrian component and the Policeman component explicitly model an experiment environment for
the TL system. Although the traffic light itself is actually the part of the system that we want to build, including these two extra components helps to test the system
in the presence of environmental actors, which influence
the system through their interactions with it. If the behaviour of these components is made very similar to the
actual behaviour of a pedestrian or a policeman, we will
be able to observe, through verification or simulation,
whether the traffic light behaves properly.
Figure 3. The police and pedestrian components
3.
The designer may also explicitly model the environment.
In this case, this comprises the pedestrian and the policeman behaviour. Those components are orthogonal to the
TrafficLight component, and thus have concurrent behaviour. The pedestrian component periodically generates the
CROSSWALK event, and the policeman component periodically
generates the POLICE event. These components explicitly
model a TL system experiment. Such experiments can be used
to model scenarios (use cases) specified in the requirements.
Figure 3 shows one possible design of the Pedestrian orthogonal component and the Policeman orthogonal component.
Tools (such as The Mathworks’ Stateflow) exist to check
Statecharts models. As process-oriented formalisms are more
suitable (than Statecharts) to describe large numbers of environment actors and scenarios (such as a policeman, or a
pedestrian) in a compact fashion (thanks to the ability to describe non-determinism), we prefer not to perform checking
directly on the Statecharts model. Instead, we translate the
DCharts model (which in our example, is also a Statecharts
model) into a CSP one suitable for verification.
The kind of property investigated and verified here is a
“safety” property, which specifies that on all executions of
the system, “something bad will not happen”. System requirements are investigated as safety properties in CSP, and
checked using the tool FDR2.
• The Pedestrian is initially in its default state
IDLE. It signals a CROSSWALK event after 5 seconds,
and waits until the traffic light turns GREEN. The
guard [TrafficLight in ON.NORMAL.GREEN] tests
this condition.
• The Policeman is initially in default state u1. It signals
a POLICE event after 15 seconds. This makes the traffic
light flash. After another 5 seconds, a second POLICE
event resumes the functioning of the traffic light at its
default state RED.
With this simple but practical example, we focus on the following important points:
3.1.
MODEL-CHECKING WITH FDR2
Introduction to CSP
The Communicating Sequential Processes (CSP) language
is designed for describing systems of communicating components. In this language, a process is described in terms of the
possible interactions it can have with its environment. In turn,
interactions are described in terms of instantaneous atomic
synchronizations, or events. Each process is an independent
computational unit and proceeds concurrently with all other
processes. Furthermore, a process is not necessarily a purely
sequential computation, as it may itself be composed of parallel subprocesses.
This theory of concurrency in CSP is the foundation for
the tool FDR2, used in model-checking state machines. Two
descriptions are necessary inputs to FDR2: first, a statetransition system capturing the property to be checked, and
secondly, a candidate machine in which this property must
hold. The approach is then based on checking whether the
candidate machine refines the property specification.
3.2.
DCharts to CSP Model Transformation
Here we provide a brief sketch of how the above described
DCharts model is translated into a CSP one. An automatic
translation engine, encoded in Python, is under construction
and will be integrated into the AToM3 DCharts modelling environment. Each DChart OR state is mapped to a CSP process, thus preserving the nesting and hierarchical structure
of the DChart. In the traffic light system, the TrafficLight
component is mapped to a TrafficLight process. This process
is itself composed of sequentially executing subprocesses,
and so on. For example, the NORMAL process is composed of
the subprocesses RED, GREEN and YELLOW. RED is in turn composed of the subprocesses RED WAIT and GREEN SOON.
The difficulty lies in translating the behaviour of an AFTER
event, which schedules an event to occur after time t has
elapsed. This is equivalent to a CSP process waiting for a duration of time t, until it can perform the next event. However,
this requires the introduction of time into a model described
in the untimed CSP language. To tackle this problem, a CLOCK
process is defined:
CLOCK(t) = if t == 100
then quit -> DEAD
else clock!t -> increment -> CLOCK(t+1)
CLOCK can be seen as a component added in parallel to the
implementation processes, and with whom it interacts by synchronizing on time increment events. At every time increment, the clock process synchronizes with the TrafficLight
process by outputting the current time value which the process is blocked waiting for. Using this value, the process can
then calculate its elapsed wait time. Once it has reached its
required wait time, its execution resumes. This is a discrete
implementation of the AFTER event as the clock increments
in discrete steps of one time unit. The time unit needs to be
chosen larger than the smallest time delay in the whole system. Otherwise, the CSP model does not accurately mimic
the DChart model behaviour.
Since CSP processes do not keep state, two additional processes are defined for all processes which represent a DChart
blob that contains an AFTER. These processes aid in calculating of wait times: a wait timer and a time keeper. The
time keeper updates itself to record the last receive time
from the CLOCK. The wait timer uses the last recorded time
from the time keeper, along with the current time received,
to calculate the elapsed wait time. Processes, such as RED or
FLASHING, use this wait time to determine whether they can
resume their sequential execution. The following is the CSP
description for the process translated from the RED blob of the
DChart:
RED =
(clock?t ->
rwTimer!t ->
rwTimer?waitTime ->
if waitTime == 6
then r2gstKeeper!t ->
GREEN_SOON
else RED)
[]
(crosswalk -> GREEN_SOON)
rW_TIMER(wt) = rwTimer?t ->
rwTtK!t ->
rwTtK?last_T ->
rwTimer!(wt+(t-lastT)) ->
if (wt+(t-lastT)) == 6
then rWAIT_TIMER(0)
else rWAIT_TIMER(wt+(t-lastT))
rT_KEEPER(lt) = y2rtKeeper?t ->
rT_KEEPER(t)
[]
rwTtK?t ->
rwTtK!lt ->
rT_KEEPER(t)
With regards to this RED process, one should note the following:
• The CLOCK and RED processes synchronize through the
event clock. RED is blocked waiting to receive the time
value which is passed through the clock communication
channel.
• Similarly, RED synchronizes with its helper process
rW TIMER(wt) through the rwTimer channel. The latter also synchronizes with the rT KEEPER(lt) process
through the rwTtK channel.
• rW TIMER(wt) can be viewed as a local timer for the
RED process. It resets itself once the required wait time
has been reached.
• In RED, one of two things may occur. Either the process is
blocked waiting to receive the current time, or it receives
a crosswalk event from the PEDESTRIAN process. This
reflects the choice available in the DCharts model, and
is represented using the prefix choice construct in CSP.
• Once RED’s wait time is elapsed, the execution is passed
to the GREEN SOON process. GREEN SOON also has a
helper time keeper process, which is synchronized with
RED through the r2gstKeeper communication channel.
The reason being that once the execution is passed to
the next process, the latter must have an accurate record
of the time at which it was activated. Therefore, RED
communicates the current time to the gsT KEEPER(lt)
(the equivalent of rT KEEPER(lt), but linked to the
GREEN SOON process.
Next, the system environment is introduced into the CSP
model in the form of actor interactions with the system.
The Pedestrian and Policeman were modelled in Figure 3 as two orthogonal components (AND states) in the
TrafficLight system. They are translated into equivalent
CSP processes, which are defined to be parallel to the remaining processes through CSP’s parallel construct. For
example, the following process defines an interfaced parallel
between the ON and PEDESTRIAN processes, derived from the
equivalent DCharts orthogonal components:
TRAFFIC_LIGHT = ON [||crosswalk||] PEDESTRIAN
Here, the parallel processes communicate through the specified interface, which contains only the event crosswalk. That
is to say that when such an event occurs, both processes synchronize. These processes now represent the experimental behaviour and environment of the system. The actors of the system, a pedestrian and a policeman, can interact with the system through the CSP events crosswalk and police, through
which they interact with the other implementation processes
of the system.
The CSP interrupt construct is used to represent the preemptive interrupt behaviour in DCharts, when a high level
transition (such as POLICE or QUIT) takes priority over other
transitions. For example, in the following CSP model fragment, upon occurrence of an event police, the process will
have control immediately removed from it, and process will
be begin executing:
NORMAL = RED
/\
(police -> FLASHING)
Finally, the obtained CSP model gets simplified, by flattening the nesting whenever possible. This simplification can
increase verification performance by reducing the calculated
state-space, albeit at the cost of sacrificing some modularity.
Note that related work on transforming Statecharts to CSP
often does either not cover the whole Statecharts formalism
or, most often, does not handle time. Our transformation handles delays by creating a extra global CLOCK process and
several time-keeper processes. As a result, we can precisely
transform the TL example into CSP.
3.3.
Describing and Verifying Requirements
In CSP, three semantic models are available to reason about
the observable behaviour of processes. The simplest of these
mathematical models is the traces model. In CSP, each process is represented by its set of finite sequences of communications it can perform, or set of traces. In the traces model,
system constraints or requirements are specified on traces, by
characterizing which traces are acceptable, and which are not.
These specifications are then used for traces refinement with
FDR2.
Here, we model system requirements in terms of restrictions on traces. These restrictions are referred to as CSP trace
specifications. This description is given in terms of a process,
which corresponds to a set of traces that the implementation
process may engage in. Therefore, we take these specifications to give precisely the traffic light behaviour which is required. The system requirements described in Section 1.2. are
translated into permissible sequences of event occurrences,
which describe a correct behaviour of the system. For the first
requirement, relating to a traffic light turning green after it has
turned red, and so on, the following three specification processes are described:
RED2GREEN
= r2gstKeeper -> gs2gtKeeper
-> RED2GREEN
GREEN2YELLOW = gs2gtKeeper -> g2ytKeeper
-> GREEN2YELLOW
YELLOW2RED
= g2ytKeeper -> y2rtKeeper
-> YELLOW2RED
The CSP implementation model and the specification processes are input into FDR2, and its traces-refinement checker
will verify whether the implementation trace-refines the requirements specified above. If the required behaviour was
not effectively implemented in the original DCharts model,
FDR2 will reflect this flaw. In fact, the tool outputs a
counter-trace, resulting from a sample execution that led to
a requirement-violating state. In our example, FDR2 asserts
that the trace specifications pass.
4.
SIMULATION WITH SVM
After designing the model in AToM3 , the designer can then
simulate it and obtain results from simulations. Simulations
can be done in AToM3 or separately with the SVM simulator.
4.1.
SVM, a DCharts simulator
SVM [2] is a simulator that supports the complete DCharts
syntax and semantics, a superset of the STATEMATE Statecharts syntax and semantics. It accepts DCharts model descriptions as textual input, and outputs the simulation results.
It has multiple default interfaces, including a graphical interface and a plain-text interface, from which the users interact
with the models and the simulation environment3 . The users
may debug the model by looking into the data structures of
SVM. In debug mode, they may also modify those data structures with Python scripts.
SVM can be used as a plug-in to visualize the simulation in
AToM3 . The current active states and enabled transitions are
highlighted during a simulation. SVM animation can also be
invoked from the command-line.
3 Models may also define specific interfaces, which are different from the
default interfaces internally provided by SVM.
4.2.
Simulation trace of the TL model
The TrafficLight component is defined in text file
TrafficLight.des, and the Pedestrian component and the Policeman component are defined in
TLExperiment.des. The former model description is
also imported into the latter one to create a third orthogonal
component. .des files are generated from AToM3 . When we
start a simulation with TrafficLight.des, we can only see
the traffic light. From the SVM interface we may input events
to interrupt its autonomous behaviour. Such events include
CROSSWALK and POLICE. When we start a simulation with
TLExperiment.des, the two components in the experiment
environment are created and they interact with each other by
sending events.
To obtain textual simulation traces, a series of DUMP statements are added to the model. Those statements have no effect on the model behaviour, but print out useful information
for verification and analysis purpose. For example, the following is a sample output trace obtained from a single simulation:
(05)
(05)
(07)
(07)
(12)
(12)
(14)
(15)
(15)
(20)
(20)
(28)
(28)
(33)
(33)
(35)
(35)
(40)
(40)
(48)
(48)
(53)
(53)
Pedestrian: CROSSWALK sent
TrafficLight: CROSSWALK received
TrafficLight: turn green
Pedestrian: crossing the intersection
TrafficLight: turn yellow
Pedestrian: CROSSWALK sent
TrafficLight: turn red
Policeman: POLICE sent
TrafficLight: start flashing
Policeman: POLICE sent
TrafficLight: stop flashing
TrafficLight: turn green
Pedestrian: crossing the intersection
TrafficLight: turn yellow
Pedestrian: CROSSWALK sent
Policeman: POLICE sent
TrafficLight: start flashing
Policeman: POLICE sent
TrafficLight: stop flashing
TrafficLight: turn green
Pedestrian: crossing the intersection
TrafficLight: turn yellow
Pedestrian: CROSSWALK sent
This output trace consists of a sequence of messages, each
with format “(time) sender: body”. time represents the
time when the message is generated; sender is the name of
the component that sends the message; and body is the message body.
This output trace gives us information on the model behaviour. One can see from the trace that about 5 seconds after
start-up (when the traffic light is red), the pedestrian sends a
CROSSWALK event. As expected, the light turns green after 2
seconds, and the pedestrian immediately crosses the intersection. 5 seconds later, the light turns yellow, and the pedestrian
sends CROSSWALK again. This event is ignored since no transition from the YELLOW state of the TrafficLight responds
to this event. Then the light turns red as expected. The policeman pauses the light at time 15. The light starts flashing until
another POLICE event is received at time 20, and so on.
The model tester should note that the pedestrian is still waiting for the green light in order to cross. This is because the
CROSSWALK event was sent right after the light turned yellow,
and was thus ignored. Improvements to the model are possible in two ways: either the pedestrian is allowed to cross the
intersection while the light is yellow, or the TrafficLight
responds to the CROSSWALK event while it is in the YELLOW
state (safer alternative).
5.
CODE SYNTHESIS WITH SCC
After the model has passed model-checking and simulation,
the designer becomes confident enough to accept the model.
The designer may then synthesize code in a target language,
and release the executable code.
5.1.
SCC, a code synthesizer for DCharts
SCC is able to synthesize executable code from DCharts
model descriptions (via an intermediate target-language neutral textual language).
The user may choose from one of the supported target languages: Python, C++, Java and C#. The code has exactly the
same behaviour as the DCharts model in simulations. It also
has a simple textual interface. If an interpreted language (such
as Python) is chosen, the user can execute the code immediately. Otherwise, the user needs to compile the code with a
compiler for the target language. It is possible to incorporate
the code in a larger (and possibly hand-written) application.
The code reuse of the TrafficLight component is an example discussed below.
5.2.
Code synthesis and code reuse
The designer may synthesize code with SCC for the
whole TL system, which includes the three components:
TrafficLight, Pedestrian and Policeman. This code has
the same behaviour as the model simulation, and it produces
traces similar to the simulation trace shown above.
However, the user may want the code for the TrafficLight
component only. The Pedestrian and Policeman were
after all models of the system’s environment and were
built to check requirements. When only generating code
for the TrafficLight component, it can be used to
react to real-world stimuli. It is easy to synthesize
code for the TrafficLight component only, because in
the design of the system, the model is separated into
two parts: TrafficLight.des and TLExperiment.des.
TrafficLight.des contains the TrafficLight component, and it is imported into the latter file. The designer
now synthesizes code from TrafficLight.des instead of
TLExperiment.des. When code for the TrafficLight com-
Currently, we are applying our process, techniques and tools
to the design of small robots. This will allow us to analyze the
scaleability of our approach to large industrial problems. We
also plan integration with The Mathworks’ modelling tools to
reach industrial users.
REFERENCES
Figure 4. The traffic light application
ponent is obtained, it can be reused in a larger application.
The application accesses methods of the model class through
a well-defined interface. An example of such an application
is shown in Figure 4. In this case, a GUI is defined (without behaviour however) in Python. It imports the (behaviour)
Python code synthesized from the TrafficLight component, and uses that part of code to maintain the current state
and react to external stimuli.
6.
CONCLUSION
Modelling and simulation based design was studied in this
paper through the concrete example of a Traffic Light. The
steps in this highly automatic development process were presented: model design, verification, simulation and code synthesis.
DCharts, a variant of STATEMATE Statecharts with extensions, were introduced and used to model the example system. On the one hand, this model was translated into a CSP
equivalent, and combined with requirements specifications
for the purpose of model checking with the tool FDR2. On
the other hand, DCharts, its simulator SVM and its code generator SCC (for Java, C++, C#, and Python) form a full, free
implementation of Statechart semantics with a visual modelling environment. The simulation traces produced by multiple simulations reveal potential problems in the model, and
also provide information for the analysis of a performance
metric. When thoroughly tested, the system model (which
excludes the components of the experiment model) is transformed into executable code with SCC. The code can then be
reused in user applications.
Compared to traditional software programming, this development process reduces human labour and increases productivity, reliability and reusability. The example used is very
simple as the focus of this paper was on the process and
the various transformations. We provide a complete designchecking-simulation-codegen tool chain, which greatly simplifies designers’ task and guarantees a unique semantics
throughout the development process. Though simulation, verification and code generation tools exist, our approach integrates these seamlessly and thanks to the use of metamodelling and the modelling of model transformations, we
believe the approach will be usable with other formalisms, in
other domains.
[1] Juan de Lara and Hans Vangheluwe. AToM3 : A tool
for multi-formalism and meta-modelling. In European
Joint Conference on Theory And Practice of Software
(ETAPS), pages 174 – 188. Fundamental Approaches to
Software Engineering (FASE), Springer-Verlag, 2002.
[2] Thomas Feng. An extended semantics for a Statechart
Virtual Machine. In Summer Computer Simulation Conference. Student Workshop, pages S147 – S166, July
2003. Montréal, Canada.
[3] Thomas Huining Feng and Hans Vangheluwe. Case
study: Consistency problems in a UML model of a chat
room. In Sixth International Conference on the Unified Modelling Language (UML 2003), Workshop on
Consistency Problems in UML-based Software Development II, October 2003. San Francisco, USA.
[4] Formal Systems (Europe) Limited.
FailuresDivergence Refinement - FDR2 User Manual, June
2005.
[5] David Harel. Statecharts: a visual formalism for complex systems. Science of Computer Programming,
8(3):231–274, June 1987.
[6] David Harel and Amnon Naamad. The STATEMATE
semantics of statecharts. ACM Transactions on Software
Engineering and Methodology, 5(4):293–333, 1996.
[7] C. A. R. Hoare. Communicating Sequential Processes.
Prentice-Hall, 1985.
[8] Sadaf Mustafiz, Ximeng Sun, Jörg Kienzle, and Hans
Vangheluwe. Model-driven assessment of use cases
for dependable systems. In MoDELS, pages 558–573,
2006.
[9] Jon Whittle and Praveen K. Jayaraman. Generating hierarchical state machines from use case charts. Proceedings of the 14th IEEE International Requirements
Engineering Conference (RE’06), 0:16–25, 2006.
[10] Jon Whittle and Johann Schumann. Generating statechart designs from scenarios. In ICSE, pages 314–323,
2000.
[11] Ximeng Sun. A model-driven approach to scenariobased requirements engineering.
Master’s thesis,
McGill University, 2007.
[12] Bernard P. Zeigler. Theory of Modelling and Simulation.
Krieger Publishing Co., Inc., 1984.