1
VW 910/ 921
Advanced Programmable Flight Data
Computer
User’s Manual
English/German Translation by: Peter Mate
© of 1994 wh
11-94au/th
Dr. rer. nat.
Westerboer,
Hofhansel
& Cie GmbH
Aeronautics-instruments
Medicine-technology
Industry-technology
Telecommunication
Prößlstr. 18
92637 Weiden i.d.OPf.
Tel.: 0961-26916
Fax.: 0961-61866
Contents
2. Description of Controls............................................................5
2.1 VW910 Variometer (see Fig. 1) ...................................................5
2.2 VW921 Flight Data Computer.....................................................5
3.
Operation ...............................................................................7
3.1 Powering up the instrument .........................................................7
3.1.1 The VW910 Variometer.....................................................7
3.1.2 The VW921 Flight Data Computer ....................................7
3.2 The Variometer Data ...................................................................9
3.3. The Normal or Cross country mode ..........................................13
3.3.1 Display Mode in the Normal or Cross country mode ........13
)
The Menu-position „3/2“ meant, that on the computer-display the
menu-row 3 is selected for to the Menu-selector rotary switch
Position 2 (Matrix-column 2) .........................................................14
3.3.2 Correction of Stored Data ................................................15
3.3.3 Freely programmable display menu position 0/0 ..............17
3.3.4 Display quadrants in the Cross country mode...................19
3.4 The statistics-mode....................................................................26
3.4.1 Statistics-Matrix Display-Rows ........................................28
3.5 The final-glide mode .................................................................36
3.6 The Altimeter ............................................................................37
4 Measuring Distances ...............................................................40
4.1 Distance-sizes............................................................................40
4.2 General Operation .....................................................................42
4.2.1 Start of a route .................................................................42
4.2.2 Reactivating a route .........................................................43
4.2.3 Erasure of the Distance-storage........................................44
4.3 Management of the routes..........................................................45
4.3.1 The route-mode with GPS-linkage ...................................45
4.3.2 The distance-mode without GPS-linkage..........................51
5 Final-glide ................................................................................54
5.1 The Setup Process......................................................................55
5.2 Applications for the final-glide-mode ........................................57
5.3 Final-glide without active GPS-linkage......................................60
5.4 Final-glide with active GPS-linkage ..........................................66
2
5.5 Final-glide in the Task-mode .................................................... 66
4.4 Case examples Cruise flight mode............................................. 68
4.4.1 Triangle-flight in the GPS-task mode .............................. 68
4.4.2 Multiple legs and GPS-Goal Flight Mode........................ 68
4.4.3 Cruise with intermittent GPS-Dropout............................. 68
4.4.4 Programming of curses with multiple laps....................... 68
6. Statistics and data-storage ....................................................69
6.1 The VW921 Storage-Memory Organization .............................. 70
6.1.1 The record storage........................................................... 70
6.1.2 The statistics-storage....................................................... 72
6.1.3 The flight-log-book storage ............................................. 74
6.1.3.1 The flight-number.................................................. 74
6.1.3.2 The flight-date....................................................... 75
6.1.3.3 The takeoff-time .................................................... 75
6.1.3.5 The flight time ....................................................... 76
6.1.3.6 Managing the statistics-storage ............................. 76
6.2 The serial interface ................................................................... 78
6.2.1 Printing of the statistics-data ........................................... 79
6.2.2 Printing the Flight Log-book ........................................... 83
6.2.3 Data output format during the flight................................ 83
7.
Miscellaneous ......................................................................86
7.1 Installation................................................................................ 86
7.2 Compensation ........................................................................... 89
7.3 Compass Compensation ............................................................ 92
7.4 Selecting the Glider Model and its Polar .................................. 92
1. System Overview
The core of the Variometer is wholly and newly developed
absolute and differential pressure sensor.
It consists of two metal membranes adjacent to each other
which produce travel proportional to pressure. The travel is
measured using semiconductors which react to the magnetic
field.
The sensor produces a voltage signal proportional to this travel
in a bridge circuit. The signal is up to 100 times stronger than
3
11.01.97
that of the sensors currently available, resulting in reduced
interference, more stable zeroing and excellent reliability.
The membranes are adjacent to each other, and so compensate
for any travel resulting from accelerations and prevent
corruption of the signal. We have developed these sensors
ourselves so they are not available in any other vario system
(Patent No: P3023719.5-09).
The Variometer signal is derived from the absolute pressure
sensor which produces the altitude signal using electronic
differentiation.
A second sensor provides the pitot pressure signal, by
measuring the reduction of pressure in accordance with the
barometric pressure altitude formula. To ensure that error free
compensation is maintained, the altitude signal corrects the
pitot pressure signal value. This means that compensation is
achieved without a total-energy-compensation jet and is exact
at any altitude.
An electronic filter with a time constant of 1.2 seconds
smoothes out both the Variometer display and also the audio
Variometer output
(dual tone audio vario).
4
2.
Description of Controls
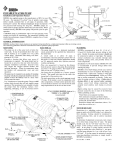
2.1
VW910 Variometer
(1)
On-Off /Volume knob
(2)
Compensation +/-
(3)
Zero setting (without audio signal)
2.2
VW921 Flight Data Computer
(4)
10 position, rotary Menu selector switch
(5)
MC (MacCready) Value selector rotary switch
from 0.0 to 5.0 in steps of 0.5
(6)
Wind Component selector rotary switch
from - 25 knots/h to +25 knots/h in 2.5 knots/ h-steps.
(7)
Polar Selector Switch
P1 Bug contaminated polar
P0 Measured polar
P2 Rain polar
(8)
Flight mode (Speed-to-fly) Menu selector switch
‘S’
:
Thermal(climb) / Statistics
(see Fig. 1)
mode
Mid position
‘EA’
(9)
:
:
Cruise mode
Final Glide mode
Input toggle switch ‘+/– ‘
Function 1: Moving the cursor between Display lines.
5
11.01.97
Function 2:
Increasing / reducing of correction
values.
(10)
Enter and Correction toggle switch
‘KORR’
: Entry of a correction action
‘ENT’
: Entry of the corrected value
(11)
Electric vario zeroing (screwdriver adjustment for dial
instrument and audio).
(12)
Selection of polar (see Appendix 9.1)
6
3.
Operation
3.1
Powering up the instrument
After Power-On (1) set-up the following one after the other:
3.1.1 The VW910 Variometer
If the Flight-mode Menu selector switch (8) is on S
"Statistic/Thermal" position, the indicator will deflect fully
counter-clockwise and subsequently home in on zero in about
20-30 seconds.
If the Flight-mode Menu selector switch (8) is in mid position
(Cruise mode), there will be a deflection of the pointer into the
minus-sector, depending on the MC-value and the Polar.
The audio-signal also behaves similarly.
3.1.2 The VW921 Flight Data Computer
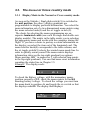
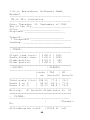
On the Display the following appears for about 10 seconds
VW921
DG 100
Version: 34 1.4US
On the first row of the display beside the Flight Data Computer
model (VW921) your glider model should be displayed (or a
type with a similar Polar). A correct Polar selection is a
requisite for the proper function of the Cross country mode
and the final-glide-mode calculation! If a change is required to
the Polar selection, e.g. a wingspan change with Winglets, you
can make the change only in the initial 10 seconds. You enter
the correction-mode by pressing the 'KORR'-switch (10)
7
11.01.97
within the 10 sec. time-window (to select the glider model, See
paragraph 7.4.).
The second display row displays your flight computer version.
The double digit number shows your version. The two digit
number is determined by the configuration as follows:
Basic flight computer with single row display
00
Option
Value
double row Display
Temperature-sensor
Compass-linkage
Statistics
GPS-linkage
ISO country code (for U.S.A. model)
+10
+01
+02
+04
+20
US
For example the configuration-figure of '34' agrees therefore,
with US version with the options double row display, statistics
and GPS-linkage, but without compass and without
temperature-sensor.
The letter '1.4' shows the software version of your flight
computer-software followed by the ISO country code (for
USA is US).
Following the initial display, the upper right display quadrant
will display the current values for the following in 3 second
intervals:
MC
WD
WL
(McCready-value)
(WinD-component)
(Wing Loading)
Now you may adjust (1) for acceptable loudness. Then the
MC-value (5) for null. The actual Wing Loading (including
water-ballast) (Menu-position of '0-10,' correction-procedure)
and the wind-component (6) likewise to null.
In the second row set all switches (7-10) in the center position.
8
For extensive and clearly arranged information the display is
divided into quadrants each with 8 digits.
Top-left
| top-right
bottom-left | bottom-right
While the top-left quadrant of the display always shows the
variometer reading as a function of the flight mode selector
switch position or respectively of the flaps position sensor.
The information in the 3 other display quadrants depends on
the display mode selected.
You have basically three different menu-options to select the
information to be displayed (8):
1.) the Normal- or cross-country mode
- switch (8) in center position
- menu-page "position selection of the VW921"
- see section 3.3. "The normal or cross country mode"
2.) the statistics-mode
- switch(8) up position ('S')
- menu-page "position selection of the VW921statistics"
- see section 3.4. "The statistics-mood"
3.) the final-glide-mood
- switch(8) down position ('EA')
- fixed final glide side
- see section 3.5. "The final-glide-mood"
3.2
The Variometer Data
The functions “Thermal” and “Cruise” are chosen either by the
pilot with the SG-switch or by the installed magnet-switch on
the flap push-rod. (see Chapter 6.1. Installation)
In the first case, “Thermal” and “Cruise”, shows the
Variometer (round-indicator) momentary climb- or sink-rate.
The display range is of ±15.0 feet/sec., the acoustic range is of
±30.0 feet/sec. At sink-rates higher than -30.0 feet/sec. the tone
9
11.01.97
abandons completely. This is not a Variometer error, but a
warning in an extreme flight-situation (for example during a
wave-flight).
On the top left field of the flight computer display the
averaged climb during the last 20 seconds is displayed:
M: + 2.4 xxxxxxxx
xxxxxxxx xxxxxxxx
Current standards in competition flying make a digital display
with this type of information necessary. An improvement of
only 0.2 knots in average rate of climb during a 300 km flight
means a gain of about 7 minutes. An analog display cannot
provide the same degree of accuracy.
In the second case, "cruise/speed-to-fly", the speed-to-fly is
represented visually by the variometer and acoustically by the
audio variometer.
If the variometer reading and the audio tone are:
· in the minus range: fly faster,
· in the plus range: fly slower
You are flying at the optimum speed when zero is displayed
and the audio tone is intermittent. We have intentionally not
left a window of silence around the optimum speed-to-fly. The
pilot would not know whether he should fly faster or slower if
there was a “window” of silence. This would apply no matter
how narrow the window of silence.
Needless to say, speed-to-fly is related to the MacCready value
set and also to Wing Loading. You can check the MC-value on
the control knob position or you can easily turn the sensor
knob (5) slightly and for three seconds the MC-value is
displayed in the top-right quadrant.
10
xxxxxxxx
xxxxxxxx
MC: 1.5
xxxxxxxx
It is important when you are making the selections with the
rotary switch that you are sure that it is latched otherwise the
computer does not know which of the two values to display
and will alternate between the two.
The Wing Loading selection performed at the +10 position of
the Menu-selector knob (4)
C: +0.0
WL: 32.5
-><- 0/ 10
•
·
press the toggle-switch (10) to ‘KORR’ position,
•
·
with the ‘+/-’ toggle-switch (9) change the value,
•
· press the toggle-switch (10) to ‘ENT ‘, to enter the
value.
So that you have an indication of the vertical speed of air
masses independent of the speed-to-fly, the computer offers a
digital readout of Net Climb and Net Sink. That is the rate of
climb and sink of the air mass through which you are flying at
the time, without taking into account the glider's rate of sink.
N: +3.0
xxxxxxxx
xxxxxxxx
xxxxxxxx
11
11.01.97
A net reading of + 3.0 knots means that your glider will
actually climb at approximately 2.0 knots should you decide to
circle in this particular air mass.
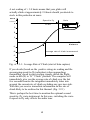
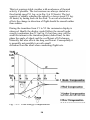
Vario
Knots/s
Speed to fly
4
Vario
C:2.5
3
2
1
distance
-1
-2
average rate of climb is measured
-3
-4
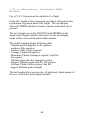
Fig. of 3.2-1: Average Rate of Climb (start of data capture)
If you decide (based on the positive rising air reading and the
encouraging speed-to-fly indication) when approaching
thermalling speed to start circling, simply switch the flightmode switch (8) to ‘S’ “Climb” position. The computer will
immediately give you the average rate of climb over the last
few seconds because the integrator immediately takes into
account the current rate of climb excluding any previous sink.
With this you receive immediate information on the rate of
climb likely to be archived in this thermal. (Fig. 3.2.1)
This is perhaps the best time to mention the optional second
speed-to- fly vario instrument. In this case, switching the vario
to speed-to-fly only affects the audio tone.
12
3.3. The Normal or Cross country mode
3.3.1 Display Mode in the Normal or Cross country mode
As soon as the Statistic-/ Final glide-switch (8) is switched in
the mid position, the other 3 display quadrants are
programmable to display preferred information. You select the
menu information out of a two-dimensional menu-matrix using
the menu selector knob(4) and the +/- toggle switch (9).
The charts for selecting the menu-programming are on
separate laminated cards (one each for single and double row
display models). The matrix in the table assists you in selecting
the appropriate menu and works with the computer during the
flight. If you have a desire to portray a certain information on
the display you select the item out of the laminated card. The
menu selector knob(4) corresponds to the table-column, and
the +/- toggle switch(9) selects the wanted menu-mode line. In
order to quickly orient yourself the menu-matrix displays
information status on the top-right quadrant (exceptions:
Menu-position, 0/0, 1) in menu-row 2 with selected turn-points
in the top-right quadrant). You can find more exact information
regarding the status line in Chapter 3.5.
Example: The display reads:
→ ← 3/2
V2: 0
C: +0.7
S2: 0
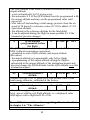
To check the Battery voltage, with the momentary menuposition currently at 3/2, check the menu-matrix to find 0/5
denoting battery voltage. To check the voltage you must turn
the menu knob to position -5- and toggle the +/- switch so that
the display reads 0/5. The display then displays:
C: +0.7
Bat:13.2V
13
→ ← 0/5
76.3°F
11.01.97
(The temperature-information appears only on systems with
optional temperature measurement!). You can find more exact
information about display programming possibilities in
subsequent chapters. Incidentally, menu-line 0 is always
displayed after power-up, so that you do not have to search for
this important information.
) The Menu-position „3/2“ meant, that on the computer-display the
1
menu-row 3 is selected for to the Menu-selector rotary switch Position 2
(Matrix-column 2)
Example:
→ ← 3/2
N:-0.7
S2: 0
V2:
0
Whit the leg of the flight S2 and the average speed on the section V2, this
selection equals to the matrix position in the Menu selection Table.
14
3.3.2 Correction of Stored Data
Initial values must be entered correctly (e.g. Wing Loading and
Airport-altitude). You will always be dealing with the same
routine: First select the Display Menu-positions with help of
the MENU-selector knob(4) and the +/- toggle switch,
followed by the ENT toggle switch. Correct the values with
the proper knob position and the +/- toggle switch (e.g. the
Wing Loading with ‘WingLoad’, the airport-altitude with
‘APT-Alti’ position etc.). By pressing the -KORR-toggle
switch(10) in the up position the correction-mode is selected.
Toggle the +/- switch(9) to correct the stored value to the
preferred current value. The correction-process is concluded by
pressing the toggle-switch(10) to ENT. The corrected data is
now stored in the memory, and will not lost by powering down
the computer (e.g. the stored airport-altitude remains in the
memory until you are at another airport and newly reprogram
the altitude).
Example: You take-off with the standard-menu-position 0/0. A
wing loading of 8 lbs/sqft was programmed prior to takeoff.
Under way the thermals get weaker and you therefore empty
the water-ballast thereby reduce wing loading to 7 lbs/sqft. The
flight computer is set to menu-position 0 and needs to be
rotated with the menu-selector-knob to position 0/10 (full-right
turn, easily selectable). The display depicts:
C:+0.5
WL: 8.0
->3 0/10
By pressing the toggle-switch (10) KORR- “WingLoad:?”
appears with a blinking question mark.
C:+0.5
-><- 0/10
WingLoad:? 8.0lb
Pressing the +/- toggle-switch(9) up/down respectively
increases/ decreases the value with 0.1 lb./sqft. increments. The
other method is to move to the desired value: press and hold
15
11.01.97
the toggle-switch(9) up/down until the value is reached. In the
example you therefore press and hold down the +/- toggleswitch(9), until the value Wing Load: ? 7.0lb appears on the
display. Then you release the switch to the center position and
by pressing the ENT toggle-switch(10) down, your desired
value is programmed.
C: +0.5
WL: 7.0
-><- 0/10
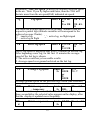
Corrections are possible only for: glider model, programmable
display mode(menu-position '0/0'), QFE-altitude, airportaltitude, distance and final-glide-distance (only without GPSreception), Time and date, Compass-Compensation(option).
Menuselect
(n)
DisplayMode
0/0
0/1
Programmable
Display quadrant
QFE-Altitude a
0/2
QFH- Altitude A
0/ 4
0/10
Power-On Display
Time
Wing Load
WL
Legs S1-S9
Correction of the
flight-number
Final-glide
1/0-1/9
S9/5
EA
1.Correction
platform
2.Correction
platform
3.Correction
platform
Line ur:
(upper-right)
QFG-Altitude
Line dl:
(down-left)
QFEatmospheric
pressure
QNHatmospheric
pressure
Date
-
Line dr:
(down-right)
-
-
-
-
-
Airport
Altitude
glider model
Time
Wing Load
WL
Legs S1-S9
Flight-number
active Leg Sn,
so that final
glide-distance
∆E and DΣ
16
-
-
Figure 3.3.2: Possible Correction Combinations
3.3.3 Freely programmable display menu position 0/0
The display layout corresponding to this menu position can be
freely programmed according to your needs. Most likely it will
be the page you will select most often in flight, and it can
therefore also be brought up for display very easily: The menu
page 0/0 appears automatically after the unit is turned on - and
is quickly selected by rotating the menu knob all the way to the
left. The only preprogrammed and fixed display is the average
rate of climb(C) (the net vario reading) on the top left
quadrant. If you would like to change the information displayed
on the other quadrants, you press the 'KORR' switch and the
lower display line will, for example, show:
C: +0.0
Line ur:
xxxxxxxx
QFE-alti
Using the '+/-' switch you can select from the table 3.3.3
(Layout possibilities for the programmable display page in
menu position 0/0) the information you would like to have on
display on quadrant 1 (Line ur - upper-right), and use 'ENT' to
confirm it. After that you are in the correction mode for
quadrant 2 (Line dl- down-left) and - after confirming it - you
will be able to program in the same way the display for
quadrant 3 (Line dr - down-right). In case you would like to
change the layout again at a later time you simply press the
'KORR' switch while in menu position '0/0'. After turning off
your VW921 the last programmed layout will remain stored in
the memory.
Display mode 0/0 selections for upper-right quadrant(Line ur)
Description
in the Display
Symbol
Flight computer-configuration
(options)
11.01.97
17
Empty
QFE-altitude
STD-altitude
Clock time
Flight-time
Battery Display
Target-Turn Point
Bearing
‡ Display
Main Climb
Thermal Climb
A
AS
c
t
Bat
Name
P
10
+14 +15
X
X
X
X
X
X
X
X
X
X
X
X
‡
X
X
X
c
c
X
X
X
11
34
35
37
X
X
X
X
X
X
X
X
X
X
X
X
X
X
X
X
X
X
X
X
X
X
X
X
X
X
X
X
X
X
X
X
X
X
X
X
X
X
X
X
X
X
X
X
Display mode 0/0 selections for bottom-left quadrant (Line dl):
Empty
‡ Display
‡
Flight-time
Battery Display
TAS
QNH-altitude
QFE-altitude
Bearing
Temperature
t
Bat
V
A
a
P
T
X
X
X
X
X
X
X
X
X
X
X
X
X
X
X
X
X
X
X
X
X
X
X
X
X
X
X
X
X
X
X
X
X
X
X
X
X
X
X
X
X
X
X
X
X
X
X
X
Display mode 0/0 selections for bottom-right quadrant (Line dr)
Empty
Distance
Battery Display
Clock-time
Track
∆ V-Display
MC-Speed
Gesamt-V *
Wind Empf
Cross Error
X
X
X
X
d
Bat
c
TRK
∆V
ΣV_
Wind+
ΣV_
18
X
X
X
X
X
X
X
X
X
X
X
X
X
X
X
X
X
X
X
X
X
X
X
X
X
X
X
X
X
X
X
X
Compass
Com
X
X
* Gesamt = Total
Table 3.3.3: Layout possibilities for the free programmable
display page in menu position 0/0. (x = possible)
3.3.4 Display quadrants in the Cross country mode
In the following you will get an extensive overview of the
Cross Country mode information. The information is organized
in alphabetical order of the abbreviation (1st. column). The
2nd. column displays the basic meaning, the 3rd. column
displays the unit types, and the 4th. column displays which
menu-quadrant of the cross country mode contains the
displayed or desired information.
Example: The upper-right (UR) quadrant displays 3/4 which
signifies, menu-column of 4 (menu Knob), menu-position 3 (+/toggle switch selectable),bottom-right display quadrant. In the
5th. column an example is presented.
Short
Name
Name
Unit
Where
?
Example
Remarks
→
Display position
-
*/* UR → 3 1/8
→ ← 0/6
The left arrow → always points to the currently activated leg, for
example at the start of the third leg →3 will be displayed. If no leg
is active, instead of a number a second arrow pointing into the
opposite direction is displayed → ← .
‡
Angle ‡
°
19
0/1 DR
0/0 UR
0/0 DL
→ 21°
→ $$$°
11.01.97
The angle is analyzed by GPS-reception. The angle-difference
between bearing and programmed-course is given with → or ¬
which signifies a command to correct the course to the right or
left. The example above signifies "Correct 21° to the right“. The
$$$ appear, if no GPS-reception is available.
∆V
Knots 0/ 9 DR ∆ V
/h
(only available with GPS-reception) The difference between the
air-speed and the ground-speed V; in linear-flight this value is a
measurement for the instant wind-component. This value is
evaluated with a relatively short integration-time (5 seconds). The
computer can only give valid information if during the integrationtime a straight-flight path is flown to the turn-point. This 'Windcomponent' is especially valuable if it is compared with the wholly
independent long-time-integration wind component received in the
position 0/9 DL.
Speed-difference
-
Position
0/ 3
N494840
at GPS-reception
2/10
E120705
This display quadrant displays the coordinates of the momentary
position. The information is displayed in degrees/ minutes/
seconds, but without punctuation between the values.
Bat
Battery -voltage
V
0/ 5 DL Bat:
0/ 0
12.4V
This display quadrant displays the charge condition of the battery.
It should be checked, with simultaneous activation of the radio
transmit button.
BRG
Bearing
°
Dn
Distance n
- without GPS-reception
programmable
nm
0/ 8 DL BRG315
°
Bearing is always understood as the bearing on the activated turnpoint. (always identical with, Sn, n being an active route-number.)
20
1/ n DL D6
23.8“
Distance is always understood as the yet to fly route. It is
displayed with these three symbols:
‘″‘: inactive leg, distance between Turn-point of n-1 and Turnpoint n
‘_:’ active leg as a track over the ground.
‘:’: active leg, distance of momentary position to the active
turn-point n
dn
active Distance n
DΣ
Total-distance
nm
1/ 0
d3:
DL
84.9
The distance of the active leg in menu-position of 1/ 0 with lower
case characters.
1/ 10 DL D:Σ
32.8
The Total-distance is the sum of all partial-distances. In this
category the total route-length is found. It includes your current
leg, what you previously flew, and what is programmed but not
yet flown. The same nautical miles value received into the final
glide as ∆E
nm
WL
Wing Loading
lb./sqf 0/ 10
WL:7.1
- programmable
t
DL
The programmed Wing Loading can also be used as a correctionalgorithm (Chapter 3.3.2) and the programmed value modified.
h
QFE-altitude
- programmable
21
ft
0/1 DL h: 723
0/0 OR
0/0 DL
11.01.97
The QFE-altitude is the relative altitude referenced to the baseairport-altitude.
- resets automatically to 0 ft at power-up.
- this automatic 0 ft of the QFE-altitude must be programmed with
the airport altitude and stays on the programmed value until
power-off
- after take-off and reaching a total-energy pressure from the air
speed of 54 knots/h a reference-value of 131ft is added. (131 ft
equivalent altitude).
- this altitude is the reference-altitude for the final glide!
- it can be adjusted during the flight in menu-position 0/1 if the
barometric pressure changes.
A
QNH-altitude
ft
0/ 2 DL A: 823
- programmable before
the flight
The QNH-altitude is the total-energy compensated altitude over
MSL (without temperature-correction).
- calculated as sum of QFE-altitude and airport-altitude
(Elevation)
- the airport-altitude is programmable only before flight
- a programming of the airport-altitude during the flight is
interpreted as the airport-altitude of the destination-airport and
does not change the QNH-altitude, but the QFE-altitude over this
destination-airport.
AS
Standard-pressure
ft
0/ 0 UR AS 789
altitude
Altitude over the 1013.15 mbar-level, real altitude-value of the
total-energy-altimeter, calibrated at the factory.
Af
Standard-pressure
ft
0/ 0?
Af
altitude
Also total-energy-compensated-altitude over the 1013.2-mbarlevel, agrees with the real flight-altitude, i.e. a displayed value
6000 agrees with a flight-level FL of 60.
You will find more information regarding altimeter functions
in chapter 3.6. "The Altimeter“.
22
MC
McCready-value
ft/m */* OR MC: 2.5
- temporary
*100
Temporary display of the McCready-knob position, which is
shown for approximately 2 seconds to each MC-alteration with the
MC Knob (5) in the top-right display-quadrant.
Pn
Bearing n
°
1/ n UR P6“ 216
- only with GPSreception
The bearing always gives the right course from turn-point to turnpoint, in dependency of the 3 signs:
‘″‘: inactive leg, the bearing between Turn-point of n-1 and Turnpoint n
‘_:’ active leg as a track over the ground.
‘:’: active leg, bearing of momentary position to the active
turn-point n
pn
active bearing n
°
1/ 0 UR p3: 83
The active bearing-value displayed again in menu-position 1/ 0
with lower case characters
T
Temperature
°C 0/5 UR 13.0 °C
- optional
Displays the temperature at the Temperature-sensor location.
Sn
Leg n
nm
3/n DL S6“ 0.0
or
2/n DL
The already covered distance of leg n. If the valid start and end
point were over-flown Sn will be set to the programmed value.
When the active route is displayed with GPS-reception only the
course-line route is recognized as completed. It is displayed as
one of these 3 signs:
‘″‘ inactive leg
‘_’ active leg, no flight-signal
‘:’ active leg in flight
sn
active leg n
nm
3/0 DL
or
2/0 DL
The already covered distance on the active leg.
23
s3:
23.8
11.01.97
SΣ
Sum of all-legs
nm
3/10
DL
or
2/10
DL
S:Σ 283
The sum of all the already covered legs.
Sto
Flight-speed-sensornm 0/
Sto
distance
283
Here the total nautical mile-performance is summed, from the
flight-speed-sensor and the circle/glide switch which received
signals and analyzed them since takeoff .
t
Flight time
h
TRK
Track
°
0/ 4 UR t 3: 41
0/ 0 DL
0/ 0 UR
0/ 8UR TRK
219°
TRK
$$$°
The Track is the current movement-direction over the ground.
Wind-shifting and the alike in opposition to compass direction are
not considered.
U
Time
-programmable
hh:mm 0/4 DL
U13:42
0/0 OR
0/0 DL
0/0 UR
The programmable real-time-clock includes the Time and Date. By
pressing KORR the programmable value will be displayed (Side 1:
Hour, minute) (Side 2: weekday, day, month, year) and by
selecting ENT the corresponding side is stored.
V
True Air Speed (TAS)
24
knots/ h
0/6 DL
0/0 DL
V:93
Momentary True Air Speed (TAS) is the altitude corrected speed
in the air . Note: If you fly higher and faster, than the TAS will
deviate more from the air-speed(IAS) indicated air-speed.
Vg
Leg-speed
knots/ h 3/ n DL
or
2/ n UR
V6“0.0
V2:83.
8
The achieved average-speed over the ground, attained from the
respective partial legs (altitude-variation will correspond to the
achieved average Climbs).
:‘″‘ : inactive leg
‘_’ : active leg, no flight-signal
‘:’ : active leg in flight
vn
active leg-speed
knots/ h 3/ 0 UR
v2“78.
or
9
2/ 0 UR
Active leg-speed is displayed only after 15 minutes in the new leg.
After beginning a new leg, for the first 15 minutes the averagespeed of the last leg is shown.
1. The active route has yet no usable results.
2. Average-speed over ground archived on the last leg.
VΣ
Average Leg-speed
knots 3/
V:Σ
/ h 10UR 73.7
or
2/
10UR
Average-ground-speed on the previous-legs flown (and recorded)
WD
Wind-component
knots +/
WD: +15
- temporary
/ h OR–
Preset the wind-component with the Wind knob (6). Following a
three second delay the selected value appears on the display, after
that the display is updated more frequently.
Win
d
Wind-component
25
knots 0/9 DL Wind +13
/h
11.01.97
with GPS: From the real flight route above the ground and the
flight route in the air, the wind-component is calculated
over the last 10-20. (independent of ∆V)
without GPS: The wind component is calculated from the exact
correction of the distances on the route-section.
In both cases the value is only received if the flight-route is in the
direction of the target-point.
3.4
The statistics-mode2
Thanks to the development of inexpensive memory chips it is
now possible to record all the data which the computer handles
during a long cross country flight, process it, and make it
accessible to the pilot either during or more usually after the
flight.
In this way the computer becomes a flight data recorder which
is far superior to the conventional time/height barograph trace
in terms of both resolution and the sheer wealth of numeric
information contained.
The statistics-mode is a display-mode, in which the display
alone changes, all other processes run in the background
unaffected and continuously. This special display mode is
activated by switching the Statistic/Final Glide switch (8) up
to S position. The majority of the recorded data is available for
display during the flight. The displayed menu-matrix (already
familiar from the normal or Cross country mode) has been
expanded with a 3rd. dimension. A descriptive illustration is
shown in the three-dimensional statistics-matrix in Appendix
A1.
Contrary to menu-matrix selection, here, the Menu-knob (4)
selects the display row and the column selection is performed
with the MC Knob (5). The +/- toggle switch (9) selects the
third dimension of the matrix (in which thermals and glide
section data is stored). To separate the statistic display values
from the normal mode in this manual, the statistics display
menu-position is displayed with the character "S" as a prefix.
I.e: the menu-position, S3/4 signifies that: Statistics-matrix
2
Only with Statistics Option
26
display mode of 3 (Menu-knob on position 3) and column 4
(MC Knob on position 4 respectively on a value of 2). In order
to find the statistics-data during the flight quickly, designation
for the VW921 display position statistics-matrix is provided on
a laminated card. Portrayed as a two-dimensional level of the
statistics-matrix, you will find a detailed description of each of
the display rows of this statistics-matrix in the following
chapter. (3.4.1.)
27
11.01.97
3.4.1 Statistics-Matrix Display-Rows
Row 0 = Thermal Registers: In this display mode you receive
all the stored information relating to thermals. Example: for
Thermal-No. 11:
Thermal S0/0: Total climb of the thermals
C:0.0
Thermal
C.Nr 11:
G X100
6.4 f/m
Thermal S0/1: gained altitude
C:0.0
Thermal
2050ft
∆ A.Nr11:
Thermal S0/2: Thermal entry altitude
C:0.0
A.In 11:
Thermal
2759ft
Thermal S0/3: Thermal exit altitude
C:0.0
A.Out 11:
Thermal
4810ft
Thermal S0/4: Circling-time
C:0.0
Thermal
03:15min
∆ t 11:
Thermal S0/5: Position (nautical miles) of the total flown
distance
C:0.0
S.Nr 11:
Thermal
183nm
The Thermal-register stores sampled data in circling mode
which lasted longer than 30 seconds. Data sampling is triggered
automatically by speeds lower than circling/glide switch-over
28
speed (Wing-load dependent, see table ???). C: displays the
same value as the Variometer round-instrument. Also if circling
in a sink, negative values are registered as thermals.
It is important to use a flight-style which clearly separates
straight distance flight and circling. This results in concise and
clear statistic data. The flight-computer has 99 thermalregisters to store data from thermals, enough for any long
flight. With this detailed data-recording you have a new, more
exact and also more comfortable 'note-pad' for flight-analysis.
Row 1 = "Climb" registers: Climb-register selection is
performed at position 1 of the Menu-selector knob (4) in
the statistics mode. This displays all global information,
that involves the climbs, e.g. Total-altitude-gains, totalclimb-time etc.
In the columns you will find:
Climbs - S1/ 0: Total-altitude-gain
C:0.0
Climbs
10540ft
∆ A.total
Climbs - S1/ 1: Averaged rate climb from all registers
C:0.0
C. total:
Climbs
4.2 ft/m
G x100
Climbs - S1/ 2: Altitude-gains in the climb-registers with
maximum Altitude-gain and associated Liftnumber
C:0.0
∆ A.max 8:
Climbs
2240ft
Climbs - S1/ 3: Average climb in the registers with
maximum altitude-gain
C:0.0
C.∆ Amax:
Climbs
3.6ft/m
G x100
Climbs - S1/ 4: Altitude-gains in the climb-register with
29
11.01.97
maximum climb and associated Liftnumber
C:0.0
∆ ACmax 3:
Climbs
1417ft
Climbs - S1/ 5: Average climb in the climb-registers with
maximum climb
C:0.0
C.Cmax:
Climbs
7.6ft/m
G x100
Climbs - S1/ 6: Thermalling-time during cruise flight (in
hours
and minutes) and relatively to the totalcruise
flight time
C:0.0
t.Cl
Climbs
1: 04/ 23%
Climbs - S1/ 7: Number of the recorded thermals
C:0.0
Thermals:
Climbs
15
Climbs - S1/ 9: Average climb while in cruise flight with
the respective number of the thermals
C:0.0
C.Σ (12):
Climbs
4.6ft/m
G x100
Climbs - S1/ 10: Average climb of the last 3 thermals
C:0.0
C.Σ (3):
Climbs
4.8ft/m
30
G x100
Row 2 = "Cruises"-registers: In menu-position 2 the Cruisestatistics is recorded for each single cruise-distance. With
the +/- toggle switch (9) the single cruise-distance of the
statistics-flight register is selectable.
- S2/ 0: Nautical-miles of the total-route length at the
start of the Cruise-distance
C:+0.0
∆ L.Anf 18:
Cruises
116nm
- S2/ 1: Nautical miles of the total-route-length at the end
of the Cruise-distance
C:+0.0
∆ L.End 18:
Cruises
134nm
- S2/ 2: Completed route in Cruise-section No.18
C:+0.0
∆ L.Nr 18:
Cruises
18.8nm
- S2/ 3: Start-altitude of Cruise-section No.18
C:+0.0
A.In
18:
Cruises
4100ft
- S2/ 4: Altitude after ending Cruise-section No.18
C:+0.0
A.Out 18:
Cruises
820ft
- S2/ 5: Altitude loss on Cruise-section No.18
(most a negative value)
C:+0.0
Cruises
∆ A.Nr 18: -3280nm
31
11.01.97
- S2/ 6: Cruise-Time for section No.18 in minutes and
seconds
C:+0.0
Cruises
15:00min
∆ t 18:
- S2/ 7: Total number of Cruise-sections
C:+0.0
Cruises
:
Cruises
21
Row 3 = "D.Total "-registers: In menu-position 3 of the
display mode the total-distance values are shown. The
statistics-register positions are:
- S3/ 0: The total of the leg-distances takeoff to landing.
C:+0.0
Leg Σ
D.total
108nm
- S3/ 1: The total-time t.L∑ used for flying the totalLeg∑ (hours/minutes). This is 100% of the total
flight.
C:+0.0
t.L ∑
D.total
1:25/ 100%
- S3/ 2: The achieved average-ground-speed GS.L∑
on the total-route, GS.L∑= Leg∑ / t.L∑
C:+0.0
GS.L∑ :
D.total
76.1kn
G
knots/hr.
- S3/ 3: The achieved average-air-speed TAS.L∑ on the
total-route.
C:+0.0
TAS.L∑ :
32
D.total
142kn
G
knots/hr.
- S3/ 4: The total-altitude-gain on the total-route
C:+0.0
D.total
12631ft
∆ A.total:
- S3/ 5: The average climb on the total-route
C:+0.0
C.total:
D.total
4.2ft/m
G
x100
- S3/ 6: Out of the average climb on the total-route,
theoretically attainable McCready-speed (MCspeed)
C:+0.0
MC-speed
D.total
46 kn
G
knots/hr.
- S3/ 7: The Glide-ratio is the relationship between routelength and gained altitude
C:+0.0
Glide-Ratio:
D.total
41
Row 4 = "D.Single "-registers: The statistical data identically
organized like Row 3, in these registers each single leg
information is stored individually. The +/- toggle switch
(9) picks the individual legs. Example:
- S4/0: Leg-1 distance from takeoff to turn-point 1.
C:+0.0
Leg1
:
D.singl
120nm
Row 5 = "Maximum "-registers: In statistics-menu-position 5
miscellaneous maximum information is displayed. Only 4
registers are used.
33
11.01.97
- S5/ 0: Altitude gain in the thermal with the maximum
altitude gain ∆Amax with thermal-number
information. Also see "S1/2".
C:+0.0
Maximum
3608ft
∆ Amax 2:
- S5/ 1: The climb in the thermal with maximum Altitudegain M. ∆Amax, also see "S1/ 3".
C:+0.0
Maximum
C.∆ Amax:
3.6ft/m
G
x100
- S5/ 2: Altitude-gain in the thermal with maximum climb
and the associated thermal-number. Also see "S1/
4".
C:+0.0
Maximum
1417ft
∆ ACma 3:
- S5/ 3: Average climb in the thermal with maximum
climb,
Also see "S1/ 5".
C:+0.0
C.Cmax:
Maximum
7.6ft/m
G
x100
Row 6 = "Times "-registers: Here the summarized times are
displayed.
- S6/ 0: The flight time t.tot with percent-information.
The percent-information references the totaldistance of the flight time.
C:+0.0
t.tot
Times
2:00/ 141%
- S6/ 1: The total-cruise flight time t.L∑. Also see -S3/1.
C:+0.0
t.L∑
Times
1:25/ 100%
34
- S6/ 2: Thermalling-time during the active cruise flight.
Also see S1/ 6
C:+0.0
t.Cl
Times
0: 25/ 29%
- S6/ 3: Glide time during cruise flight, in respect to the
total flight-time t.tot corresponding to
thermalling-time t.Cl∑
C:+0.0
t.Cr
Times
1:00/ 71%
- S6/ 4: Flight time of the legs t.L1. Part-route lengths n
are selectable with the +/- toggle switch.
C:+0.0
t.L1
Times
0: 50/ 59%
The statistics-menu-position 7 and 8 are not used on the
VW921 flight computer. In display mode 9 and 10 no statisticsdata is portrayed, but in display mode 9 the flight-logbook
administration is displayed (see the detailed description to the
flight-logbook in chapter 6.1.3, Flight Logbook Storage). In
display mode 10 exact information from the wind-sector is
displayed (only in versions with compass-linkage, otherwise
this display mode is empty).
35
11.01.97
3.5
The final-glide mode
The last of the three display modes is selected by pressing the
mode-select-switch(8) to the down (EA- final glide) position.
In this mode the display has only one mode and no option for
selection. The display-quadrants show the following
information: top-left the selectable Variometer display with the
average or net-climb. The display value on the top-right
quadrant displays information in the following manner:
1. Without active GPS-linkage- used as an altimeter display
(selectable on the ground as to which altimeter mode is
displayed),
2. With active GPS-linkage- used to display the speeddifference
∆V = Vg-TAS. This advises that the selected wind on the
wind knob (6) is essentially larger or smaller than the
calculated wind-component ∆V and your wind-attitude
strongly deviates from the short-time wind-recommendation.
3. with active GPS-linkage and with matching wind attitude,
the angle between the bearing and course over the ground
with direction-pointer is shown.
The three display value is for an exact direct final glide without
detours, this is especially advantageous. If you hold this angle
on zero, you are guided by the flight computer directly to the
turn-point-coordinates. (Note: in stronger wind during
circling, based on constantly shifting wind-component, the
display between the above display-modes alternates between 2
and 3.)
The display quadrant on the bottom-left shows a non
adjustable value for the glide-path deviation ∆A. In the bottomright quadrant of the display the remaining distance ∆E_ is
displayed. It is identical with the yet to fly total-distance DΣ.
More information about the final glide mode in chapter 6.
36
3.6
The Altimeter
You may receive the following altitude-information(in feet)
from the flight computer:
- the standard pressure altitude AS
- the QFE-altitude a, relative altitude over the start-up airport
- the QNH-altitude A, airport altitude above Mean See Level
- the Glide-path-deviation ∆H
There is only one altimeter in the VW921, the total energy
compensated altimeter, which provides reference for the
calculation of the other altitude-values. This altimeter measures
the energy compensated barometric pressure, compares it with
the standard barometric pressure of 1013.2 mbar and converts
it into the standard-pressure altitude AS. This information is
parallel to the altimeter-information at an adjustment on
standard-pressure of 1013,2 mbar. Through adjusting the
altimeter pointers to 0 ft you get the QFE-atmospheric pressure
of your position (momentary airport barometric pressure). The
VW921 automatically engages at 0 ft QFE-altitude when the
unit is turned on. The QNH altitude A in menu position '0/2' is
at the same time automatically set to airport elevation. If the
atmospheric pressure changes during the flight, you must
compensate for the pressure change and adjust the altimeter,
i.e. the flight computer expects the same correction. That
happens with the simple correction-algorithm on the menuposition of 0/1, where the QFE-altitude can be found. Press
the KORR- button only once, so you can change the QFEaltitude as altitude over your destination-airport immediately.
By receiving barometric pressure data from nearby referenceairport, you can adjust the computer to the exact atmospheric
pressure by pressing the KORR-switch the second time.
For the final glide the QFE-altitude alone, is relevant. Only
the altitude over the destination-airport is the referencealtitude for the glide-path-deviation.
37
11.01.97
For this reason it is very important to familiarize your self, with
all possibilities of the altimeter adjustment. Of notable
importance is the QFE-altitude, the adjustment is performed
automatically when powered up and no correction is required.
The other important altitude is the QNH-altitude A: This agrees
with the altimeter-information, if you adjust this to the airportaltitude before takeoff. The QFE altitude is the reference
altitude for final glide, it can be adjusted during flight in menu
position '0/1' if the barometric pressure changes. In order to
enter the changes it is temporarily necessary to leave the final
glide mode, but this should not cause problems since all current
data remains in the memory.
- The potential energy is equivalent to 121 feet altitude, which
is necessary for the total energy altimeter to guarantee a
minimum arrival speed of 54 knots/h. It is accounted for
automatically when the unit is turned on. '0 ft' translates,
therefore, into -121 feet on the total energy
altimeter.(calculated to standard-atmosphere and without
temperature-correction). The altimeter-information helps
especially in the mountains, to scan for obstacles, passes etc.
Therefore you should pay attention to it before takeoff. Make
sure the QNH-altitude (menu-position of 0/2 DL) is set on the
altitude of the takeoff-airport. An exact altitude adjustment
does pay off especially, if your destination-airport has a
different altitude then your takeoff-airport.
Example: You fly cross-country from California City (airportelevation 2437 ft) to Lone Pine (airport elevation 3680 ft). The
displayed takeoff-airport-altitude is yet to be set on a value of
2430 ft before the takeoff (the altitude-resolution is 30 ft). So,
on the display of the VW921 a QFE-altitude a = 0 ft and a
QNH-altitude A= 2430 ft should be displayed before takeoff.
These values are independent of the current atmospheric
pressure, because this is stored only internally in the flight
computer as a reference pressure-value for the entire flight.
After takeoff the QNH-altitude and QFE-altitude maintain a
constant difference value of the airport-altitude. E.g. At 1800
ft over the airport the computer displays: a = 1800 ft and A =
4230 ft. Any time during the flight (preferably, before the final
glide) you want to set the QFE-altitude on the altitude of your
destination-airport. You can perform that through a direct
38
alteration of the QFE-altitude (this possibility already exists
before the flight, but then your QNH-altitude at the moment of
takeoff is incorrect). It is best to make the correction during
the flight by selecting menu-position 0/2 (QNH-altitude),
invoking the correction-mode, and putting the airport-altitude
on the target-airfield. In the case of our example 3680 ft (Lone
Pine).
The QNH-altitude stays exactly on the previous altitude. It is
airfield-independent, thus an alteration of the goal-airfieldaltitude doesn't change the QNH-altitude), but the QFEaltitude has been modified to this corrected altitude
correspondingly.
Atmospheric pressure-changes during the flight are corrected
with the corresponding alteration of the QFE-altitude.
39
11.01.97
4
Measuring Distances
The basic flight computer model already processes data
provided through the high-precision piezo electric pressuresensors necessary for the exact calculation of a final glide. It
makes sense therefore to use this precision for the rest of the
flight so that distances flown and height-corrected average
cruise speeds (TAS) can be displayed as digital read-out, taking
account of the wind. Using the additional options like GPSNavigation and/or compass-linkage, the user-friendliness of the
flight computer through the greatly simplified positions- and
distance-determination of more displayed altitudes and the
accuracy and reliability of the derived values (e.g. Wind, final
glide altitude) again further improves and reduces pilot
workload.
The utilization of satellites- and other navigational-aids
necessitates however, a sophisticated software, which
differentiates between signal sources derived from the GPS
unit, compass-linkage or data out of the pitot signal. It is
normal to have longer pauses at the reception of navigationaldata (bad reception of the GPS-satellite feed, powering off the
GPS-receiver because of high power-consumption, etc.) the
computer links the data so that the pilot always gets the exact
route-calculation as measured. . This information helps the pilot
with navigation, checking wind strength and in making tactical
decisions.
4.1
Distance-sizes
The Flight computer can store up to 9 sections or partial
sections of a flight and total-route SΣ, a "speed-sensor" route
Sto (total) over the total flight.
Each route-section has corresponding route data that belong to
it that describe the flight on this leg. Review the following
section for concept details and an overview:
40
Term
Symbol
Leg
Distance
Route-time
Route-speed
S or s
D or d
t
V or v
Bearing
P or p
with Explanation
GPS
only
- an already flown distance
- yet to be flown distance
- the flight time on the active route
- the speed achieved on the route
Vn = Sn / tn
X
Exit-S-point
X
Goal-point
X
- the bearing of the location,
respectively, the start to the end
point of the route
- the start-point of a route with
names (maximum 8 char) and
coordinates
- the end point of a route with
names (maximum 8 char) and
coordinates
A more detailed explanation of the single concepts and symbols
are available in chapter 3.3.4, The display rows for Normal /
Cross country mode.
A yet not activated leg Sn is always set to null. A completed
leg Sm will be set on the original distance. Vice-versa the yet
not activated distance Dn corresponds with the distance of the
route-length and the distance Dm, which is a finished route, is
set to null. Meanwhile, with GPS-linkage these distances are
set through the GPS-receiver, and should be programmed into
the GPS receiver before the flight. More exact hints are in
chapter 4.3.2, The route-mode without GPS-linkage.
The section Sto (total) starts and stops automatically by pitot
pressure. The measuring starts when airspeed exceeds more
then 32 knots/h for more than 10 seconds, and ceases when
speed is reduced to less than 22 knots/h.
The total-route SΣ is the sum of all partial flight routes of S1
to S9.
41
11.01.97
The routes of S1 to S9 can be started and stopped in
conjunction with each other, i.e. starting a new section stops
the current one. This has the advantage that when flying a
triangle for example you only need to start S1 when crossing
the start line - SΣ is automatic. At the first turn point you start
S2 and S1 stops automatically but SΣ continues to measure.
Only when the last section (S1 - S9) is stopped does the total
SΣ stop. You can program the sections before take-off so that
the distance count is cumulative or a countdown. You either
know how much ground you have covered or how far you still
have to fly. Distance programming is only possible in S1 to S9;
the cumulative total of the programmed sections is held in SΣ.
I.e. the route of S5 is activated only after route of S4 is
completed.
If you prepare your map by marking distances along the route
you can easily find your position, estimate flying times, and
perhaps avoid the unnecessary risk of pressing on too fast.
Section Sn can be started or stopped at any time without
affecting the other sections. This means that you can record
part of a section or leg of a task In terms of distance and speed.
4.2
General Operation
4.2.1 Start of a route
The start of the legs always takes in place with the same
procedure and is independent of your display value,
respectively, of the activated display mode:
Press the toggle-switch (10) to ENT position for approximately
1.5 seconds, on the right upper quadrant of the display you will
see the activated flight section ”Start S3" for 3 seconds.
42
xxxxxxxx Start S3
xxxxxxxx xxxxxxxx
As of this moment the leg-time is displayed tn, the speedsensor- route is started at null and the flown route Sn
measurement in direction of your next turn-point is activated.
In the upper example the route-time of t3 = 0 sec and the route
of S3 = 0 Nm.
If until now there was no active route, by pressing the toggleswitch (10) to the ENT- position for a longer duration the first
leg S1- and also the total-route SΣ is activated. Otherwise if
you press the toggle switch to the ENT position a new leg will
be activated and the previously active route of Sn-1 will be
halted. Only one route can be active at one time.
Incidentally, it is harmless to depress the toggle-switch (10) to
the ENT- position for a longer duration and it will not be
activate the next leg until the toggle switch is depressed again.
4.2.2 Reactivating a route
In case you inadvertently activated a part-route or for some
other reason want to reactivate your last turn point, tap the
switch (10) to ENT- and the input-switch (9) to ‘−
− ’ for about
1.5 seconds.
Notice that in this event the flight time and speed-sensor-route
in route of Sn+1 again on the now active route Sn is added.
So is the old distance Dn+1 set back again to the original value
of the route, the time of tn+1 and the speed-sensor-route are
deleted.
This reactivation is possible only once and also only if the
previously activated route has not yet been finished. That
means the distance of this route must be greater than 2.7 nm
from the next turn point.
What if you have to return to the turn point because of a
wrong photo?
43
11.01.97
4.2.3 Erasure of the Distance-storage
With a simultaneous keystroke (10) to the down position and
(9) to the up (+) position you will delete all pre-programmed
routes which have not been activated yet.
This procedure is always recommended if you have
programmed an entire flight-plan before the flight, and now
during the flight you want to change the task. The already
flown routes remain with all the data in the storage, only the
pre-programmed routes not flown are deleted.
Comment: Computers with the software version 'C ' (displayed
at power-up) route-storage and distances are entirely deleted,
in this version all routes begin again at null.
44
4.3
Management of the routes
4.3.1 The route-mode with GPS-linkage
In cases with GPS-linkage there are two different GPS
operation modes possible that also affect the handling of the
routes in the VW921 flight computer. The first mode uses
consecutive input of different turn-points (titled in the
handbook goal-flight-mode). When you have reached a turnpoint the consecutive is automatically switched and displayed.
In the computer language and GPS-world we frequently find
the concept of a GOTO function or "turn-point" function.
In the second mode the whole task is programmed into the
GPS memory (subsequently named task-mode).
While it appears simpler and more user-friendly to work mainly
with the task-mode, the goal-flight-mode is nevertheless
frequently used, especially with modifying (e.g. decrease) the
task.
The VW921 flight computer automatically recognizes if it has
been connected to a GPS-receiver. It also recognizes if the
GPS-receiver is programmed in the goal-flight mode or in the
task-mode. The task-mode gets a higher priority. As soon as
the task-mode is activated in the GPS-receiver, the VW921
takes over the entire task, and locks on to that task. In this
way the GPS-receiver has a second complete navigationalcomputer to use. The VW921 holds the original task, this
allows the GPS-receiver to do other tasks in the non-function
mode. For example the next turn-points can be executed or
just to experiment (in a Double-seated glider). A special
advantage is the help-function (emergency-function, nearest
way-points), with that you can receive instant data for finalglide or the next closest airport.
45
11.01.97
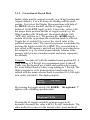
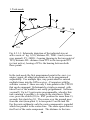
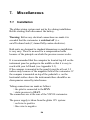
1. Task-mode
TP2
TP3
TP1
Fig. 4.3.1-1: Schematic depiction of the indicated sizes at
active route of leg 1 (S1), distance D1, TRK = track (course
over ground), P1 = BRG = bearing (bearing to the turn point of
TP2), distance D2= distance from TP2 to the turn point TP3
(yet not active), bearing of P2 is the bearing between both
these points.
In the task-mode the first programmed point is the start- (or
origin-) point, all other turn-points are to be programmed
sequentially. For multiple laps, way-points must be entered
multiple times into the GPS-receiver. (Computers with the
software version C: there are only 9 turn-points in the VW921
that can be managed. Unfortunately a triple-go around with
takeoff out of the middle is not easily programmed. Software
version D: Up to 15 part-routes programmable, whereby this
task variation is possible). As soon as the start-line is flown
over, press the switch (10) to ENT position for more than 1½
seconds, this starts leg S1. The course over the ground goes
from the start (turn-point 1) to turn-point 2 on the task list.
For the route arithmetic only the route-component is regarded
which lies parallel to the course-line. The route-speed derives
itself out of the route-component. The distance to the turn46
point is the direct distance over the ground and the bearing is
the takeoff line between your airplane and the turn point. Note
this peculiarity: at bigger deviations of the course the sum of
the distance can be bigger than the original distance between
both points.
Schematic depiction of the indicated sizes at active route 1 with
route S1, distance D1, TRK= track (course over ground), P1=
BRG = bearing (bearing to the turn-point TP2), distance D2 =
distance the turn-points TP2 and TP3 (yet not active), bearing
of P2 is the bearing between both these points.
In flight with the task-mode as opposed to the goal-flightmode with a fixed set assignment offers the following
advantages:
- The operation is simpler, when reaching the turn-point, start
the next route by pressing the switch (10) to ENT position.
This mode abstains from making an automatic switch-over to
the next part-route. First after reaching and photographing the
valid turn-point only then is the leg finished in the VW921. In
this way you can compare the bearing (BRG) to the to
approaching turn-point towards a bisector. This comparison is
displayed in the flight computer additionally with the
information a photo-sector is supported.
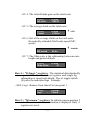
A photo-sector is inserted at the turn-point fly-around.
Activated for the sector at ± 45° to the bisector and displayed
within a distance of .8 nm of the turn-point through a blinking
display "Photo" in the top-right display quadrant:
xxxxxxxx
Photo
xxxxxxxx xxxxxxxx
Keep in mind, that this notification over the photo-sector is
only as good as the coordinate information of the turn-point:
At a deviation of turn-point-coordinates and a photo-object of
around 1 nm this notification is naturally wholly unusable.
When reaching the last turn-point (finish-line) the photo-sector
is magnified to 180°.
When invoking the final-glide-mode with the mode-selectswitch(8) and sometime during the route, the remaining flight
distance and the associated required altitude gain (if less than
47
11.01.97
5.4 nm is) is given. E.g. before takeoff make sure all turnpoints are correctly entered, this way the deviation between the
route-length in the VW921 and the task position is a maximum
0.5-1 nm (based on different calculation-formula's there will
always be small differences).
How does one program a task with multiple laps? Of course it
is always possible to either use the goal-flight-mode or the
task-mode, and consecutively program all turn-points
redundantly. As of version 2.0, there is a new possibility, only
program one round and through using an invocation-algorithm
attach more rounds: If the last route has already started and in
the GPS-receiver the task is still activated, you simply start a
new route. If only two or three turn-points belong to the
round, the VW921 assumes that a new turn-point has started
and attaches just one more round. At 4 or more turn-points it
assumes ,however, a start off on the middle of a leg and,
attaches the start-point at the next goal out. It leads you
directly to the first target-point. You can find an example of
the multiple laps in chapter 4.4.4.
2. Goal-flight-mode
For some tasks e.g. POST, FREE DISTANCE or ZIGZAG
shaped courses, the route will be determined during the flight.
Therefore you can fly without the task mode. Because this
route-mode is also applicable for parts of the task-mode some
pilots generally fly in this mode. The advantage is in the
consequent flight-mode there is no transition necessary.
Before takeoff the first turn-point is entered into the GPSreceiver. Depending on the update-rate of the GPS-receiver
(one or two seconds) the VW921 flight computer needs a little
time to calculate the data. Now you can start the first route
with the VW921- as described above by pressing longer on the
toggle-switch (10) to the ENT position. In the goal-flightmode there is no start-point programmed, the current
coordinates are taken as the start-point and the exact courseline is drawn to the first turn-point. At the approach of the first
turn-point, before that turn-point is reached, the GPS-receiver
can be switched to the next turn-point. The VW921 leads you
with distance and bearings on the first turn-point. In the flight
48
computer the following turn-point is already input, the up
coming departure-point is well known and offers you the same
photo-sector notification as during the goal-flight-mode. All
other turn-points are proceeded analogously.
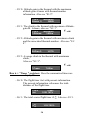
How can you check if the VW921 works with the right turnpoint-data? First of all, in column 0 of the distance-row
(menu-position 1) or route-display mode (display mode 3) you
can find out which route is active (the number after the
lowercase letter). Turn the menu selector knob (4) to this
position. With the active route no. 3 (approaching the third
turn-point) the following is displayed:
N: 0.7 x→ 3 1/3
D3:73.8 P3: 112
In the status-display row the active route "D3" and the turnpoint "P3" is displayed. Non-active routes would be displayed
with a double apostrophe. In the top-right display quadrant the
approaching turn-point with name and the coordinates
underneath are displayed. In the next menu knob (4) position,
you receive the goal-coordinates from the GPS-receiver.
While both are identical, this is displayed twice consecutively.
You can change the coordinates in GPS-receiver without
problems - the VW921 will still lead you on the original
coordinates. When coordinates of the following turn-point are
inputted in to the GPS-receiver, they change themselves after a
delay, to the inputted coordinates. In the distance row the
distance between turn-point 3 and turn-point 4 is displayed (in
this example after D4 and after P4 of the course-angle between
both these points). If the GPS-receiver is pointing right to the
next turn-point, it also matches the information for the photosector.
At start of the next route (in this case: route 4), route 3 at this
point is finished and route 4 is determined as the new route
between present position and the current GPS-goal. At the
moment of activation of a new route, the goal of the VW921
and the GPS-receiver is updated, so that in the turn-pointdisplay mode this turn-point appears at least twice: Once in the
active column of the turn-point-display mode and : Once in the
next column with the turn-point of the GPS-receiver. This
stays up until input of an other turn-point into the GPS-receiver
49
11.01.97
is received. A further advantage of these handling algorithms is
the possibility of leading a final-glide over a turn-point.
Please note: You have two independent units making
calculations of the next turn-point: while you can select and
discard any new turn-points with the GPS-receiver, the VW921
flight computer holds steadily towards the old goal, until you
have selected a new goal with the GPS-receiver and validated it
through entering the new route.
In this way you attach a new route to the other and
consequently also put a new route together. When the turnpoint is reached it will be logged into the route-list as end
point of the last route and as start of the newly activated leg.
The radius is chosen large enough, so that it takes into account
inaccurate coordinate-information to define the turn-point as
valid. The route-calculation is applied even if the turn-pointdata incorrect. The goal-flight-mode in the flight computer is
converted immediately into the task-mode, as soon as you
activate the task-mode (= ROUTE; TASK) in the GPSreceiver. Before takeoff the complete task is programmed.
During the flight three different variations are chosen with
following priority and the goal-point-storage is set
corresponding to the valid variation:
1. The route agrees with the start-point to the present goal
exactly like the route before: Thereupon the route is copied
identically with the goal-point-storage. For example, turnpoint 4 in the GPS-receiver and turn-point 4 in the VW921
display stay respectively.
2. The start of the task-position (goal-point 0) is identical with
the activated turn-point. So that the concatenation-algorithm is
utilized and all the GPS-receiver programmed turn-points are
flown in the preset sequence.
3. If neither 1 nor 2 apply, the task-position in the GPSreceiver simply attaches to the existing turn-point sequence.
In chapter 4.4.3 you can retrace a detailed example of the
multiple back-and-forth switching between task and goal flight
mode.
50
4.3.2 The distance-mode without GPS-linkage
The VW921 flight computers (without GPS-option) version
type 1X and (with GPS-option) Versions type 3X, differentiate
themselves in their normal display mode by missing the turnpoint-display mode (the first version type has a single display
row) and less data is displayed in menu-position 0.
Both remaining menu-positions are generally identical,
however, with the restriction that the GPS-version with active
GPS-reception inserts the bearing to the next turn-point into
the distance row. When operating without active GPSreception only the distance of the part-routes is displayed. The
values of the route-length, distance and route-speeds are
calculated and are dependent on GPS-reception. The
calculations are run automatically whether missing GPSreception (i.e. By turning off the GPS-receiver) or a VW921
without GPS-option. When reception of the GPS-signal is
newly established, these values are modified with the updated
coordinates. So, in principle, it is possible to turn off the GPSreceiver (i.e. to save battery power), the calculation of the
values always happens in the most precise form. The following
section applies to the VW921 without GPS connection as well
as with GPS-connection. The following summarizes both
events without GPS-linkage.
The following are differences if there is an active GPSlinkage. This is especially noticeable in menu-position 1-, the
distance row. Without GPS-linkage there is no bearing-angle
displayed, so that the right bottom quadrant stays empty. In
this event when pressing the KORR toggle switch(10) nothing
happens. In contrast when a GPS-linkage is active there should
be a reaction (correction of the current values).
The single route-lengths allow themselves to be
programmable or correctable at this point. You have the ability
to program the route-lengths before the flight. The counting of
the miles occurs backwards towards null or the flown routes
become negative. In this event the displayed values for the
route S and the distance D are identical except for the minussign. In the second event you give up the information as far as
the route yet to fly. The programming of the route-mileage is
51
11.01.97
only possible in single distances of D1 through D15 (= Df), the
sum of the programmed distance is stored automatically in DΣ.
The programming procedure is the same as making a
correction (see Chapter 3.3.2.). You choose the distance row
with the help of the +/- toggle switch(9). With the menu
selector knob (4) select the single distance in the display and
program / correct this by pressing the KORR toggle
switch(10) to the KORR position and with the +/- toggle
switch(9) enter the programmed value by pressing switch(10)
to the ENT position. This procedure should be repeated for
each single distance that you want to put into your route.
Prepare the map with the course-route and distances marked,
this will help you orient yourself quickly. This will help you to
better estimate the flight time so as to avoid unnecessary risk
due to flying too fast.
You can check your engaged wind-component on the
respective route-length by comparing the route-lengths and the
distance-markings. After each distance correction, the flight
computer displays a calculated wind value compared to the
wind-setting of the Wind knob(6) for a short time. The
VW921 furthermore notices this suggested value and displays
it permanently on menu-position 0/9 up to the next correction.
If you use this feature of the distance comparison and adjust
the derived wind value with the Wind knob(6), you already
have an extensive idea of the actual wind situation long before
the final glide. This way the flight computer serves as a good
navigational-aid. For example you know quite exactly, when
you will reach the next turn-point. The activation, reactivation
and erasure of routes happens as described in chapter 4.2, in
which, naturally, only the distance- and route-storage's are
involved.
One more remark regarding the programming of partial-routes
with the GPS-version. Maybe your GPS-receiver is defective
or you have a VW921 GPS-version without your own GPSreceiver. You could borrow, for a short time, a friends receiver
that wants to fly the same route. You only need the GPSreceiver for the programming of the VW921. You only need
to connect the GPS receiver once for a short time (max. 10-12
seconds) before the flight to download the distance storage
with the exact values and also the entire turn-point-list. Then
you can return the GPS-receiver and you used the faster form
52
of programming. The rest of the route-management works as
described before.
53
11.01.97
5
Final-glide
The computer is particularly useful when used in Final Glide
mode. It is designed so that you can check the interaction of all
the factors involved (wind component, MacCready value,
altitude, degree of bug encrustation on the leading edge etc.)
quickly and easily. In this way it is easy to optimize the final
glide. The final glide is estimated most to a time, usually
commenced when the pilot is already familiar with the day's
gliding weather. The pilot knows cloud base altitude, average
rates of climb, and will have some idea of what the wind is
doing. This enables the pilot to make certain decisions whilst
planning the final glide, probably with a higher MacCready
value (because that represents additional safety) (5) and with
the estimated wind component (6) (only the head-wind or tailwind vector is of any importance). In addition the pilot must
state the distance from his home base airfield as exactly as
possible, and for this purpose it pays to use an air map which
has been prepared in advance with concentric circles
representing distance from the destination (see Appendix 9.2).
The computer does not require a special operating state to
perform the final glide calculations; these are continually
performed in parallel with other tasks. Selecting final glide
mode changes only the display format! The display is designed
to allow you quickly and at any time to call up all the
information vital to a successful final glide. The interpretation
of the most important information - glide path deviation,
distance remaining, and course deviation (with GPS coupling)is discussed in Chapter 3.
Chapter 3 explains all display indications, including those for
the final glide mode (section 3.5). This chapter concentrates
on proper selection of the initial final glide settings, and the
interpretation of the various indications. Many examples will
be provided in order to demonstrate the available capabilities.
54
5.1 The Setup Process
In the VW921 all components of the final glide are either
directly or indirectly adjustable, but there are also parameters
that are automatically set. In the following, all final glideparameters and the associated setup stages are explained again.
The Final-glide distance ∆ E is the sum of all the unflown
part-routes and so is also identical with Total-distance DΣ.
The programming or correction occurs only indirectly over
part-routes. With active GPS-linkage the single turn-points are
programmed in the GPS-receiver and from this the final-glide
distance is calculated. Without active GPS-linkage the partialdistance must be programmed. Choosing the correction-mode
during final glide the changes to the active partial distance dn
simultaneously change the total-distance, DΣ (In chapter 3.5.
the final-glide-mode is explained in detail).
The McCready MC (5) number setting is dependent on the
actual weather-situation. For higher MC-number - selected
with the MC knob - you need more altitude and from this a
resultant higher speed.
The Wing Loading WL corrected in menu-position, 0/10 of
the route-mode. This value shall always be set to the real wing
loading. Before the takeoff check the wing loading for each
event, set the value dependent on the pilot weight and on the
water-ballast. During the flight correct them after dumping the
water, so that this always reflects the actual wing loading.
The glider-polar can be checked or modified immediately after
power-up. For more details about the polar curve's and how
this is selected, check chapter 7.4. Selecting the Glider model
and it’s Polar Curve.
A polar-deterioration is selected with the polar-switch (7). In
middle position (= P0) the correct polar curve is selected for
your glider model. The bug-contaminated polar P1 is selected
in the upper switch-position and regards a polar-deterioration
of about 5% at 43 knots/h. While the rain-polar, P2, in the
bottom switch-position is a polar-deterioration of about 15% at
43 knots/h. Because at higher speeds of a stronger influence of
contamination or raindrops can be expected, a linear increase of
the polar-deterioration over the speed-sector was used. At 86
knots/h this value amounts to therefore 10% (P1) 30% (P2)
55
11.01.97
respectively, of the polar fall at this speed. If you don't have
these calculated polar values for contamination-state for your
glider, we recommend the use of a polar curve from a different
glider model. By turning off the flight computers and
variometer briefly (2 seconds) and powering up again, you can
select a glider model with a worse polar (despite the short
power off, the flight-data stays stored).
The Wind-component is selected with the rotary knob (6).
Turning it to the left, select a maximum range of - 25 knots/ h
(head-wind) and to the right a maximum range of +25 knots/h
(back-wind). The raster resolution value is ~ 1 knots/h. For
correct wind-component selection for the VW921 has different
recommendations that are available to help in choosing the
correct wind-component that should be supported. For several
reasons, the final decision is left for the pilot:
- In well-known wind-shear, i.e. in valleys or mountains,
deviations from the recommended values are already in the
setup to be regarded.
- In final glide, over the last turn-point, the last leg in most
cases has a wholly different wind-component as the
momentary value.
- The wind-component can be used as an additional securitycomponent; In that one can select more or less head-wind.
- Bad news for last: Calculation mistakes, detour mistakes, etc.,
can lead to an unrealistic wind-component setup. The end
result is a total over or under calculation of your final glide
altitude reserves.
Out of these introduced final glide-components the VW921
immediately calculates the glide angle of your glider, and over
the total distance you also receive the altitude required for a
successful final glide. For security reasons the VW921 adds
300 ft. to this altitude. Now you only need the altitude over
the destination airport as comparison value correctly adjusted,
so that the flight computer can provide the exact Glide-pathdeviation. You already know that this QFE-altitude (menuposition, 0/1) adjusts itself automatically at power-up to the
altitude of the takeoff-airport. If a correction during flight is
necessary, due barometric pressure changes, this adjustment is
performed either through alteration of the QFE-altitude or
through correction of the goal-airport-altitude on the QNH56
menu-position, 0/ 2. As soon as the flight computer is
programmed with the distances, all components for the final
glide are calculated, so that this mode is displayed without
annoying pre-adjustment simply by pressing the mode-selectswitch(8) down to position (EA).
5.2
Applications for the final-glide-mode
Standard application of this mode will be the final glide on the
last leg. You want to arrive on your destination airport with a
specified speed, and preferably no altitude waste. In the event
of an active GPS-linkage it is always exactly predicted out of
your location and your goal-distance. Alternatively, (without
GPS-linkage), this distance is calculated out of the air-speed
(TAS = True-Air-Speed), the Climb/Glide switch's activation
and the selected wind-component. In the first event, with
incorrect wind-component selection only the glide-pathdeviation is calculated incorrectly. In the second event, you
must compare the remaining distance with your map-position
and correct accordingly. In both events you get a windcomponent recommendation, with that selection you can enjoy
the last miles of gliding, and you will be surprised, how exact
the calculated glide-path matches with reality. But do not
forget to check the remaining distance (without GPS), the
wind-recommendation (with GPS), respectively. Wind plays a
strong role with the unfamiliar vertical wind-component.
- It is also equally possible to check the final glide before
reaching the last turn-point. In case of an entire task-position
(task-mode with active GPS-linkage / programming all partial
distance of D1 to Dn without active GPS-linkage) the
information always references itself on the entire remaining
distance. Contrary to the above, with active GPS-linkage and
goal-flight-mode flight, the next turn-point is the final glidegoal, until the turn-point is in the GPS-receiver and the turnpoint in the flight computer is the same. The turn-point in this
mode is newly programmed in the GPS-receiver. Then the
final glide-route leads you around the flight computer activated
turn-point on the turn-point of the GPS-receiver. It is
57
11.01.97
recommended to input the GPS-receiver, a while before
reaching the next activated turn-point, so the turn-point is
already there it only needs to be activated. Then, when
reaching the respective goal, the courses for the turn-points are
already well-known- and so is the bisector as well as the photosector.
- Contrary to your original plan, because the flight necessitates,
you intend to approach a point in the terrain with a distinctaltitude; i.e. with the following possible events:
1. In the mountains you want to cross over a valley with a fixed
arrival-altitude above the opposite ridge.
2. You can not find more thermals; You break off your task
and want to land on the next airport and therefore change the
goal.
3. A long glide lies before you over a thermal-dead area, which
you want to traverse with a fixed arrival altitude.
4. While in a cruise flight during the local championship you
realize, that the planned task can't be completed in time and
you want to go back the fastest way to your home-airport (=
last turn-point into the task-mode).
The first three cases use the following method to solve the
task:
In the GPS-receiver the next intended turn-point is invoked
with the goal-flight-mode. This function is supported
differently in GPS-models: In the GARMIN-receiver the next
closest turn-points are displayed through the function
"NEAREST WAY-POINTS." The Filser GPS at the
"Emergency" function chooses the next flight-places out of the
total-list. After activation of the GPS-goal, you wait a moment
(about 2 seconds), so that the data is transferred right into the
flight computer. Thereupon, by pressing ENT and " + " for
about 1.5 seconds, the hitherto existing assignment is
deactivated and the GPS-goal is activated as the next turnpoint. In both the cruise mode as well as the final-glide-mode
you are directly led on your intended goal. Incidentally, you
can go back anytime to your old route by pressing of ENT and
" - " for 1.5 seconds. Naturally the here described algorithm is
useful not only in cases with active GPS-linkage, but equally
good without GPS-linkage with the difference, that no turnpoints have to be inputted, but always the distance on the
58
respective legs to be programmed. (see chapter 5.4. Eventexamples without GPS-linkage).
In case 4, in the task-mode with GPS-linkage, by pressing the
ENT up to the last route and skipping through all the other
turn points your home-goal is selected, without inputs to the
GPS-receiver.
59
11.01.97
5.3 Final-glide without active GPS-linkage
The first example demonstrates the application practice-near of
the final glide:
The technical handling is already well-known, we will
concentrate more on the tactical applications (example final
glide) (see fig. 5.3-1: Event-example final glide).
We are flying, with an ASW 20 on the return-flight from the
Swäbische Alps to Weiden (EDQW) a triangle-flight, and
approaching the Rhein-Main-Danube channel south of
Freystadt on a 5400 ft altitude (QFE Weiden). Before takeoff
we already had the single leg with its distance pre-programmed.
Fig. of 4.3-1: Event-example final glide
Where the 43 nm distance circle on the map crosses the canal,
we start with the final glide. On the right bottom display
quadrant already appears the final-glide distance ∆E of 43.0
nm. This is identical with the remaining distance on d3= D3=
60
43.0 nm. For an exact final glide analysis it is possibly required
to correct the 43 nm value (press KORR and, + or -) again
and at exact over-flight of the canal (check through lateral
control) enter the programmed value by pressing ENT. Here
we get a first orientation, which wind until now prevailed.
We could forget about the altitude value, if during the flight no
big pressure-changes are given and our takeoff airport is
identical with the destination airport. It is sufficient to compare
the displayed altitude with the mechanical altimeter. We can
ask the nearby flight service station or air traffic control
service, for information about the barometric pressure, using
the radio transceiver. If a stronger change during the day is
entered, the altitude-correction is performed on the basis of
each 0.1 inches of mercury is equal to 100 ft altitude change.
By international agreement, a standard pressure is defined as
having a barometric pressure of 29.92 " Hg (1013.2 millibars )
at sea level and with the temperature of 59 ºF (15 ºC). The sea
level pressure may vary between the extremes from 28.50" to
30.50" Hg.
We did not observe any major change in wind strengthening,
only for safety reasons, we select a head-wind component of 10
knots/h. We retain the MC-value at 1.5. The Glide-pathdeviation amounts in our event to dA: - 3630, i.e. we are 3630
feet under the required altitude for the final-glide with MC 1.5
and 10 knots/h head-wind-component.
Our tactical-flight considerations aim on two questions:
1. Where can we gain the missing 3630 feet of altitude?
2. Is the estimated wind-component approximately correct?
For the first decision the negative glide-path-deviation it helps
to have the following considerations. Can we gain the required
altitude in a thermal? Is this possible at all at the present day
cloud-base? Do we have a promising cloud street?
We decide for the direct speed-to-fly flight.
61
11.01.97
Now we must check the wind-influence: A prominent start-line
on our prepared map are the 32.4 nm circle at the highway
Neumarkt-Regensburg northeastern the place Neumarkt. Until
that point we can rely instead on the remaining distance D. If
we fly a search-circle, the travel-distance calculation will not be
influenced, because in this phase only the wind-shift has an
effect. If we forget to activate the thermal/straight flight switch
for the following straight flight this will be automatically
performed when reaching the speed of 55 nm/hr at the wingload of 7.2 lbs/sqft as required for the calculation of the
remaining distance. We can now focus on the meteorological
navigation.
By approaching the mentioned highway of the control-distance,
we compare at over-flight with the remaining distance ∆E. It is
obvious that the head-wind has died down or is non existent at
all, the flight-computer displays D:33.5 nm and not the
expected 32.4 nm. So, at the exact over-flight we press the
switch(10) to "KORR" position and we correct with the switch
(9) to 32.4 nm. Finally we enter the value with switch (10) by
pressing it to the "ENT" position. At the same time at the
display bottom right section the true wind-component appears,
and the top right quadrant displays a blinking
XXXXXX
Now we reduce the wind-component with the "WIND"
knob(6). Then the glide-path deviation changes to ∆A: -2880
ft. Above the city of Lauterhofen at 2100 ft altitude above the
ground we find a cumulus cloud with 400 ft/min. average lift.
In that condition we set the MC value of +2.0 and the newly
calculated glide-path deviation displays ∆A: -4320 ft. We can
observe while circling in the lift how the ∆A: value is getting
smaller.
Finally if the ∆A reaches the value of 0 or a positive value, you
can start your final glide in the direction of Weiden. We have
plenty of spare altitude for the arrival altitude of 300 ft and
1590 ft at the point where we reset the MC-value to zero.
At the double-track railroad Amberg-Sulzbach at ∆A: 90, we
check the wind-component again. In case the difference is not
too big (+/- .54 nm), we can continue the straight final-glide.
62
Remark: Display resolution with 0.1 nm interval steps, is very
helpful for the distance comparison. It allows the precise
adjustment of the controls through interpolation especially for
short distances. Besides the generally valid final-glide example
we need to consider some special cases:
-Distance flight without preprogrammed distance. In this case
for the final-glide distance there is no value given(∆E:0) and
because of that no glide-path deviation result. Because of the
missing distance entry the computer will request these distances
when entering the final-glide mode. After entering the
distances, the computer activates these as the last partialdistance(D1) and last leg.
-Flying to a special goal point or (turn-point, ridge, end
distance of a thermal-dead weather): You program a complete
task. A task with three turn-points. The distance D1 to D4 is
programmed. The second leg is 64.8 nm long, and at the
distance of 40.5 nm there is a 10.8 nm long valley. You arrive
at 8700 ft (QNH) to the valley and to cross over it you would
like to use the final-glide mode. The goal is to arrive above the
ridge with 600 ft of altitude (the map shows an altitude for the
ridge of 5700 ft).
First delete all the remaining distances which do not belong to
this route-length. This happens by simultaneously pressing
"ENT" and "+" then all the routes above the active route are
deleted. Because of that D3 and D4 fall out in this example. It
is now D2= d2= DΣ= ∆E= 24.3 nm (the remaining distance of
D2 up to the second turn). You correct the distance of D2
with the intended final glide value of 10.8 nm, because of which
all other distance values also change. Additionally, correct the
airport-altitude to 6000 ft by pressing "KORR" at QNHaltitude. The altitude is 6000 ft, because 300 ft of arrivalaltitude was already integrated. This results in a QFE-altitude
of 2700 ft (See 5.3.1: Valley over-crossing: MC: 2.0, WD: 8.1, WL: 6.6). After crossing the valley you reset to the
previous task by simultaneously pressing "ENT" and "-":
- D2 will be set back to 13.5 nm (24.3 nm - 10.8 nm)
63
11.01.97
- D3 and D4 will be set back to the start-up value
- the FP-altitude will be set back to the original value, because
the original goal is the valid goal.
This process may reoccur multiple times.
Furthermore, the following variations are possible:
A final glide to a turn-point is programmed immediately by
simultaneously pressing "ENT" and "+": You want to finish a
leg against-wind on a specific altitude, while climbing, you
want to use the back-wind-leg, to minimize outlanding-risk,
you will keep a certain security-altitude, and you must find
thermals on the back-wind-leg on each event. For this case it is
possible to use the final-glide-mode. For monitoring the
security-altitude there are two possibilities: one, you fly
generally on a altitude-difference ∆A, that is equal to the
security-altitude (i.e. you must climb that much higher, until
you can read at least this security-altitude as a positive value in
the ∆A). Two, you set the airport-altitude on this securityaltitude and fly with the goal ∆A = 0. You already know that
at the end of the turn-point, activate the remaining distance by
the simultaneous pressing "ENT" and " - ", the airport-altitude
will be set to the correct value .
- For a flight to a turn-point and back to the last thermal
source.
64
Fig. 5.3-2: Flying on to a turn-point
Example: the distance is 5 nm and your altitude is 4590 ft
above ground, you are programming for a glide of 10.5 nm (0.5
nm for the turn-around). The ∆A: the displayed altitude (+300
ft) is then your return-altitude. In our event (Fig. 5.3-2: Flying
on to a turn-point)
MC: 2.0; WD: -2.7; WL: 6.75 the results is
∆ A:+ 1670
D: 10.5
With the constant of ∆A other values can be estimated to make
sure if your glide path stays within the performance-capabilities
of your airplane.
65
11.01.97
5.4
Final-glide with active GPS-linkage
A comparison between sections 5.3. and 5.4 will assure you
that there is practically no major difference in flight with and
without active GPS-linkage. The usage is identical, excepting
the internal functions, distance programming as such and the
total reference-calculations (all distances, over-ground-speeds,
wind etc.). In distance programming there is a difference for
the task-mode or the goal-flight-mode. In the task mode the
calculation of the final glide is always referenced to the entire
route up until the last programmed turn-point. While during
the goal-flight-mode only the next, or at best, the very next
turn-point is acknowledged, so that the final glide can only be
predicted up to this point.
5.5
Final-glide in the Task-mode
In the task-mode it is always possible to get the distance to the
last goal ∆E = DΣ, and at the same time for the selected setting
(MC-value, Wing-load value, FP-altitude and wind) the
required altitude. If the VW921 is correctly compensated and
the above values are set correctly then the negative glide-path
difference is equal to the required altitude to be gained by
thermalling. So there is no difference when the final-glide
mode is invoked, before the start, before the activation of the
first leg, in the middle of any legs or during the last leg. It is
always a good idea to call-up the final glide mode after down
loading the task from the GPS receiver. You can check if the
total distance equals the task, this way you have the single turnpoint xxx coordinates. In case you forget a turn-point or you
entered an incorrect coordinate value then the distance value
comparison will be negative. To make the difference clear for
a final-glide without GPS receiver, lets assume the same
circumstances as in the example in the chapter 5.3. You fly the
last leg of the task, around 43.2 nm from the goal Weiden, and
you have the same weather condition. You do not need to
perform any fine-tuning on the distances, since you have the
GPS for that purpose. You know that the readable distance d4
= D4 = DΣ (=∆E) = 80.4 km from the fourth and last leg, short
for the Rhein-Main-Danube channel must be located and
66
compared to the top-view which the map confirms. The wingloading, readable in menu-position 0/10, is equal to the
true wing-load. Over the radio you acquire the QNH-pressure
and if there is a required correction the difference can be input
in menu-position 0/2 (by pressing the "KORR" switch twice
you can adjust the QNH-pressure directly). In case you did not
check the wind-component, in menu-position 0/9 you are able
to see the wind set-direction since the last turn point; The
difference from the true air-speed TAS and speed over the
ground Vg (=∆V).
XXXXX
Since the wind increased by 3 km/h the ∆V moves between -1
and -6 km/h. You can adjust the wind knob to -5 km/h. The
MC selected value remains unchanged on 1.5 m/s.
67
11.01.97
4.4
Case examples Cruise flight mode
4.4.1 Triangle-flight in the GPS-task mode
empty
4.4.2 Multiple legs and GPS-Goal Flight Mode
empty
4.4.3 Cruise with intermittent GPS-Dropout
empty
4.4.4 Programming of curses with multiple laps
empty
68
6.
Statistics and data-storage
The VW921 flight computer captures and stores all important
events of a flight in a data storage. This recorded data is
available immediately or later for extensive analysis. The
organization of this data storage is in a direct relation to the
statistics mode (as to down-loading and printing over the serial
interface and getting the flight-data (see chapter 6.3)) so that in
this chapter both topics are treated together. To utilize the full
potential of the statistics option of your flight computer, a
knowledge of its storage-organization is imperative.
The statistics display mode was already introduced in chapter
3.4.
You might infer that in the statistics-storage (agrees with as to
the storage of all analyzed flight-data like: route-lengths,
average-speed, flight, circling, glide-times, all registers, cruisedistances, and much more) you could recall flight data from a
previous flight, however this is not the case, because current
and previous flight data cannot simultaneously occupy the data
storage.
While the data of a flight is in record storage (storage of all
events: takeoff, landing, route-start, climb/ glide switch-over
etc. are captured) and has not been over-written, it can be
loaded into the statistics-storage so that now the flight is in the
statistics-storage. What was previously in the statistics storage
has now been overwritten. But all to this stored flight data is
however kept in the record storage, so that it can be restored
later.
The third form of storing flight data is in the flight-book
storage. The flight book storage holds only short data from the
previous 15 flights. It holds the most important flight-bookinformation like takeoff, landing, and flight time, and the flight
date are loaded and displayed. You can familiarize yourself
with how the statistic, record and flight-book storage interact
with each other in the following chapter.
69
11.01.97
6.1 The VW921 Storage-Memory
Organization
For a detailed overview of the VW921 glide-computer data
capture the chapter is subdivided into three sub-chapters:
6.1.1 The Record Storage,
6.1.2 The Statistics Storage,
6.1.3 The Flight Log-book Storage.
Chapter 6.1.1 'The Record Storage' is valuable for you only if
you would like to have a deeper knowledge of the memorystructure of the VW921. For understanding statistics storage
you do not need to read this section. You only need to know
that the record storage is dependent on flight duration and a
certain number of flights, with all statistic data stores in the
background. Using the 'statistics display mode' the stored
statistics data can be loaded for these flights into the
foreground and analyzed.
6.1.1 The record storage
For reconstruction of the flights for statistics purposes
the computer has to store all incidents during the flight
with location, altitude, and time. The stored data for each
flight includes the following events:
take-off time,
landing time,
the beginning and ending of each part-distance (legs),
the entry and exit points for thermals,
the start and end points for each glide (complementary
to each thermal entry and exit point).
70
All single events will be stored sequential as raw-data into
the record storage memory. A complete flight has the
following memory storage structure:
Fig. of 5.1.1-1: Structure of the record storage
The record-storage is designed as a 'ring-storage': The storage
memory is filled with the flight-data sequentially until the
storage is filled-up. The new flight-data will overwrite the first
stored data in the beginning of the memory. The record
storage capacity is 256 events and it can hold several flights
End
Flight
142
Flight
143
empty Flight
132
Flight
141
Start
Flight
142
Fig. of 5.1.1-2: Grouping of the flights in the record storage
since even long flights hold only 40 to 50 event records. All
flights are stored with complete event records in the record
memory, marked with the same flight-number as in the flightlog-book.
For example in the record-storage the flights are marked in the
following way:
71
11.01.97
The last flight is flight # 143, flight #142 reached the end of the
record-storage memory and continued to write to the beginning
of the memory. The 'oldest' recorded flight was flight #132.
The next flight #144, will begin at record #44. The sixth event
of the flight is the take-off time, when the events of the oldest
flight #132 are
overwritten. Then the whole flight-record is deleted and this
part of the memory is freed. The process can be repeated
several times during a long flight where the short old flights
will be overwritten. Because of this dynamic memory
management, it is not possible to define the number of flights
which are readable from the statistics analysis.
The largest number of flights is the same as stored in the flight
log-book storage(max. 15 flights). With very long flights this
number will be reduced accordingly. The record storage is not
accessible by the user, you can access the data only through
the statistics display mode, thru a printout or downloading it to
another computer. You have to load each single flight into the
statistics storage memory.
6.1.2 The statistics-storage
With the title "statistics-storage" we cover all data required to
process the flight analysis. The statistics storage can always
hold only one flight, which is available through the display
mode during or after the flight, printable, and downloadable to
a PC. A printout or download thru the serial port can only be
performed after the flight is finished. The loaded flight data
remains in the statistics memory until something is newly
loaded. The newest happens automatically at every new takeoff, but it is possible to load older flight-data as long it is still
available in the record-storage. The last mentioned possibility
is only available on the ground, in flight it is locked and the
statistics storage is occupied with the current flight data.
In case you are not reloading any earlier flights from the
record-
72
storage memory, the statistics storage holds the data from the
last flight. After the flight you are able to connect a printer and
print the statistics data of the last flight.
The printing of earlier flights requires the usage of a
algorithm (see chapter 6.1.3 The Flight Log-book Storage).
You can access the flight-data stored in the statistics storage
memory in three different ways:
- on the display through the statistics menu selections
(see chapter 3.4),
- printing through the serial port connected printer,
- downloading to a PC through the serial port.
These possibilities are handled in detail in chapter 6.2.
73
11.01.97
6.1.3 The flight-log-book storage
The VW921 flight-computer is equipped with an integrated
real-time clock. This way all the flights are logged with a date
and take-off and landing times. The logged time and date
enables you to log the flights and the log-book for the sailplane precisely. The flight-computer has a separate storage
area for log purposes, the last 15 flight are logged. The log
works on the FIFO (first-in first-out) principle: if the logbuffer is filled with data from 15 flights, starting with the 16th
flight, it pushes out the number 1 flight and the new flight will
be logged as flight number 15. The flight log-book storage was
designed to be big enough to store a large 14 day competition
with eventual multiple starts. You will quickly get used to this
convenient future. This future relieves you from inconvenient
reacquisition of flight data from the contest manager, and all
the flight data is stored and separated apart. The log-book is
accessible in the statistics menu row 9 in menu-positions "S0/0
- S9/5" and stores the 15 flights in the following manner:
6.1.3.1 The flight-number
In the top-right display quadrant the selected flight number is
displayed. Selecting the statistics mode with switch (8) to the
"S" position, you enter the last activated flight log area. To
move to other logged flights you have to press switch (9) '+' or
'-'. The flights are numbered in growing sequence, i.e.: flight
number 113 is followed by 114. At the statistics menu position
"S9/5" you are able to set the preferred flight number. The
setup procedure is only required for the first time. It is
recommended that you select the next available number from
your sail-plane log-book. To set the flight number select
"S9/5" with switch(8) to "S" position, the "MENU" rotary
switch to position '9' and the "MC" rotary switch to position
'2.5' :
C: +0.0 Log 135
Corr. of FlightNr
Pressing switch(10) twice to the 'ENT' position you set the
number for the last flight to #1.
74
C: +0.0 Log 135
FlightNr
= 1?
To set the flight-number to a preferred number, you have to
enter the correction mode by pressing switch (10) to 'KORR'
position. The display will blink with the message 'Flight no: ?'.
C: +0.0 Log 135
FlightNr?
135
Now by pressing switch (9) to '+' or '-' position you modify and
by pressing switch (10) to 'ENT' you select the preferred start
flight-number for the last flight. All the previous flights will be
renumbered respectively.
6.1.3.2 The flight-date
For each flight-number you can find the flight date in the
statistics menu-position "S9/0" (dd.mm.yy):
C: +0.0 Log 135
Date: 12.09.93
6.1.3.3 The takeoff-time
For each flight-number you can find the associated take-off
time in the statistics menu-position "S9/1":
C: +0.0
TakeOff
Log 135
10:43:01
6.1.3.4 The Time of Landing
For each flight-number you can find the associated landing-time
in the statistics menu-position "S9/2":
75
11.01.97
C: +0.0
Landing
Log 135
12:43:01
If the flight is still in progress the displayed time is "0":
C: +0.0 Log 135
Landing 00:00:00
6.1.3.5 The flight time
For each flight-number you can find the associated flight-time
in the
statistics menu-position "S9/3":
C: +0.0 Log 135
Fl.Time 2:00:00
It is available and continuously updated during the flight.
6.1.3.6 Managing the statistics-storage
The additional flight-log-book option is located in statistics
menu-position "S9/4". It performs the statistics control and
loading the logged flight-data into the statistics storage area.
In chapter 2.2 it was mentioned that in the statistics storage
area there is always only one flight-data loaded and analyzed.
Selecting "S9/4" during the flight will always display this
message:
C: +0.9 xLog 135
no memory
The reason is that during flight the present data from the flight
occupies the statistics storage area. Selecting and reloading old
flight data is not possible at this time. Before take-off or after
landing you can find the status of the appropriate flights in this
menu position:
- In cases where data in the statistics storage area is loaded
from the
selected flight-number the lower row displays the following:
76
C: +0.0 Log 135
in memory
This information can appear only once, only by the flightnumber presently loaded into the statistics storage area.
Selecting all the other flight-numbers, where the flight-data is
still stored in the storage area (not deleted), you will be asked:
C: +0.0 Log 134
in memory?
Answering the question with a "yes" by pressing switch(10) to
'ENT' you load the data from the selected flight-number into
the statistics storage area. The previously loaded data is
removed from the statistics storage area. In cases where the
selected flight was performed a long time ago, the flight-data
maybe overwritten with the new flight-data, then the display
shows in menu-position:
C: +0.0
Log 128
no memory
Certainly for early flight numbers the data is not available
either.
Example: the utilization of the statistics storage area:
You fly a large triangle task. For the flight, the computer
assigned flight number 134. The thermals weaken and you are
not able to complete the task. You try to avoid an out landing
risk and you land at a nearby airport. At that airport you have
the opportunity to get an aero-tow back to the home gliderport before sundown. When returning to the home gliderport, you would like to analyze the incomplete task. You did
not have the time to printout and analyze
the flight before the tow to the home-port. Flight #134 ended
at the neighboring airport and the take-off for the tow back to
the home glider-port starts flight #135, even if the computer is
turned off! After landing on the home-airfield your computer
finishes flight #135 with nothing but useless data stored during
77
11.01.97
the tow. Now you are interested on flight #134, the incomplete
triangle task. To reach the statistics data for flight #134 you
select with switch (8) the 'S' mode, turn the 'MENU' knob to
position '9' and the "MC" knob to position '4' (you selected the
statistics menu-position "S9/4").
The display shows:
C: +0.0 Log 135
in memory!
Pressing switch (9) to '-' position selects flight #134. To make
sure, that you selected the right flight number, turn the "MC"
knob through positions 0 to 3 and check the flight-date, flighttime for take-off and landing. After re-selecting "MC" position
'4' the display again shows:
C: +0.0
Log 134
in memory?
Briefly press switch(10) to the 'ENT' position, then the display
shows the message:
C: +0.0 Log 134
in memory!
Now you are able to browse through the flight 134 data (see
chapter 3.4) or you are able to print the same data through the
serial port
(see chapter 6.2).
6.2
The serial interface
The flight computer is equipped with a serial interface, for the
various communication-assignments that can be used. These
assignments include:
- Printing of statistics-data in the statistics-storage
- Printing the flight-data from the last 15 flights
- reception of the GPS-data from a GPS
- downloading turn-point data to the VW921 (as of version D)
78
- output of the basic data from the flight computer in one
second intervals (time, coordinates, variometer signal, altitude)
while at flight to a data-recorder with a particular program on a
PC or other data recorder.
6.2.1 Printing of the statistics-data
All VW921 computers with the statistics option have a facility
for connecting a printer via the serial interface. Any printer
which has a V24/V28 serial interface can be connected and
used for printing out the statistics data. Suitable cables are
available from the manufacturers.
The procedure is as follows:
•
•
•
•
•
•
After landing turn on the VW910/921 (or leave it turned
on).
The last flight data is in the statistics storage (or load the
selected record number for printing).
Notice that statistics-menu-position 9 selected in the
display, then you will print the flight-book-data and not
the flight statistics.
Turn off the printer power switch.
Connect the serial cable between the VW921 and the
printer serial input.
Turn on power for the printer. The printer handshake will
start the printing process.
The flight statistics data is printed, by which all operation steps
of the flight computer (statistics-menu, final glide, normal- or
route-mode, pages in the display mode). The printing
performed in the background mode, and the VW921 is
continuously available for other functions.
If second copy requested, the printer stays connected.
Powering the printer off for (> 10 seconds), and repeated
power on the computer prints a new copy of the same flight
statistics.
And so the printout of a flight looks like:
79
11.01.97
* Dr.s. Westerboer, Hofhansel GmbH,
Weiden*
---------------------------------------VW of 921- statistics
---------------------------------------Date: Thursday, 12. September of 1993
Way of the fly__________________________
Pilot: __________________________
Airplane: __________________________
Takeoff: __________________________
1.Turnpoint: __________________________
Landing: __________________________
========================================
- TIMES---------------------------------------Flight time total. | 2:00 h / 141%
Route-flight time. | 1:25 h / 100%
Climb-portion.
| 0:25 h / 29%
Glide portion.
| 1:00 h / 71%
========================================
- ROUTES- SPEEDS---------------------------------------|route | TAS
| GS
| nm |knots/h| knots/h
---------------------------------------Total-route S.tot| 108.0| 77.2 | 76.2
Route S of 1.
| 64.8| 83.2 | 77.8
Route S of 2.
| 43.2| 68.6 | 74.0
---------------------------------------Mc-trip:
87 knots/h Glide-ratio E: 41
========================================
- CLIMBS--------------------------------------|
|ThermalNo.
---------------------------------------Altitude-gains total. |11550 ft |all
80
Number of the thermals | 4
|-Cruise-sections.
| 7
|-Average Climbs.
|420 ft/s |all
Maximum Climbs.
|660 ft/s | 1
Altitude gain w M.max. | 3000 ft | 1
Max. Altitude-gain
| 3300 ft | 2
B climbs. dAmax.
|360 ft/s | 2
========================================
- THERMALS -- CRUISE-SECTION---------------------------------------|
| dS| alt | dA |Time | dT
No | nm | M| ft | ft | T
|mm:ss
---------------------------------------Takeoff| 0.0|
| 750|3000|10:43|
G:
1| 0.0|0.0| 1250|3000|10:53|15:00
B:
1| 0.0|3.3| 250|3000|11:08|05:00
---------------------------------------G:
2| 0.0|0.0| 3750|1800|11:13|05:00
****************************************
Start route 1
****************************************
G: 3| 0.0| 50.0| 4050|1200|11:18|05:00
B: 2| 50.0| 1.8| 2250|3300|11:23|10:00
---------------------------------------G: 4| 51.0| 29.0| 4050|3300|11:33|20:00
B: 3| 80.0| 1.7| 750|3000|11:53|10:00
---------------------------------------G: 5| 80.0| 40.0|3750| 150|12:03|05:00
****************************************
Start route 2
****************************************
G: 6|120.0| 30.0|3300| 850|12:08|05:00
B: 4|150.0| 2.5| 750| 750|12:13|05:00
---------------------------------------G: 7|170.0| 30.0|3000| 750|12:18|25:00
****************************************
Landg|200.0|
| 750|
|12:43|
========================================
81
11.01.97
* Dr.s. Westerboer, Hofhansel GmbH,
Weiden*
Fig. of 5.2-1: Expression the statistics of a flight
In the first length of the expression you find a form-part to the
registration of general data of the flight. The second part
shows all TIMES absolute in hours/ minutes and relatively in
percent.
The next length covers the ROUTES and SPEEDS of the
single route-lengths and the total-route. In the last display
mode of this real reached prints Glide number.
The fourth length includes following data:
- Altitude-gains altogether in all registers
- number of the registers
- number of the Cruise-sections
- Average Climbs all registers
- Maximum Climbs (strongest register) with No.
the register
- Altitude-gains into the strongest register
- Biggest Altitude-gains with No. the register
- Average Climbs in the register, that the
biggest Altitude-gains brought
The last length offers an overview all glide and climb-phases of
the row to with the most important data.
82
Cruise-section G:
- number of the Cruise-sections
- Nautical-miles S at the start, covered on the total-route
- completed kilometers dS
- altitude at the start H (Total energy-altitude loudly standardatmospheric pressure)
- altitude-difference dh
- Time in hours and minutes
- duration of the Cruise-sections in minutes and seconds
climb-phase B:
- number of the register
- Nautical-miles at the start of the climb-phase, covered on the
total-route
- Average M into m Climbs/ s
- start-altitude of the register
- Gained altitude into the register
- Time in hours and minutes
- climb-time in minutes and seconds
Comment: The absolute-information of route S, start-altitude
H and Time always cover on the commencement of the
circling- respectively itself glide phase, the recorded is with the
commencement of the next phase always identical.
6.2.2 Printing the Flight Log-book
The printing the flight-dates, take-off and landing-times of the
last 15 flights is analogous to the printing the statistics-storage.
It requires the connecting of the serial-printer to the serial-port.
The display mode selection is in the statistics menu-row "S9/6":
printing the flight log-book. Presently the function is not
implemented for the VW921 computer.
6.2.3 Data output format during the flight.
Additional possibility exist to output and store flight-data to an
external equipment (like laptop computer or flight recorder)
using the serial port.
83
11.01.97
The TxD-output pin of the female D-sub-connector has to be
connected to the serial-port of the recording equipment. The
data is transmitted in 4800 baud 8-bit, no-parity mode. Each
transmitted block holds the following information:
1
2
3
4-6
7+8
9+10
11+12
13+14
15+16
17+18
19+20
21-28
Byte
Byte
Byte
, $- 1. byte for the Synchronization“
, R- data-block- recognition
Bit = 1
Flight-state
Bit of 0
Airplane in the flight
Bit of 1
Airplane lands
Bit of 2
Speed-to-fly-mode
Bit of 3
Bit of 4
Bit of 5
Bit of 6
Bit of 7
3 bytes in
BCD-code
Signed
Integer
Number
Signed
Integer
Number
Signed
Integer
Number
Unsigned
Integer
Number
Signed
Integer
Number
Unsigned
Integer
Number
FloatingPoint-figure
Bit = 0
climb-mode
Time in hours/minutes/seconds
total energy compensated standard-.pressure-altitude
average climbs in the last 20 seconds, multiplied with 10
exact variometer value, multiplied with 10
True Air Speed (TAS), multiplied with 10
Compass-course (at option compass-linkage)
Over-ground-speed, multiplies with 10 (at option compasslinkage)
Course over ground (Track, only at option GPS-linkage)
Position in length and width (only at option GPS-linkage)
The numbers are carried over in the following numerical
format:
unsigned or signed integer numbers
84
- consist of 2 bytes
- LSB carried over first
floating-point-numbers
- consist of 4 bytes
1.st byte:
Exponent + 080H
2.nd byte:
bit 0-6 Mantissa positions 2-8
bit 7 sign
3.rd byte:
Mantissa positions 9-16
4.th byte:
Mantissa positions 17-24
The mantissa position 1 behind the decimal-point is
basically 1
85
11.01.97
7.
Miscellaneous
7.1
Installation
The glider wiring system must not be live during installation.
Before starting work disconnect the battery.
Warning: Before any electrical connections are made it is
essential that the variometer is switched off (i.e.
on/off/volume knob (1) turned fully contra-clockwise).
Both units are designed to standard dimensions so installation
is very easy. There is no need for a compensation bottle
because of the principle on which the pressure sensor works.
It is recommended that the computer be located top left on the
instrument panel or perhaps in the middle so that it is easy to
reach with your left hand. (see Appendix 9.3).
If the compass is mounted in the panel it must be at least 3.2
inches away because of the magnetic field of the variometer. If
the compass is mounted on top of the pedestal i.e. on the
horizontal surface above the instruments there should be no
discrepancies caused by interference.
Tubing connections are made as follows:
· the pitot is connected to the DYN
· static pressure to STAT.
The connectors are at the rear of the VW910 variometer.
The power supply is taken from the glider 12V system:
· red wire to positive
· blue wire to negative
86
If the wires are connected incorrectly and polarity reversed the
equipment will not operate. It is protected from reverse
polarity damage, but it is prudent to ensure correct polarity in
any case.
Then the VW921 computer and the VW910 variometer are
connected. The 15 pin connector marked R is equipped with a
slide-lock and connects to the computer unit. When slid about
0.1 inches to connect, the slide-lock prevents the plug from
becoming disconnected. The variometer is connected in the
same way. The 15 pin connector to the variometer is marked
with a V. The slide-lock for securing the connector is mounted
on the variometer case.
Next run a wire through to the speed sensor switch. Take care
to ensure that it is not laid adjacent to the radio antenna cable.
The speed sensor manual switch (SG switch) is best installed
closer to hand (e.g. in the control column). In flapped gliders
the speed sensor magnetic switch should be fitted in a suitable
position next to the flap control-rod. The magnet is to be fitted
directly on the flap control rod and its position should be
adjustable. The distance between the switch and the magnet
should be approximately 0.2 inches. Select the flap position
which the manufacturers recommend as the optimum
thermalling position. Then adjust the position of the magnet
until the computer switches over from speed to fly (N:) to vario
(C:) at that flap position. Now the magnet can be secured in
position. If a second automatic switch-over position is required
a second magnet should be fitted.
Option of external speaker:
The loudspeaker is supplied in a 60 mm diameter round case.
For best effect it should be mounted in the side of the
instrument pod or in the instrument panel if there is a vacant
87
11.01.97
space. Avoid mounting the loudspeaker pointing upwards as it
will very soon collect dirt on the cone and the sound will be
distorted. The speaker is connected with a 30 inches long lead
which terminates in two flat connectors of the same width.
Duplicate instrumentation Option:
For two seaters a second vario is available in 60 mm or 80 mm
diameter versions. Electrical connection is via a 79 inch lead
which terminates in connectors designed to prevent incorrect
polarity.
Finally the electrical connections and the tubing are checked,
the battery is connected and the equipment is switched on using
switch (1) as described in Section 3, Operation.
Printer/Serial Interface Connection
There is a 9 pin D sub socket on the rear of the VW921 for
connecting a printer / personal computer or GPS-receiver via
the RS-232 serial interface. The cables supplied include an
option of single or double cable connection.
In some gliders the rear of the VW921 will be accessible.
The 9-pin D sub socket connects to the flight computer, the 9pin D-sub-plug is a one-to-one serial interface extension of the
flight computer serial port and serves as the connection to the
printer serial port, a personal computer serial port or a datalogger. This plug can be installed on the instrumentation
pedestal, providing an easy access for printer or laptopcomputer. The other lead of the double cable connects to the
optional panel-mount GPS receiver.
Mark the cutout for the plug with help of the included
template.
Over this external serial port connection it is not only possible,
to speak to the VW921 with a PC, but also to the GPSreceiver. For example you can download to the GPS-receiver
with all turn-points from the PC.
88
Attention: If over this plug a third unit, i.e., a printer or a PC,
is installed, the unused instrument must be turned off. Only
two active accessories can be linked simultaneously with each
other. While connecting a printer to the flight computer, the
GPS-receiver must be powered off. While connecting a PC to
the GPS-receiver the VW921 flight computer must be powered
off. A suitable cable for connecting a PC to the flight computer
is a 9 pin cable of the RS 232 type.
The same cable is also suitable for the PC to the GPS-receiver
connection. For this connection any 1:1 RS-232 cable with 9pin D-sub-connector is usable.
In gliders with accessible connectors to the VW921, the singlelead cable-set will be used. The connection to the printer will
be established immediately before printing.
If direct access to the rear of the VW921 is not possible, the
double-lead cable should be used. The part with the 9-pin Dsub plug must be installed solidly. The D-sub-plug of the
VW921 should be connected and locked. The 5-pin round
female connector should be mounted in a reachable place in the
airplane (e.g. Instrument-panel). The other cable included with
the VW921 is for connection to the 5 pin round female
connector to the serial device (i.e. printer or PC). Also see
chapter 6.2. , Serial interface.
7.2
Compensation
We have had no reports of pilots finding compensation a
problem. Test bench adjustment has proved itself in practice. In
cases where there were unsatisfactory pitot results the electrical
compensation was working well.
However meticulous test bench adjustment may be, a check is
needed in the aircraft itself to detect any minor errors in static
pressure or measured pressure. This can only be carried out on
a test flight of course. There follows a description of the pullup case (converting speed to height) as it is relevant to cross
country flying.
89
11.01.97
This test requires stable weather with an absence of thermal
activity if possible. The test sessions are always started at a
fixed initial speed V1 leg. as in Fig. 8 at 92 knots). The test
consists of rapidly reducing the speed to a lower speed V2 leg.
49 knots) by easing back on the stick. To avoid acceleration
effects the change in direction of flight should be smooth rather
than sudden.
During the transition from V1 to V2 the variometer display is
observed. Ideally the display would follow the aircraft polar
exactly (continuous line (1) in Fig. 8), but there may well be
small deviations in the transition phase (dotted line). In this
phase the angle of attack and the coefficient of lift changes.
Naturally this also affects the drag coefficient. Consequently it
is generally not possible to avoid a small
deviation from the ideal when conducting flight tests.
Fig. 7.2-1: Total-energy-Compensation
90
If you have reason to believe the compensation to be in
adequate then the cause may be the static pressure source. We
have had good results with pressure taken from a tube at the
rear of the fuselage which is used purely for the variometer.
The pitot tubes which some manufacturers build into the fin as
standard have proved to be excellent.
You can also adjust compensation (2) at the vario itself. Using
this adjustment, compensation can be set during the test flight.
To do this you do need however to recognize the possible
errors which may be displayed and be able to interpret them.
Fig. 8 represents typical errors and these can be recognized and
corrected as follows:
•
•
Variometer reading rises when you pull back on the stick
and shows too little sink or even shows climb.
It is tending to operate like an uncompensated
variometer (dashed line (3) in Fig. 8). The
cause is too little compensation. Compensation
is increased by turning the compensation
adjustment knob (2) anti-clockwise.
The vario reading falls off when the stick is pulled back and
during the transition from V1 to V2 continues to show
exaggerated sink values (dashed/dotted line (4) in Fig. 8).
The cause is excessive compensation.
The cure is to turn the compensation
adjustment (2) in a clockwise direction.
NB. This adjustment is sensitive: even small movements
affect the degree of compensation considerably.
91
11.01.97
7.3 Compass Compensation
(Only for flight computers with optional compass-linkage! Not
yet available.)
7.4 Selecting the Glider Model and its Polar
Your VW921 glide computer stores the polar for a wide
variety of gliders in its memory. Selecting the glider model
automatically sets the correct polar. In cases, where your
glider model is missing from the list, you can select a glider
model with a similar polar. The resulting error for the speedto-fly value is minimal. The pre-programmed glider-models
stored in the VW921 memory are
listed in table 7.4.1. Selecting the glider model is performed in
the following manner: Within the first 10 seconds after
powering-on the VW921 and the display shows the presently
selected glider-model, press switch (10) to the "KORR"
position, programming mode is then selected. It is dependent
on the menu selector knob position which glider manufacturer
group is displayed for 2 seconds. To select a different glider
manufacturer group you have to rotate the menu selector knob
(4) and with the toggle-switch (9) press +/- to select the glidermodel. To enter the selected glider model, press switch (10) to
the "ENT" position. For each glider model there are three
polar curves:
1. The normal polar is the optimal polar curve.
The polar selector switch(7) is in P0, the mid-position.
2. The bug-infected polar, takes a linear degradation from
the normal polar. 5% degradation at 43 nm/hr. and 10% at
86 nm/hr. Switch(7) position for the "bug-polar" is P1.
3. The rain polar takes more degradation from the normal
polar.
15% at 43 nm/hr. and 30% at 86 nm/hr.
Switch(7) position for the "rain-polar" is P2.
In case you find the degradation higher then the "rain-polar"
you can select a polar from a glider with lower performance.
92
To do that during the flight, turn off the power of the VW921
briefly and choose a different glider model. If the power-off
period was shorter than 1 minute, the computer will keep the
collected data, it will not reinitialized.
Manufacturer
AkafliegGliders
GlazierDirks 1)
Glassflügel
Grob
Polish
Gliders
Rolladen
Schneider
Menu
Knob
0
1
2
3
4
5
D38
D39b
D40
SB5
SB9
SB11
DG100
DG100C
DG200
DG217
DG300
DG400
DG417
DG518
DG520
DG600
DG617
DG618
DG800
Lib301
GF304
GF402
GF604
Hornet
Kest19
Kest22
Mosqui
StdLib
93
AstiCS
JeansA
ClubAs
SpeedA
TwinAS
Twin3
Cobra
Jant1
Jant19
Jant2
StdJan
SZD55
SZD56
LS1c
LS1d
LS1f
LS3
LS3a
LS3-17
LS3Std
LS4
LS6
LS7
LS8
LS9
11.01.97