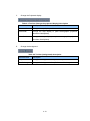
1
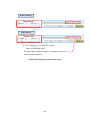
AUIG2 User’s Manual
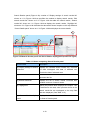
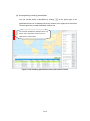
(ALOS/ALOS-2 Consolidated Edition)
Ver. No.
First
edition
A
AUIG2 User’s Manual (ALOS/ALOS-2 Consolidated Edition)
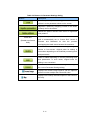
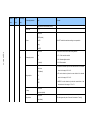
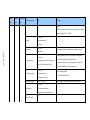
Revision History
Revision
Revised Pages
Revision Details
Date
2014/11/19
1-1
It is described that Internet Explorer 8 means Windows
Internet Explorer 8.
2-7
Changed start of email transmission about expiration of
the download period from 10 (TBD) days before to 3
days before.
2-8
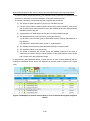
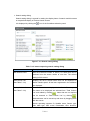
Table 2-3 Order history display list
– Added “Product Count” and “Demander”.
– Deleted “Error”.
3-10
Figure 3-9 User Information Display screen
– Added the “Back” button.
3-10+1
Table 3-4 User information update – Item description
– Deleted “Present Password”.
4-29
Deleted the explanation “(Additional information: Group
functions of Search Results panel)”.
4-30
Figure 4-26 Search setting dialog
– Added “Footprint display location”.
4-30,4-31
Table 4-9 Items composing search setting dialog
– Added “Footprint display location”.
– Changed the items that are displayed by default in
Display Column List.
4-32, 4-32+1
Table 4-10 Display items of Total Columns and Display
Column List
– Added items and changed the listing order of the
items.
4-36
Table 4-13 Cart operations
– Changed scene information deletion so that the
scenes that are deleted are those whose check box
has been selected.
5-1, 5-2, 5-7, Changed design of order limit area.
5-8,
– Figure 5-1 Common menu
5-16, 5-19, 5-21
– Figure 5-2 Overall composition of Product Order
screen
– Figure 5-10 Product order - Operational steps
– Figure 5-12 Product order – Operational steps
– Figure 5-17 Buttons of Order operation area
– Figure 5-19 Order confirmation dialog
– Figure 5-22 Display area of “Order limit” in Cart
screen (Enlarged view)
Table 5-10 Items of Order limit area
– Added “Satellite Name” as one of the screen items.
– Modified description of Order Limit (A).
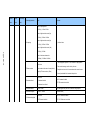
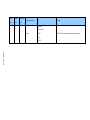
i
Ver. No.
AUIG2 User’s Manual (ALOS/ALOS-2 Consolidated Edition)
Revision History
Revision
Revised Pages
Revision Details
Date
5-9, 5-14, 5-15
Added the “Find Duplicate Scene (new order)” button
as a function to check for duplicate items in the cart.
– Figure 5-14 User interface of Cart operation
– Table 5-2 Items composing Cart operation area
– Added description of the “Find Duplicate Scene (new
order)” button as section f.
Changed name of the Duplicate order check button to
“Find Duplicate Scene (previous order)”.
– Figure 5 14 User interface of Cart operation
– Table 5-2 Items composing Cart operation area
– Changed title of section c.
5-10
In the description of Section b Parameter Settings
button, added “Figure 5-15” as the reference and
modified part of the text.
5-10, 5-11
Added the “Browse Image” and “Map” option buttons
5-13+1,
for scene displays as support for the PRISM triplet.
5-13+2
– Figure 5-15 Parameter Settings dialog
– Figure 5-16+1 Browse display parameter settings
dialog box
– Figure 5-16+2 Map display parameter settings
dialog box
– Table 5-3 Buttons in Parameter Settings dialog
– Added Section iv. Switching Between Browse
Display and Map Display.
Added description about pattern registration of
processing parameters.
– Table 5-3 Buttons in Parameter Settings dialog
Added the “Load”, “Register parameters”, and
“Delete patterns” buttons.
– Added Section iii. Processing Parameters Pattern
Registration.
5-11+1, 5-13+1 Added a description of the parameter settings and
made changes to the existing descriptions.
– Added Section i. Parameter Settings.
– Added Figure 5-15+1 Processing parameters.
– Changed the PRISM Triplet Order Parameter
Settings from Section f to Section ii.
6-1, 6-2, 6-4,
Added the order limit area to the Order History screen
6-4+1, 6-6,
and added a description of the order limit.
6-6+1, 6-11+1
– Figure 6-1 Common menu
– Figure 6-2 Overall composition of Order History
screen
– Table 6-1 Items composing Order History screen
– Figure 6-4 Product receiving – Operational steps
– Figure 6-5 Product receiving - Operational steps
– Figure 6-8 Order History list
– Table 6-2 Items composing Order History list
– Added Section c. Order limit area.
– Figure 6-10+1 Composition of order limit area
– Table 6-4+1 Items composing order limit area
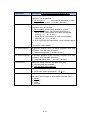
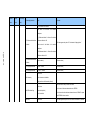
ii
AUIG2 User’s Manual (ALOS/ALOS-2 Consolidated Edition)
Revision History
Revision
Ver. No.
Revised Pages
Revision Details
Date
6-8
Changed the description of the display items of the
order history list from a reference to Table 2-3 to Table
6-3+1 Display items of order history list.
Corrected the reference destination about ordered
product files to Section 6.4.
6-13
Changed the title of Table 6-6 to “Buttons and Link of
Order details list”.
Corrected the reference destination for the description
of HTTPS of Table 6-6 to Section 6.4.
6-13, 6-14
Deleted “Cancel Order” in Table 6-7 (a) Items
displayed in Order information.
Revised Table 6-8(b) Items displayed in Order details
– Added “Product ID”, “Satellite Orbit Direction”,
“Sensor Orientation”, “Observation Date”, “Existence
of L0 data”, “Centre longitude”, “Priority”, “Reason
for impossibility of delivery”, and “Cancel”.
– Deleted “Capture date”, “Catalog ID”, and “Error”.
7-1, 7-5, 7-13
Deleted language switching menu in another window
due to limiting of Japanese/English language
switching to the portal screen.
– Figure 7-1 Observation Screen menu
– Figure 7-3 Observation Plan screen
– Figure 7-8 Map field
7-2, 7-15, 7-16
Added observation area information to the Details field
of the Observation Plan screen.
– Figure 7-2 Overall composition of Observation Plan
screen
– Figure 7-10 Observation plan - Details field
Appendix 2-1
Deleted Batch order file and added Ordered
product file.
Appendix 5
Revised the following items of item list
08_01_Observation Plan
– Limited the No. 1 Satellite name to “ALOS-2”.
– Limited the No. 3 Sensor type to “PALSAR-2”.
– Added the No. 25 Observation area.
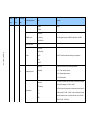
B
2014/12/25 1-1
Added Internet Explorer 11 to the supported browser
version.
2-2, 2-4, 2-6
Changed the first row and/or title in the screens
according to application of the standard JAXA logo.
– Figures 2.2 to 2.4
2-7
Deleted delivery delay from the email notification events.
3-2
Changed the first row and/or title in the screen according
to applying the standard JAXA logo.
– Figure 3-1
4-1, 4-2, 4-5 to
Changed the screen layout for operability improvement
4-9, 4-14, 4-16, and the screen contents according to addition of screen
4-18, 4-21 to
operation features.
4-27, 4-32,
– Figures 4-1, 4-2, 4-4 to 4-9, 4-16 to 4-25, 4-27, 4-28,
4-33, 4-36, 4-37
4-30, and 4-31
– Screen image of i. Function buttons group in b. Tool
bar of Section 4.3.1
iii
Ver. No.
AUIG2 User’s Manual (ALOS/ALOS-2 Consolidated Edition)
Revision History
Revision
Revised Pages
Revision Details
Date
4-3+1 to 4-3+5
Added descriptions about additional panel operation
features for operability improvement, including:
– Showing/hiding (iconizing) a panel/field
– Moving a panel/field
– Resizing a panel/field
Added descriptions about resetting the map field and
Search panel.
4-8
Deleted an explanation about satellite images.
4-11
For “Selection of search method (File specification)” in i.
Function buttons group in b. Tool bar of Section 4.3.1:
Added an explanation about an icon used to specify a
KML file.
4-9 to 4-12
Removed the parts unnecessary for operation
explanation from the screens.
– Figures 4-10 to 4-15
4-12
For Table 4-2 Tool bar:
Changed the order of items according to the display
order in the screen.
Changed from “Local Grid (Japan)” to “Japan Grid”.
4-12+1
Added explanations about the newly added buttons
used for resetting the map field and resetting the display
settings of Search panel.
4-14 to 4-16,
4.3.2 Condition specification panel
4-18,
Changed the description that five condition
4-21 to 4-24,
specification panels are integrated into one panel that
4-29
contains five tabs, and conditions can be specified
with these tabs.
Removed the panel open/close buttons (“+” and “”)
from Table 4-6.
Changed the names of the following panels as follows:
– Basic Search Basic
– Advance Search Advance
– Search by Id Scene ID
– Disaster product search Topic
– Filter Results Filter
4-16, 4-18,
Added an explanation about the Reset button to the
4-21, 4-22
following screens.
– Figures 4-17 to 4-20
4-19
Changed the screens according to addition of ‘CA’ as
search conditions.
– Table 4-8 Sensor specific conditions that can be
specified on Advance tab (1/2)
4-20
Changed the screens so that the parts on the right of the
input entry frame that have been hidden are shown
– Table 4-8 Sensor specific conditions that can be
specified on Advance tab (2/2)
4-36, 4-37
Changed the check box image.
– Tables 4-14 and 4-15
4-33
Added a reference to Table 4-15 Highlight list in Table.
4-37
Corrected explanations of each item in Table 4-15.
iv
Ver. No.
AUIG2 User’s Manual (ALOS/ALOS-2 Consolidated Edition)
Revision History
Revision
Revised Pages
Revision Details
Date
5-1, 5-2,
Changed the screens according to addition of the
5-5 to 5-7, 5-15 duplicate order check box in Cart
– Figures 5-1, 5-2, 5-6, 5-7, 5-9, 5-10, 5-17
5-4
Changed the screens according to change of the format
for the title and button field on the Search result tab.
– Figures 5-4 and 5-5
5-6, 5-7, 5-10,
Changed the screens according to the update of the
5-12, 5-13+1,
Order parameter screen and order options.
5-13+2, 5-13+3,
– Figures 5-8, 5-11, 5-15, 5-15+1, 5-16, 5-16+1,
5-16
5-16+2, 5-18
5-8, 5-9, 5-18
Changed the sensor icon colors in the screens.
– Figures 5-12, 5-14, 5-19
5-11
Table 5-3 Buttons in Parameter Settings dialog
Changed the order of items according to the display
order in the screen.
5-12
i. Parameter Settings in b. Parameter Settings button of
Section 5.3.1
Added the description that the specifiable processing
levels and parameter values vary depending on the
user.
5-12,5-13
Changed the default value of Orbit accuracy, a
PALSAR-2 processing parameter, to “High precision
orbit information”
– Figure 5-15+1 Processing parameters
– Table 5-4 Setting items of Parameter Settings dialog
(Example of ALOS-2 PALSAR-2 Level 1.5)
5-13+1
Added the following contents to b. Parameter Settings
button of Section 5.3.1.
– ii. Processing Algorithm Version
– iii. Visual examination
5-17,
Table 5-7 Set-up items in Order option
5-17+1
Changed the setting item names as displayed in the
screen.
– Product provision method Provision Method
– Zip file Password Protection
– Split order Providing in Parts
Added “Delivery” to Provision Method.
Changed the option name for Password Protection.
– With password On
– Without password Off
Changed the default setting of Providing in Parts from
“Off” to “On”.
Added “Production Request Type” as the setting item.
6-1
Changed the first row and/or title in the screen shown in
Figure 6-1, according to application of the standard
JAXA logo.
6-2
For the description for Figure 6-2, the number of areas
that consists the Order History screen was corrected
from two to three.
Updated Figure 6-2 in relation to the update of 6-1 (to
match the display contents).
v
Ver. No.
AUIG2 User’s Manual (ALOS/ALOS-2 Consolidated Edition)
Revision History
Revision
Revised Pages
Revision Details
Date
6-4 to 6-8,
In the explanation for Figure 6-4, the filter item and
6-15
selection value for narrowing down the items in the
Order History screen are explained.
Changed the following screens accordingly.
– Figures 6-4 to 6-8, 6-11
6-10 to 6-12
Added the contents of Table 6-4 to Table 6-3 and
made Table 6-4 an unused number.
Added
“Observation
request
rejected”
and
“Observation plan cancelled” to Table 6-3.
Corrected the explanation for “Uplink completed”
status.
6-16
Table 6-8 (b) Items displayed in Order details
Removed “Priority” and “Production results”.
Added “Production results (details display button)”
Described that the Cancel Order is a button.
6-17
Added the following processing status to Table 6-9 List
of processing status displayed in Order details list.
– Downloadable
– Providing period ended
– Providing cancelled (other)
Changed “production status” and “order status” used
in the description about Table 6-9 and in Table 6-9 to
“processing status”, according to Table 6-8.
6-17+1 to
Added the explanations about work result codes and the
6-17+3
reasons for production results that are displayed by
clicking the Details Show button under “Production
results” in the order details list.
7-1, 7-2, 7-5,
Changed the screen layout for operability improvement
7-6, 7-9 to 7-11, and the screen contents according to addition of screen
7-12
operation features.
– Figures 7-1 to 7-4, 7-6, 7-7 (1/2) (2/2), 7-8
7-3+1 to 7-3+3
Added descriptions about additional panel operation
features for operability improvement, including:
– Showing/hiding (iconizing) a panel/field
– Moving a panel/field
– Resizing a panel/field
7-5, 7-6,
Changed the two panels in the Observation plan
7-8 to 7-11
operation panel to two tabs as follows.
– Obs. plan search (simple) s. search (tab)
– Obs. plan search (advance) ad. search (tab)
7-7, 7-13,
Changed the following screens according to addition
7-13+1
of a feature to delete a selected observation plan from
the observation plan list and check boxes used to
select and deselect all items.
– Figure 7-5, 7-9 (1/2) (2/2), 7-9+1
Added the explanations of the features above in
Section 7.3.3.
7-11+1, 7-11+2 Added an explanation about Search setting dialog.
Appendix 1-8 to Changed the default value of Orbit accuracy, a
1-10, 1-13, 1-15
PALSAR-2 processing parameter, to “High precision
orbit information”.
vi
AUIG2 User’s Manual (ALOS/ALOS-2 Consolidated Edition)
Revision History
Revision
Ver. No.
Revised Pages
Revision Details
Date
Appendix 3-1 to Modified the contents of the mail notification to be
3-11
limited to users.
Appendix 4-23
Added a term “User” in glossary and abbreviations.
C
2015/03/31 4-35+1, 5-4
Added a description about adding products to the cart
for users for whom product provision is limited to Japan.
6+15+1
Added a description about the button of Details Display
on the order detail list that is used to display the
production process work result codes and detailed
reasons.
Appendix 1-9
Added a description about Processing method in the
processing parameters.
Appendix1-9,
Added a description about the restriction of GeoPDF
1-11,1-14,1-16
selection according to user permission.
Appendix 1-13
Added a description of the GISMAP version.
Appendix 3-8, Changed “Order Particular ID” to “Order details ID”
3-10, 3-11
according to the actual content of the mail notification.
Appendix 3-11
Modified the description about the mail sent when
provision is cancelled by the operator.
D
2015/03/31 1-1
Modified the description of the operating conditions.
3-11
Added a description that the FTP site is only available
for authenticated users.
4-10
Modified the description about the operation to complete
the creation of a polygon.
Added a description about how to change the search
range.
4-20
Added a description of the abbreviations used for Ope
Mode.
5-5, 5-6, 5-12
Added a description that the default processing level is
“1.5” or “1B2”.
5-11
Updated the description about the “Enable Auto Scene
Shift” check box
5-13
Added a description about limitations on usable file
formats.
5-13+1
Added a description about the “Enable Auto Scene Shift”
check box.
5-17
Added a description that one product is provided for
each order irrespective of the provision method when
“Providing in Parts” is enabled.
Added indications to the provision methods that can
only be used by limited users.
5-19
Added where to reference the order cancellation
method.
6-15+1
Added a supplementary explanation to the processes in
which an order can be cancelled.
6-15+1, 6-17+1, Added a description about individual downloading of
6-17+3
files by using the “Split download” button.
6-17+3
Added a description that the files are downloaded
without being compressed in a zip file in the case of split
download.
7-12+1 to
Added a description about how to edit the search area.
7-13+3
vii
AUIG2 User’s Manual (ALOS/ALOS-2 Consolidated Edition)
Table of Contents
1 Overview ........................................................................................................................ 1-1
1.1 What is AUIG2? ...................................................................................................... 1-1
1.2 Services provided by AUIG2 ................................................................................. 1-1
1.3 Flow till the commencement of AUIG2 services .................................................. 1-3
2 User Portal ..................................................................................................................... 2-1
2.1 Login screen ........................................................................................................... 2-2
2.2 User Portal screen composition ........................................................................... 2-4
2.3 Description of screen............................................................................................. 2-6
2.3.1 Links for main function screens..................................................................... 2-6
2.3.2 User notification area ...................................................................................... 2-7
2.3.3 Order status display area ................................................................................ 2-8
3 User Registration .......................................................................................................... 3-1
3.1 Composition of User Registration screen............................................................ 3-3
3.2 Operational overview for registration of the user information ........................... 3-5
3.3 Composition of User Information Update screen ................................................ 3-8
3.4 Operational overview of update user information ............................................... 3-9
4 Method to Search Product ........................................................................................... 4-1
4.1 Composition of Product Search screen ............................................................... 4-2
4.2 Operational overview of Product Search ............................................................. 4-4
4.3 Description of screen............................................................................................. 4-8
4.3.1 Map field ........................................................................................................... 4-8
4.3.2 Condition specification panel ....................................................................... 4-14
4.3.3 Search Results panel and Scene Details display panel .............................. 4-32
5 Method to Order Product ............................................................................................. 5-1
5.1 Composition of Cart screen .................................................................................. 5-2
5.2 Operational overview of product order ................................................................ 5-3
5.3 Description of screen............................................................................................. 5-9
5.3.1 Cart operation area .......................................................................................... 5-9
5.3.2 Order operation area ..................................................................................... 5-13
5.3.3 Order limit area .............................................................................................. 5-20
6 Method to Receive Product.......................................................................................... 6-1
6.1 Composition of Order History screen .................................................................. 6-2
6.2 Operational overview of product download ......................................................... 6-3
6.3 Description of screen............................................................................................. 6-8
(i)
AUIG2 User’s Manual (ALOS/ALOS-2 Consolidated Edition)
Table of Contents
6.3.1 Order History list ............................................................................................. 6-8
6.3.2 Order details list ............................................................................................ 6-15
6.4 File structure provided by AUIG2 ....................................................................... 6-18
7 Method to Display Observation Plan List ................................................................... 7-1
7.1 Composition of Observation Plan screen ............................................................ 7-2
7.2 Observation Plan screen – Operational overview ............................................... 7-4
7.2.1 Select ‘Observation Plan Search’ in Observation plan operation panel ..... 7-5
7.2.2 Enter search conditions for Observation plan search ................................. 7-6
7.2.3 Check the list of observation plans ............................................................... 7-7
7.3 Description of screen............................................................................................. 7-8
7.3.1 Observation Plan screen - Operations panel ................................................ 7-8
7.3.2 Map field ......................................................................................................... 7-12
7.3.3 List of fields ................................................................................................... 7-13
7.3.4 Details field..................................................................................................... 7-14
Appendix 1 Order parameter settings list
Appendix 2 File list
Appendix 3 Mail notification list
Appendix 4 Glossary and abbreviations
Appendix 5 Items list
(ii)
1 Overview
1.1 What is AUIG2?
AUIG2 is an online service, related to ALOS-2 (Advanced Land Observing Satellite-2)
and ALOS (Advanced Land Observing Satellite) in a WWW browser, which helps to
use various services. ALOS-2 and ALOS related information can be browsed, and
observation data can also be searched and ordered using AUIG2.
Further, within the satellite data providing services, there are services which require
user registration.
The recommended operating conditions for AUIG2 are shown below. Note that the
operation is not guaranteed if you use AUIG2 in an environment in which the following
conditions are not satisified.
Recommended OS: Windows
Recommended browser: Windows Internet Explorer 8 and 11
1.2 Services provided by AUIG2
AUIG2 services are described below by bifurcating on the basis of guest user and
registered user. The services available for registered users and those available for
guest users are shown in Table 1-1 and Table 1-2, respectively.
Table 1-1 Services available for registered user
Service name
Availability
Overview
Product Search
Available
Refer to Chapter 4
Product Order
Available
Refer to Chapter 5
Product Receipt
Available
Refer to Chapter 6
Observation
Available
Refer to Chapter 7
Planning List
Display
* There are some screens where restrictions according to the level of registered users for
various services have been applied.
1-1
Table 1-2 Services available for guest user
Service name
Availability
Overview
Product Search
Available
Refer to Chapter 4
Product Order
Unavailable
-
Product Receipt
Unavailable
-
Observation
Unavailable
-
Planning List
Display
1-2
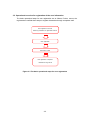
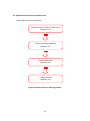
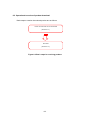
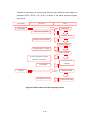
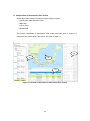
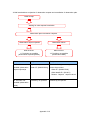
1.3 Flow till the commencement of AUIG2 services
It is required that the registered user and the guest user performs steps shown in
Figure 1-1 and Figure 1-2 respectively, to use AUIG2 services.
User registration
Examined in JAXA
User registration completion notification
Availability of various services (Table 1-1)
Figure 1-1 Flow from user registration till commencement of services
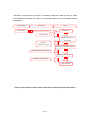
Login screen
Product Search screen
Availability of services (Table 1-2)
Figure 1-2 Commencement of services for guest user
1-3
2 User Portal
User portal is a page having information which the user is highly interested in, or links to
the pages that are frequently visited. To use the user portal, the user must login from an
account created after the user registration.
Login screen
Registered user
(Login)
Unregistered user
(Unable to login)
User portal
Product Search screen
(Chapter 4)
Figure 2-1 Position of User Portal
2-1
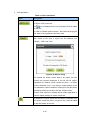
2.1 Login screen
Login screen is the top-page that is displayed in the beginning when a user uses
AUIG2.
A registered user logs in to the AUIG2 on entering the USER ID and PASSWORD in
login section shown as ‘a’ in Figure 2-2.
User registration for AUIG2 is required for JAXA officials and organization or agencies
having an agreement with JAXA and conducting joint research. Other users need not
be registered. Unregistered user can also search product shown as ‘b’ in Figure 2-2.
Information notification sent from the system is displayed at the bottom of the screen
shown as ‘c’ in Figure 2-2.
a
b
c
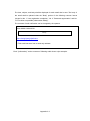
Figure 2-2 Overall composition of Login screen
2-2
Table 2-1 Items composing Login screen
Screen Items
Description
(a) Login section
Enter the USER ID and PASSWORD. When you login
successfully, “User Portal screen” is displayed.
A forgotten password can also be retrieved from here.
(b) Product Search button
A product can be searched without user registration.
Some services such as Ordering a Product can only
be used if you are a registered user.
(c) User notification area
All notifications sent from system for a user are
displayed.
2-3
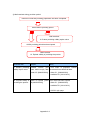
2.2 User Portal screen composition
When you login from the AUIG2 top-page, User Portal screen is displayed.
It is composed of namely three parts, the “Link for main function screens” shown as ‘a’
in Figure 2-3 that has links of frequently used screens, the “User notification area”
shown as ‘b’ in Figure 2-3 that displays the information notification sent from the
system, and the “Order status display area” shown as ‘c’ in Figure 2-3 that displays
production status for the products ordered by a user till now.
a
b
c
Figure 2-3 Overall composition of User Portal screen
2-4
Table 2-2 Items composing User Portal screen
Screen Items
Description
(a) Link for main function
Functions such as Search product, Browse and
screens
Update User Information, and View Public Catalog
are performed.
(b) User notification area
Area which displays all information notifications sent
from the system for all users.
(c) Order status display
Displays status of the order for which availability
area
period has not lapsed.
2-5
2.3 Description of screen
2.3.1 Links for main function screens
This is an area where links for the main function screens for the user are
displayed.
Figure 2-4 Links for main function screens
a.
(Link for User Information screen)
Link for the screen displaying information of a registered user.
(Refer to Chapter 3 for details of user information)
b.
(Link for Public Catalog List screen)
Link for the screen displaying public catalog list.
c.
(Link for Product Search screen)
Link for the screen where products can be searched.
(Refer to Chapter 4 for details of product search)
2-6
2.3.2 User notification area
Area which displays all information notifications sent from the system for all
users.
Figure 2-5 User notification area
Individual users are notified through email as per the timing given below.
User registration (Appendix 3)
If user information is registered in the user registration section (password
registration procedure)
If a user registration application is approved by the administrator
Observation request
If an observation request adopted from the daily observation plan is rejected due
to an emergency observation request
If the actual observation fails
Product order
If a product order is received
If an order is cancelled by the user
Receiving product
If arrangement for delivery of a product is complete (if the product is received by
downloading)
If a delivery record is registered (if the product is received as a DVD/hard copy)
If delivery using FTP-Put is complete
Three days before the download period expires and on the day the download
period expires (if the product is received by downloading).
If product delivery is cancelled due to some reasons
2-7
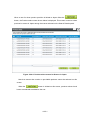
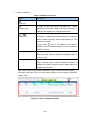
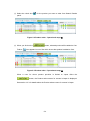
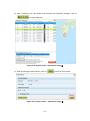
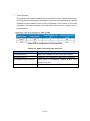
2.3.3 Order status display area
Displays progress status of the order for which availability period has not lapsed,
among the products ordered by currently logged in user.
Last available date (Available Till) is the time till when a product can be delivered.
Last available date is not displayed for a product for creating or cancelling a
product.
Figure 2-6 Order status display area
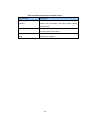
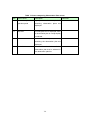
Table 2-3 Order history display list
Items
Description
No.
Number of orders
Details
Order details display icon
Order ID
ID having 10 digits numerals
Order Date
Date when order was received by AUIG2
Order Status
Current order status
Status
Update
Date
Date and time when order status was updated
Time (UTC)
Product Count
Number of products included in the order
Providing Method
Providing method of product
Password Protection
Availability of password protection for product
Order Schedule Date
Order schedule date of product
Available Till
Last available date for product
Demander
Self Order or Agent Order
2-8
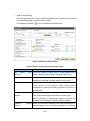
3 User Registration
This chapter explains about registration of user account required to use AUIG2 service
meant for registered user and update of registered user account.
User registration for AUIG2 is required for JAXA officials and organization or agencies
having an agreement with JAXA and conducting joint research. Other users can not be
registered.
Generally, user himself registers and updates his information. It is necessary to agree
with the Terms of AUIG2 Service to use it. Refer to top-page “Terms of AUIG2 Service”
for Terms of Service.
(New User Registration)
User registers himself, by following the steps of AUIG2 user registration according to the
notifications from AUIG2 interface. Refer to 3.2 Operational overview for registration of
the user information for details.
3-1
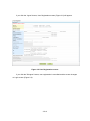
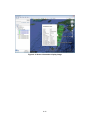
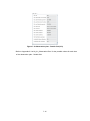
(Update registration for an existing user)
In order to update the user information, login to AUIG2 by using the predefined User ID.
When the “User Profile” button (Figure 3-1 a) displayed on the user portal is clicked,
User Registration screen is displayed.
a
Figure 3-1 User Portal screen (Logged-in)
3-2
3.1 Composition of User Registration screen
User Registration screen is namely composed of three parts, the “User information
entry dialog” shown as ‘a’ in Figure 3-2 where different type of information can be
entered, the “Confirm information” button shown as ‘b’ in Figure 3-2 to register after
confirming the information provided, and the “Cancel” button shown as ‘c’ in Figure 3-2
to cancel the registration.
a
b
c
Figure 3-2 User Registration screen - Overall composition
3-3
Table 3-1 Items composing User Registration screen
Screen Items
Description
(a) User information entry
To enter the information of user.
dialog
Fields with “*” indicate required.
However, Middle Name is optional (Table 3-2).
(b)
Confirm
information
Confirms the entered user information, and registers
button
the user on AUIG2.
(c) Cancel button
Cancels the user registration.
3-4
3.2 Operational overview for registration of the user information
The basic operational steps for user registration are as follows. Further, users to be
registered are notified about steps to register themselves through a separate mail.
User registration in AUIG2
Receiving notification for registration method
User registration
Examined in JAXA
User registration completion
notification through email
Figure 3-3 The basic operational steps for user registration
3-5
① After receiving notification about the application procedure, access the listed URL.
AUIG2: Terms of Use (Figure 3-4) screen will appear. Read all the terms of use, and if
you accept them, click the "Agree” button. If you do not accept the terms of use, click the
"Disagree” button.
Figure 3-4 AUIG2: Terms of Use screen
3-5+1
If you click the “Agree” button, User Registration screen (Figure 3-5) will appear.
Figure 3-5 User Registration screen
If you click the "Disagree” button, user registration is cancelled and the screen changes
to Login screen (Figure 2-2).
3-5+2
② On User Registration screen, enter the following user-related information (“*” indicates
fields required).
Table 3-2 Registration of user information - Description of items
Items
Value to be entered and its meaning
*User ID
User ID used to login in to AUIG2
*Password
Password used to login in to AUIG2
*Re-Enter Password
Confirm password
*Name (First Name)
*Name (Middle Name)
User name
*Name (Last Name)
*Concerned Institution
Concerned institution, organization, workplace, etc.
Concerned Department
Department, division, group, etc., in the concerned institution
Position
Position, title, etc., in the concerned institution
*E-mail Address
Contact e-mail address
*Re-Enter Email Address
Re-enter email address for confirmation purposes
*Country
Country
Postal/Zip Code
Postal/zip code
Prefecture/State/Province
Prefecture/State/Province
City/Town
City/Town
Contact Address
Street, building name, condominium name, etc.
*Phone Number
Phone number of contract address
Ext
Extension number
Fax
Fax number
Delivery Destination
Select the checkbox if the product delivery address is the
Information (checkbox)
same as the above-listed address
Destination Name
Name of addressee listed at shipping
Concerned Institution
Name of organization, institution or company to which the
shipment is addressed
Concerned Department
Name of section, department or group to which the shipment is
addressed
Country
Country
Postal/zip code
Postal/zip code
3-6
Items
Value to be entered and its meaning
Prefecture/State/Province
Prefecture/State/Province
City/town
City/town
Contact address
Street, building name, condominium name, etc.
Phone number
Phone number of contact address
Extension number
Extension number of contact address
Fax number
Fax number of contact address
Url
Site name of delivery address when product is received
through FTP
Username
User name to login FTP site
Password
Password to login FTP site
* Miscellaneous (Sent e-mail
Language
display format)
(Japanese/English)
mentioned
Items in gray cells in the table need not be entered.
3-6+1
in
sent
e-mail
from
AUIG2
③ Click the “Confirm information” button and then confirm the content from User
Information screen. Click the “OK” button to register the user information or else click the
“Cancel” button to return to the previous screen.
Figure 3-6 User Information screen
* Procedures of user registration are carried out by the system operator after registration.
Result of registration (approved/denied) is notified to the specified e-mail address in a separate e-mail.
3-7
3.3 Composition of User Information Update screen
User Information Update screen is namely composed of three parts, the “User
information entry dialog” shown as ‘a’ in Figure 3-7 where different type of information
can be entered, the “Confirm information” button shown as ‘b’ in Figure 3-7 to update
the entered information and the “Cancel” button shown as ‘c’ in Figure 3-7 to cancel
update.
a
b
c
Figure 3-7 User Information Update screen - Overall composition
3-8
Table 3-3 Items composing User Registration screen
Screen Items
Description
(a) User information input
Input the user information (partial or complete) to be
field
modified. Fields with * mark are required.
(b)
Confirm
information
Confirms the modified information and update.
button
(c) Cancel button
Cancels the user information update.
3-8+1
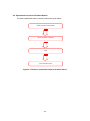
3.4 Operational overview of update user information
The basic operational steps to update various user information are as follows.
Enter the various user information
Save the entered information in system
Confirm the updated user information
Figure 3-8 The basic operational steps to update user information
3-9
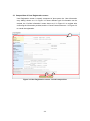
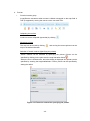
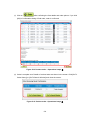
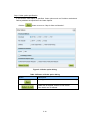
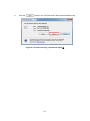
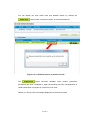
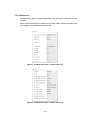
① Login to AUIG2 and click the “User Profile” button on User Portal screen.
User Information Display screen (Figure 3-9) appears.
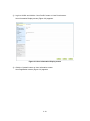
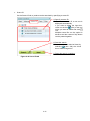
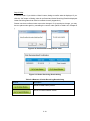
Figure 3-9 User Information Display screen
② Click the “Update” button on User Information screen.
User Registration screen (Figure 3-2) appears.
3-10
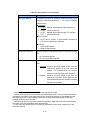
③ Enter the following user-related information (“*” indicates fields required).
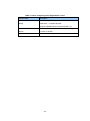
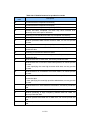
Table 3-4 User information update - Item description
Item
Value and meaning to be entered
*User ID
Input disabled (User ID cannot be changed)
Password
Usually displayed as blank column.
Re-Enter Password
Enter these two items only when changing the password.
*Name (First Name)
*Name (Middle Name)
Input disabled (Name cannot be changed)
*Name (Last Name)
*Concerned Institution
Input disabled (Concerned institution cannot be changed)
Concerned Department
Department, division, group, etc., in concerned institution
Position
Position, title, etc., in concerned institution
*E-mail Address
Contact e-mail address
*Re-Enter Email Address
Re-enter email address for confirmation purposes
*Country
Country
Postal/Zip Code
Input disabled
Postal/zip code
Prefecture/State/Province
Input disabled
Prefecture/State/Province
City/Town
Input disabled
City/Town
Contact Address
Input disabled Street, building name, condominium name, etc.
* Phone Number
Phone number of contact address
Ext
Extension number of contact address
Fax
Fax number of contact address
Delivery Destination
Input disabled
Information (checkbox)
address is the same as the above-listed address
Destination Name
Input disabled
Name of addressee listed at shipping
Concerned Institution
Input disabled
Organization, institution or company listed at
Select the checkbox if the product delivery
time of shipping
Concerned Department
Input disabled
Section, department or group listed at
shipping
Country
Input disabled
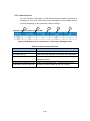
3-10+1
Country
Item
Value and meaning to be entered
Postal/zip code
Input disabled
Postal/zip code
Prefecture/State/Province
Input disabled
Prefecture/State/Province
City/town
Input disabled
City/town
Contact address
Input disabled
Street, building name, condominium name,
etc.
Phone number
Input disabled
Phone number of contact address
Ext
Input disabled
Extension of contact address
Fax
Input disabled
Fax number of contact address
Url
Site name of delivery address when product is received
through FTP*1
Username
User name to login FTP site*1
Password
Password to login FTP site*1
* Miscellaneous (Sent e-mail
Language
display format)
(Japanese/English)
mentioned
in
sent
e-mail
from
AUIG2
*1: The FTP site is only available for authenticated users.
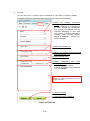
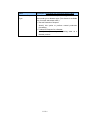
④ Click the “Confirm information” button and then confirm the content from User
Information screen. Click the “OK” button to update the user information or else click the
“Cancel” button to return to the previous screen.
* Update result (approved/denied) is displayed on the screen.
If update fails, modify the entered details with respect to the error message.
3-11
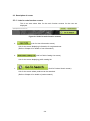
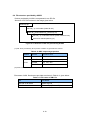
4 Method to Search Product
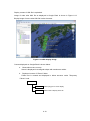
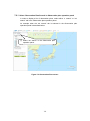
Product of ALOS-2 and ALOS can be searched in AUIG2.
Product Search screen opens when [Product Search] is selected from the Common
menu on the top of the screen.
Figure 4-1 Common menu
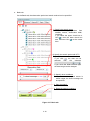
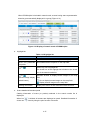
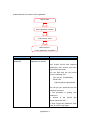
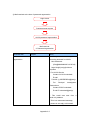
4-1
4.1 Composition of Product Search screen
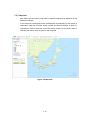
Product Search screen is namely composed of four parts, the “Map field’ shown as ‘a’
in Figure 4-2 which displays the map, the “Condition specification panel” shown as ‘b’
in Figure 4-2 which specifies the search condition, the “Search Results panel” shown
as ‘c’ in Figure 4-2 which confirms the search results, and the “Scene details display
panel” shown as ‘d’ in Figure 4-2 which displays the scene details information.
Each panel can be zoomed in and out by using mouse.
a
b
d
c
Figure 4-2 Overall composition of Product Search screen
4-2
Table 4-1 Items composing Product Search screen
Screen Items
Description
(a) Map field
Displays the map, specifications of search method, and
the footprint of search results.
(b) Condition Specification
Specifies search conditions, and conditions to filter the
panel
search results.
(c) Search Results panel
Search results are shown in a list. Intended product is
selected from the list, and saved in the cart for ordering.
(d) Scene Details Display
Displays the detailed information of the scene selected in
panel
Search Results panel.
4-3
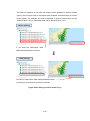
Panel operation
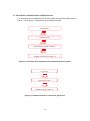
Each panel on the Product Search screen can be customized through operations such as
moving, resizing, and showing/hiding by using the provided tool buttons, dragging the
mouse, etc.
,
Figure 4-2+1 Panel operations
4-3+1
① Showing/hiding a panel
By clicking
at the upper right of each panel, you can iconize (hide) that panel.
By clicking the icon, you can restore (show) the panel again.
Figure 4-2+2 Hiding a panel
4-3+2
② Moving a panel
By using the indicator for moving panels, you can move a panel while automatically
adjusting its size to that of the specified destination.
Figure 4-2+3 Moving a panel
4-3+3
③ Positioning/resizing a panel
Using the mouse, you can position a panel anywhere you want, as well as resize it to
the desired size.
Figure 4-2+4 Expanding a panel
4-3+4
④ Resetting the map field
You can return the map display location to the initial location defined in the search
settings by clicking the
icon for resetting the map display location and scale.
The map scale will return to its minimum value.
⑤ Resetting the Search panel
You can return the display size, display position, show/hide and other settings of the
panels that have changed as the result of various operations, by clicking the
icon for resetting the display size and position on the Search Conditions panel,
Search Results panel, and Detailed Display panel.
4-3+5
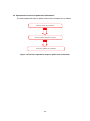
4.2 Operational overview of Product Search
The basic operational steps to search products are given below:
Specify the search method (field)
Specify the search condition(s)
Filter
Check the search result
Figure 4-3 The basic operational steps for Product Search
4-4
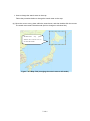
① Move the mouse pointer on tool bar of the Map field, and select the method to specify
the search.
Figure 4-4 Product Search - Operational steps ①
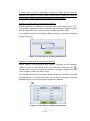
② Search method can be specified by dragging the mouse on the Map field on clicking the
right button. (Following figure shows the example of envelope specification)
Figure 4-5 Product Search - Operational steps ②
4-5
③ Enter the search conditions (type of sensor or satellite, observation period etc.) in the
Conditions Specification panel and click the “Search” button.
Figure 4-6 Product Search - Operational steps ③
④ The Search process will start. A dialog showing progress will be displayed. If you click
the “Cancel” button, a search will stop in between.
Figure 4-7 Product Search - Operational steps ④
4-6
⑤ When the search is completed, search results are displayed in Search Results panel. By
using the Search Results panel, foot print will be displayed on the Map field and the
details can be checked from Scene Details panel (Panel on the lower right of Figure
4-8).
Figure 4-8 Product Search - Operational steps ⑤
4-7
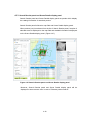
4.3 Description of screen
4.3.1 Map field
Map field is an area which displays the map data and satellite image data in
background image.
Footprint of search result products and specifications of search method are
displayed in Map field. A “slider” shown as ‘a’ in Figure 4-9 for changing the scale
or direction of the map and a “toolbar” shown as ‘b’ in Figure 4-9 for moving the
map or selecting the search method are given in the map field.
b
a
Figure 4-9 Map field
a. Slider
i.
Slider to move map
The map can be moved by clicking the pan control.
ii.
Slider to scale down the map
Scale of the map can be changed by dragging the slider up and down by mouse.
4-8
b. Tool bar
i.
Function buttons group
It specifies the movement when mouse is clicked or dragged on the map field. A
Tool Tip appears by moving the mouse cursor over each icon.
Collapsing the tool bar
A tool bar can be collapsed (expanded) by clicking
.
Movement of map
The map can be moved by clicking
map in the desired direction.
and moving the mouse pointer over the
Selection of search method (Specifying the pointer)
Search method can be selected by specifying the pointer. Pointer can be
specified by clicking on the point over the map field after clicking
.
When the icon is clicked twice, the below dialog is displayed and pointer can be
specified by entering the longitude/latitude. Further, pointer can be specified by
setting the radius.
Figure 4-10 Text to be entered for specifying the pointer
4-9
If search range of circle is specified by specifying pointer, pointer cannot be
specified once again in the circle. Please clear the field in advance by using the
“Clear” button. (Other areas will also be selected in same manner)
Selection of search method (envelope specification)
Search method can be selected in rectangular shape. After clicking the icon
,
an envelope is displayed to enclose the area on the map field by dragging over the
mouse. Double-click a line of the envelope to change the search range.
If you double-click the icon, the following dialog will appear. It can also be specified
by keyboard entry.
Figure 4-11 Text entry for envelope specification
Selection of search method (Polygon specification)
Search method can be selected through polygon. A polygon can be created by
clicking on three or more points on the map field after clicking the icon
.
Double-click the mouse to complete the creation of a polygon. Double-click a line
of the polygon to change the search range.
If you double-click the icon, the following dialog will appear. It can also be specified
by keyboard entry. If you enter the numeric value in the row of dialog, the next row
appears and then you can enter multiple longitudes & latitudes.
Figure 4-12 Text entry for polygon specification
4-10
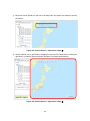
Selection of search method (Polygon specification as per place name)
Search method can be selected as per place name. When
is clicked, the
following dialog appears, and the polygon is created by selecting place name and
region.
Figure 4-13 Polygon specification according to a place name
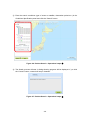
Selection of search method (File specification)
Search method can be selected through file. File selection dialog appears if you
click the “Open” button after clicking the
icon.
The area (range) information mentioned in the external file can be displayed by
specifying the Shape file (see Appendix 2) in dialog.
Click the
icon to specify a KML file (see Appendix 2).
Figure 4-14 External file specification
4-11
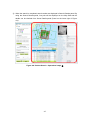
Image display settings on map field
The image display and transmission can be set on map field. When
icon is
clicked, the following dialog appears and the Display Yes/No for each image and
transmission can be specified.
Figure 4-15 Display settings of map field
Table 4-2 Tool bar (Image display settings on map field) description
Items
Description
Scene Centers
It specifies Display Yes/No and transmission for center
point on searched scene.
Footprints
It specifies Display Yes/No and transmission for foot
print of searched scene.
Background
It specifies Display Yes/No and transmission for map
data to be displayed in background.
Browse Image
It specifies Display Yes/No and transmission for browse
image of searched scene.
Japan Grid
It specifies Display Yes/No and transmission for local
grid (only Japan).
4-12
Resetting the map field
You can return the map display location to the initial location defined in the search
settings by clicking the
icon for resetting the map display location and scale.
The map scale will return to its minimum value.
Resetting the Search panel
You can return the display size, display position, show/hide and other settings of
the panels that have changed as the result of various operations, by clicking the
icon for resetting the display size and position on the Search Conditions panel,
Search Results panel, and Detailed Display panel.
4-12+1
ii.
Change the Projected display
Table 4-3 Tool bar (Change the projected display) description
Selected items
Description
Mercator View
Change the map display to Mercator View.
Polar North
Change the map display to polar stereographic projection
(Northern Hemisphere).
Polar South
Change the map display to polar stereographic projection
(Southern Hemisphere).
iii.
Change the background
Table 4-4 Tool bar (background) description
Selected items
Description
Map
Change the background of map field to map data.
Satellite image
Change the background of map field to satellite image data.
4-13
4.3.2 Condition specification panel
In AUIG2, there are 4 tabs that provide different search methods, and one tab that
filters the search results.
Users can carry out searches by selecting a conditions selection tab according to
the objective or use. The default tab is “Basic” tab.
Table 4-5 Condition selection panel
Condition specification
Description
tabs
Basic
It carries out a search by specifying observation time and
search method.
Advance
It carries out a search by specifying the detailed conditions like
sensor specific conditions.
Scene ID
It carries out a search of a product by specifying a scene ID.
Topic
It carries out a search of a product based on the basis of
recorded disaster information1.
Filter
It filters the display for search results.
Common buttons are displayed in the respective condition specification panel.
Figure 4-16 Common buttons of condition specification panel
1
Disaster information includes “Disaster occurrence place (Area, Country and local area)
type (earthquake, tsunami etc.) name of the disaster and date of occurrence”.
4-14
Table 4-6 Common buttons of condition selection panel
Buttons
(Refer
Description
to
search
conditions)
It restores the search conditions which are
registered in the server.
It registers the current search conditions to the
server.
(Saving search conditions)
Maximum five conditions can be registered
against each tab (Basic, Advanced, Scene ID,
and Topic).
(Search settings)
It displays search setting dialog.
4-15
a. Basic tab
On the Basic tab, the observation period and search method can be specified.
Specify the search target.
Select the target product from
satellite, sensor, observation width,
resolution.
If you select the upper check box to
ON ( ), then the lower check box
also becomes ON ( ) at the same
time.
② Specify the search period with UTC.
Specify the scene observation time.
If you click
, the date can be
selected
from
the
calendar.
If you move the slider left and right,
the date range can be changed.
③ Specify other conditions.
If you include the optical sensor in
search target, the cloud coverage can
be specified.
Start the search.
Reset the search conditions.
Figure 4-17 Basic tab
4-16
Table 4-7 Basic search item list
Satellite
Sensor
name
name
ALOS-2
PALSAR-2
Items
Observation width 25km/resolution 3m
Observation width 50km/resolution 3m
Observation width 50km/resolution 6m
Observation width 70km/resolution 10m
Observation width 350km/resolution 100m
Observation width 490km/resolution 60m
ALOS
AVNIR-2
Observation width 70km/resolution 10m-20m
PRISM
Observation width 35km/resolution 2.5m
Observation width 70km/resolution 2.5m
PALSAR
Observation width 70km/resolution 10m-20m
Observation width 350km/resolution 100m
4-17
b. Advance tab
On the Advance tab, detailed conditions such as sensor specific condition can be
searched. (Refer to Table 4-8 for sensor specific conditions.)
① Specify search target.
(Satellite, sensor)
② Specify search method.
(Point,
Rectangle,
Polygon,
Observation path/frame and Downlink
No./Reproduct ID specifications)
Input field can be changed as per
specification method.
(This is an example of envelope
specification)
③ Specify the search period with UTC.
Specify scene observation period.
If you click
, the date can be
selected from calendar.
If you move the slider left and right, the
date range can be changed.
In Advance search, season (across the
year) can be specified besides period
specification according to the date.
④ Specify the sensor specific condition.
Sensor wise specific conditions
(Table 4-8) can be specified
according to search target specified
in point ①.
⑤ Start the search.
Reset the search conditions.
Figure 4-18 Advance tab
4-18
Table 4-8 Sensor specific conditions that can be specified on Advance tab (1/2)
AVNIR-2 sensor
PRISM sensor
PALSAR sensor
Interferometry
Search
4-19
Pair
Proposed
Table 4-8 Sensor specific conditions that can be specified on Advance tab (2/2)
PALSAR-2 sensor
Abbreviations used for Ope Mode
SPT: Spotlight (Observation width 25km/
resolution 3m)
SM1: Stripmap1 (Observation width 50km/
resolution 3m)
SM2: Stripmap2 (Observation width 50km/
resolution 6m)
SM3: Stripmap3 (Observation width 50km/
resolution 10m)
WD1: ScanSAR1 (Observation width 350km/
resolution 100m)
WD2: ScanSAR2 (Observation width 490km/
resolution 60m)
4-20
c. Scene ID
On the Scene ID tab, a product can be searched by specifying a scene ID.
① Specify a scene ID.
If you enter a scene ID, a new row is
displayed automatically.
If you want to delete the input box,
check on the box
(ON) of the row
which you want to delete and click
icon.
Multiple scene IDs can be copied in
advance and the content of clip button
can be pasted together.
② Start the search.
Search targets can also be listed, by
selecting
(turn ON) the check
box of search target row.
Reset the search conditions.
Figure 4-19 Scene ID tab
4-21
d. Topic tab
On the Topic tab, a product can be searched on the basis of existing disaster
information (Disaster occurrence place/type/disaster name/occurrence date).
① Select the disaster occurrence
place.
If “Area” (collection of countries such
as “Asia”, “Europe” etc.) is selected,
then “Country” is selected from the
countries belonging to that area
only. Further, if Japan is selected in
“Country”, then “Country Region”
(region of “Hokkaido”, “Tohoku” etc.)
can be selected.
② Select the disaster type.
③ Specify the disaster occurrence date
(date range) with UTC.
④ Select disaster name.
Specify observation date (date
range) with UTC.
Specify observation period.
If you click
, date can be selected
from the calendar.
If you specify Topic Name, its details are
displayed in Topic Description field at the
bottom of the panel.
⑥ Start the search.
Reset the search conditions.
Figure 4-20 Topic tab
4-22
e. Filter tab
On the Filter tab, searched result can be filtered.
Filtering is done through sensor from
search results displayed in the Search
Results panel. Items are same as basic
search (Table 4-7).
The figures in the ( ) shows the number
of items in the list display of the items
obtained through search. The number of
items in the list display can be changed
through removing the check and
operating the slider of histogram.
(Figure 4-22, Figure 4-23)
Search results displayed in the Search
Results panel can be filtered by changing
observation period to be displayed.
Number of hits for every observation
period is displayed as histogram.
Search results displayed in the Search
Results panel can be filtered by changing
the conditions of Cloud Coverage (When
optical sensor is included in search
target). Number of search hits for each
cloud coverage, is displayed as
histogram.
Figure 4-21 Filter tab
4-23
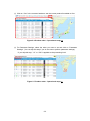
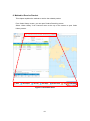
The Filter tab operates in real time with search results displayed in Search Results
panel (c part of Figure 4-28). If the search result is filtered, it becomes easy to find the
target product. For example, the sensor displayed in Search Results panel can be
filtered (Figure 4-22) or observation date can be filtered (Figure 4-23).
Before filtering
If you clear the observation width
490km/Resolution 60m check box…
After filtering
The data of observation width 490km/Resolution 60m
(4 results) is removed from the search result list.
Figure 4-22 Filtering of search result list (1)
4-24
Before filtering
After filtering
For example, if you filter the search
range of observation date…
The data falling outside the range (27 results) is removed
from the search result list.
Figure 4-23 Filtering of search result list (2)
4-25
Search Results panel at the time of carrying out the interferometry pair proposed search
In product search (Advanced search), pair candidate having interference potential can be
searched on the basis of scene information of PALSAR-2 and PALSAR.
The search conditions of interferometry pair proposed are as follows:
① The sensor is either PALSAR-2 (ALOS-2) or PALSAR (ALOS).
② A scene center frame number matches when being same operation mode of the
pair. A scene center frame number is in the pre-defined range when being different
operation mode of the pair.
③ A gap between off nadir angles of the pair is in the pre-defined range.
④ The beam directions (only PALSAR-2) of the pair match (*)
(*) PALSAR-2 can have two types of observation scenes, namely right-direction or
left-direction.
PALSAR has a single observation scene i.e. right-direction.
⑤ The satellite orbit directions (ascending/descending) of the pair match.
⑥ The polarized waves of the pair match.
⑦ The angle θ between two vectors facing the satellite position at the time of
observing two scenes from the center position of the area wherein scenes of the
pair overlap are in the pre-defined range.
In interferometry pair proposed search, if there are two or more scenes matching with the
conditions mentioned above, these are displayed as search results. (Figure 4-24, Figure
4-25)
Figure 4-24 Example of search result display in case of interferometry pair proposed
search
4-26
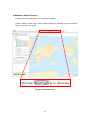
Interferometry pair proposed search is performed by specifying sensor to be searched,
operation mode, search area and observation date range. BaseLine Length (Bperp and
Bpara), Overlap Bandwidth and Beam No (only PALSAR-2) are displayed in Search Results
panel as search result information specific to interferometry pair proposed search. Baseline
length and overlap bandwidth are calculated on the basis of scene of the row selected by
user. (Figure 4-25)
Figure 4-25 Zoomed-in image of Search Results panel
4-27
(Deleted page)
4-28
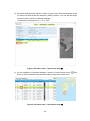
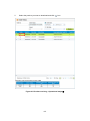
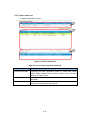
f.
Search setting dialog
Search setting dialog is a panel for setting the display items of search result list screen
or map default display of Product Search screen.
It is displayed by clicking
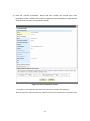
icon of condition specification panel.
Figure 4-26 Search setting dialog
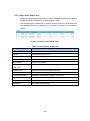
Table 4-9 Items composing search setting dialog
Screen Items
Max
Search
Description
Count It sets the number of items (500 to 10000) obtained from
(Scenes)
search results at once. A default setting is 3000 scene.
Max Browse (Scenes)
It sets the maximum number (1 to 300) of browse image
displayed in map field. A default setting is 100 scenes.
Map Default
It sets the default position of map display at the time of start.
If you click the “Current Setting” button, center position
coordinates of existing map field get entered in the text box
automatically.
Coordinate
method
notation It sets the geographic coordinate notation method in map
field, Search Results panel and Advance (Search) tab.
Either of decimal or hexadecimal (degrees minutes and
seconds) can be selected. A default setting is decimal.
Footprint
location
display When a line has been selected on the Search Results panel,
selects whether or not to move the map field so as to display
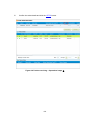
4-29
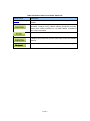
Screen Items
Description
the footprint of the product in question centered on the map.
Total Columns
It displays the list of column items which can be displayed in
(Table 4-10)
Search Results panel. All items which are registered in
catalog DB are displayed in the list.
Display Column List
It sets the column items displayed in the Search Results
(Table 4-10)
panel. The items to be displayed are selected from the “Total
Columns” list and added through
. Unrequired items are
returned to “Total Columns” list through
. Selected
items can be moved up and down by dragging the mouse.
Scene ID, Sensor Name, Satellite Name, Observation Start
Date, Observation End Date, Operation Mode, OBS Path
Number, and Centre Frame Number are displayed by
default.
Sorting Order
It specifies the ascending or descending order and key used
in sorting among the display items. From “Display Column
List”, select the items used in sorting, and add through
.
The items which do not require sorting are excluded from
sorting items through
. Selected items can be moved
up and down by dragging the mouse.
OK button
If you click the “OK” button, the set content will be shown in
the system and dialog will be closed.
Cancel button
If you click the “Cancel” button, set content is discarded and
dialog is closed.
Restore Default button
If you click the “Restore Default” button, set value is returned
to default state.
4-30
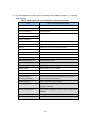
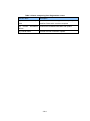
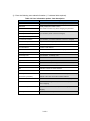
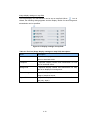
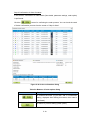
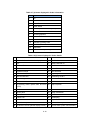
Table 4-10 Display items of Total Columns and Display Column List
#
Item
#
Item
1
Scene ID
2
Sensor Name
3
Satellite Name
4
Observation Start Date
5
Observation End Date
6
Operation Mode
7
OBS Path Number
8
Centre Frame Number
9
Accumulating Orbit No
10
Acquisition Mode
11
Ascending Node Cross Date
12
Backward Pointing Angle
13
B Band Channel
14
Beam No
15
Bits pixel
16
Calibration Flag
17
Cloud Coverage Information Version
18
Column No
19
Compression Mode
20
Data Quality
21
Data Transmission Rate
22
Division
Scene
Cloud
Coverage
Information
23
Down Link Path No
24
Down Link Segment No/Reproduct ID
25
Earth Rotation Correction
26
Effective Data End Date
27
Effective Data Start Date
28
Exposure Coefficient Status
29
Forward Pointing Angle
30
Gain Backward
31
Gain Forward
32
Gain Nadir
33
Gain Status
34
G Band Channel
35
Ground Station Code
36
GRS Line No
37
Image Catalog File Size
38
Image Catalog Processing Date
39
Image Catalog File Name
40
L0 Processing Result File Name
41
L0 Status
42
Line Loss No
43
Line No
44
Nadir Pointing Angle
45
Near Real Flag
46
Number of Pixels
47
Observation Direction
48
Operation Segment ID
49
Operation Segment No
50
Operation Type
51
Orbit Data Type
52
Path No To Calculate
53
Pointing Change Flag
54
Position X
55
Position Y
56
Position Z
57
R Band Channel
58
Reception Path No
59
Reference Ground Time
60
Reference Satellite Time
4-31
#
Item
#
Item
61
Rev Correction
62
Satellite Clock Cycle
63
Scene Centre Longitude
64
Scene Centre Time
65
Scene Centre Latitude
66
Scene Cloud Coverage Information
67
Scene Centre Date
68
Pointing Angle
69
Orbit Direction
70
Off Nadir Angle
71
Polarization
72
Scene Lower Left Latitude
73
Scene Lower Left Longitude
74
Scene Lower Right Latitude
75
Scene Lower Right Longitude
76
Scene Start Date
77
Scene Start Time
78
Scene Upper Left Latitude
79
Scene Upper Left Longitude
80
Scene Upper Right Latitude
81
Scene Upper Right Longitude
82
Set Pixel
83
Sunazimuth
84
Sunelevation
85
System Flag
86
Table Number
87
Processing Level 0
88
Disaster Area
89
Disaster Country
90
Disaster Region
91
Disaster Memo
92
Disaster Name
93
Disaster Accrual Date
94
Disaster Type
95
Total Orbit No
96
Transmission Start Date
97
Urgent Flag
98
UTC-GPS
99
Valid Data End Date
100
Valid Data Start Date
101
Valid Start Date
102
Velocity X
103
Velocity Y
104
Velocity Z
105
Yaw Steering Flag
106
File name of Thumbnail
107
Thumbnail Size
108
Processing Date of Thumbnail (UTC)
4-31+1
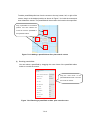
4.3.3 Search Results panel and Scene Details display panel
Search Results panel and Scene Details display panel are panels which display
the catalog information of searched product.
Search Results panel is linked to map field and Scene Details display panel.
When product (row) is selected from the list of Search Results panel, footprint of
selected scene is displayed on the map field and detailed information is displayed
on the Scene Details display panel. (Figure 4-27)
Figure 4-27 Search Results panel and Scene Details display panel
Moreover, Search Results panel and Scene Details display panel will be
displayed in same manner even in case of “Disaster product search”.
4-32
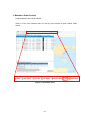
Search Results panel (Figure 4-28) consists of “Display settings of search results list”
shown as ‘a’ in Figure 4-28 that specifies the method to display search results, “Edit
search results list” shown as ‘b’ in Figure 4-28 that edits the search results, “Search
results list” shown as ‘c’ in Figure 4-28 that displays the search results, “Highlight list”
shown as ‘d’ in Figure 4-28 that limits the data which shows footprint on the map field and
“Scene Details panel” shown as ‘e’ in Figure 4-28 that displays the scene details.
e
c
a
b
d
Figure 4-28 Search Results panel and Scene Details display panel (zoomed-in figure)
Table 4-11 Items composing Search Results panel
Screen Items
Description
(a) Display settings of search
Displays the checked search results only. Confirms
results list
the data overlapped with data of selected row.
Checks the data of selected rows.
(b) Edit search results list
Adds the cart of the checked search results and
generates the file.
(c) Search results list
Displays the list of search results. Executes filter
condition and sort of search results.
(d) Highlight list
Specify the product which displays the footprint. This
is assumed to be used, when products shown in the
search results list are overlapped on the map field
and then displayed. (See Table 4-15.)
(e)
Scene
panel
Details
display
Displays the detailed information of scene selected in
the Search Results panel.
4-33
a. Search results list display method specifications
Table 4-12 Search results list display method specifications
Items
Description
Show Checked
Select this check box to display only the data of the check
boxes selected on the current search results list (Part c of
Figure 4-28) in the search results list and Map field.
Clear this check box to display the data of all search
results list.
Show Highlighted
Select this check box to display the highlighted list (Part d
of Figure 4-28) is displayed.
Clear this check box to hide the highlighted list.
Check Highlighted
Click this check box once to select all check boxes of the
selected rows of current search results list (Part c of
Figure 4-28).
Click this check box once again to clear all check boxes of
the selected rows of current search results list.
4-34
b. Cart operations
Table 4-13 Cart operations
Items
Description
It adds the product selected on the search results list (Part c
of Figure 4-28) to the cart.
An
icon is displayed in the row of product which is added
to the cart.
In case of “Disaster product search”, the button will be greyed
out. Add to cart operations cannot be used.
Search results can be output to the file. Appendix 2
File format at the time of export can be selected from
“Shape”, “KMZ” and “CSV”.
Figure 4-29 Export dialog
As regards the search results data to be output, all rows
(scene and product) displayed in the list will be output,
regardless of whether search results list (Part c of Figure
4-28) is selected or not. If you want to output the data of the
row selected in search results list, select (turn ON) the [Show
Checked] check box and then click the “Export” button.
Further, total columns of catalog will be output regardless of
column display settings of search results list.
It deletes the scenes whose the checkbox is selected from
the search results list (Part c of Figure 4-28). Products added
to the cart remain in the cart.
4-35
When a user for whom product provision is limited to Japan clicks the “
”
button, the Product select screen shown below is displayed. This screen is used to select
products in scenes in Japan among the scenes selected on the Search Results panel.
Figure 4-29 +1 Product select screen for Scenes in Japan
Note that scenes that contain no providable products cannot be selected on this
screen.
When the
button is clicked on this screen, products whose check
boxes are selected are added to the cart.
4-35+1
c. Search results list
Table 4-14 Search results list
Items
Description
It shows that products of this row are added to the cart.
(Cart icon)
In order to print the scene information etc., screen
(Display icon)
displaying the browser image and meta information of
catalogue are displayed on independent window.
Select any row from the search results list.
or
(check icon)
Information of selected row linked with other functions (a.
Search results list display method specifications b. Cart
operations of panel.)
Further, when
icon of row header is checked as
ON/OFF, all rows of search results list can be checked as
ON/OFF in group.
Disaster information
It is displayed only in “Disaster product search”.
Place, type, date, name of disaster are displayed. (Part ‘a’
of Figure 4-30)
Catalogue information
Column specified in search setting is displayed. Only in
case of disaster product search, disaster information is
displayed on priority (At the left side of display column of
catalogue information)
When topic search is performed, information (Topic Location (Country, Region), of
Occurrence Date and Time, and Topic Name) specific to topic search is displayed
(Figure 4-30).
a
Figure 4-30 Topic information display
4-36
When PRISM triplet is included in search result, scenes having same representative
direction get automatically displayed in a group (Figure 4-31).
Figure 4-31 Display of search result of PRISM triplet
d. Highlight list
Table 4-15 Highlight list
Items
Description
Show All/Hide All
Shows/hides all the browse images of the highlight list.
Show foot prints/Hide
Shows/hides all the footprints on the map field.
foot prints
Select any row of highlight list.
or
The check box of the highlight list is linked to the check
box of the search results list.
Specifies whether to display browse images on the map
or
(Browse image display
switch button)
field.
: Do not display browse images on the map field
: Display browse images on the map field
Catalog information
Displays the scene ID and observation date and time.
e. Scene detailed information panel
Catalog information of scene (or product) selected in the search results list is
displayed.
When icon
is clicked, all screens are displayed on panel. Detailed information of
scene can be printed by using the print function of browser.
4-37
5 Method to Order Product
Product added in the Cart is ordered.
Click on “Cart” from Common menu on the top of the screen to open Product Order
screen.
Figure 5-1 Common menu
5-1
5.1 Composition of Cart screen
You can confirm the products added to Cart, specify order option and place an order
through Cart screen. The cart consists of three areas, namely "Cart operation area"
shown as ‘a’ in Figure 5-2 where you can configure an order, "Product operation area"
shown as ‘b’ in Figure 5-2 where you can place an order, and "Order limit area" shown
as ‘c’ in Figure 5-2 that displays the user's order information.
a
c
b
Figure 5-2 Overall composition of Product Order screen
Table 5-1 Items composing Product Order screen
Screen Items
Description
(a) Cart operation area
It confirms and edits Cart details. It displays order count in cart.
(b) Order operation area
It carries out order procedures on the basis of details currently
entered in Cart.
(c) Order limit area
It displays the order limit information allocated to the user.
Order limit is assigned on the basis of the agreement concluded
separately. Order limit may be set for each satellite (ALOS,
ALOS-2) depending on the agreement content.
5-2
5.2 Operational overview of product order
Basic steps to order are as follows.
Add the product you want to order in Cart
(Section 4.3.3)
Set the processing parameter
(Section 5.3.1 )
Set the order option
(Section 5.3.2 )
Confirm the order
(Section 5.3.2 )
Figure 5-3 Basic steps for ordering product
5-3
① Select the check box (
) for the product you want to order from Search Results
panel.
Figure 5-4 Product order - Operational steps ①
② When you click on the
Further,
button, selected product will be added to Cart.
icon appears in row of list which shows that product is added to Cart.
Figure 5-5 Product order – Operational steps ②
When a user for whom product provision is limited to Japan clicks the
button, the Product select screen for scenes in Japan is displayed.
See section 4.3.3 for details about the Product select screen for scenes in Japan.
5-4
③ Click on “Cart” in the common header to see the current product list added to Cart.
Figure 5-6 Product order – Operational steps ③
④ For Parameter Settings, select the order you want to set and click on “Parameter
Settings”. (You can skip this step if you do not want to perform parameter settings.)
* If you skip this step, “1.5” or “1B2” is applied as the processing level.
Figure 5-7 Product order - Operational steps ④
5-5
⑤ Parameter Settings dialog appears. Select (or type) scene shift and parameter items
you want to set and confirm the settings by clicking “Update”. (You can skip this step if
you do not want to perform Parameter Settings).
* The default processing level is “1.5” or “1B2”.
Figure 5-8 Product order - Operational steps ⑤
⑥ On the completion of Parameter Settings, it returns to Product Order screen.
shown in the list indicates that parameter setting is other than default value.
Figure 5-9 Product order – Operational steps ⑥
5-6
icon
⑦ After confirming the Cart details and finishing the Parameter Settings, click on
to open Order flow.
Figure 5-10 Product order - Operational steps ⑦
⑧ After specifying the order options, click on
to move to next screen.
Figure 5-11 Product order – Operational steps ⑧
5-7
⑨ Click on
after confirming the Cart details and order options. If you click
[OK] in Confirmation dialog of final order, order is confirmed.
Figure 5-12 Product order – Operational steps ⑨
⑩ Order is complete now. Details of received order are shown in the screen. Click [Go To
Order History] or [Go To Search Window] and close the screen.
Figure 5-13 Product order - Operational steps ⑩
5-8
5.3 Description of screen
5.3.1 Cart operation area
Confirmation of details of all the products and parameter settings are performed
for the products added to Cart.
a
c
b
f
d
e
Figure 5-14 User interface of Cart operation
Table 5-2 Items composing Cart operation area
Screen Items
Description
(a) Recycle bin button
It deletes the selected products from Cart.
(b) Parameter Settings button
It performs parameter settings for the products
selected in the Cart list.
(c)
Find
Duplicate
Scene
(previous order) button
It checks the duplicate order by comparing the
products added to Cart and products ordered in the
past.
(d) Scene Shift settings
It sets the scene shift value for the products selected
in the Cart list.
(e) Cart list
It shows the list of products currently added to Cart.
When list is long, content is displayed by page break.
(f) Find Duplicate Scene (new
It checks for duplicate orders among the products
order) button
added to Cart.
5-9
a.
(Recycle bin button)
You can delete the selected products from the Cart details list. Select the product you
want to delete and click on Recycle bin icon, the corresponding product will be deleted
from Cart.
b. Parameter Settings button
Specify the parameter for all the products added in Cart.
Select the product for which you want to perform parameter settings from Cart list.
Click on “Parameter Settings” to open Parameter Settings dialog (Figure 5-15).
Items, which can be set, vary according to sensor and processing level (Appendix 1).
In case multiple rows are selected in Cart list, only the common parameters can be set
at once for all the selected rows. Processing parameter of 3 views (forward, nadir,
backward) showing same point can be simultaneously specified for ALOS PRISM.
Figure 5-15 Parameter Settings dialog (example of ALOS PRISM level 1B2 setting)
5-10
Table 5-3 Buttons in Parameter Settings dialog
Buttons
Description
Loads the pattern specified during pattern selection and
reflects it to the parameter values on the screen.
Registers a pattern by assigning a name to the values
currently set on the screen.
Deletes the pattern selected from the list of registered
user patterns.
Check box
(Enable Auto Scene
Shift)
If you select (turn ON) the check box, the amount of
shift is automatically set in “Scene Shift” boxes of
Forward
and
Backward
so
that
the
portions
overlapping the Nadir scene become the maximum.
It confirms the details of Parameter Settings dialog and
returns to Cart screen. Original order for editing is
overwritten depending on the modified processing level
and parameters.
Order is added depending on current processing level
and parameters. In such cases, original order for
editing is not overwritten.
It returns to Cart screen without saving the settings of
the current Parameter Settings dialog.
Displays the browse image together with the adjacent
scenes in order to adjust the scene shift value.
Displays the currently selected footprint of the scene on
the map.
5-11
i. Parameter Settings
For the file selected from the cart list, select a processing level and set the values of
the parameters to be displayed. The processing levels and parameter values that can
be specified vary depending on the user. The default processing level is “1.5” or “1B2”.
The setting items when processing level 1.5 is selected for ALOS-2 PALSAR2 scenes
are shown in Table 5-4.
Figure 5-15+1 Processing parameters
Table 5-4 Setting items of Parameter Settings dialog (Example of ALOS-2 PALSAR-2
Level 1.5)
Setting items
Description (Underlined text represents default value)
Resampling method
It specifies the interpolation technique.
Map projection
Nearest neighbor: Nearest Neighbor
Cubic Convolution: Cubic Convolution
Bi-Linear:
Bi-Linear
It specifies the Map projection method.
Image orientation
UTM: Universal Transverse Mercator
PS:
Polar stereo
LCC: Lambert Conformal Conic
MER: Mercator
It specifies the image orientation.
(For L1.5/L3.1)
UTM zone number
Geo-reference:Projection towards orbit
Geo-code:
Projection towards geographic coordinates
It specifies the zone number to be projected when scene
specified with Map projection “UTM” is extended in multiple
UTM Zone.
Do not specify:
Automatically decided by system
UTM zone number: Zone number specification
5-12
Setting items
Description (Underlined text represents default value)
PS standard longitude
It specifies longitude which becomes standard when Map
projection “PS” is specified.
LCC standard latitude
Do not specify:
Automatically decided by system
Longitude specification: (-179.999°~180.000°)
It specifies latitude which becomes standard when Map
projection “LCC” is specified.
Do not specify: Automatically decided by system
Latitude specification 1 and latitude specification 2
: When Scene center latitude is northern hemisphere
(0.000°≦ b < x < a < 90.000°)
: When Scene center latitude is southern hemisphere
(-90.000°≦ a < x < b < 0.000°)
* a and b represent standard latitude 1 and standard latitude
2.
* x is scene center latitude.
LCC source latitude
It specifies latitude which becomes standard when Map
projection “LCC” has been specified.
LCC source longitude
Latitude specification : (-90.000°~90.000°)
It specifies longitude which becomes standard when Map
projection “LCC” has been specified.
Orbit accuracy
Longitude specification : (-179.999°~180.000°)
Method to decide precision orbit data to be used
Scene shift
Most Accurate and Available
High precision orbit information
It specifies scene shift volume.
Scene shift volume specification : (-5~0~4)
Format
It specifies the file format used at the time of providing. (Note
that some formats might not be available for some users.)
CEOS
GeoTIFF
JPEG
GeoPDF
5-13
ii. Processing Algorithm Version
Select the version of the processing software for the satellite/sensor/processing level
from the pull-down menu. (This feature is available only for some authorized users.)
iii. Visual examination
When producing products, operators are requested to carry out quality check through
visual examination. (This feature is available only for some authorized users.)
iv. PRISM Triplet Order Parameter Settings
These parameters can be batch set if PRISM triplet indicating the same scene
position has been registered to the cart. Moreover, by selecting the check box(es) of
the scenes to be ordered from the three views (for example, forward view only), it is
possible to order only the required scene from the PRISM triplet set.
Figure 5-16 Order parameters setting of ALOS PRISM triplet
If the “Enable Auto Scene Shift” check box is selected, the amount of shift
is
automatically set in the “Scene Shift” boxes of Forward and Backward so that the
portions overlapping the Nadir scene become the maximum.
5-13+1
v. Processing Parameters Pattern Registration
The combination of processing parameters selected according to the sensor,
processing level, etc., and their values can be saved under a given name as a
processing parameters pattern. The value settings of the parameters can be restored
by loading the saved patterns. In addition to the patterns registered by the users,
default and recommended patterns are available.
vi. Switching Between Browse Display and Map Display
By selecting the “Browse Image” and “Map” option buttons, it is possible to switch
between the browse display screen showing the currently selected scene along with
the browse images (Figure 5-16+1), and the map display screen showing the footprint
on the map (Figure 5-16+2).
The overlapping status of the PRISM triplet can be checked on the map by using the
map display screen.
Figure 5-16+1 Browse display parameter settings dialog box
5-13+2
Figure 5-16+2 Map display parameter settings dialog box
5-13+3
c. Find Duplication Scene (previous order) button
It checks the order history. If purchase record of same Scene ID exists, it highlights the
corresponding data row of same Scene ID.
d. Scene shift settings
It specifies the scene shift volume. You can specify the scene shift volume from the
“Scene Shift” pull-down list by selecting the product for which you want to set scene
shift from Cart list.
e. Cart list
It displays the list of the scenes (or products) currently added to Cart. When number of
scenes (or products) added to Cart is more, page feeding is displayed at the bottom
right of list, because number of scenes are displayed by filtering the number of rows to
be displayed at once.
Table 5-5 Cart list display items
#
Items
#
Items
1
Product information details display
2
Satellite icon
button
3
No.
4
Settings icon
5
Order details ID
6
Satellite
7
Sensor
8
Scene ID
9
Processing level
10
Format
11
Map projection
12
Path
13
Frame
14
Scene shift
15
Image orientation
16
Pixel size
17
Central latitude
18
Resampling
19
UTM zone
20
Map orientation
21
Orbit precision
22
Posture accuracy
23
Catalog ID
24
Upper left latitude
25
Upper left longitude
26
Upper right latitude
27
Upper right longitude
28
Lower left latitude
29
Lower left longitude
30
Lower right latitude
31
Lower right longitude
-
f.
Find Duplicate Scene (new order) button
It checks the orders for the products added in Cart list. If purchase records that have
the same scene ID, processing level, and processing parameter are found, the
corresponding data rows are highlighted.
5-14
5.3.2 Order operation area
It specifies the order method and then place an order.
Figure 5-17 Buttons of Order operation area
When you click the
button, order flow starts.
Order flow has 3 steps as mentioned below.
Step.1
Step.2
Step.3
Order option specification
Confirmation of Order Contents
Order
5-15
Step.1 Order option specification
In this screen, order option is specified. Order options such as Provision method and
Delivery address are specified in the Order Options.
Click the
button to move to “Step.2 Order confirmation”.
Figure 5-18 Order option dialog
Table 5-6 Button of Order option dialog
Button
Description
It navigates screen to Order details confirmation dialog.
Order flow is stopped, returns to Cart screen.
Cart details are not deleted.
5-16
Table 5-7 Set-up items in Order option
Items
Description (Underlined text represents default value)
Provision Method
It specifies method for obtaining ordered product. (The
provision methods indicated by “*” can only be used by
limited users.)
Download
HTTPS: Manual downloads through browser etc.
HTTP:
(Same as above)
SFTP:
Manual downloads through FTP tool etc.*
FTP:
(Same as above)*
File Transfer*
SFTP, M-Put, M-Get: It automatically forwards to
FTP server registered in advance.
Delivery*
DVD Output Media
Password Protection
2
Wide Format Printing
Specify whether to password protect or not the providing
file.
On: Password protect
345
Providing in Parts
Off: Not password protected
Specify whether to individually order the products in the
Cart.
Selected: Products currently added to the Cart are
ordered by splitting it as one order per
product. It is enabled when you want to
make the receiving faster even a little bit.
Cleared: Products currently added to the Cart are
ordered as one order. All the products can
be downloaded from the moment providing
has become possible.
2
Password to be set is shown in AUIG2 after placing the order.
Product receiving (such as download) is performed per order. If two or more products are
included in one order, it may take some time to receive the product. It is possible to make
the receiving faster for the products which can be downloaded individually by dividing
multiple products into one order.
4
Maximum file size for one order is defined separately. Split order has to be performed for
the order of file size exceeding the maximum limit.
5
If this check box is selected, one product is provided for each order irrespective of the
provision method.
3
5-17
Items
Description (Underlined text represents default value)
Production Request
Select whether to make the production type of an order
Type
the normal type or disaster type. (This feature is available
only for some authorized users.).
Normal Production Request:
Specify this option to perform normal production
processing.
Production Request for a disaster:
Specify this option only when placing order as a
disaster product.
5-17+1
Step.2 Confirmation of Order Contents
In this screen, confirmation of order details (Cart details, parameter settings, order option)
is performed.
Click the
button for confirming the order process. You can check the result
of Order confirmation process from the screen of “Step.3 Order”.
Figure 5-19 Order confirmation dialog
Table 5-8 Buttons of Order option dialog
Buttons
Description
It confirms the order. (If you click “OK” in confirmation
dialog, displayed after clicking this button, then order is
confirmed)
It returns to previous dialog (Order option).
5-18
Step.3 Order
It confirms order. If you click the “Order” button, dialog to confirm order is displayed. If you
click the “OK” button of dialog, order is confirmed and Order Receiving Result is displayed.
Order Receiving Result can also be notified via mail. (Appendix 3)
Please note that confirmed order cannot be changed. If it is required to change, you may
have to place order again by cancelling the current order (Refer to Table 6-6 in Chapter 6
).
Figure 5-20 Confirmation dialog before order
Figure 5-21 Order Receiving Result dialog
Table 5-9 Buttons of Order Receiving Result dialog
Buttons
Description
Moves to Order History screen.
Moves to Product Search screen.
5-19
5.3.3 Order limit area
You can check the information of order limit allocated to yourself. Order limit is
managed for each user. Order limit may be managed for each satellite (ALOS,
ALOS-2) depending on the agreement content of AUIG2.
a
b
c
d
e
Figure 5-22 Display area of “Order limit” in Cart screen (Enlarged view)
Table 5-10 Items of Order limit area
Screen Items
Description
(a) Satellite Name
Name of the satellite for which the order is placed
(b) Order Limit (A)
Order limit value assigned on the basis of the agreement
(c) Ordered product count (B)
Value which is calculated by Ordered product count
tabulation function
(d) Remaining Order limit (A-B)
(Order count maximum limit – Ordered product count)
(e) Number of items in the Cart
Number of products added to the Cart currently.
5-20
6 Method to Receive Product
This chapter explains the method to receive the ordered product.
From Order History screen, you can open Product Receiving screen.
Select “Order History” from Common menu at the top of the screen to open Order
History screen.
Figure 6-1 Common menu
6-1
6.1 Composition of Order History screen
This screen consists of three areas, “Order history filter” shown as ‘a’ in Figure 6-2 for
filtering order information to be displayed, “Order history list” shown as ‘b’ in Figure 6-2
for displaying order information in list, and “Order limit information” shown as ‘c’ in
Figure 6-2 for displaying order limit information.
a
b
c
Figure 6-2 Overall composition of Order History screen
Table 6-1 Items composing Order History screen
Screen Items
Description
(a) Order history filter
Filter condition can be specified for filtering the order
information to be displayed in Order history list.
(b) Order history list
Displays the order information. Select the order row to be
downloaded.
(c) Order limit information
Displays the order limit information allocated to the user
and the current ordered product count.
6-2
6.2 Operational overview of product download
Basic steps to receive the ordered product are as follows.
Confirm the order that can be downloaded
(Section 6.3.1 )
Download
(Section 6.3.2 )
Figure 6-3 Basic steps for receiving product
6-3
i.
To
narrow
down
the
downloadable
orders,
select
“Downloadable/FTP
transferred/Delivery arrangements complete” from of the Order Status list on the
Order History screen, and then click the
button.
(Order information can also be narrowed down by Order ID and Order Date.)
Figure 6-4 Product receiving – Operational steps ①
6-4
ii.
Select the product you want to download and click
icon.
Figure 6-5 Product receiving - Operational steps ②
6-5
iii.
Confirm the order details and click the HTTPS button.
Figure 6-6 Product receiving – Operational steps ③
6-6
iv.
Click the
button in the “File Download” dialog and download the file.
Figure 6-7 Product receiving - Operational steps ④
6-7
6.3 Description of screen
6.3.1 Order History list
You can confirm the history of all the products ordered so far.
a
b
c
d
Figure 6-8 Order History list
6-8
Table 6-2 Items composing Order History list
Screen Items
Description
(a) Order history filter
It filters the order information to be displayed in the
order history list by specifying the Order ID, Order
Status and Order Date (Period).
(b) Order history list
It displays the order history matching with the filter
conditions set in the list filter.
(c) Link for downloading
Link for obtaining the downloadable products that
were ordered (only if you specified downloading as
the delivery method)
(d) Order limit information
It displays the order limit information allocated to the
user and the current ordered product count.
Order limit is assigned on the basis of the agreement
concluded separately. Order limit may be set for
each satellite (ALOS, ALOS-2) depending on the
agreement content.
6-9
a. Order history filter
You can set the filter condition for the order information to be displayed in order history
list.
Order ID
Specify Order ID for the order you want to be displayed.
Order Status
Specify the status of order.
Table 6-3 List of statuses that can be selected
Status
Description
All
Filtering is not performed as per the status.
Order received
Status showing that order has received
Waiting for observation plan draft
Status when observation plan draft for more than one
order details is awaited
Observation plan draft completed
Status when observation plan draft is completed for
all the order details or status after that
Uplink completed
Status when the observation plan was sent to the
satellite for all the Order details or status there after
L0 data creation completed
Status when L0 data is created for all the Order
details or status there after
Waiting for product generation
Status when product generation for more than one
Order details is awaited
Product generation in progress
Status when product generation is in progress for all
the Order details or status after that
Providing-in-progress(Generation
Status when product generation is completed for all
completed)
the order details or status there after
Downloadable
(Manual providing via online)
Status when preparation for providing the product is
completed and providing is possible
FTP transmission completed
(Automatic providing via online)
Status when preparation for providing product and
transmission of data, which is beforehand requested
to FTP server, are completed
Delivery arrangement completed
(Providing via online)
6-10
Status
Description
Status when preparation for providing the product
and delivery arrangement are completed
Providing period ended
Status when providing period for product has passed
Order cancelled
Status when user has cancelled the order
Observation request rejected
Status when an observation request has been
rejected and the order has been cancelled
Observation plan cancelled
Status when an observation plan has been cancelled
and the order has been cancelled
Error confirmation in progress
Status when an error (See Table 6-4) has occurred in
(Product generation error)
more than one order details and solution is waited
from operator, etc.
Error confirmation in progress
Status when providing preparation error has occurred
(Providing preparation error)
in more than one Order details and solution is waited
from operator, etc.
Providing cancelled
Status when providing has cancelled for all the Order
details due to some reason and due to circumstances
there is no product to be provided
Providing
cancelled
action)
(Operator Status
when
providing
has
cancelled
through
operator
Order Date
Specify the order date as a period (From ~ To).
This item can be enabled as a search condition by selecting the check box (
).
Sensor
Specify the name of the sensor included in the order.
OBS Date
Specify the observation date for the scene included in the order as a period (From
~ To).
This item can be enabled as a search condition by selecting the check box (
6-11
).
b. Order history list
It displays the information of orders placed so far in the list. In case condition is set in
the order history filter, only the order information matching with the filter condition is
displayed.
The display items in the order history list are shown in Table 6-3+1.
Table 6-3+1 Display items in order history list
Item
Description
No.
Number of orders
Details
Order details display icon
Order ID
10-digit ID
Order Date
Date when order was received by AUIG2
Order Status
Current order status
Status Update Date Time (UTC)
Date and time when order status was
updated
Product Count
Number of products included in order
Providing Method
Providing method of product
Password Protection
Availability of password protection for
product
Order Schedule Date
Order schedule date of product
Available Till
Last available date for product
Demander
Self Order or Agent Order
When provision method is download (HTTP, HTTPS, FTP, SFTP), it is possible to
download ordered product (see 6.4 for details) by clicking on the link (shown as ‘c’ in
Figure 6-8).
The details of ‘Order Status’ in the order history list are the same as those in the order
history filter. See Table 6-3 for details.
Furthermore, status is notified via mail as per the order status (Appendix 3).
Table 6-4 (Deleted)
6-12
Transition in order status (in normal case), when provision method in Order Options is
download (HTTP, HTTPS, FTP, SFTP), is shown in the below mentioned figures
(Figure 6-9).
User operation
User screen
Product Order
AUIG2
Receive order
Order receiving completed
Waiting for creation
Waiting for product generation
Creation in- progress
Product generation in- progress
Creation completed
Providing preparation in-progress
(generation is completed)
Providing preparation
completed
Downloadable
Download
Providing completed
Providing period ended
Providing period ended
Figure 6-9 Order status transition targeting archive
6-13
Transition in order status at the time of cancelling observation plan is shown in below
mentioned figure. Besides this, there is also another pattern for the observation request
cancellation.
User operation
User screen
Product Order
AUIG2
Receive order
Order received
Waiting for Observation
request draft
Waiting for
Observation request
draft
Observation plan draft completed
Observation plan draft completed
Observation plan cancelled
Observation plan cancelled
Order cancelled
Figure 6-10 Transition in order status at the time of observation plan cancellation
6-14
c. Order limit area
The order limit information allocated to the user and the current ordered product count
can be checked. Order limits are managed for each user, and order limits may also be
managed for each satellite (ALOS, ALOS-2) depending on the content of the AUIG2
agreement. The items displayed in the order limit area are shown in Figure 6-10+1
and Table 6-4+1.
Figure 6-10+1 Composition of order limit area
Table 6-4+1 Items composing order limit area
Screen Items
Description
(a) Satellite Name
Name of the satellite for which the order is placed
(b) Order Limit (A)
Order limit value assigned on the basis of agreement
(c) Ordered product count (B)
Value which is calculated by Ordered product count
tabulation function
(d) Remaining Order limit (A-B)
(Order count maximum limit Ordered product count)
6-14+1
6.3.2 Order details list
It displays the details of order.
a
b
c
Figure 6-11 Order details list
Table 6-5 Items composing order details list
Screen Items
Description
(a) Order information
It displays the order information (Order ID, Order Date, Order
Status, Status Update Date and Time, Product Count, Providing
Method, Providing Limit).
It displays the production status of product included in order
separately.
It displays the status of delivery procedure when ordered
products are provided through delivery.
(b) Order details
(c) Delivery status
6-15
Table 6-6 Buttons and Link of Order details list
Screen Items
Description
HTTPS (Download)
It downloads the product. (Refer to 6.4 and Appendix 2 for
details.)
It cancels the order. Either all orders or detail wise order can be
cancelled. Product having “Before starting production process”
status (from “Order received” to “L0 data creation completed”)
can only be cancelled.
It places an order similar to the current order in the Cart.
It displays the production process work result codes and detailed
reasons.
It separately downloads the files contained in the product zip file.
Split download
6-15+1
Table 6-7 (a) Items displayed in Order information
#
Items
1
No.
2
Order ID
3
Order Date
4
Order Status
5
Status Update Date Time (UTC)
6
Product Count
7
Providing Method
8
Password Protection
9
Password
10
Planned Providing Date
11
Available Till
12
Requester
13
Reason for not providing
Table 6-8 (b) Items displayed in Order details
#
Items
#
Items
1
Product information details display icon
2
Satellite icon
3
No.
4
Order Particular ID
5
Product ID
6
Satellite
7
Sensor
8
Scene ID
9
Operation Mode
10
Orbit Direction
11
Observation Direction
12
Capturing date
13
Sensor Direction
14
Processing Level 0
15
Processing Level
16
Process Status
17
Format
18
Provided scheduled date
19
Processing status update date and time 20
Map Projection
(UTC)
21
Path
22
Frame
23
Scene Shift
24
Image Orientation
25
Pixel Size
26
Center Lat
27
Center Lon
28
Resampling
29
UTM Zone
30
Map Direction
31
Orbit Accuracy
32
Attitude Accuracy
33
Production results (details display button)
34
Cancel Order (order cancel button)
6-16
The processing status in Order details list shows the processing statuses related to
product generation, from “Order received” to “Product generation completed”. (See
Table 6-9 and Figure 6-11.)
Table 6-9 List of processing status displayed in Order details list
Processing status
Description
Order received
Status showing that order has been received
Waiting for Observation plan Status when observation plan draft is awaited for the
draft
corresponding order details
Observation plan draft
Status when observation plan draft is completed for the
completed
corresponding order details
Uplink completed
Status when uplink is done for the corresponding order
details
L0 data creation completed
Status when LO data is created for the corresponding order
details
Waiting for product
Status when product generation is awaited for the
generation
corresponding order details
Product generation in
Status when product generation is in progress for the
progress
corresponding order details
Product generation
Status when product generation is completed for the
completed
corresponding order details
Downloadable
Status when the corresponding order details can be
downloaded
Providing period ended
Status when the providing period for the corresponding
order details has expired
Product generation error
Status when an error has occurred in product generation of
(Checking)
the corresponding order details and action, etc., is being
taken by operator
Providing cancelled
Status when observation request is rejected and product
(Observation request
providing is not possible for the corresponding order details
rejected)
Providing cancelled
Status when observation plan is cancelled and product
(Observation plan cancelled) providing is not possible for the corresponding order details
Providing cancelled
Status when providing has been cancelled due to
(Operator action)
operations of operator which is the result of action taken for
error in product generation and providing preparation
Providing cancelled (other)
Status when provision of the corresponding order details
has been cancelled by the operator
6-17
You can display the work result code and detailed reason by clicking the
button under “Production results” in the order details list.
Split download
Figure 6-11+1 Detailed reasons of product results
The
button becomes available when product generation
processing has been completed or when provisioning has been cancelled due to
visual examination in progress or occurrence of an error.
Table 6-9+1 shows a list of messages displayed for production results.
6-17+1
Table 6-9+1 Detailed reasons for production results
Work result
code
Description
00
Process has been completed successfully
01
Process has been completed successfully
04
Process has been completed except Rough DEM Correction.
05
Process has been completed, but there may have occurred error
caused by error in the part of time data.
09
Producing of PALSAR Browse Data was completed successfully
10
Because processed data are poor quality, we can not provide the data.
11
Because processed data include correction data, we can not provide
the data.
20
Because processed data are poor quality, we can not provide the data.
30
Because processed data of PALSAR L1.0 are poor quality, we can not
provide the data.
40
Producing of PSR Browse Data has failed
60
Because Level 0 data are not enough amount for process, we cannot
provide the data.
61
Because there are no Orbit Data, we cannot provide the data.
62
Because there are no Precision Orbit Data specified, we cannot provide
the data.
In case specifying the most high accurate orbit data, we may provide
the data.
63
Because there is no Coordinates Conversion Matrix, we cannot provide
the data.
64
Because there are no Precision Attitude Data specified, we cannot
provide the data.
In case specifying the most high precision attitude data, we may provide
the data.
65
Because there is no Time Difference Information, we cannot provide the
data.
66
Because there are no Attitude Level 0 Data, we cannot provide the data.
67
Because producing of High Frequency Attitude Data has failed, we
cannot provide the data.
68
Because process has failed due to data error, we cannot provide the
data.
80
Because process has failed due to data error, we cannot provide the
data.
6-17+2
Work result
code
Description
90
Under conducting visual inspection
91
Under conducting visual inspection
92
Because process has failed due to data error, we cannot provide the
data.
You can display a list of the files contained in the zip file of the product to be provided by
clicking the
Split download
button under “Providing in Parts” in the order details list.
Figure 6-11+2 List of split downloadable files
Any file can be downloaded separately by clicking the file name on the list.
In the case of split download, the corresponding files are downloaded without being
compressed in a zip file.
The
Split download
button is available if a PALSAR-2 product can be downloaded (only
when a Download option button (HTTPS, SFTP, HTTP, or FTP) is selected for Provision
Method).
6-17+3
6.4 File structure provided by AUIG2
Product provided by AUIG2 is compressed in one ZIP file.
Structure of ZIP file is shown in the image given below.
{Order ID}.zip
KML file (*1) of all orders (Order ID unit)
{Order ID}_{Order Details ID}_{Scene ID}.zip
KML file (*1) of individual scenes (Order Details ID unit)
(File set of ordered product) (*2)
Figure 6-12 Structure of ZIP file provided by AUIG2
(*1) KML file is provided only when product of Table 6-10 given below is ordered.
Table 6-10 KML output target product
Satellite
Sensor
Product Level
ALOS-2
PALSAR-2
1.5, 2.1, 3.1
AVNIR-2
1A, 1B1, 1B2
PRISM
1A, 1B1, 1B2
PALSAR
1.5
ALOS
(*2) Refer to “Product Format Description” for details of file structure of product.
File names of KML files that are provided are shown in Table 6-11 given below.
Table 6-11 File name of KML file
File
File Name
KML file of all orders
{Order ID}.kml
KML file of individual scene
{Scene ID} – {Product ID}.kml
6-18
Display content of KML file is explained.
Image of order wise KML file as displayed in Google Earth is shown in Figure 6-13.
Display image of scene wise KML file is also the same.
Figure 6-13 KML display image
Content displayed on Google Earth is shown below.
a. Observation scene on map
Scene is displayed in rectangular shape with translucent outline.
b. Displayed content of “Places” folder
Folder tree is created and displayed in below structure under “Temporary
Places” node.
Order ID
Scene
Select polygon for scene display.
Mark
Select mark to display Scene ID.
6-19
c. Scene observation information display
If you click the scene, observation information of that scene is displayed in
the call-out. Content displayed in call-out is shown in Table 6-12. Call-out
display image when Google Earth is used is shown in Figure 6-14.
Table 6-12 Scene items displayed in call-out
Title
Content
Display Format
Satellite
Satellite Name
Character String of Satellite
Remarks
Name in English
Sensor
Sensor Name
Character String of Sensor
Name
SceneId
Scene ID
Character String of Scene ID
ProductId
Product ID
Character String of Product ID
Observation Date
Observation Date
YYYY-MM-DD
Path No
Path Number
Path Number
Frame (center)
Center Frame Number
0 – 7199
Offnadir Angle
Off nadir Angle
99.9
[Degree]
Only
PALSAR-2/PALSAR
Incidence Angle
Incidence Angle
±9.9 (*1)
[Degree] Only PRISM.
Pointing Angle
Pointing Angle
±99.9
[Degree] Only AVNIR-2
Scene Time (Center)
Scene Center Date and
YYYY-MM-DD hh:m:ss
Time
Scene Time (Start)
Scene Start Date and
YYYY-MM-DD hh:m:ss
Time
Scene Time (End)
Scene End Date and
YYYY-MM-DD hh:m:ss
Time
Lat/Long (center)
Scene
Center
±99.999/±999.999
[Degree]
±99.999/±999.999
[Degree]
±99.999/±999.999
[Degree]
±99.999/±999.999
[Degree]
±99.999/±999.999
[Degree]
Latitude/Longitude
Lat/Long (Left Upper)
Scene
Left
Upper
Latitude/Longitude
Lat/Long (Right Upper)
Scene
Right
Upper
Latitude/Longitude
Lat/Long (Left Lower)
Scene
Left
Lower
Latitude/Longitude
Lat/Long (Right Lower)
Scene
Right
Lower
Latitude/Longitude
(*1) + Symbol is hidden. (Other items are also the same)
6-20
Figure 6-14 Scene information display image
6-21
7 Method to Display Observation Plan List
This chapter describes the screen operations for displaying the observation plans as a
list.
List display of observation plans can be done from Observation Plan screen on
Observation screen.
Observation Plan screen is displayed by selecting “Obs. Plan” from Observation Screen
menu in the upper part of this screen.
Figure 7-1 Observation Screen menu
7-1
7.1 Composition of Observation Plan screen
Observation Plan screen is composed of the following 4 parts.
Observation plan operation panel
Map field
List of fields
Details field
The overall composition of Observation Plan screen has been given in Figure 7-2.
Items that form Observation Plan screen are given in Table 7-1.
(d)
(a)
(b)
(c)
Figure 7-2 Overall composition of Observation Plan screen
7-2
Table 7-1 Items composing Observation Plan screen
NO.
a
Screen Items
Description
Remarks
Observation plan
Input parameter items required for
operation panel
searching observation plans are
displayed.
b
Map field
A rectangular box is displayed when
an observation plan or a map display
is selected.
c
List of fields
List of observation plans, found by
searching the observation plan are
displayed.
d
Details field
Detailed information is shown for the
observation plan that is selected in
the observation plan list.
7-3
Panel/field operation
With the exception of the map field in Table 7-1, the following operations can be
performed for panels and fields.
Moving panels/fields
Resizing panels/fields
Showing/hiding(Iconizing) panels/fields
(i)
Moving panels/fields
You can move a panel/field by dragging the title bar of panel/field with the mouse.
A panel/field can be moved by dragging the
title bar.
Figure 7-2+1 Moving a panel/field on Obs. plan search screen
7-3+1
To add a panel/field pulled out from the screen to the top, bottom, left, or right of the
screen, drag it to the desired position as shown in Figure 7-2+2 with the mouse and
then release the mouse. The panel/field will be moved to the location thus specified.
Drag a panel/field to the desired
position and then release the
mouse to move the panel/field to
the specified location.
Figure 7-2+2 Adding a panel/field on Obs. plan search screen
(ii) Resizing panels/fields
You can resize a panel/field by dragging the outer frame of the panel/field either
inside or out with the mouse.
Drag the outer frame of the
panel/field either inside or out with
the mouse to resize it.
Figure 7-2+3 Resizing a panel/field on Obs. plan search screen
7-3+2
(iii) Showing/hiding (iconizing) panels/fields
You can iconize (hide) a panel/field by clicking
at the upper right of the
panel/field and its icon is displayed at the top, bottom, left or right side of the screen.
To show again the iconized panel/field, click its icon.
The iconized panel/field is displayed at the top,
bottom, left or right of the screen as an icon.
Click the icon to deiconize it.
Figure 7-2+4 Iconizing panel/field on Obs. plan search screen
7-3+3
7.2 Observation Plan screen – Operational overview
Table 7-2 describes the steps for displaying observation plans in a list form.
Table 7-2 Steps for list display of observation plans
Steps
Operations Overview
Related fields
Description
given in
1
2
Select ‘Observation Plan search’ in
Observation plan operation
Observation plan operation panel.
panel
Enter the search conditions for
Observation plan operation
Observation plan search.
panel
Section 7.2.1
Section 7.2.2
Map
3
Check the list of Observation plans.
Observation plan list
Map
Detail Information
7-4
Section 7.2.3
7.2.1 Select ‘Observation Plan Search’ in Observation plan operation panel
In order to display a list of observation plans, select either “s. search” or “ad.
search” tab in the Observation plan operation panel.
An example when the “ad. search” tab is selected in the Observation plan
operation panel is described below.
① Select “ad. search” in the Observation plan
operation panel.
Figure 7-3 Observation Plan screen
7-5
7.2.2 Enter search conditions for Observation plan search
Enter search conditions in the window for entering observation plan search, and
click the “Search” button.
Figure 7-4 Observation Plan screen (ad. search tab)
7-6
7.2.3 Check the list of observation plans
When search is complete the results are shown in the observation plan list of
fields. When an Observation plan is selected from the observation plan list of
fields, the selected row is reversed.
Detailed information of the selected observation plan is shown in the details field.
Figure 7-5 Observation Plan screen (List of fields)
7-7
7.3 Description of screen
7.3.1 Observation Plan screen - Operations panel
There are two tabs provided on the Observation Plan screen for displaying
observation plans in a list form.
Users can perform Observation opportunity search for viewing observation plans.
Table 7-3 Observation plan list display – Operations panel
NO
Observation plan list
Description of Panel
Remarks
display screen
Operations panel
a
s. search
(Observation
b
Search
plan
is
implemented
where
observation time or observation area is
search (simple))
specified
ad. search
Search is implemented on specifying
(Observation
search (advance))
plan
detailed conditions or sensor-specific
conditions
7-8
(a) Observation plan search (simple)
On s. search tab, a search can be performed for Observation plans on specifying the
observation time, observation mode and search area.
Sensor
Only ALOS-2 can be specified as the satellite.
Operation mode can be specified.
Search method
Search method is specified. Only envelope format can be
specified in the Observation plan search (simple).
Search period can also be specified.
Search button
A search is implemented with the entered conditions when
Search button is clicked.
Clear button
Items entered for search conditions are cleared when the
‘Clear’ button is clicked.
Figure 7-6 s. search tab
7-9
(b) Observation plan search (advance)
On the ad. search tab, a search can be implemented for observation plans by specifying
the conditions in detail, or the sensor-specific conditions.
‘Search
condition
loading/saving’
button
Search conditions can be read and
saved.
Sensor
Only ALOS-2 can be specified as the
satellite.
Search conditions can be the input for
a search for each operation mode.
Figure 7-7 ad. search tab (1/2)
7-10
Figure 7-7 ad. search tab (2/2)
7-11
Search setting dialog
Search setting dialog is a panel for setting the display items of search result list screen
or map default display of Product Search screen.
It is displayed by clicking the
icon of the Conditions selection panel.
Figure 7-7+1 Search setting dialog
Table 7-3+1 Items composing search setting dialog
Screen Items
Description
Max Search Count
Sets the maximum number of items (1 to 5000) that can be
obtained from the search results at one time. The default
setting is 500 scenes.
Total Column List
Displays the list of column items that can be displayed in
(See Table 7-3+2)
Search Results panel. All the items registered in the database
are displayed.
Display Column List
Sets the column items displayed in the Search Results panel.
(See Table 7-3+2)
The items to be displayed are selected from “Total Column
List” and added by clicking
. Items that are not required
can be returned to “Total Column List” by clicking
.
Selected items can be moved up and down by dragging them
with the mouse.
Sensor operating segment ID, Satellite name, Sensor type,
Obs. table type, Obs. mode, Polarization, Obs. direction,
7-11+1
Screen Items
Description
Beam No., Off nadir angle, Roll angle, Fly direction, Obs. ID,
Obs. start total round number, Obs. start latitude argument,
Obs. end total round number, and Obs. end latitude argument
are displayed by default.
Sorting Order
Specifies the ascending and descending order and key used
for sorting the display items. Select the items used for sorting
from “Display Column List”, and add them by clicking
.
The items that do not need to be sorted can be excluded from
sorting by clicking
. Selected items can be moved up and
down the list by dragging them with the mouse.
OK button
Clicking the “OK” button applies the set content to the system
and closes the dialog.
Cancel button
Clicking the “Cancel” button discards the set content and
closes the dialog.
Restore Default button
Clicking the “Restore Default” button returns the set value to
its default value.
Table 7-3+2 Display items of Total Column List and Display Column list
#
Item
#
Item
1
Sensor operating segment ID
2
Satellite name
3
Sensor type
4
Obs. table type
5
Obs. mode
6
Polarization
7
Obs. direction
8
Beam No.
9
Off nadir angle
10
Roll angle
11
Fly direction
12
Obs. ID
13
Obs. start total round number
14
Obs. start latitude argument
15
Obs. end total round number
16
Obs. end latitude argument
17
Obs. start time
18
Obs. end time
19
Obs. center position X
20
Obs. center position Y
21
Obs. center position Z
22
Obs. parameter set number
23
SAR calibration parameter
24
Availability before calibration
25
Availability after calibration
-
7-11+2
7.3.2 Map field
Map field is an area where map data or satellite image data is displayed in the
background image.
In the map field, rectangular boxes are displayed corresponding to the terrain of
observation plan that includes search results and search method. A slider for
changing the scale or direction of the map and a toolbar for moving the map or
selecting the search area are given in the map field.
Figure 7-8 Map field
7-12
How to change the search area on the map
Follow the procedure below to change the search area on the map.
(a) Move the cursor to any place within the search area, and then double-click the mouse.
The search area enters the edit mode (the line changes to a broken line).
Double-click
any
place
within the search area to
set the edit mode.
Figure 7-8+1 Map field (changing the search area to edit mode)
7-12+1
(b) Edit the search area in edit mode.
Click any place within the search area and drag it to move its position.
Click a corner of the search area (
) and drag it to change its size.
The search area can be
moved and resized in edit
mode.
Figure 7-8+2 Map field (moving/resizing the search area)
7-12+2
(c) After editing the search area, click any place on the map field to complete editing (the
search area line changes to a solid line).
If the “Search” button on the operation panel is clicked while the search area is in edit
mode, a search is executed for the search area selected at that time, not the area
selected prior to entering edit mode.
The area to be edited is
selected by clicking any
place on the map field.
Figure 7-8+3 Map field (determining the search area)
7-12+3
7.3.3 List of fields
The list of fields displays the result of observation plan in a list when observation
plan are searched.
All the search results can be selected and deselected at one time by using the
check boxes directly under “Show” and “Delete Target”, respectively.
Figure 7-9 Observation plan - List of fields (1/2)
Figure 7-9 Observation plan - List of fields (2/2)
* Refer to ‘Appendix 5 List 08_01_Observation Plan’ for the possible values for each item
of the observation plan - List of fields.
7-13
Deleting items from the Observation plan list
You can delete observation plans whose deletion checkbox (on the left of each record)
you have selected by clicking the
icon at the upper right of the list field.
Select the check box of the
search result to be deleted.
Click the
icon to delete
the selected search results.
Figure 7-9+1 Deleting search results on Observation plan list field
7-13+1
7.3.4 Details field
Details field is a panel for displaying details of the information selected in the list
of fields.
When observation plan list is displayed in the list of fields, detailed information will
be displayed of the selected observation plan.
Figure 7-10 Observation plan - Details field (1/3)
Figure 7-10 Observation plan - Details field (2/3)
7-14
Figure 7-10 Observation plan - Details field (3/3)
* Refer to ‘Appendix 5 List 08_01_Observation Plan’ for the possible values for each item
of the observation plan - Details field.
7-15
Appendix 1 Order parameters setting list
The values which can be set as per each sensor and level in parameters setting are given as below.
Satellite
Sensor
Processing
name
name
level
Processing parameter
Items
Remarks
Radio button
ALOS
PRISM
1A (1.0)
Orbit Accuracy
▪ Most Accurate and Available (default)
▪ Precision Orbit Data
Radio button
Appendix1-1
▪ Most Accurate and Available (default)
Attitude Accuracy
▪ High Frequency Attitude Data
▪ Precision Attitude Data
Scene shift volume
-2 ~ 2
Radio button
1B1 (1.1)
Orbit Accuracy
▪ Most Accurate and Available (default)
▪ Precision Orbit Data
Radio button
▪ Most Accurate and Available (default)
Attitude Accuracy
▪ High Frequency Attitude Data
▪ Precision Attitude Data
Scene shift volume
-2 ~ 2
Radio button
1B2 (1.5)
■ The items on left side refer to the following methods
Resampling method
▪ CC (default)
▪ CC = Cubic convolution method
Satellite
Sensor
Processing
name
name
level
Processing parameter
Items
Remarks
▪ NN
▪ NN = Nearest neighbor method
▪ BL
▪ BL = Bilinear method
Regarding rough DEM correction
Radio button
Since rough DEM correction is processed by using 50m mesh digital
▪ Geo-reference
elevation data of Geospatial Information Authority of Japan, it is valid
Image Orientation
▪ Geo-coded (default)
only for the vicinity of Japan. Therefore, if the area is other than the
▪ Geo-reference (Rough DEM correction) (default)
vicinity of Japan or if any other trouble has occurred, the product will be
▪ Geo-coded (Rough DEM correction)
Appendix1-2
created without rough DEM correction.
Radio button
This item appears only when “Geo-coded (Rough DEM correction)” or
Map direction
▪ Map North (default)
“Geo-coded” is selected in “Image Orientation”
▪ True North
Radio button
UTM can be selected only when center of latitude on selected scene is
Map projection
▪ UTM (default)
within the range of -85.000°~85.000°
▪ PS
▪ This item appears only when
“UTM” is selected in “Map projection”
Radio button
▪ Zone number has range and it varies by the area
UTM zone number
▪ Zone number at the center of scene (default)
▪ Value in the permissible range is entered in the spin box. Numbers
▪ Specify UTM zone number (→Enter)
cannot be specified beyond the range.
▪ Don’t specify (default)
This item appears only when PS is selected in “Map projection”
PS standard latitude
▪ -90.000° ~ 90.000° (Absolute value)
PS standard longitude
▪ Don’t specify (default)
(Same as above)
Satellite
Sensor
Processing
name
name
level
Processing parameter
Items
▪ -179.999° ~ 180.000°
Radio button
Orbit Accuracy
▪ Most Accurate and Available (default)
▪ Precision Orbit Data
Radio button
▪Most Accurate and Available (default)
Attitude Accuracy
▪ High Frequency Attitude Data
Appendix1-3
▪ Precision Attitude Data
Scene shift volume
-2 ~ 2
Radio button
AVNIR-2
1A (1.0)
Orbit Accuracy
▪ Most Accurate and Available (default)
▪ Precision Orbit Data
Radio button
Attitude Accuracy
▪ Most Accurate and Available (default)
▪ Precision Attitude Data
Scene shift volume
-5 ~ 4
Radio button
1B1 (1.1)
Orbit Accuracy
▪ Most Accurate and Available (default)
▪ Precision Orbit Data
Radio button
Attitude Accuracy
▪ Most Accurate and Available (default)
Remarks
Satellite
Sensor
Processing
name
name
level
Processing parameter
Items
Remarks
▪ Precision Attitude Data
Scene shift volume
-5 ~ 4
Radio button
1B2 (1.5)
The items on left side refer to the following methods
▪ CC (default)
▪ CC = Cubic convolution method
▪ NN
▪ NN = Nearest neighbor method
▪ BL
▪ BL = Bilinear method
Resampling method
Radio button
UTM can be selected only when center of latitude on selected scene is
Appendix1-4
Map projection
▪ UTM (default)
within the range of -85.000° ~ 85.000°
▪ PS
Radio button
▪ Geo-reference (default)
Image Orientation
▪ Geo-reference (Rough DEM correction)
▪ Geo-coded
▪ Geo-coded (Rough DEM correction)
Radio button
This item appears only when “Geo-coded (Rough DEM correction)” or
Map direction
▪ Map North (default)
“Geo-coded” is selected in “Image Orientation”.
▪ True North
Radio button
▪ 10m
There is no default value. Default value is selected after setting and
▪ 12.5m
calculating from pointing angle.
Pixel spacing
▪ 15m
Satellite
Sensor
Processing
name
name
level
Processing parameter
Items
Remarks
▪ 20m
▪ This items appears only when “UTM” is selected in “Map projection”
Radio button
▪ Zone number has range, and it varies by the area
UTM zone number
▪ Zone number at the center of scene (default)
▪ Value in the permissible range is entered in the spin box. Numbers
▪ Specify UTM zone number (→Enter)
cannot be specified beyond the range.
▪ Don’t specify(default)
This item appears only when PS is selected in “Map projection”
PS standard latitude
▪ -90.000° ~ 90.000° (Absolute value)
Appendix1-5
▪ Don’t specify (default)
PS standard longitude
(Same as above)
▪-179.999° ~ 180.000°
Radio button
Orbit Accuracy
▪ Most Accurate and Available (default)
▪ Precision Orbit Data
Radio button
Attitude Accuracy
▪ Most Accurate and Available (default)
▪ Precision Attitude Data
Scene shift volume
-5 ~ 4
Radio button
PALSAR
1.0
Orbit Accuracy
▪ Most Accurate and Available (default)
▪ Precision Orbit Data
1.1
Scene shift volume
-5 ~ 4
Orbit Accuracy
Radio button
Satellite
Sensor
Processing
name
name
level
Processing parameter
Items
Remarks
▪ Most Accurate and Available (default)
▪ Precision Orbit Data
Scene shift volume
-5 ~ 4
Radio button
1.5
■ The items on left side refer to the following methods
▪ NN
▪ CC = Cubic convolution method
▪ CC
▪ NN = Nearest neighbor method
▪ BL (default)
▪ BL = Bilinear method
Resampling method
Appendix1-6
■ UTM can be selected only when center of latitude on selected scene is
within the range of -85.000° ~ 85.000°
Map projection
Radio button
■ PS can be used only when center of latitude on selected scene is
▪ UTM (default)
within the range of-90.000° ~ 90.000° (In case of High resolution mode
▪ PS
and direct downlink mode, it should be within the range of -90.000°~
▪ LCC
-25.000, 25.000° ~ 90.000°only)
▪ MER
■ LCC
■ MER (Can be selected only when center of the latitude on the scene is
within the range of-73.000° ~ 73.000°)
Radio button
Image Orientation
▪ Geo-reference (default)
▪ Geo-coded
Radio button
This item appears only when “Geo-coded” is selected in “Image
▪ Map North (default)
Orientation”
Map direction
Satellite
Sensor
Processing
name
name
level
Processing parameter
Items
Remarks
In case Operation mode is FBS
▪ 6.25m (default)
▪ 12.5m
In case Operation mode is wide-area observation
As mentioned on left side, the content has three variations depending on
Pixel spacing
mode
the operation mode
▪ 100m (default)
In case Operation mode is other than above
Appendix1-7
mentioned modes
▪ 12.5m (default)
▪ This item appears only when “UTM” is selected in “Map projection”
Radio button
▪ Zone number has range, and it varies by the area
UTM zone number
▪ Zone number at the center of scene (default)
▪ Value in the permissible range is entered in the spin box. Numbers
▪ Specify UTM zone number (→Enter)
cannot be specified beyond the range.
▪ Don’t specify (default)
In case of high resolution mode, direct downlink
mode
PS standard latitude
▪ -90.000° ~ -25.000°, 25.000° ~ 90.000°
This item appears only when PS is selected in “Map projection”
In case of other modes
▪ 90.000° in case of northern hemisphere, and
-90.000° in case of southern hemisphere
PS standard longitude
▪ Don’t specify (default)
(Same as above)
Satellite
Sensor
Processing
name
name
level
Processing parameter
Items
Remarks
▪ -179.999° ~ 180.000°
When center of the latitude is in northern
hemisphere
0 ≦ Reference latitude 2 < Center of the latitude
LCC reference latitude line
< Reference latitude 1 < 90
This item appears only when LCC is selected in “Map projection”
1 latitude
When center of the latitude is in southern
hemisphere
Appendix1-8
-90 <Reference latitude 1 <Center of the latitude
< Reference latitude 2 < 0
LCC reference latitude line
(Same as above)
(Same as above)
LCC origin point latitude
-90.000° ~ 90.000°
(Same as above)
LCC origin point latitude
-179.999° ~ 180.000°
(Same as above)
2 latitude
Radio button
Orbit Accuracy
▪ Most Accurate and Available (default)
▪ Precision Orbit Data
Scene shift volume
-5 ~ 4
Radio button
ALOS-2
PALSAR-2
1.0
Orbit Accuracy
▪ Most Accurate and Available
▪ High precision orbit information (default)
Scene shift
-5 ~ 4
Satellite
Sensor
Processing
name
name
level
Processing parameter
Items
Remarks
Radio button
Format
▪ CEOS (default)
Radio button
1.1
Orbit Accuracy
▪ Most Accurate and Available
▪ High precision orbit information (default)
Scene shift
-5 ~ 4
Radio button
Appendix1-9
Format
▪ CEOS (default)
Only “CEOS” can be selected at the time of selecting wide-area
▪ GeoTiff
observation mode.
▪ Jpeg
“GeoPDF” selection is restricted according to user permission.
▪ GeoPDF
Radio button
Processing method
・Burst (default)
This item appears only when wide-area observation mode is selected.
・Full-Aperture
Radio button
1.5
■ The items on left side refer to the following methods
▪ NN (default)
▪ CC = Cubic convolution method
▪ CC
▪ NN = Nearest neighbor method
▪ BL
▪ BL = Bilinear method
Resampling method
Map projection
Radio button
■ UTM can be selected only when center of latitude on selected scene is
▪ UTM (default)
within the range of -85.000° ~ 85.000°
▪ PS
■ PS can be used only when center of latitude on selected scene is
Satellite
Sensor
Processing
name
name
level
Processing parameter
Items
Remarks
▪ LCC
within the range of -90.000° ~ 90.000° (In case of High resolution mode
▪ MER
and direct downlink mode, it should be within the range of -90.000° ~
-25.000, 25.000° ~ 90.000° only)
■ LCC
■ MER (Can be selected only when center of latitude on the scene is
within the range of-73.000° ~ 73.000°)
Radio button
Appendix1-10
Framing
▪ Geo-reference (default)
▪ Geo-coded
Radio button
This item appears only when “Geo-coded” is selected in “Framing”
Map direction
▪ Map (default)
▪ This item appears only when “UTM” is selected in “Map projection”
Radio button
▪ Zone number has range, and it varies by the area
UTM zone number
▪ Zone number at the center of scene (default)
▪ Range which can be set is ±1 of zone number at center of scene
▪ Specify UTM zone number (→Enter)
▪ Value of permissible limit is entered in the spin box.
Radio button
ON: PS standard is default
PS standard default
▪ PS standard is default
OFF: PS standard is not default
▪ PS standard is not default
PS standard longitude
-179.999° ~ 180.000°
Radio button
Orbit Accuracy
▪ Most Accurate and Available
This item appears only when PS is selected in “Map projection”.
Satellite
Sensor
Processing
name
name
level
Processing parameter
Items
Remarks
▪ High precision orbit information (default)
Scene shift
-5 ~ 4
Radio button
▪ CEOS (default)
Format
▪ GeoTiff
“GeoPDF” selection is restricted according to user permission.
▪ Jpeg
▪ GeoPDF
Appendix1-11
Radio button
2.1
■ The items on left side refer to the following methods
▪ NN
▪ CC = Cubic convolution method
▪ CC
▪ NN = Nearest neighbor method
▪ BL (default)
▪ BL = Bilinear method
Resampling method
■ UTM can be selected only when the center latitude of the selected
Radio button
▪ UTM (default)
scene is in the range of -83 to 83.
■ PS can be selected only when the center latitude of the selected
Map projection
▪ PS
▪ LCC
scene is in the range of -25 to 83.
■ MER/LCC can be selected only when the center latitude of the
▪ MER
selected scene is in the range of -70 to 70.
Radio button
Framing
▪ Geo-coded (default)
Radio button
This item appears only when “Geo-coded” is selected in “Framing”
Map direction
▪ Map (default)
Satellite
Sensor
Processing
name
name
level
Processing parameter
Items
Remarks
In case of spotlight mode
▪ 0.625m(*) / 1.250m / 2.500m
In case of high resolution mode (3m)
▪ 2.500m(*) / 5.000m / 10.000m
In case of high resolution mode (6m)
Pixel spacing
(*) is default value.
▪ 3.125m(*) / 6.250m / 12.500m
In case of high resolution mode (10m)
Appendix1-12
▪ 6.250m(*) / 12.500m
In case of wide-area observation
▪ 25.000m(*) / 50.000m/ 100.000m
▪ This item appears only when “UTM” is selected in “Map projection”
Radio button
▪ Zone number has range, and it varies by the area
UTM zone number
▪ Zone number at the center of scene (default)
▪ Range that can be set is ±4 of zone number at the center of scene
▪ Specify UTM zone number (→Enter)
▪ Value of permissible limit is entered in the spin box.
Radio button
ON: PS standard is default
PS standard default
▪ PS standard is default
OFF: PS standard is not default
▪ PS standard is not default
PS standard latitude
-90.000°~90.000°
This item appears only when PS is selected in “Map projection”
PS standard longitude
-179.999° ~ 180.000°
(Same as above)
Radio button
ON: LCC Reference is default
▪ LCC Reference is default
OFF: LCC Reference is not default
LCC reference longitude
Satellite
Sensor
Processing
name
name
level
Processing parameter
Items
Remarks
▪ LCC Reference is not default
When center of the latitude is in northern
hemisphere
0 ≦ Reference latitude 2 < Center of the latitude
LCC reference latitude line
< Reference latitude1 < 90
This item appears only when LCC is selected in “Map projection”
1 latitude
When center of the latitude is in southern
hemisphere
Appendix1-13
-90 <Reference latitude 1 < Center of the latitude
< Reference latitude 2 < 0
LCC reference latitude line
(Same as above)
(Same as above)
LCC origin point latitude
-90.000° ~ 90.000°
(Same as above)
LCC origin point latitude
-179.999° ~ 180.000°
(Same as above)
2 latitude
Radio button
Orbit Accuracy
▪ Most Accurate and Available
▪ High precision orbit information (default)
The DEM that is used by default is as follows.
Radio button
・In the case of wide-area observation mode, SRTM90
Use DEM default flag
▪ Use default (default)
・In all cases other than wide-area observation mode, GISMAP in Japan
▪ Don’t use default
and SRTM90 in other countries
Use DEM
Radio button
This item appears only when “Don’t use default” is selected in “Use DEM
Satellite
Sensor
Processing
name
name
level
Processing parameter
Items
Remarks
▪ GISMAP
default”
▪ SRTM90
Pull-down list
GISMAP version
▪ Any (default)
This item appears only when “GISMAP” is selected for “Use DEM”.
▪ v01 2014/03/01
Scene shift volume
-5 ~ 4
Radio button
Appendix1-14
▪ CEOS (default)
Format
▪ GeoTiff
“GeoPDF” selection is restricted according to user permission.
▪ Jpeg
▪ GeoPDF
Radio button
3.1
■ The items on left side refer to the following methods
▪ NN (default)
▪ CC = Cubic convolution method
▪ CC
▪ NN = Nearest neighbor method
▪ BL
▪ BL = Bilinear method
Resampling method
■ UTM can be selected only when center of the latitude on selected
Radio button
scene is within the range of -85.000° ~ 85.000°
▪ UTM (default)
■ PS can be used only when center of the latitude on selected scene is
Map projection
▪ PS
within the range of -90.000° ~ 90.000° (In case of High resolution mode
▪ LCC
and direct downlink mode, it should be within the range of -90.000° ~
▪ MER
-25.000, 25.000° ~ 90.000°only)
Satellite
Sensor
Processing
name
name
level
Processing parameter
Items
Remarks
■ LCC
■ MER (Can be selected only when center of the latitude on the scene is
within the range of-73.000° ~ 73.000°)
Radio button
Framing
▪ Geo-reference (default)
▪ Geo-coded
Radio button
This item appears only when “Geo-coded” is selected in “Framing”
Map direction
Appendix1-15
▪ Map (default)
▪ This item appears only when “UTM” is selected in “Map projection”
Radio button
▪ Zone number has range, and it varies by the area
UTM zone number
▪ Zone number at center of the scene (default)
▪ Range that can be set is ±1 of zone number at center of the scene
▪ Specify UTM zone number (→Enter)
▪ Value of permissible limit is entered in the spin box.
Radio button
ON: PS standard is default
PS standard longitude
▪ PS standard is default
OFF: PS standard is not default
▪ PS standard is not default
PS standard longitude
-179.999° ~ 180.000°
Radio button
Orbit Accuracy
▪ Most Accurate and Available
▪ High precision orbit information (default)
-5 ~ 4
Scene shift volume
This item appears only when PS is selected in “Map projection”.
Satellite
Sensor
Processing
name
name
level
Processing parameter
Items
Remarks
Radio button
▪ CEOS (default)
Format
▪ GeoTiff
▪ Jpeg
▪ GeoPDF
“GeoPDF” selection is restricted according to user permission.
Appendix1-16
Appendix 2 File specification
Following are the files used in AUIG2.
① Search condition file (KML file)
Items
Description
Extension
Any
Supported version
version 2.2
② Search condition file (Shape file)
Items
Description
Extension
2 files i.e. *.shp and *.dbf
Supported version
③ Search result file (KML file)
Items
Description
File name
output.kmz
Supported version
version 2.2
④ Search result file (Shape file)
Items
Description
File name
outputShape.zip
Supported version
⑤ Search result file (CSV file)
Items
Description
File name
To be specified by user
File format
CSV
⑥ Ordered product file
Items
Description
Extension
*.zip
File format
Refer to 6.4 File structure provided by
AUIG2.
Appendix 2-1
Appendix 3 Mail notification list
The time of sending mails to the users by AUIG2 is as follows:
NO
Mails to be sent
Description
1.
User registration completion
Sent when clearing examination in JAXA
2.
Password regeneration
Sent at the time of password regeneration
request
3.
Receiving of order
Sent when the order is accepted
4.
Order cancellation completion
Sent when order is cancelled
5.
Order
Sent when order is cancelled individually
cancellation
completion
(individual)
6.
Providing preparation completion
Sent when product providing preparation is
completed
7.
Delivery schedule mail
Sent at the time of product delivery
8.
FTP transmission (Notification that
Sent when FTP transmission is completed
FTP has been provided)
9.
Product providing validity expire notice
Sent
before
product
providing
validity
expires
10.
11.
12.
Expired
validity
of
providing
the
Sent when the product providing validity is
product
expired
Provision not possible (observation
Sent when observation request has been
request rejected)
rejected
Provision not possible (observation
Sent when observation failed
failed)
13.
Provision not possible
Sent when product provision is not possible
Appendix 3-1
The time, subject, and body shall be displayed for each email that is sent. The body of
the email shall be placed inside the "Body" portion of the following common format
(except for No. 1” User registration completion”, No. 2” Password regeneration” and No.
12 “Provision not possible (observation failed)”).
The contents of mail notification can be changed by the operator.
Dear XXXX XXXX XXXX
Body
https://auig2.jaxa.jp/ips/home
* This email was sent from a send-only address.
Each “{information}” as the contents of following mails shows a just example.
Appendix 3-2
① Mail received at the time of user registration
Login screen
User registration request
Examined in JAXA
Main received:
1. User registration completion
Received mail
Subject
Body
1. User registration
Notification
completion
registration for AUIG2
of
user Dear {XXXX XXXXX XXXX}
Your AUIG2 (ALOS User Interface
Gateway2) user account has been
registered successfully.
You can login and use the AUIG2
from the following URL.
Your user ID : {XXXXXXXX}
AUIG2 URL :
https://auig2.jaxa.jp/ips/home
You can get your password from the
following procedure.
< The procedure of getting your
password >
1.
Access
to
the
AUIG2
(the
above-mentioned URL)
2. Click "Forget your password? Click
here" in AUIG2 Login page.
Appendix 3-3
3. Follow the on-screen instruction,
and enter your user ID and your email
address that is received this email,
and click "Send" in sub-window.
4. Your password will be sent to your
email address.
If you have any questions, please do
not hesitate to ask to the following
inquiries.
Inquiries
- For AUIG2 Service
Contact: ALOS-2 orderdesk
E-mail:
[email protected]
-
For
Principal
Investigators,
Researchers
Contact: EORC orderdesk
E-mail: [email protected]
* This email was sent from a
send-only address.
* This is an automated message,
please do not reply to this email.
Appendix 3-4
② Mail received at the time of password regeneration
Login screen
Password reset request
AUIG2 password regeneration
Mail received:
2. Password regeneration
Received mail
Subject
Body
2. Password
Password was reset
Dear Dr. {XXXX XXXX XXXX}, I have
regeneration
reset the password for AUIG2.
New Password :
{Cba@6846068028719178740}
https://auig2.jaxa.jp/ips/home
Inquiries
- For AUIG2 Service
Contact: ALOS-2 orderdesk
E-mail:
[email protected]
-
For
Principal
Investigators,
Researchers
Contact: EORC orderdesk
E-mail: [email protected]
* This email was sent from a
send-only address.
* This is an automated message,
please do not reply to this email.
Appendix 3-5
③ Mail received from product order to product receipt
Product search
Product ordering
Order received by AUIG2
Mail received:
3. Receiving of order
Providing preparation by AUIG2
Mail received:
6. Providing preparation completion
Product download by AUIG2
Start of providing the product by AUIG2
Mail received:
Mail received:
7. Delivery schedule mail
8. FTP transmission (Notification
that FTP has been provided)
Appendix 3-6
Received mail
Subject
Body
3. Receiving of order
Order Received (order
Your
ID: {0000007020})
successfully.
Order
has
been
received
Order ID : {0000007020}
AUIG2 Login page
6. Providing
Providing Preparation
Providing Preparation of Order has
preparation
Complete (order
been completed.
completion
ID:{0000007020})
Order ID :{0000007020}
password :{ k2pjve*F}
available Till : {2014/12/10}
AUIG2 Login page
7. Delivery schedule
Providing Preparation
We have delivered the products that
mail
Complete (order
you have ordered
ID:{0000007020})
Order ID : {0000007020}
password : {k2pjve*F}
AUIG2 Login page
8. FTP transmission
FTP Transmission
FTP
Transmission
(Notification that FTP
Successful (order ID:
successfully.
has been provided)
{0000007020})
Order ID : {0000007020}
password : {k2pjve*F}
AUIG2 Login page
Appendix 3-7
is
executed
④ Mail received at the time of cancelling the order
Email confirming order receipt
Order cancellation
Order processing by AUIG2
Mail received:
4. Order cancellation
completion
Mail received:
5. Order cancellation completion
(individual)
Receive mail
Subject
Body
4. Order cancellation
Order Cancellation
Your
completion
Success (order ID:
successfully
{0000007020})
have
cancel
your
order
Order ID : {0000007020}
AUIG2 Login page
5. Order cancellation
Order Cancellation
completion (Individual) Success (order ID:
{0000007020})
Your
have
cancel
your
successfully
Order ID : {0000007020}
Order details ID : {001001}
AUIG2 Login page
Appendix 3-8
order
⑤ Mail received during provision period
Received a mail that providing preparation has been completed
AUIG2 before providing period
Mail received:
9. Product providing validity expire notice
AUIG2 providing period has been lapsed
Mail received:
10. Expired validity of providing the product
Received mail
9. Product providing
validity expire notice
Subject
Please
Body
receive
your
Your order is prepared. Please
order before expiry date receive before available till date.
(order ID: {0000007020})
Order ID : {0000007020}
available Till : {2014/12/10}
10. Expired validity of Order is Expired (order Your order has been expired.
providing the product
ID:{0000007020})
Order ID : {0000007020}
available Till : {2014/12/10}
AUIG2 Login page
Appendix 3-9
Mail received due to rejection of observation request and cancellation of observation plan
Order receipt
Waiting for order request formulation
Observation plan formulation complete
Observation request rejection
Mail received:
11. Provision not possible
(observation request rejected)
Observation failure
Mail received:
12. Provision not possible
(observation failed)
Received mail
Subject
Body
11. Provision not
Capture
possible (observation
(order ID: {0000007020})
request cancel
For the following reasons, your order
cannot be provided
request rejected)e
Order ID : {0000007020}
Order details ID : {001001}
Reason : Capture
12. Provision not
Created by an operator
request cancel
Created by an operator
possible (observation
failed)
Appendix 3-10
Provision cancellation by operator
Receiving of order
Providing preparation by AUIG2
Email received:
Provision cancellation by operator
6. Providing preparation completion
Email received:
13. Provision not possible
Received mail
Subject
Body
13. Provision not
Some Product of order
Some Product of order can not be
possible
can not be provided
provided.
(order ID: {0000007020})
Order ID : {0000007020}
Order details ID: {001001}*1
Rejection Reason: {*2}
*1: The order details ID is not output to the body if data transfer has failed.
*2: The Rejection Reason indication differs depending on the reason why product provision
is not possible, as shown below.
Reason why product provision is not
Rejection Reason indication
possible
Product creation has failed.
Product Creation Error
A visual quality check resulted in “Fail”.
Quality Check NG
Data transfer has failed.
Data Transmission Error
Product provision was cancelled during
Cancelled Provision
provisioning.
Appendix 3-11
Appendix 4 Glossary and abbreviations
Glossary and vocabulary are provided in the next page.
Appendix 4-1
Glossary and abbreviation
Abbreviation and Glossary
A
Active sensor
English
Japanese
-
能動センサ
This is a sensor which irradiates the routine electromagnetic waves from satellites etc. to
objects and collects scattered and reflected waves from objects. Some sensors are of the
scanning type such as SAR, laser radar, microwave scatterometer or altimeter, while
some are of non-scanning type such as laser spectrometer or laser rangefinder.
Algorithm
-
アルゴリズム
ALOS (DAICHI)
Advanced Land Observing
Satellite
陸域観測技術衛星
It signifies the formulation and expression of steps for solving the problem in mathematics,
computing or related field. Further, program is the way to instruct the algorithm in the
computer.
Advanced Land Observing Satellite (ALOS: DAICHI), which was launched in 2006 is a
man-made satellite for land observation. It has solar battery paddle on one wing and three
sensors PRISM, AVNIR-2 and PALSAR on-board.
ALOS-2
Advanced Land Observing
Satellite-2
陸域観測技術衛星2号
Advanced Land Observing Satellite-2 is the successor satellite to the “DAICHI”, which is
in operation. It can take images of Japan approximately within 12 hours and of Asia region
approximately within 24 hours. To allow mutually complementary relationship (Observation
Frequency Improvement), orbit of ALOS-2 is set in noon as against (Orbit-6:00 am) of the
foreign satellite SAR. L band SAR is the only sensor on-board. However, the aim is to
achieve a resolution of 1 ~ 3m by adding new observation mode “Spot light mode” for
PALSAR of resolution around 10m.
Ambiguity
-
アンビギュイティ
Angle of incidence
入射角
Annotation
Incidence angle, Angle of
incidence
-
High resolution of SAR range and Azimuth direction are achieved by compression
processing of the respective directions. The response function of SAR corresponding to
point target, is generally in SINC function format (sinmx/x) depending on the above
mentioned compression processing. The video of point target becomes ambiguous since
this function has the peak corresponding to multiple x values. This is called ambiguity, it
can also be seen in any of the range and Azimuth direction.
Through this feature of SAR, for example, in case of observing target near the extremely
big point of radar cross section, the peak (ghost) of periodic image intensity is seen in the
range and Azimuth direction by taking that target as a center. Normally, the occurrence of
ambiguity can be controlled with the appropriate tapper to the signal.
See [Off-nadir angle]
ARC
Active Radar Calibrator
能動型レーダ校正器
アノテーション
Description
It is additional information written alongside the image. The central coordinate, date of
taking photograph, sensor type, sun angle, processing parameter etc. are written at the
lower part of photograph or header portion of electromagnetic tape etc.
ARC (Active Radar Calibrator) is a device used in calibration of synthetic aperture radar
installed in satellite or aircraft. Internally, it has radar reflector equipped with amplifier. The
ability to enlarge radar cross section area, irrespective of antenna beam width is a major
advantage compared to passive reflector (such as corner reflector). Further, in ARC
various types of processing can be carried out for radar signals within the device. For
example, temporal delay can be provided and frequency can be shifted for radar signal.
Appendix 4-2
Remarks
Glossary and abbreviation
Abbreviation and Glossary
Ascending node orbit, Descending
node orbit
-
Japanese
昇交軌道、降交軌道
Auxiliary data (DEM etc.)
-
補助データ(DEMなど)
AVNIR-2
Advances Visible and Near 高性能可視赤外放射計2型
Infrared Radiometer Type 2
Azimuth
-
アジマス、方位、方位角
Azimuth Compression
-
アジマス圧縮
B
Basic observation
-
基本観測
Basic observation scenario
-
基本観測計画
Committee of Earth
Observation Satellites
地球観測衛星委員会
C
CEOS
English
Description
Orbit where satellite passes equator from south to north is known as ascending node orbit,
and orbit where satellite passes equator from north to south is known as descending node
orbit.
Even from the same point on earth, the visibility from sensor varies for each orbit,
therefore observation data is different.
In ALOS-2 Information System, ortho processing is provided as one of the observation
data processing. Ortho processing performs geometric corrections (ortho corrections)
using digital elevation data (Digital Elevation Mode: DEM). In ALOS-2 Information
Systems, the DEM used in ortho processing is called as ‘Auxiliary data’ (DEM).
One of the sensors installed in ALOS. Sensor which generates color image with four types
of wavelengths.
The traveling direction of a flying object such as a satellite or an aircraft is called Azimuth
direction and perpendicular direction is called range direction.
It is a process that is carried out while changing SAR signal to an image that is understood
just by seeing through eyes. It is a signal process that obtains the sharp resolution from
pulse amplitude information corresponding to Azimuth direction (orbit direction of satellite).
Basic observation when common mode is selected to fulfill the requests of as many users
as possible.
The objective is to reduce overall amount of requests and improve request fulfillment level
as a whole.
It is formed with an objective of basic observation.
See "Basic observation".
A committee established in 1984 on the recommendation from Panel of Experts on
Remote Sensing from Space under the aegis of the G7 Economic Summit of Advanced
Nations. Mission of this committee is to increase the advantages of earth observation from
space for its member as well as international user community. In addition to this, they
discuss regarding the technical information exchange in order to facilitate the
complementarity and compatibility between the systems in operation or systems being
developed. It does not have any legal validity, since the points agreed upon in CEOS do
not cover the existing agreements among all the members.
Appendix 4-3
Remarks
Glossary and abbreviation
Abbreviation and Glossary
CEOS Format
English
COES Format
Japanese
CEOSフォーマット
Description
CEOS format is created in compliance with CCT format that was created by Committee on
Earth Observation Satellites.
CEOS-BSQ format (Band Sequential) wherein files are divided in each band and CEOSBIL format (Band Interleaved by Line) wherein multiple bands are overlapped in CEOS
format.
Standard format of ALOS (DAICHI) is CEOS-BSQ format.
CEOS format is composed of following items.
1. Volume directory file
2. Leader file
3. Image file
4. Trailer file
5. NULL volume directory file
Change extraction processing
-
変化抽出処理
Chirp modulation
-
チャープ変調
CMD
Command
コマンド、指令
This is the processing for identifying differences and variations by extracting the
differences of color composition and image intensity or threshold value by using Level 1
data of pre and post disaster.
It refers to linear frequency modulation used in the pulse compression technology to
improve the axial resolution of radar. The name is a reference to chirping in analogy to the
sound made by some birds.
Since it is required to narrow down the pulse width because the axial resolution of the
radar is determined by the effective pulse width, Pulse compression technology is used to
maintain the required average power without increasing the peak transmit power.
This technique is modulated through specific signal as transmitted pulse, and receives
high resolution by demodulation (compression) at phase of receiving data processing by
using the broadband pulse with spread spectrum.
Chirp modulation is widely used as identification signal. Scattered waves received from
targets are passed through the distributed delay line having a characteristic opposite to
that of frequency versus time delay characteristic, or equivalent FFT processing (matched
filtering) is done, then the energy included in all spectrums of point targets which are
scattered temporally gets piled up at single point, and a sharp pulse is output.
By pulse compression, amplitude of the receiving pulse of pulse width T becomes double,
and pulse width becomes 1/ (TB), and range resolution and S/N improves by increasing
the T and B (bandwidth).
Signal sent from ground to control the satellite or on-board devices.
CNES
Centre National d’Etudes
Spatiales
フランス国立宇宙研究セン An agency established in December, 1961 to implement space policy of France. Its task is
ター
to analyze nation’s space activities in long-term perspective and then propose involvement
with Europe in this respect to the government. It also leads important development plan in
nation policy or within ESA framework.
CNES headquarter is in Paris and Rocket Development Centre is located in Evry, a
suburb in Paris. Large-scale test facilities are in Toulouse and Guyana has rocket launch
and test facilities.
Appendix 4-4
Remarks
Glossary and abbreviation
Abbreviation and Glossary
Coherent
-
English
Japanese
コヒーレント
Description
The concept is called as excellent coherence, when interference can easily take place in
two waves.
Wave in which interference takes place is called as coherent wave and the one in which it
does not is called as incoherent wave.
Common information
-
共通情報
Coordinates Conversion Matrix
-
座標変換情報
Common information refers to information of 1. High precision orbit information 2. Orbit
event 3.Coordinates Conversion Matrix 4.Time Difference Information for providing which
are used for processing the mission data in the ALOS-2 usage information system.
It is used in transformation of coordinate system during image processing.
Corner reflector
-
コーナーリフレクタ
COSMO-SkyMed
COSMO-SkyMed
-
Daily observation plan
-
日々観測計画
Observation plan for the next day created on the basis of basic observation requests and
individual observation requests.
See [Basic observation request] and [Individual observation request].
Data distributors, data providers
-
Private operators that commercially provide to general users.
Data relay satellite
-
データ配布業者、データプロ
バイダ
データ中継衛星
DEM
Digital Elevation Model
数値標高モデル
Domestic S/X station (Katsuura))
-
国内S/X局(勝浦)
Domestic X station (Hatoyama)
-
国内X局(鳩山)
It is a reflector that reflects the incoming radio waves in its incident direction. This reflector
consists of 2 to 3 metal sheets attached to one another in order to form 90 ° angle at each
other. Depending on the number of surfaces and shape, it is called as dihedral and
trihedral corner reflector.
Corner reflector has a simple structure and is widely used as a calibration target of SAR
as it can be produced at relatively low cost. However, in order to obtain large reflected
radar power in relatively low frequency, quite large corner reflector needs to be made. In
near future, it may also replace Active radar calibrator (See [ARC]) which uses electronic
component.
High-resolution SAR satellites (SAR satellites) owned by Italian government.
COSMO 1 to COSMO 3 was launched till October 2008. COSMO 4 was launched in
November 2010. Land images of Japan can be captured around 8 times (average 5~6
times for same place) in a day by using a 4 satellites system. Quick support such as
emergency imaging in the event of disaster can be provided.
D
This is a type of a communication satellite which relays communication between ground
stations and space crafts that revolve low-to-medium altitude (300 to 1000 kilometers)
(satellites etc.). This relay dramatically expands the coverage area for real-time
communication between ground stations and low-to-medium altitude space crafts.
Elevation data excluding woods and aboveground structures. See [Digital Terrain Model
(DTM)].
Katsuura Tracking and Communication Station (Katsuura, Chiba prefecture) is scheduled
to be the country's internal sending & receiving station for X-band and S-band signal of
ALOS2 & ALOS 3.
Appendix 4-5
Remarks
Glossary and abbreviation
DTM
Abbreviation and Glossary
English
Digital Terrain Model
Japanese
数値地形モデル
E
EO Profile
Earth Observation Profile
EOC
Earth Observation Center
EORC
Earth Observation Research 地球観測研究センター
Center
地球観測センター
F
Footprint
-
フットプリント
Foreshortening
-
フォアショートニング
Description
In digital terrain data, elevation at lattice point, elevation and Latitude/Longitude at random
point are the main contents. However it may also include digital data of slope and its
direction, crest line, trough line, geological features, vegetation.
Only the elevation data is known as DEM (digital elevation model), and it is classified.
Elevation at lattice point and random point is measured through auto system or manually
from contour of existing topographic map, or determined through stereo plotter which uses
stereo photographs obtained from aircraft and man-made satellite.
It refers to OGC ebRIM Earth Observation Profile. It is one of the metadata standards.
Created by OGC. Mechanism of XML schema and extensions are defined by standard. It
is best to define only individual item.
Earth Observation Center. Agency of JAXA in Hatoyama town, Hiki gun of Saitama
Prefecture.
It was established in April, 1995 as the core of analysis and research on Earthobservation satellite data. Starting with Advanced Land Observation Satellite (ALOS)
"DAICHI", it is involved in calibration and validation of Earth observing satellite observation
devices on-board and observation data, development of advanced algorithm and trial of
research product. In addition, it is promoting emergency observation and providing
information through “DAICHI”. It is located in Tsukuba.
Main duties are as follows.
(1) Development of advanced algorithm for advanced processing of Earth observation
data and publication of result
(2) Conducting research and providing geoscience dataset creation
(3) Research on mission requirement analysis for successive Earth observing system
(4) Providing (Satellite data, computing environment, environment research support,
training and consultation) exchange opportunities for researchers working together on
global environmental problem
This is the range in which main beams of antenna are expected on the target surface
when microwave sensors observe a target which is wide. Usually the size of a footprint is
defined by using antenna pattern’s 3dB width. If footprint’s diameter is d, antenna’s 3dB
width is θ (radian) and space between the antenna and the target surface is R, then d=R
θ.
This is a phenomenon in microwave imaging radars, such as SAR etc., wherein slopes
inclined towards the orbit relatively are portrayed in the image steeper and shorter than
they actually are and slopes inclined in the opposite direction are portrayed in the images
longer and gradually sloping according to the effects of layover.
Appendix 4-6
Remarks
Glossary and abbreviation
Abbreviation and Glossary
English
Japanese
Description
G
GCP
Ground Control Point
地上基準点
General Observation
-
通常観測
General user
-
一般ユーザ
Geo-reference
-
ジオリファレンス
Geocode (Geocoding)
-
ジオコード(ジオコーディ Geocoding is generally known as a technique which correlates the remote sensing images
ング)
with specified geographic coordinates system.
If various types of image data are matched with respective coordinates on map, super
positioned on topographic map, and made to data base, the altitudes and the positional
relationship between place name and each location will not only become easy to
understand, but various space analysis will also become possible by Geographic
Information System (GIS). More information can be acquired at once by color display of
superimposed data which has different optical sensor and SAR images. In order to
superimpose the heterogeneous data, it is necessary to correct the volume and various
types of data included in each screen. The technique which is useful in this type of case is
known as Geocoding. Geocoding is a process of geocoding the images.
A point on the ground with the coordinates associated to the pixels of the image.
It doesn’t use the information such as position of the platform related to the cause of
geometric distortion. It is used in the geometric correction of the system which determines
the coordinate transformation system between the map coordinate system to be output
and image coordinate system.
The determination of the coordinate conversion relation depends on GCP and shape of
the adopted conversion formula, and because the final decision is entirely depends on
GCP, the accuracy of the GCP is directly affected. Generally while selecting the GCP, it is
necessary to select the scenes which are completely same so that there is no unevenly
distribution. In precise correction of TM, MSS of LANDSAT, GCP is used and data such
as position (pitch, roll, yaw) which causes geometric distortion is corrected, therefore in
data, error is less as compare to bulk correction.
Refers to Peacetime Observation.
See [Peacetime Observation]
There is no direct relation with the mission accomplishment of ALOS-2. These users use
the observation data of ALOS-2.
Data distributor provides data to general users.
A function to bring the scanned images of paper map and any obtained map image file on
the GIS map screen and to display after superimposing on the same location.
Map data on GIS has information of all the positions (Coordinates) that should be
displayed by it.
On the other hand, image file which is uploaded from the outside doesn’t have location
information of place and range which should be displayed by it; hence display position and
size cannot be decided.
By providing the information of position (Coordinates) that should be displayed on image
file, normal display is possible on GIS. This function is known as Geo-reference.
Appendix 4-7
Remarks
Glossary and abbreviation
Abbreviation and Glossary
Geometric correction
-
English
幾何補正
Japanese
GeoTIFF
GeoTIFF
ジオティフ
GPS Data
Ground range
H
High-latitude station
-
地表距離
-
高緯度局
High precision orbit information
-
確定軌道暦
Housekeeping
-
ハウスキーピング
I
Imaging process
-
可視化処理
Description
It refers to removal of geometric distortion of an image. In other words, it means geometric
correction and geometric distortion correction. The geometric distortions included in the
remote sensing image are of two types, internal distortion that is originated from sensor
and external distortion that is originated from platform or object.
Distortions relating to optical axis and film orthogonality, flatness of lens and film in optical
camera etc., variation in viewing angle or scanning speed in scanner and changes of
beam width and the sampling rate etc., in radar are the main factors of internal distortion.
Further, position of platform, altitude, position, variation in speed, ups and downs in the
ground level, earth curvatures, and rotation etc., are the main factors of external distortion.
Geographical information embedded in TIFF (Tagged Image File Format) is known as
GeoTIFF and basically it complies with TIFF.
TIFF developed by Aldus (No more in existence) and Microsoft is a format to record image
data. Every image related information is noted in tag. File extension is “.tif” (available for
“.tiff”).
Since monochrome 1 pixel 1 byte data as well as 1 pixel 2 byte data can be used in TIFF,
it is used as a standard format for IKONOS satellite.
Raw data (11 bit data) of IKONOS satellite image cannot be used directly in bit map
because only 1 pixel 1 byte data in monochrome can be used in bit map format.
TIFF has Motorola method and Intel method. Further, for image data positioning, IBM
method and other method are available. One must take care while reading image data.
Generic term for GPS navigation data and GPS signal data. GPS navigation data is the
time-series data of satellite positioning calculated on the basis of GPS data provided by
satellite device on-board. GPS signal data is positioning signal data of carrier phase GPS
received by satellite GPS reception device on-board.
Projected distance for ground surface of slant range.
Overseas station situated at high-latitude.
It is a backup of data broadcast satellite interface in ALOS-2.
High precision orbit information on the basis of orbit determination which is based upon
GPS positioning signal data. Time series data related to position and speed of satellite
orbit.
Optimal state of usage is maintained in the satellite by monitoring the status of the satellite
equipment by telemetry from the satellite and managing power, temperature, position and
remaining fuel.
In other words, the status of each equipment and the satellite is managed by monitoring
data such as the installed equipment’s temperature, consumption (current, power), each
equipment’s’ on/off status, generation of solar cells (voltage, current, power), transmit
power, position and propulsion. In a broad sense, it also includes keeping the satellite on
the predetermined orbit with orbital data.
Process to make PDF, JPEG and Geo Tiff of standard processing data (L1.5 or above).
Appendix 4-8
Remarks
Glossary and abbreviation
Abbreviation and Glossary
Interferometry
J
JAXA
English
-
Japan Aerospace
Exploration Agency, JAXA
Japanese
インターフェロメトリ
Description
The technology of obtaining three-dimensional information of topography by combining the
technique of interferometer in SAR is called SAR interferometry and SAR performing that
kind of observation is called interferometer SAR (interferometer SAR, INSAR). The
following two things can be realized at present as the configuration of interferometer.
Specifically, one is mounting of two antennas in an aircraft and another is using of image
data of two orbits close to satellite.
In the former case, along with the primary receiving antenna of radar, the reflected signals
of radar are received through another established antenna by sliding the position in
vertical and horizontal direction. Interference pattern can be seen in the image, if the
image (data is a complex number) created by both signals is made to interfere (This image
is called interferogram). An altitude of earth surface can be obtained from interference
pattern. This approach was first attempted by Graham in U.S.A early in the year 1970.
TOPSAR is a recent typical interferometric SAR, in which JPL added the function of
interferometer in Synthetic Aperture Radar AIRSAR mounted in an aircraft.
In the latter case, interferogram is created by making SAR image (complex image) of two
parallel adjacent paths interfere. In the year 87, JPL made a successful attempt of making
SAR image of SEASAT interfere. Map of altitude was created from interferogram. After
that the research of interferometry started in full swing along with the launch of ERS-1 of
ESA. In the experiment of SIR-C/X-SAR conducted in the year 94, the image of SAR of
short wavelength X band was successfully caused to interfere.
Further, there is an issue related to interferometric SAR that detects the shift of earth crust
caused due to earthquake. In June 1992, when the Landers earthquake that occurred in
the state of California, the gap appeared as an interference pattern due to earthquake,
when the difference of two images taken by SAR of ERS-1 of before and after the
earthquake were seen. It is an interesting two dimensional and a wide measurement
technique.
独立行政法人宇宙航空研究 The Japan Aerospace Exploration Agency (JAXA), an independent administrative
開発機構
institution is the aerospace agency responsible for Japan aerospace development policy. It
is an independent administrative institution of Ministry of Internal Affairs and
Communication and Ministry of Education, Culture, Sports, Science and Technology. It is
the largest organization amongst such administrative institutions. On October 1, 2003, the
Institute of Space and Astronautical Science (ISAS), the National Aerospace Laboratory
of Japan (NAL) and the National Space Development Agency of Japan (NASDA) were
merged into one independent administrative institution, i.e. the Japan Aerospace
Exploration Agency (JAXA). It's headquarter is in Choufu, Tokyo (NAL, first called the
National Aeronautical Laboratory). In newspaper, abbreviations such as space agency,
space development agency and aerospace agency are also used for JAXA.
Appendix 4-9
Remarks
Glossary and abbreviation
Abbreviation and Glossary
JAXA internal user
-
English
-
Japanese
K
Ka band
K-above band
Kaバンド
KML
Keyhole Markup Language
-
Description
It refers to JAXA officials and agencies having an agreement with JAXA and conducting
joint research as given below.
① Within JAXA: JAXA officials.
② Agency user: Agencies which are involve in research after concluding a contract or an
agreement with JAXA.
③ PI: Researchers who are indulge in joint-research after concluding a contract or an
agreement with JAXA.
Ka band refers to radio frequency band of 27GHz~40GHz used mainly in satellite
communication.
High frequency is used in Ka band and large amount of data of approximately
188GHz~20.2GHz can be communicated in downstream speed. It has less chances of
congestion with frequency band which is used as ground wave. However, communication
speed of Ka band is easily affected by weather.
Same as Ka band, amongst the frequency bands used in satellite
communication,12GHz~18GHz is called as Ku band. It is mainly adopted in satellite
broadcasting.
Keyhole Markup Language (KML) is an XML based markup language, developed to
manage display of three-dimensional geographical information in application and program.
In April, 2008, version KML 2.2 was adopted as OGC KML standard by Open Geospatial
Consortium, Inc. (OGC), a group aiming at open sourcing of geographical information
system.
(KML is the acronym of Keyhole Markup Language. However, this word went out of vogue
when it was taken over by OGC. Currently famous software Goggle Earth was formerly
known as Keyhole. The name originated from a company called Keyhole that developed
the Keyhole Markup Language, which was later acquired by Google. The origin of Keyhole
is associated with model name (KH) of spy satellite Corona.)
KML files are in text format and specify elements (landmark, image, polygon, three
dimensional model, details, etc.) to be displayed in Google Earth, Google Maps and
Google Mobile. 3D models can be specified in COLLADA format. Each point has
longitude and latitude information of right handed system. It can also specify detailed
information such as tilt, camera direction, and altitude necessary in the composition of
“camera view”. KML has same text composition as GML. Some part of information
specified in KML cannot be displayed in Google Maps and Google Mobile.
KML file is the text file having .kml extension. Frequently, it is distributed as KMZ file
having compressed .kmz extension. When KMZ file is decompressed, one “doc.kml’ file is
extracted. Image file for overlay and image file for icon shown within “doc.kml” file also get
extracted.
Appendix 4-10
Remarks
Glossary and abbreviation
Abbreviation and Glossary
L
L band
English
Japanese
Description
L band
Lバンド
Latitude argument
-
緯度引数
Layover
-
レイオーバ
Long term plan
-
長期計画
Basic observation plan targeted for long term period (2 years or so).
Refer to [Basic observation plan].
M
Map projection method
-
地図投影法
Method by which surface comes near to the virtual base level such as spheroid, and that
base level is represented on the plane. Recently, not only the earth, but celestial bodies
other than moon and mars etc. are also included in its target range.
There are many methods to classify the projection method, however, from the view point
of (1) projection plane, (2) projection point, (3) characteristics of map, classification
method performed from the difference of projection plane, is used most frequently.
Meta Information Data (Meta data)
-
メタ情報データ(メタデータ)
Mid term plan
-
中期計画
Mosaic
-
モザイク
This is information related to the data (for e.g. creation date/creator/title/comments etc.)
and it is used in order to effectively manage and search the data.
Basic observation plan targeted for mid term period (3 months or so).
Refer to [Basic observation plan].
Images that cover a wide area by joining multiple adjacent images are called ‘Mosaic
images’ and joining the images is called ‘Mosaicking’.
Revision of the map coordinate system and adjustments in the color tone at the joints are
the problems that are faced while creating mosaic images. Satellite images use digital
mosaicking for converting coordinates and adjusting the color tone.
Color correction for path direction is not required for data of the same orbit which is taken
in continuation. However, adjustments are done for data which is acquired on different
dates by the normalization processing or other join processing.
It is a bandwidth of UHF band in one of the bandwidth of microwave. 1 02GHz (15
030cm).
For example, L1 radio wave (1575.42MHz) of GPS comes under this bandwidth.
This term was originally used by U.S. armed forces in code language. Therefore, L does
not have any deep meaning.
x-axis, y-axis, z-axis are present in the orbit plane when geo-center, the center of earth it
considered as the origin. When x-axis plus is in ascending node direction, the angle from
that position till the satellite is an angle of perigee argument plus true anomaly and that is
called latitude argument.
In microwave imaging radars such as SAR, this refers to geometric distortion peculiar to
radar images wherein surface components are shown to be falling towards the orbit on
range direction.
Since the linear distance (round-trip time of microwave) from sensor to the object is
measured in radars, microwave pulses, propagating concentrically from antenna, often
reach the top of the object before its base and therefore it appears to be even closer to the
orbit in the image. Layover increases the smaller the look angle or bigger the earth’s relief.
Appendix 4-11
Remarks
Glossary and abbreviation
Abbreviation and Glossary
Multi-look (processing)
-
English
Japanese
マルチルック
Description
In Synthetic Aperture Radar’s (SAR) image reproduction processing, synthetic aperture
length L is divided by N. Image reproduction processing is performed separately at the
aperture of each L/N and N number of reproduced images are superimposed in order to
reduce speckle noise. If the division number is N, it is called as ‘N look processing’ and N
is called as ‘number of looks’. The general term, ‘Multi-look processing’, is used in case N
is 2 or more.
The bigger the N, more effective is the reduction of speckle noise (In N look images, it is
the standard deviation of fluctuation); however, spatial resolution degrades by N times. In
actual multi-look processing, azimuth direction’s frequency spectrum is divided into N
number of frequency bands and N types of images, obtained by separate azimuth
compression, are added.
N
Number of Multi-look
-
マルチルック数
In the course of SAR image processing, number of multi-looks in multi-look processing is
indicated in order to reduce speckle noise. Superimposing several images, which do not
have any particular phase relation, is effective in reducing speckle noise. This is known as
multi-look. The methods are as follows.
1. Frequency division method: During azimuth compression, azimuth direction’s frequency
spectrum is divided only for the number of multi-looks and images of each look, which is
obtained by separate compression, are added. This method is used most widely. The
same technique is considered for range compression as well and is known as ‘Range
multi-looks’; however there are very few examples of it being actually used.
2. Method of averaging reproduced images locally: Method wherein local average is
obtained by taking a pixel as the center.
Both methods have a similar effect on reduction of speckle noise. If N look processing is
implemented, there is a reduction in the speckle noise, but the resolution degrades by N
times.
O
Observation mode (including definition
of each mode)
-
観測モード(各モードの定義
含む)
Satellite observation modes.
ALOS-2 has 3 types of observation modes as given below.
Spot light :
Resolution : 1×3m Swath width: 25km
High resolution :
Resolution : 3m~10m Swath width: 50km,70km
Wide area observation : Resolution : 100m Swath width: 350km
Observation request
-
観測要求
Request to specify the observation points.
Appendix 4-12
Remarks
Glossary and abbreviation
Abbreviation and Glossary
Off-nadir angle
English
-
Japanese
オフナディア角
OGC
Open GIS Consortium
(Open Geospatial
Consortium, Inc.)
-
OGC CSW
OGC Catalog services for
the web
-
Description
Generally, off-nadir angle refers to an angle which is formed between straight line joining
sensor and object on the surface of earth, and normal line on that surface. This term is
used in the context of monitoring side. In the microwave imaging radar, it refers to an angle
that forms between arrival direction of incoming beam and its normal line.
However, if the earth surface is inclined, local angle of incidence should be different from
the one which is mentioned earlier. A related term is called as grazing angle which refers
to an angle that forms between arrival direction of this beam and earth surface and it has
relation with an angle of incidence and supplementary angle.
On the other hand, off-nadir angle and depression angle are the terms used in the context
relating to sensor i.e. SAR. These terms are used for radar. Off-nadir angle is also called
as look angle as it is formed between the radar’s vertical downward and monitoring
direction. Depression angle is an angle between horizontal including radar and observation
direction and both these angles are supplementary to each other.
Generally, angle of incidence is always bigger than off-nadir angle. Topography view from
the off-nadir angle is different, for example, the larger the off-nadir angle, geometric
distortion such as foreshortening becomes shorter whereas shadow effect increases.
It is an employer's organization to promote the standardization of technology related to
Geographic information system (GIS). It was established in 1994 in America and more
than 200 organizations such as global vendors of product related to GIS, user's
enterprise, government institutions, research institutions, etc., have been participated.
A standard related to linkage method of GIS compatible software, space data model or its
format of expressions are developed. The sequence norm is given under the name of
"Open GIS".
Following is an example of OGC standards.
■Geographical space data exchange format/expression model
- GML (Geography Markup Language, ISO 19136:2007): Exchange format between
various services such as WFS, detailed management of features including tropology and
attribute
- KML (Keyhole Markup Language): Exchange format between light weight
protocol/services such as simplified 3D visualization, mobile
- CityGML: 3D City data description, GML extended format for GIS&CAD&CG linkage
(Application Schema)
■Web service interface (OWS:OGC Web Services)
- WMS (Web Map Service, ISO 19128:2005): Raster map delivery service
- WFS (Web Feature Service): Vector map delivery (Update) service
- WCS (Web Coverage Service): Image data delivery service
- CS-W (Catalogue Service for Web): Catalog search service such as Meta data
- WPS (Web Processing Service): Geographical space data processing service
- WCPS (Web Coverage Processing Service): Image data processing service
■Others (Simple Features, Abstract Specification etc.)
See [OGC]
Appendix 4-13
Remarks
Glossary and abbreviation
Abbreviation and Glossary
OGC WMS
On-Duty
English
Japanese
OGC Web Mapping Service 運用デューティ
-
Orbit information
Orbital elements
-
軌道情報
軌道要素
Description
See [OGC]
It refers to section in which basic observation scenario has not been drafted and the
section in which a separate observation plan can be drafted additionally from the aspect of
timeline for satellite observation.
See "Direct receiving station forecast value".
Orbit means “Path through which celestial body moves”. In other words, it refers to
“Parameter that represents route through which artificial satellite travels”. Satellite travels
according to law of motion, therefore, if the speed and position at a given time are known,
then past and future position of satellite can be calculated.
Space is 3-dimensional, therefore, it is possible to represent position and speed of artificial
satellite in 6 independent parameters namely 3 elements for position and rest 3 for speed
through the help of inertial coordinate system. Furthermore, position of artificial satellite
changes hourly so speed as well as size and direction change accordingly. However,
shape of orbit and orbital plane do not change in two-body problem so size, shape and its
orientation, inclination of orbit and its direction as well as position on orbit at specified time
can be used as 6 parameters that represents orbit. One group of parameter is called as 6
elements of orbit and they are explained as follows.
(1) Semi-major axis: a
Center of the earth, nearest perigee and furthest apogee in earth on orbit are in the
straight line. Line segment from perigee to apogee (major axis) represents the size of orbit.
It is called as semi-major axis because one half of major axis is used as orbital elements.
(2) Eccentricity: e
According to Kepler’s law, center of the earth is focal point of elliptic orbit. Therefore,
shape of orbit is decided according to distance between center of elliptic orbit and focal
point. If this distance is same as shape of orbit, it is proportionate to a, the size of orbit, so
if it is taken as ae, the e in this represents eccentricity of eclipse and as orbital elements, it
is called as eccentricity.
(3) Orbital inclination: I
It is an angle which is formed between equatorial plane and orbital plane.
Appendix 4-14
Remarks
Glossary and abbreviation
Abbreviation and Glossary
English
Japanese
オルソ処理・画像
Description
(4) Longitude of ascending node: Ω
Angle revolving in east direction from vernal equinox on equatorial plane to ascending
node. It represents position and orientation with right ascension and declination by taking
direction of vernal equinox in the inertia space as standard
(5) Argument of perigee: ω
It is fine to represent the orientation of the orbit with the orientation of the diameter of the
orbit. Standard orientation is taken as ascending node (point where a satellite passes an
equatorial plane from south to north at the point of intersection with the equatorial plane
and satellite orbital plane. Its opposite side is called as descending node) when it comes to
orientation of orbit in the orbital plane. It is an angle measured from the ascending node to
the perigee.
(6) Mean anomaly: Position of satellite on orbit at specific time which is represented as f,
E, M. and is correlated with e. It becomes f=M only in an apogee and the perigee
f: True anomaly (represents true position of a satellite). Speed of change varies
according to the position on an orbit so it is inconvenient to calculate.
E: Eccentric anomaly (it is used for middle parameter computation)
M: Mean anomaly (Movement is constant).
Here, vernal equinox means the intersection which exists in the direction of the sun at the
time of the vernal equinox among the intersections of a solar ecliptic side and the
equatorial plane of the earth.
Ortho processing and image
-
Overseas receiving station
-
海外受信局
Process wherein geometric correction (ortho correction) is carried out by using Digital
elevation data (PRISM DEM, Japan's Geospatial Information Authority digital terrain map,
SRTM etc.) and process result.
Stations which receive data from overseas satellite.
-
海外衛星地上局
Ground system for overseas satellite.
Phased Array type L-band
Synthetic Aperture Radar
フェーズドアレイ方式バン It is an active radio wave (microwave) sensor which has improved the functionality and
ド合成開口レーダ
performance of Synthetic Aperture Radar (SAR) that is equipped to Earth resources
satellite 1 (JERS-1). PALSAR operates on observation mode (Scan SAR) which
possesses the wide swath width or function that changes off-nadir angle. It has the feature
of measurement without being largely affected by weather and without any distinction of
day or night and 10m resolution can be achieved in high resolution mode.
The PALSAR has been jointly developed by Japan Aerospace Exploration Agency
(JAXA) and Japan Resource Observation System and Space Utilization Organization
(JAROS).
パス、パス番号
Nominal orbit (predetermined orbit) of one rotation of the satellite is called as the ‘path’ and
the number allocated to identify it is called the ‘path number’.
データ配布事業者
See [Data distributer and Data provider].
Overseas satellite ground system
P
PALSAR
Path, path number
-
PD
Primary Distributor
Appendix 4-15
Remarks
Glossary and abbreviation
Abbreviation and Glossary
Peacetime observation
-
English
平時観測
Japanese
Description
This refers to observation for requests by ALOS-2 users other than the disaster-response
requests.
There are 2 types of peacetime observations – basic observation and individual
observation.
See [Disaster-response requests], [Basic observation] and [Individual observation].
Request for peacetime observation.
See [Peacetime observation].
Researcher carrying out the joint research by concluding the contract with JAXA.
See [JAXA internal user].
This is one of the formats to represent the shape and position of spatial data in geographic
information systems.
Points (or circles with a point in the middle) are specified as search areas.
This is a technique to completely measure the variations in the state of polarization when
electromagnetic waves are scattered by an object and to thoroughly utilize the information
of polarization. Polarimetry in synthetic aperture radars (SAR) has been described here. In
mid- 1980s, a SAR was devised at JPL that would perform polarimetric observations.
This acquires 4 types of complex amplitude image data by alternately repeating
horizontally polarized transmissions and vertically polarized transmissions and receiving
backscatter waves for each of them with 2 orthogonal polarizations. The 4 types of data
correspond to 4 components of the scattering matrix. Images for any received/transmitted
polarization can be synthesized by merely calculating from this set of image data.
Peacetime observation request
-
平時観測要求
PI
Principal Investigator
研究代表者
Point specification
-
点指定
Polarimetry (SAR)
-
ポラリメトリ
Polygon
-
ポリゴン
This is one of the formats to represent the shape and position of spatial data in geographic
information systems.
Vector format is one of the methods of representing spatial positions and relation of data.
In this method, spatial shapes and positions are represented by a combination of points
with positional coordinates, lines defined by linking the points and closed regions
surrounded by the lines. Such closed regions are referred as ‘polygon’ or ‘area’.
Precise ephemeris
-
精密暦
Precise ephemeris is created by using IGR data (0:00-23:59) of the previous day which is
provided once in a day at 17:00. In ephemeris, data of 1 day is divided in 4 files of 18:001:00, 0:00-7:00, 6:00-13:00, 12:00-19:00 (6h+ margin 1h is in the 1 file) of previous day,
and provided at 19:00 on the next day of targeted date of data.
In ALOS, the data of last 2 days is provided in 1 file, however in ALOS-2, it is assumed
that the data (4 files+margin) from 18:00 (2 days back) to 19:00 (previous day) will be
provided. (By setting the data storage period as 18:00 (2 days back)-19:00 (previous day),
the data can be provided much faster than ALOS.
Preliminary ephemeris
-
-
Preliminary ephemeris is created by using IGU which is provided 4 times in a day i.e. at
3:00, 9:00, 15:00, 21:00. This ephemeris provides data of previous day in 4 timings i.e.,
the data of 18:00-1:00 at 5:00, the data of 0:00-7:00 at 11:00, the data of 6:00-13:00 at
17:00, and the data of 12:00-19:00 at 23:00.
The preliminary ephemeris cannot be sent in ALOS. Further, as compared to precise
ephemeris, the orbit determination accuracy falls in preliminary ephemeris and therefore it
has rough information till precise ephemeris is provided.
Appendix 4-16
Remarks
Glossary and abbreviation
PRF
Abbreviation and Glossary
English
Japanese
Pulse Repetition Frequency パルス繰り返し周波数
Priority Observation
-
PRISM
Panchromatic Remotesensing Instrument for
Stereo Mapping
Process level (Definition of each level
as well)
-
PS
Polar-Stereographic
Projection
-
Public user (Land management user,
Resource management user and
Resource probe user)
Pulse compression
-
R
RCS
Radar Cross Section
Description
In pulse radars like SARS, transmission pulse is repeatedly sent and reflected. The
frequency of repetition of this transmission pulse is called ‘Pulse Repetition Frequency’.
Basically the maximum and minimum visual distance is taken into consideration for the
intervals of pulse repetitions and the intervals should be such that pulse should not come
in between the swath width. Sampling criteria of Nyquist needs to be taken into
consideration if there is relative movement between targets.
優先観測
Observation that is to be done on priority in case there is a conflict in the contents of
observation.
パンクロマチック立体視セ It is one of the sensors equipped in ALOS. In an optical sensor, having wavelength of
ンサ
visible range, ground surface can be observed by 2.5 m resolution. Image is in black and
white (not colored).
Highly accurate topology data is acquired by taking images of three directions of the
movement i.e. forward, backward and just below of a satellite simultaneously.
処理レベル(各レベルの定義 In Mission data processing, processing level is defined as per process details.
も)
[L1.0 processing] Scene extraction. Segregation of each polarization data by multipolarization observation mode.
[L1.1 processing] Complex data on slant range after the range compression and one-look
azimuth compression (Includes phase information). However, wide-area observation mode
is not targeted.
[L1.5 processing] It is the map projected data (Geo-reference and Geo-code) that is
selected after projecting the amplitude data on ground range. Range compression and
multi-look azimuth compression has been performed on this amplitude data.
ポーラステレオ図法
It is one of the map projections. It is projected as a visual point on the surface of the earth
(pole) of projection plane and the opposite side.
公共ユーザ(国土管理ユー
User from government department who has supported in the mission of ALOS-2.
ザ、資源管理ユーザ、資源探 See "Land management user", "Resource management user" and "Resource probe user".
査ユーザ)
パルス圧縮
Modulating with specific signals as transmission pulse (chirp modulation) and
demodulating at the stage of data processing after reception by using spread spectrum
broadband pulse in order to enhance radar’s distance resolution is known as ‘Pulse
Compression’.
レーダ断面積
This is an amount which shows the degree to which an object scatters electromagnetic
waves. Usually when a target with plane electromagnetic waves is hit, size of the
electromagnetic energy which is scattered due to it is expressed in scattering cross
section. When direction of incident and direction of observation match, it is called ‘primary
radar scattering cross section’ and it is usually abbreviated to ‘backscattering crosssectional area’ or ‘radar cross section (RCS)’. When observation directions are different, it
is called as ‘secondary radar scattering cross section’.
Appendix 4-17
Remarks
Glossary and abbreviation
Abbreviation and Glossary
RADARSAT-1
English
Japanese
RADARSAT-2
Range - Doppler Method
-
レンジ・ドップラ法
Description
It is a SAR based satellite, developed by Canada, which was launched successfully on
4th November, 1995 in U.S.A. The greatest feature is that optimum resolution, swath
width & cycle etc., can be selected depending upon the intended usage, since the mode of
microwave beam varies into 5 types. Especially SCANSAR of 500km swath width is the
first attempt in the world.
Further, it has many innovative points such as adoption of dawn-dusk orbit in which
power can be operated 24 hours besides the selection according to unevenness of terrain
since the angle of incidence can also be changed within the range of 10° to 60°, or
financial planning of a part of total 620 million dollars by four state governments.
RADARSAT-2 is a next generation commercial Earth observation radar satellite jointly
developed by MDA and Canadian Space Agency. RADARSAT-2 has the ability to provide
high resolution image data which is called Terrain identification capability: 3m while
maintaining all the features of currently operated RADARSAT-1 (Terrain identification
capability: 10m), as a successor machine. RADARSAT-2 can take pictures all over the
world, day and night without being affected by the clouded weather and therefore it is the
commercial radar satellite, having best performance globally.
While processing raw data (unprocessed data) of SAR, range compression is carried out
in frequency domain first and then azimuth compression is executed in the frequency
domain after performing corner-turning to obtain SAR image data. This method of
regenerating images is called Range-Doppler Method. Processing flow of the typical
Range-Doppler method has been given below.
In case of range compression, range direction’s reference function (replica of SAR’s
transmitted waves) and cross-correlation processing with SAR raw data (matched filter
processing) are performed in the frequency domain by using Fourier transformation, in
order to compress information of the target, which is spread in 2 dimension into range
direction. In case of corner-turning, data arranged in range direction is rearranged in
azimuth direction.
Compression of target information which is spread in azimuth direction is performed by
azimuth compression. Here, however, the azimuth direction reference function, created by
calculating the phase variation between SAR antenna and surface target, and crosscorrelation processing with azimuth direction’s SAR data are performed in the frequency
domain by using Fourier transformation. At this time, ‘Range Migration Correction’ is
performed wherein frequency is shifted so that azimuth direction’s frequency spectrum
completely falls in the scope of processing and sample position of range direction is
changed so that the information of the target to be compressed can be correctly used for
calculating correlation.
Appendix 4-18
Remarks
Glossary and abbreviation
Abbreviation and Glossary
Range Compression
-
English
Japanese
レンジ圧縮
Description
If we assume a case in which a pulse of short duration is irradiated from satellite to the
ground, the pulse reflects from various positions on the earth’s surface and returns to the
satellite, but, the time at which it arrives at the satellite differs depending on the difference
in the distance from the satellite. That is, it is possible to identify targets of range direction
by sending the pulse only once. The ability to identify targets improves the more narrow
the pulse’s time-width is, however, it is difficult to send waves of sufficient intensity within
a short time. So, a chirp signal, whose frequency increases as a linear function of time is
sent for a certain period of time. A ‘matched filter’ is used for the reflected waves which
has the property of the frequency decreasing as a linear function of time. Output of chirp
signal through matched filter has increased amplitude and reduced pulse width. As a
result, we can achieve same effect as sending/receiving strong pulse of short duration.
This operation is called ‘Pulse Compression’. Processing performed for the data column of
range direction (satellite’s travelling direction and the perpendicular direction) for this pulse
compression is referred as ‘Range Compression’.
Range Migration (Curvature)
-
レンジマイグレーション
(カーバチャ)
Recurrent orbit
-
回帰軌道
SAR requires a lot of time for integration in order to attain high lateral resolution. Change
in the distance between the target and the SAR platform (satellite) within this integration
time may be equal to or more than the distance resolution. This effect is called ‘range
migration’ or ‘range curvature’.
It refers to orbit in which satellite comes back to its original position in one day or in one
cycle. Orbit which comes back again to its original position after fixed no. of days is called
as semi-recurrent orbit, and number of days required for this are called as revolution cycle
and revolution number of days.
Resolution. Ground resolution, Spatial
resolution
Spatial (ground) resolution
(SAR)
RCS
Radar Cross Section
RNG
Range
分解能、地上分解能、空間分 In Synthetic Aperture Radar (SAR) images, this refers to the ability to separate and
解能
identify 2 adjacent small objects, with similar brightness, which are in the same dynamic
range. Usually it is also referred as spatial resolution and the minimum distance between
objects.
High resolution is achieved in SAR by using the aperture synthesis technique in the
direction of travel of platform (azimuth direction) and the pulse compression technique to
the perpendicular direction (distance or range direction). The theoretical resolution is equal
to half of the length of antenna of the travelling direction in azimuth direction and it is equal
to half of the product of pulse width and speed of light after compression in the distance
direction.
レーダ断面積
This is an amount which shows the degree to which an object scatters electromagnetic
waves. Usually when a target with plane electromagnetic waves is hit, size of the
electromagnetic energy which is scattered due to it is expressed in scattering cross
section. When direction of incident and direction of observation match, it is called ‘primary
radar scattering cross section’ and it is usually abbreviated to ‘backscattering crosssectional area’ or ‘radar cross section (RCS)’. When observation directions are different, it
is called as ‘secondary radar scattering cross section’.
レンジ、距離
Means range (distance).
Direction in which flying objects such as satellites or airplanes move is referred to as
‘Azimuth direction’ and the direction orthogonal to it is referred to as ‘Range direction’.
Appendix 4-19
Remarks
Glossary and abbreviation
Abbreviation and Glossary
S
S/A ratio
Signal to Ambiguity Ratio
S/N
Signal-to-noise ratio
SAR Interference processing,
Interferometry
Satellite control and mission operation
system
English
Japanese
Description
信号対アンビギュイティ比 It is a ratio (S/A) for ambiguity A of signal volume S. It is also called S-A ratio. See
[Ambiguity] for ambiguity.
信号対雑音比
It is a ratio (S/N) for noise quantity N of signal volume. Also called as S-N. Although,
various noise components exist in remote sensing data, but there are many instances
where only noise at detector stage is handled, when there is a conflict over signal to noise
ratio of sensor.
In case of optical sensor, it is evaluated by comparing output against incident light quantity
volume (signal current) and noise current. Noise current differs according to the sensor
element to be used. In case of photomultiplier tube, noise of external amplification device
can be ignored due to big current multiplication factor and in case of photodiode, on the
contrary there is a big impact of subsequent amplifier. In CCD, dark current and shot
noise is evident.
The variation (∆ρ) in reflectance producing the signal variation similar to noise level is
called noise equivalent reflection ratio (NE∆ρ) and similarly temperature variation (∆Τ)
producing signal variation similar to noise level is called noise equivalent temperature (NE
∆T). These are the indicators at the time of evaluating energy resolution of sensor.
In case of SAR, noise equivalent scattering coefficient is used.
See [Interferometry].
Scene
-
衛星管制・ミッション運用シス A system in which plan drafting, command creation, satellite status monitoring,
テム
observation data reception and Level 0 processing, and Level 1 processing for emergency
observation data are performed.
シーン
The size of the satellite image which is configured as required.
Scene specification
-
シーン指定
Segment (Observation segment)
-
セグメント(観測セグメント)
-
One of the methods used when selecting a product.
To select the desired scene directly specify its ID.
Divides observation area into information by which observation is possible.
・FORMOSAT-2 (Taiwan)
・THEOS (Thailand)
・XSAT (Singapore)
・ Others (24 aircrafts of the International Charter. An International Charter has 28
aircrafts; but 4 aircrafts are redundant with Sentinel-Asia)
Separate observation
-
個別観測
Separate observation request
-
個別観測要求
Observation which is carried out separately besides basic observation.
See "Basic observation".
Request for separate observation.
See "Separate observation".
Appendix 4-20
Remarks
Glossary and abbreviation
Abbreviation and Glossary
Shape file
English
Japanese
Description
It is a map data file having graphic information and attribute information. It is a file which
displays the information such as the location of graphic on the earth, its shape, the
attribute (nature/feature/value etc.) of that graphic, as information to be shown.
Shape file has been introduced by American ESRI, which acquired the top share in the
global market of GIS and is a recording format of vector data. Generally, it is open to public
and is also known as standard format of GIS industry. It can also be used in ESRI & LGGI
products and many GIS softwares. Output is also possible in KML format used in Google
Earth depending on the data conversion tool etc.
-
-
Slant range
SOA
Service Oriented
Architecture
視線距離
サービス指向アーキテク
チャ
Spatial frequency
-
Speckle noise
-
Spotlight
-
Distance between antenna and object at ground surface.
It is a technique to build the system as the collection of “Services”. The software products,
built and arranged according to the construction unit of business process, are published
on the network based on standard interface. And it has the merit of executing the process
change such as installing new “Service” easily and flexibly by interlinking.
空間周波数
This terminology is used in Fourier transform of function which deals with space with
respect to the term of frequency used in Fourier transform for normal time function. It
becomes two dimensional in case of dealing with screen. Two-dimensional Fourier
transformation (coefficient of Fourier expansion) is carried out for the sequence provided
in scattered form.
スペックルノイズ(スペッ Variations in the concentration of random black and white spots observed in the SAR
クル雑音)
image. Since it is same as speckle which is well known in optics (spot pattern generated
when light with good coherence is transmitted through the object as laser, and scattered
by the object), it is one of the major obstacles in using the SAR images.
Speckle is generated when there is an overlapping of many waves which have same
wavelength but have different phases in the random, and it is unique to the coherent
image generation system.
In case of SAR, the density value of one pixel of the image is proportional to the power of
the scattered waves from the area of one spatial resolution of the ground surface which is
corresponding to that pixel.
The speckle is formed because scattered waves are received and detected as a coherent
sum of scattered waves from many scattering points, which are scattered within the area.
Since, the reception of coherent is the principle for the establishment of SAR a speckle
cannot be avoided here.
スポットライト
In comparison to common observation method, it is a format to acquire the higher azimuth
resolution in Synthetic Aperture Radar (SAR). By continuously directing the antenna
beam to a point on the ground to be observed along with the progress of platform, the
Synthetic Aperture Length can be obtained, which is greater than the common SAR. As a
result, higher azimuth resolution can be acquired.
When using the spotlight the front and back images on the observation area cannot be
captured and, therefore the coverage is limited.
Appendix 4-21
Remarks
Glossary and abbreviation
Abbreviation and Glossary
Standard processing data (Providing
product)
-
English
Japanese
標準処理データ(提供プロダ
クト)
Sub-recurrent orbit
-
準回帰軌道
Sun synchronous orbit
-
太陽周期軌道
Superposition process
-
重畳処理
Swath (width)
-
走査幅
Description
Standard processing data (providing data) refers to the following:
• System correction data (L1.0, L1.1, L1.5)
• Ortho data (L2.1)
• Image correction data (L3.1) * The results of study will be taken as standard processing
data.
In this orbit, the satellite revolves the earth several times in a day and then returns to the
same place above the earth at a certain interval.
Every time there is little shift in position when this orbit moves around the earth and return
to original place after number of fixed rounds.
In this orbit, there is a merit to observe the same area at regular intervals, and it is also
suitable for the observation of same area at regular intervals in long duration.
For example, earth observation satellite Landsat is also in this orbit. It covers 680 km at
perigee and 700 km at apogee, in 98.5 minutes, and orbits the earth 15 times in a day. It
returns to its original footprint after 16 days. This is known as “Sub-recurrent orbit of 16
regression days”.
“Orbit where rate of change of (Ω) ascending node longitude Ω of satellite and angular
velocity of revolution of earth are matched". It should be set to
so that Ω source is changed to 360 degrees.
The characteristic of the sun synchronous orbit is that the solar altitude (local solar mean
time) of satellite nadir node is constant. This orbit is important for the optical sensor to
capture the sun light.
Process to add feature information, Latitude/Longitude information etc.
It also called as cutting width and swath width.
It is a width of orthogonal direction and traveling direction by which man-made satellite can
observe the ground surface. The same concept is also applicable to aircrafts.
In case of optical sensor, a certain range can be scanned through vibration and rotation of
optical sensor mirror, in the direction which is perpendicular to movement of man-made
satellite. Therefore, in terms of reducing the imaging time, the wider swath width is better.
However, the scanning width is limited depending upon the amount of information
transmitted to ground, and ground resolution (fall enough to deviate from satellite nadir).
In case of SAR, since the microwaves having a fixed beam diameter are emitted obliquely
downward, the regions are irradiated in the surface. Therefore, irradiated range of the
microwave is the scanning width in the regions which are perpendicular to the traveling
direction of the satellite. To increase the resolution of the surface in the traveling direction,
it is better to irradiate diagonally downwards, if the beam diameter is same (to increase the
off-nadir angle). However the scanning is limited because of the requirement of highpower due to weak backscattering and reflection, and lack of information as the microwave
is not irradiated to a portion of the surface due to excess oblique incidence.
Appendix 4-22
Remarks
Glossary and abbreviation
Abbreviation and Glossary
Synthetic Aperture Radar (SAR)
-
English
Japanese
合成開口レーダ(SAR)
Description
Synthetic Aperture Radar is high resolution microwave image radar. It is mounted in
aircraft and satellite to project vivid images of topographical features, forest, waves, sea
ice etc. The quality, to capture images in all-weather conditions, is considered to be its
strongest utility feature. Even the image information possesses various signature features
which are not present in optical sensor and the research and development for utilization of
this technology is growing rapidly.
SAR is a type of side-looking radar. The principle of its operation is as follows.
Radar sends microwave pulses horizontally and obliquely downwards, and receives
reflection pulses from ground surface while moving in a straight line at a fixed altitude.
Diagram depicts spatial relationship between radar and ground. Time required in to-and-fro
movement of pulse with respect to perpendicular direction (range direction) in travelling
direction is directly proportional to position of range direction on ground. As a result, twodimensional scanning is possible with the movement of radar if antenna beam width (θ in
diagram) is adequately small (equivalent to aperture radar).
In the SAR, radar synthesizes a long antenna effectively by sending and receiving pulses
while reading different positions one after another. Thereby, it effectively narrows down
the beam width (direction parallel to the travelling direction of radar) in azimuth direction.
Synthesized maximum antenna length is equal to Lsa as one point on the ground is
continuously observed while radar moves the distance of Lsa (beam width in the azimuth
direction of the ground by the actual antenna) in the diagram. Here, it indicates that
spatial resolution in the azimuth direction is half of the actual antenna length D. Lsa is
called as synthetic aperture length. In the case of space borne SAR, the ratio of D and
Lsa is several 1000’s.
T
Terrain information
-
地勢情報
TerraSAR-X
TerraSAR-X
-
Information to show geographical events related to mountains, rivers, plains, ocean, relief,
slope, and state of land.
German government owns the high resolution Synthetic aperture radar satellite (SAR
satellite).
It was launched in June, 2007. It is the first Earth observation satellite to provide the
service which uses microwave sensor of x band. It can observe an object or earth’s
surface by penetrating through the cloud.
THEOS
Thailand Earth Observation タイ地球観測衛星
Satellite
THEOS is the Thailand’s first Earth observation satellite, which operates for the survey of
natural resources using remote sensing. In the year 2004, Thailand’s Earth observation
system plan was formulated, in which map creation, national land planning, land use,
resource management, calamity monitoring etc. were performed. It is built by EADS
Astrium. It was launched through Dnepr rocket from Dombarovskiy launch facility on 1st
October, 2008 and it is still operational. THEOS is pronounced as Tio in the Thai accent.
Time at descending node
Time at descending node
(equatorial crossing)
降交点時刻
Time Difference Information for
providing
-
提供用時刻誤差情報
Time taken by satellite in the orbit to travel from North Pole to South Pole of earth to cross
the equator. As against this, the term "Time at ascending node" is used for the satellite
which travels from South Pole to North Pole.
Data used for calculating ground time (represented in UTC) from the satellite counter
installed in the satellite.
Appendix 4-23
Remarks
Glossary and abbreviation
TKSC
TLM
Abbreviation and Glossary
English
Tsukuba Space Center
Telemetry
Japanese
筑波宇宙センター
テレメトリ
Description
Tsukuba Space Center. JAXA faculty located in Tsukuba city, Ibaraki prefecture.
Telemetry is a House keeping data of satellite bus such as Real time telemetry and stored
telemetry. Real time telemetry is a telemetry which is transmitted in real time while it is
visible. Stored telemetry is a data that is transmitted to earth station through the command
by storing telemetry in a data recorder.
Acquiring data such as a satellite’s status, location or position etc. is known as “Tracking”
and regulating it such as controlling the position by sending command signals to satellite is
known as “Control”. Carrying out both shall be referred to as “Tracking and Control”.
Tracking and Control
-
追跡管制
Tracking network
-
追跡ネットワーク
Data required for monitoring the status of satellites is received, it is determined/predicted in
which orbit the satellite is revolving, which orbit it will take in the future and then command
data is sent to the satellite. Hence earth station(s) perform stable operations domestically
as well as overseas.
U
USB band
Unified S Band
USBバンド
User
-
利用ユーザ
Since it is developed by Apollo plan, various functions such as voice, telemetry,
command, R&RR (ranging and Doppler measurement) are executed in carrier (S band:
2.1-2.3GHz) of up-down pair of frequency ratio 221:240. It is a main channel as a
communication method for tracking and control and recently it is also adopted for almost
all the satellites in Japan. Multiplexing of R&RR ranging signals, commands (uplink) and
telemetry (downlink) are executed in S band frequency.
(1) Disaster Users (Disaster Management Headquarters, International Charter on Space User
and Major Disasters, Sentinel Asia etc.)
(2) Public Users
1. Land management users (for e.g. Ministry of Land, Infrastructure, Transport and
Tourism)
2. Resource management users (such as Ministry of Agriculture, Forestry and Fisheries)
3. Resource exploration users (Ministry of Economy, Trade and Industry)
(3) Internal use at JAXA (including PI)
(4) General users
(5) Global environment users (such as users for forests)
* Data for (4) will be provided by data distribution operators.
* Data for (5) will be provided from JAXA’s ALOS-2 Analysis & Research Systems.
Appendix 4-24
Remarks
Glossary and abbreviation
Abbreviation and Glossary
English
Universal Transverse
Mercator
Japanese
Description
ユニバーサル横メルカトー It is a coordinate system (creating an image) projecting the intersection of equator with
ル図法
central meridian of each zone as origin by dividing the whole earth in the 6° zones in
longitudinal direction through the Gauss-Kruger coordinate system which is a kind of
isometric horizontal axis cylindrical coordinate system. It is most widely used as a medium
scale topographic map projection technique of 1/10,000, 1/25,000, 1/50,000 etc. of
satellite image or Geospatial Information Authority of Japan.
The classification of each zone is done by the eastbound increasing number, like the zone
of west longitude 180° to 174° shall be No.1. Tokyo will come in No. 54 zone which makes
east longitude 141° the central meridian.
Web版地理情報システム
Weekly observation plan
Web Geographic
Information System
-
WMS
Web Map Service
-
X
X band
X band
Xバンド
UTM
W
WebGIS
Figures and symbols
σ0 (sigma naught, sigma zero, sigma-o) Sigma naught (sigma zero
sigma-o)
週間観測計画
Web based GIS
See [GIS].
Observation plan for the next week which will be created on the basis of basic observation
request and special observation plan.
Refer to [Basic observation request], [Special observation request].
It is a standard protocol to provide geo-referenced graph image generated over the internet
through map server using the data from GIS database. The specification was developed
and released earlier in the year 1999 by Open Geospatial Consortium.
It is a bandwidth of SHF band which is one of the bandwidth of microwave. 8 012GHz (2.5
03.75cm).
Uplink 8GHz and downlink 7GHz in satellite communication band.
This bandwidth is often used for the communication with ground in observation satellites
or probe vehicles.
This term was originally used by U.S. Armed Forces in code language. Therefore, X does
not have any deep meaning.
It is backscattering coefficient/amount representing the degree where the extended target
scatters the radio wave of radar in incident direction (direction of radar) of radio wave and
abbreviated as σ0. Quantitatively it is defined as “Backscattering cross-sectional area per
unit” (Dimension is m2/m2). σ0 varies by combining sending and receiving polarization,
angle of incidence, internal non-uniformity or frequency, electrical conductivity, dielectric
constant, inclination, roughness of scattering surface.
[Reference] ASTER SCIENCE PROJECT Glossary, 2008 publication - New Edition Remote Sensing Terminology Dictionary, Sentinel Asia’s webpage etc.
シグマノート、シグマゼ
ロ、シグマオウ
Appendix 4-25
Remarks
Appendix 5 Items list
Appendix 5-1
08_01_Observation plan
* Acquired values are shown as it is, for the items for which no possible values are defined.
Display location
No.
Item name
Possible value
List Details
1
O
O Satellite name
ALOS-2
2
O
O Sensor operation segment ID
3
PALSAR-2
O
O Sensor type
4
WD1 (28MHz)
O
O Observation mode
WD1 (14MHz)
WD2
SM1
SM2
SM3
SPT
CAL
5
Emergency table use
O
O Observation table type
Normal table use
6
O
O Observation start total number of revolutions
7
O
O Observation start latitude argument
8
O
O Observation end total number of revolutions
9
O
O Observation end latitude argument
10
O Observation start time
11
O Observation end time
12
O Observation center position X
13
O Observation center position Y
14
O Observation center position Z
15
O
O Observation ID
16
O SAR calibration parameters
17
ON
O Pre-calibrated or not
OFF
18
ON
O Post-calibrated or not
OFF
19
O
O Roll angle
20
O
O Off-nadir angle
21
Ascending
O
O Fly direction
Descending
Any
22
HH
O
O Polarization
VV
HV
VH
HH+HV
VV+VH
HH+HV+VH+VV
Levorotation H+Levorotation V
Dextrorotation H+Dextrorotation V
Direct H+Direct V
N/A
23
O
O Beam No.
24
Left
O
O Observation direction
Right
N/A
25
O Observation area
Appendix 5-2