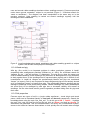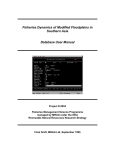
1
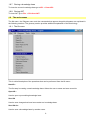
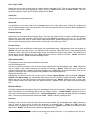
Local ecological knowledge and socio-economic factors influencing farmers’ management decisions in jungle rubber agroforestry systems in Jambi, Indonesia L. Joshi1,2, G. Wibawa2 & F.L. Sinclair1 1 School of Agricultural and Forest Sciences University of Wales, Bangor Gwynedd, LL57 2UW, UK 2 International Center for Research in Agroforestry SEA Regional Program P O Box 161, Bogor 16001, Indonesia DFID Project R7264 Forestry Research Programme October 2001 TABLE OF CONTENTS 1 INVESTIGATION OF LOCAL ECOLOGICAL KNOWLEDGE OF JUNGLE RUBBER FARMERS ....................... 5 1.1 LOCAL KNOWLEDGE AND KNOWLEDGE–BASED SYSTEMS APPROACH .................................. 5 1.2 WHAT IS THE PURPOSE OF THIS AKT GUIDE?................................................................... 5 1.3 CONSULTING KNOWLEDGE BASES ................................................................................... 5 1.4 THE AGRO-ECOLOGICAL KNOWLEDGE TOOLKIT (AKT5) ................................................... 5 1.5 THE CONTEXT: JUNGLE RUBBER AGROFORESTRY IN JAMBI ................................................ 6 1.6 SISIPAN KNOWLEDGE BASE............................................................................................. 7 1.7 HOW TO CONSULT THE SISIPAN KNOWLEDGE BASE: .......................................................... 7 1.8 GENERAL TASKS: OPENING, CLOSING, SELECTING, SAVING AND PRINTING KNOWLEDGE BASES8 1.9 THE MAIN MENUS ........................................................................................................... 9 1.10 DIAGRAM INSTRUCTIONS .............................................................................................. 13 1.11 GLOSSARY: KEY TERMINOLOGY AND CONCEPTS FOR USING AKT..................................... 16 1.12 A SIGHTSEEING TOUR WITH AKT................................................................................... 17 1.13 HIGHLIGHTS OF LOCAL KNOWLEDGE ABOUT JUNGLE RUBBER ........................................... 20 2 PROBABILISTIC BELIEF NETWORK OF SOCIO-ECONOMIC FACTORS INFLUENCING JUNGLE RUBBER FARMERS’ MANAGEMENT DECISIONS .......................................................................................... 27 2.1 BELIEF NETWORKS AND PROBABILISTIC INFERENCE ........................................................ 27 2.2 MODELLING MANAGEMENT DECISIONS IN JUNGLE RUBBER AGROFORESTRY ...................... 27 2.3 DISCUSSION AND RECOMMENDATIONS ........................................................................... 31 3 REFERENCES........................................................................................................................... 33 1 INVESTIGATION OF LOCAL ECOLOGICAL KNOWLEDGE OF JUNGLE RUBBER FARMERS 1.1 Local knowledge and knowledge–based systems approach There is general consensus among development people about the recognition and use of local knowledge and practices in development initiatives aimed at technology development by and for rural farming communities. Interest amongst research, education and development institutions to investigate and document local knowledge has grown significantly over the last few years. The University of Wales, Bangor is a leading institution in the development of a knowledge-based systems (KBS) methodology to acquire and use local knowledge in research and development. The university spearheaded the development of this novel approach to acquire, store and use local ecological knowledge about agro-ecosystems in collaboration with various national and international research institutions in Asia, Africa and Latin America. It promotes systematic collection and collation of ecological knowledge from farmers and development professionals. The Agro-ecological Knowledge Toolkit (AKT5) is a tailor-made computer software that enables representation of statements of knowledge in a computer readable form, allowing exploration of local ecological knowledge using computer based search and reasoning facilities. Work so far has revealed that farmers in general have sophisticated knowledge of ecological processes occurring in farming systems and that the local knowledge they possess is largely complementary to scientific knowledge, but is not taken into account when planning research. While knowledge differs to some extent between communities, a common framework and terminology occur across large distances. 1.2 What is the purpose of this AKT guide? The instructions that follow will guide you through a knowledge base created using the knowledge of jungle rubber farmers from Jambi in Indonesia. By following these instructions you will be introduced gradually to the AKT software, at the same time as learning about farmers' knowledge of jungle rubber agroforests in Indonesia. This publication is not intended to guide users through the creation of their own knowledge bases. The methodology for creating knowledge bases from knowledge elicited from stratified sectors of the population using iterative semi-structured interviews can be found in the user manual - Dixon et al. (2001). The principles of knowledge base creation have also been explained in Sinclair and Walker (1998) and Walker and Sinclair (1998) or you may visit the AKT website at: http://www.bangor.ac.uk/afforum 1.3 Consulting knowledge bases Local knowledge can help researchers and development workers to explain the rationale behind farmers’ actions and can contribute to making more effective decisions in developing appropriate solutions to development problems. Knowledge bases can be consulted in four main ways: • • • • 1.4 by viewing sets of statements that fall under specific topics by performing a search for particular terms (words) by representing statements on a diagram and using these to investigate causal processes by using customized tools (small computer programs supplied with AKT that interrogate and reason with the knowledge base) The Agro-ecological Knowledge Toolkit (AKT5) 1.4.1 What is AKT? AKT is a methodology and software that enables the user to create a knowledge base about a chosen topic e.g. soil fertility management or vegetable pests, by collating knowledge from a variety of sources (generally farmers, scientists, extension workers and scientific literature). So far, it has been used primarily as an analytical research tool. However knowledge stored in this way can also be consulted by natural resource scientists and development workers. 5 For more information on the methodology for eliciting knowledge from stratified sectors of the population using iterative semi-structured interviews, see Dixon et al. (2001), Sinclair and Walker (1998) and Walker and Sinclair (1998). 1.4.2 What is a knowledge base? A knowledge base is a store of knowledge. It consists, fundamentally, of a collection of statements. Each statement is tagged (referenced) with the source of the knowledge (which is generally either a person or a document). Knowledge that is stored in this way is organised according to a number of principles: • Topics arrange knowledge around specific subject areas, e.g. ‘weed management’, ‘soil fertility indicators’. Topic hierarchies gather similar topics under broader areas, e.g. ‘weed management’ and ‘grass weeds’ both fall under the more general topic of ‘weeds’. • Object hierarchies organize knowledge about specific objects (material or conceptual things) under more generic terms, e.g. Triplochiton scleroxylon, Milicia excelsa and Ceiba pentandra are all types of tree and would therefore fall under the more general object ‘trees’. 1.5 The context: jungle rubber agroforestry in Jambi Jungle rubber (Hevea brasiliensis) agroforest gets its name from the complex forest-like vegetation structure. All jungle rubber agroforests in Indonesia derive from traditional crop-fallow rotation systems (Barlow et al., 1994; Gouyoun, 1999, Joshi et al., in press). It is a far less intensive system requiring only a fraction of the establishment and maintenance cost vis-à-vis monocrop systems in commercial plantations. Aggressive plant species that are known to affect growth and production of rubber are weeded out earlier from the system while valuable species, such as timber and fruit trees, are deliberately promoted. The system is ideal for resource limited farmers as it offers ample flexibility in investment, tapping frequency, rotation period, and management intensity. Biodiversity value is much higher in a jungle rubber context than in plantations, but less than in natural forests despite comparably low per unit area latex productivity, usually less than half of what is achieved in clonal plantations. Figure 1: A sisipan jungle rubber farm Depending on the method of rejuvenation, there are two types of jungle rubber agroforestry - Cyclical Rubber Agroforestry System (CRAS) and gap rejuvenated rubber agroforestry system, often referred to as Permanent Rubber Agroforestry System (PRAS). The former is a relatively short cycled system where rubber trees are replanted every 30-40 years following clearing of all old vegetation. Age of rubber trees is more or less even. The “permanent” system on the other hand is a longer, theoretically indefinite, system where young rubber seedlings are regularly planted inside gaps under existing trees resulting in a diverse age class structure, which supposedly maintains a permanent crown cover in the fields. This 6 form of gap level rejuvenation, known locally as sisipan system, is a farmer adapted technology which can lead to a higher biodiversity as frequency of slashing and burning is drastically reduced. Nearly half of the rubber farmers in Jambi have at least one plot under a sisipan management system; although most of these also have plots under slash and burn systems. 1.6 Sisipan knowledge base Local ecological knowledge of farmers practising the sisipan technique was investigated using the KBS methodology developed by University of Wales, Bangor. Thirty farmers from five villages (Rantau Pandan, Muara Buat, Sepunggur, Lubuk and Muara Kuamang) were interviewed and knowledge statements were abstracted from the interviews. A knowledge base was developed using the Agroecological Knowledge Toolkit software. A test of representativeness of the knowledge base was carried out in these five villages. Figure 2: Jungle rubber farmer articulating his knowledge of sisipan The current knowledge base contains over 600 knowledge statements covering a range of topics in the sisipan context: • • • • • • • 1.7 rubber seedling survival and growth weeds and their role and positive and negative impact on rubber plants wild pigs (a major player in the rubber agroforestry system in Jambi) soil (hot and cool concept) intra-species variation (red and yellow variants of rubber trees) rubber seed (attributes) non-rubber tree species in jungle agroforests. How to consult the sisipan knowledge base Some guidelines are provided in the following sections on how to open and explore the sisipan knowledge base. The information contained in these sections is by no means a comprehensive description of the whole knowledge base. Interested users ought to explore the knowledge base more 7 thoroughly themselves to gain a more comprehensive understanding of the local ecological knowledge held by jungle rubber farmers in Jambi. Section 1.12 A sightseeing tour with AKT (page 17) will be useful for those unfamiliar with the AKT software and should be completed first. The user can then move on to consulting the knowledge bases on particular topics of interest, as indicated in Section 1.13 Highlights of local knowledge about jungle rubber (page 20). Sections 1.8, 1.9 and 1.11 explain the terminology associated with AKT and describe the software commands in a more systematic way. They should be used to supplement a user’s own exploration of the knowledge base. 1.8 General tasks: opening, closing, selecting, saving and printing knowledge bases 1.8.1 Opening AKT Before opening a knowledge base, you must have the AKT program open. To do this double click on the AKT icon, and when prompted, click on OK. 1.8.2 Opening a knowledge base To open a knowledge base go to KB → Open KB…, then select the knowledge base you want to open and click on Open. 1.8.3 Dialogue boxes Users will notice that with AKT it is possible to have a large number of dialogue boxes open at the same time and these appear on the taskbar at the bottom of the screen. If new users find this confusing they should remember to close dialogue boxes once they have finished with them. 1.8.4 Working with multiple knowledge bases You can have more than one knowledge base open at the same time, but you can only work interactively with one knowledge base at the same time (unless you are using tools). The name of the current knowledge base is displayed at the top of the screen. To view which other knowledge bases are open go to KB → Select KB…. To switch between open knowledge bases you must then select the knowledge base you want and click on OK. 1.8.5 Printing parts of a knowledge base It is possible to print sets of statements and diagrams from AKT. Printing statements: There are two options for printing statements. You may print them out directly from the knowledge base, or you may save them as a text file and open them in another application such as Word, to view and print them. When you have the set of statements in front of you that you wish to print or save, click on Print Statements. You will then be asked if you want to save them as a text file. If you do, click on Yes, if you wish to print the statements directly from AKT click on No. Printing hierarchy diagrams: You cannot print topic or object hierarchy diagrams directly from AKT. Instead you copy them to the clipboard and then paste them into another application such as Powerpoint, to view and print them. In order to do this, bring the diagram up on the screen (View Tree), then click on Copy to Clipboard. When you have done this, open the application that you wish to view them in, and click on the Paste command. Printing statement diagrams: Statement diagrams (i.e. diagrams that represent a set of statements from the knowledge base) can be printed either directly from AKT or copied to another application. To print a diagram directly from AKT go to your chosen diagram and click on Print Window. To copy statement diagrams to another application, follow the same procedure as for printing hierarchy diagrams. 1.8.6 Saving a knowledge base If you have made some alterations to the knowledge base which you want to save, e.g. by creating a diagram, you can save the altered knowledge base. Go to KB → Save Kb As… , specify a new name for the changed knowledge base and click on Save. 8 1.8.7 Closing a knowledge base To close the current knowledge base go to KB → Close KB… 1.8.8 Closing AKT To close AKT go to File → Exit from AKT. 1.9 The main menus The Kb menu, the Diagram menu and the commands that appear alongside diagrams are explained in the following sections. The glossary section provides additional explanation of the terminology. 1.9.1 The Kb menu This is a brief description of the operations that can be performed from the Kb menu. New Kb… The first step in creating a new knowledge base. Allows the user to name and save a new kb. Open Kb… Used to open a pre-existing knowledge base. Save Kb Used to save changes that have been made to a knowledge base. Save Kb As… Used to save a knowledge base by another name. 9 Save Topic as Kb Allows the user to save a topic from an existing kb as a separate kb file. The user is presented with a list of topics in the kb, the user highlights a topic, clicks on ‘Select’ and clicks on ‘Save as Kb’. The user must then specify a name for the new Kb and click on ‘Save’. Close Kb… Used to close a knowledge base. Select Kb… It is possible to have more than one knowledge base open at the same time. ‘Select Kb’ enables the user to switch between any of the open Kbs. The user is presented with a list of open Kbs, highlights the Kb desired and clicks on ‘OK’. Boolean Search Allows the user to search the knowledge base. The user may choose from a number of different types of search term, and may combine search terms using the Boolean operators ‘and’ and ‘or’. The ‘Search options’ box allows the user to search within object hierarchies. Search strings can also be saved in the form of topics by naming them under ‘Name of new topic’ and clicking on ‘Save’1. Formal Terms… Provides a list of all the different formal terms in the knowledge base. Highlighting a term and clicking on ‘Details’ will give the type of term, any definition and synonyms, allow the user to view statements that contain the term, and find out whether object terms are members of object hierarchies. The definitions of formal terms are also edited from here. ‘New’ allows the user to create a new term. ‘Delete’ allows the user to delete a term. ‘Close’ closes the dialogue box1. Object Hierarchies… Two dialogue boxes are produced with this command. Left hand dialogue box The box on the left provides a list of all the object hierarchies in the knowledge base. ‘New’ allows the user to create a new object hierarchy by naming and saving it. ‘Delete’ allows the user to delete an existing object hierarchy. ‘Close’ closes the dialogue box. Highlighting an object hierarchy from the list opens up a dialogue box on the right providing details of that object hierarchy. Right hand dialogue box Highlighting an object from the list on the left and clicking ‘Object Details’ gives its details. ‘Append’, ‘Detach’ and ‘Move/Copy’ are commands which allow the user to edit the object hierarchy. ‘View Tree’ allows the user to view the structure of the object hierarchy tree. ‘Memo’ allows the user to view, add, edit or delete further text notes about an object hierarchy. ‘Close’ closes the object hierarchy dialogue box1. Welcome Memo… Provides background information about the knowledge base and its creation. ‘Topics’ produces a list of topic hierarchies in the knowledge base (see the section below). ‘Further Details’ allows the user to view more information and includes a link – ‘Pictures/Diagrams’ to images included with the knowledge base. The text may be edited and saved with ‘Save’. ‘Close’ closes the dialogue box1. Sources… Provides a list of all the interview and reference sources within the knowledge base. ‘New’ allows the user to create a new source of either the interview or reference type. ‘Close’ and ‘OK’ close the dialogue box. Highlighting a source on the left and clicking on ‘Details’ gives further information about that source. ‘Delete’ allows the user to delete a highlighted source1. 1 Further explanation can be found under the appropriate sub-heading of Section 1.12 A sightseeing tour with AKT. 10 Statements… Provides a list of all the statements in the knowledge base. A highlighted statement appears at the top of the page firstly in its computer generated translation version, and secondly in its formal language ‘coded’ equivalent. ‘Details’ allows the user to get further information about a highlighted statement. ‘Edit’ allows the user to edit a statement. ‘New’ allows the user to add a statement to the knowledge base by first specifying a source, then typing the statement in its formal coded form and saving it. ‘Delete’ allows the user to delete a highlighted statement. ‘Close’ closes the Statements dialogue box. The list of statements is in numerical order when the button on the left, above the list of statements, says ‘Numerical’. Clicking on ‘Numerical’ orders the statements by type of statement as well as numerical order and changes the button to ‘Categories’. Clicking on ‘Categories’ brings the statements back to plain numerical order. At the bottom of the dialogue box under ‘Diagram Selection Type’ ‘All Statements’ generates a diagram of all the statements listed. When a causal statement is highlighted, clicking on ‘Causes’ generates a diagram showing all the causes of that statement, clicking on ‘Effects’ shows all the effects. When a causal or link statement is highlighted, clicking on ‘Navigate’ generates a diagram of the statement and all other statements with direct links to it. N.B. only causal and link statements can be represented on an AKT diagram. ‘Print Statements’ allows the user to either print a list of statements directly form the Kb or save them as a text file for future reference.2 Synonyms… Provides a list of all the synonyms used in the knowledge base. Highlighting a synonym and clicking on ‘Details’ brings up the details of that formal term. ‘New’ allows the user to create a new synonym by selecting from a list of formal terms and typing in its synonym equivalent. ‘Delete’ allows the user to delete a synonym. ‘Close’ closes the dialogue box. Topics… Provides a list of all topics in the knowledge base. By highlighting a topic, clicking on ‘Select’ and then ‘Search’ the user is provided with a list of statements for that topic. Topics can be combined with the Boolean search operators ‘and’ and ‘or’. ‘Details/Edit’ provides the details of the highlighted topic and allows the user to edit it. ‘New’ allows the user to create a new topic, ‘Delete’ allows the user to delete a topic, ‘Save as Kb’ allows the user to save a selected topic as a new separate kb file, and ‘Close’ closes the topics dialogue box3. Topic Hierarchies… Two dialogue boxes are produced with this command. Left hand dialogue box The box on the left provides a list of all the topic hierarchies in the knowledge base. ‘New’ allows the user to create a new topic hierarchy by selecting from a list of existing topics. ‘Delete’ allows the user to delete an existing topic hierarchy. ‘Close’ closes the dialogue box. ‘Save topic hierarchy as new Kb’ allows the user to save a selected topic hierarchy as a new separate kb file. ‘View topic hierarchy statements’ brings up the statements of a selected topic hierarchy. Highlighting a topic hierarchy from the list on the left opens up a dialogue box on the right providing details of that topic hierarchy. Right hand dialogue box ‘Memo’ allows the user to view, add, edit or delete further text notes about a topic hierarchy. ‘Close’ closes the object hierarchy dialogue box. Highlighting a topic from the list on the left and clicking ‘Topic Details’ gives its details. ‘Append’, ‘Detach’ and ‘Move/Copy’ are commands which allow the user to edit the topic hierarchy. ‘Topic statements’ brings up the list of statements for a topic chosen from the list on the left. ‘View Tree’ allows the user to view the structure of the topic hierarchy tree3. 2 3 See Section 1.8 Opening, closing, selecting, saving and printing knowledge bases. Further explanation can be found under the appropriate sub-heading of Section 1.12 A sightseeing tour with AKT. 11 1.9.2 The Diagram menu This is a brief description of the function of the operations that can be performed from the Diagram menu. The glossary section provides additional explanation of the terminology and the Diagram Instructions section which follows provides more detailed explanation of how to work with diagrams. Show Kb Diagrams Allows the user to create new diagrams and view existing diagrams. If no diagrams have been saved in the knowledge base, or created in the current session, then this command will generate a diagram of all the causal and link statements in the knowledge base. If diagrams already exist then the user will be provided with a list of diagrams. Highlighting a diagram title and clicking on ‘Select’ takes the user to this diagram. To change the title of a diagram the user highlights it, edits the text in the title box, and clicks on ‘Select’. ‘Close’ closes the dialogue box. Hide Diagrams When a diagram or diagrams are open, this command allows the user to hide it or them. Existing diagrams are hidden, remaining within the Kb, rather than deleted with this command. Copy diagram When a diagram is open this command produces a copy of it within AKT. The copy is listed under the list of diagrams (‘Show Kb Diagrams’) as ‘Copy of diagram x’ where ‘x’ is the number of the diagram copied. Save Diagram as New Kb This command saves an open diagram as a new knowledge base file. Delete Diagram Deletes the open diagram. 12 Delete All Diagrams Deletes all the diagrams in the knowledge base. 1.10 Diagram instructions Buttons on left hand side of diagram window. Object Attribute Process Action Add Link Delete Node/Link These commands are only used when creating a knowledge base. Hide Node/Link Allows user to hide a node or link on the diagram if necessary to increase clarity. Note the underlying knowledge base is unchanged, and if diagram is redrawn the hidden links/nodes will be restored. Show/Hide Label Allows user to turn on / off the labelling for a selected link. Select the button, then press the mouse left button down on the 'start' node and holding the button down, move to the 'end' node and release the mouse button (used to hide unwanted labels and improve clarity of the diagram). 13 Buttons on right hand side of diagram window. Zoom In Allows more of the Kb to be seen on the diagram (four zoom levels). Zoom Out Reduces the area to be seen on the diagram (four zoom levels). Centre Zoom Click this button, place the mouse pointer over a node that you would like to appear in the centre of the diagram, and click once. The diagram will be re-positioned. Label Mode Clicks on this button will in turn: • display symbol information for all the links on the diagram. • display the stylised English labels for all the links on the diagram. • remove all symbols / link labels. Refresh Refreshes the current window and returns any highlighted nodes to normal. Undo Will undo the last Navigate, Causes or Effects operation. Show Paths Will create a diagram showing all the possible paths between two or more highlighted nodes. The nodes can be highlighted by a right mouse double click over the node, and will turn green. Another double click will return node to normal. Print Window Prints a copy of the current diagram on the default system printer. The diagram will map onto either portrait or landscape mode (can also print to a file). Navigate Will display on the same diagram all the parent and child nodes of the selected node. Click 'navigate' then single click of the mouse on required node. Statements Produces a list of all the statements represented on the diagram. Causes After clicking 'Causes' button, position new cursor over a node and click left mouse button. AKT will now redraw diagram showing all causal paths leading to selected node. 14 Effects After clicking 'Effects' button, position new cursor over a node and click left mouse button. AKT will now redraw diagram showing all the effects resulting from the selected node. Select Diag Allows user to quickly move backwards or forwards through the current set of diagrams. Dragging of nodes across the diagram Select any node by pressing the mouse left button down upon it, then holding button down, move to the new position. The progress of the node can be seen with a dotted node shape. Resizing nodes on the diagram Select any node by pressing the mouse right button down upon it, then holding button down resize node as required. The new outline of the node is shown with a dotted outline Show all links associated with a selected node Double click left mouse button on required node, and all statements associated with the node will be listed. Details of the statements can then be shown, deleted or printed. Highlight a particular node Double click right mouse button on required node, and node will turn green. By selecting two or more nodes and pressing the ‘Show Paths' button, system will create another diagram showing all the possible paths between the two or more highlighted nodes. Another double click will return node to normal. 15 1.11 Glossary: Key terminology and concepts for using AKT Action AKT Attribute Boolean search Causal statement Comparison Comparison statement Control structures Data Diagram Formal language Formal term Knowledge Knowledge base (Kb) Link Link statement Local knowledge Memo Natural language statement Navigate Node Object Object hierarchy Primitives Process Prolog (WinProlog) Source Subobject (of an object) Superobject (of an object) Synonym Systems tools Tool Topic Topic hierarchy User defined tools Value WinAKT A type of formal term used to refer to a process carried out by man for the purpose of managing his crops or livestock etc. for example: weeding, planting. Agroecological Knowledge Toolkit: a methodology and software for creating knowledge bases. A type of formal term used to describe an object, process or action. Attributes are generally measurable e.g. height, colour, frequency, rate, gradient, temperature. A keyword search mechanism for retrieving statements containing particular keywords. Any combination of words may be used in conjunction with ‘and’ and ‘or’. A statement about the causal relationship between two objects, processes or actions. A type of formal term used in comparison statements. A statement comparing the properties of two objects. When working with tools: program segments within AKT which control when and upon what knowledge primitives are used. A set of observations which may be quantitative or qualitative. A way of graphically representing causal and link statements. The restricted syntax (grammar) by which knowledge is coded into AKT. Terms (words) - the key components in a formal language statement that do not belong to the formal grammar. The outcome, independent of the interpreter, of the interpretation of data or information. An articulated and defined set of knowledge stored on a computer which can be accessed and processed systematically. a) A type of formal term used in link statements. b) On a diagram – the connection between two nodes represented by an arrow. A type of statement used to represent knowledge that cannot be represented by any other type of statement. Knowledge based on locally derived understanding, formed by experience and observation. A facility within AKT which provides additional explanatory information about a formal term, statement, diagram, topic or knowledge base. A statement which has been automatically translated by AKT from the formal language to a stylised English language translation. A command used when working with diagrams that adds to a diagram all the nodes immediately associated with a user selected node or statement. Causal and link statements can be represented on a diagram by two nodes connected by a link. Thus a node is the diagrammatic representation of one half of a causal or link statement which appears as a rectangular or circular box. There are four types of node: i) objects, ii) processes, iii) actions, and iv) attributes of either objects, processes or actions. A type of formal term used to refer to a material or conceptual thing e.g. pests, soil, cows, policy or household. A way of organising knowledge about specific objects under more generic terms e.g. Triplochiton scleroxylon, Milicia excelsa and Ceiba pentandra are all types of tree. Small program segments within AKT employed for running a tool. A type of formal term used to refer to a change or flux in the real world e.g. decomposition, erosion. An artificial intelligence programming language used for developing AKT software. The origin of the information contained in a statement. There are two types of sources: interview sources and reference sources. An object falling below another object in an object hierarchy e.g. grass weeds may be a subobject of weeds. An object above another object in an object hierarchy e.g. weeds may be a superobject of grass weeds. A word with the same meaning as a formal term, frequently used to specify the corresponding botanical name of a local name for a plant species. Tools stored within AKT which can be used to interrogate and evaluate a knowledge base. A small computer program supplied with AKT that interrogates and reasons with the knowledge base. A collection of statements organised around a particular subject e.g. Weed management and Grass weeds. A collection of topics organised under a broader subject area e.g. Weed management and Grass weeds both fall under the topic hierarchy Weeds. Tools created by the knowledge base user that are stored separately to the main AKT program in a file with an .mcr extension. A type of formal term that is always attached to an attribute and describes that attribute e.g. 5kg, 20 ha, 3 months, yellow, tall, rapid. The old name for AKT: Agroforestry Knowledge Toolkit for Windows. 16 1.12 A sightseeing tour with AKT This quick tour around AKT with the sisipan knowledge base is designed to familiarise you with the AKT software and with ways of manipulating knowledge bases. Getting started: 1. Load the AKT program (5.0) onto your computer by double clicking on the appropriate icon. 2. Open the sisipan.kb by selecting KB from the menu at the top left hand side of the page and choosing Open Kb… Then select the sisipan kb and click on OK. 1.12.1 Welcome Dialog Box Read the Welcome dialog box, to get an idea of what the knowledge base is about. Press Further Details to find out more about where, when and how the knowledge base was made. Click on Pictures/Diagrams and then view each picture by selecting it from the list, and then clicking on Select. When you have finished with each picture or diagram click on the X at the top right to close it. Click on Close to return to the Welcome screen. Press Topics. 1.12.2 Topic hierarchies Topics are ways of organising information around particular subject areas e.g. ‘Belowground_interaction’ or ‘Rubber tree variants’. In topic hierarchies information about specific subject areas e.g. ‘Red rubber tree’, ‘Yellow rubber tree’, is arranged under a more general subject area e.g. ‘Rubber tree variants’ On the left you can see a list of the topic hierarchies in the knowledge base. Highlight ‘Soil’. On the right you will see a column containing a list of all the topics in this topic hierarchy, to the right of this you will see ‘Soil’ highlighted in blue and immediately below all the subtopics under it. Click on View Tree and scroll down the page. This shows you the full topic hierarchy. Click on Close. Press Close on both dialog boxes to return to the Welcome Memo and Close again to arrive at the main menu. 1.12.3 Sources Go to the main menu (top left) and select KB → Sources… Sources tell you the origin of the information contained in a statement. All statements have a source, which can be of two types: an interview with a person e.g. a farmer or scientist, or a reference e.g. a journal reference. On the left is a list of all the sources interviewed for the knowledge base. Let us look at one of them. Highlight the name ‘Bahari Lubuk 1999a’ and press Details. A dialog box appears giving you the name of the interviewers, interviewees, gender of interviewees and date of interview. If you press Memo, it will give you any further details that the knowledge base creator felt to be important. Press Close on all three dialog boxes. 1.12.4 Topics From the main menu and select KB → Topics… 17 This gives you a list of all the topics in the knowledge base. Highlight ‘Belowground_interaction’ and press Details/Edit. In the dialog box that appears you will see in the ‘Boolean Search String’ how the topic was created – it is a search for any of the following words – ‘root or weed or competitiveness or shading or moisture or nutrient’. Click on Show use in statements at the bottom of the dialog box and a list of all the statements on below ground interaction as specified by the boolean search options will appear. All knowledge in the knowledge base is represented through statements - these are the basic units of the knowledge base. There are four different types of statement. Attribute statements tell you about the properties (attributes) of something – they are descriptive. Causal statements give you information about causal relationships. Comparison statements compare the properties of two things. Link statements represent knowledge that cannot be represented by the other types of statements. 1.12.5 Object Hierarchies From the main menu select KB → Object Hierarchies… What we refer to as objects are words used to refer to material or conceptual things e.g. pests, soil, cows, policy, household. Object hierarchies are another way of sorting knowledge by arranging specific objects under more general objects e.g. meranti, jelutung, tembesu are all types of trees. These are all therefore subobjects of the object ‘all_trees’, or alternatively, ‘all_trees’ is a superobject of the meranti, jelutung, tembesu. Object hierarchies are, therefore, similar in structure to topic hierarchies. On the left you can see a list of the object hierarchies in the knowledge base. Highlight ‘all_trees’. On the right you will see a long column containing a list of all the objects in the hierarchy, to the right of this you will see ‘all_trees’ highlighted in blue and immediately below all the subobjects under it. Click on View Tree and scroll down the page. This shows you the full object hierarchy trees. Click on Close. Select ‘timber tree’ in the ‘Objects in Hierarchy’ list. You will see that it now appears in the ‘Object’ box with ‘all_trees’ specified as the superobject above it and a list of trees as subobjects below it. Now Close all dialog boxes. 1.12.6 Formal Terms Go to the main menu and select KB → Formal Terms… Formal terms are the key components of statements. Objects are one type of formal term. Other types include actions – activities with a human agent e.g. harvesting, planting; processes – activities without a human agent e.g. decomposition, germination. Press the downward arrow on ‘Type’ next to the word ‘all’ to see the different types of formal terms. Select object. All the objects in the knowledge base are now listed. Scroll down and get an idea of the objects in the knowledge base. Highlight ‘nangka’ and press Details. This tells you what nangka is – Artocarpus heterophyllus or jackfruit. Press Show use in hierarchies. You will see that nangka appears in three hierarchies – all_trees, seed_tree and shade_tolerant_hierarchy. Press OK. Press Show use in statements. The statement that appears is the only statement with nangka explicitly mentioned. 18 1.12.7 Boolean Search Go to the main menu (top left). Select KB → Boolean Search. Go to ‘Display KB terms of type’ and click on the downward arrow to select ‘attribute’. Select weediness. Press Details to see the term’s details and then press Close on the Formal Term Details dialog box. Now press Select and ‘weediness’ will appear in the Boolean Search String at the bottom of the dialog box. Then press the AND button. Highlight ‘visibility’ and press Select once more. Press Search. One statement will appear. This is the only statement in the knowledge base which includes both ‘weediness’ and ‘visibility’. Try using OR instead of AND boolean operator and do the search. 1.12.8 Introduction to diagrams From the boolean search window, select ‘weed’ (or type ‘weed’ in the space under “Boolean search string”) and click search. When you get a list of statements, click “All Statements” at the bottom to produce a diagram of the statements. Diagrams are a way of representing statements. However only causal and link statements can be represented on a diagram. One statement is represented by two nodes (a rectangular or oval box) connected by an arrow. The different colours and shapes of the boxes indicate different types of node – action, process, object and attribute nodes. The words written within the nodes are the key terms used in the statement. Press the Label Mode button twice. This gives you the statements written on the diagram in full. You can make the statements more legible by dragging the nodes across the screen to separate them out. Alternatively you can drag the statements themselves around the screen. Turn the label mode off by clicking once more on Label Mode. Click on Navigate on the right hand side of the screen and then click on the node, ‘decomposition weed_litter’. (The Navigate button gives you the immediate causes and effects of each node). ‘decomposition weed_litter’ will be highlighted in green and some additional nodes will appear connected to it. Carefully drag sideways all new nodes to reveal any further nodes underneath (by pressing the left hand mouse button over the node and dragging the node away). Click the Navigate button again and click on one of the new nodes. Go to the main menu (top left hand corner) and select Diagram → Hide Diagrams. 1.12.9 Tools for automated reasoning tasks The “tools” are subroutines in AKT language to perform one or a series of tasks. System Tools come with the software while users with some experience can develop their own User Tools relatively easily. These tools are implemented to process, analyse, compare knowledge statements in a knowledge base in a much powerful manner than otherwise possible using simple Boolean search operation. This feature allows the use of exploration of the content of a knowledge base using the artificial intelligence features in computer technology. Tools that come with the software are stored with the application while those developed by users are stored in separate files. From the Tools menu select Open Tools file and select lj4.mcr from the list. A list of tools available in the file will show up. Details of any tool can be seen by highlighting the tool in the list. Just to illustrate the tools feature, let us compare knowledge between groups of people from different locations. Select the tool cause_effect_comparison_between_groups_lj from the list and Run it. Select causes in the next window to specify that comparison is between the 19 two groups’ perception of causes of an event that we will specify soon. In the next window, select location as the criterion for grouping sources for comparison and click OK. Select Sepunggur and then Lubuk (these are names of villages from where the key informants come). Shortly after, a list of formal phrases that are commonly found between the two groups (villages in this example) will appear. Scroll down the list of formal phrases, select att_value(rubber_tree,productivity,decrease). In other words, we are instructing the system to compare knowledge sources from two villages regarding their knowledge about the causes of a decrease in productivity of rubber trees. The following is the output from the system: Results of running the tool : Call : cause_effect_comparison_between_groups_lj/0 on 22/10/2001 at 14:42:55 User selected Effect: att_value(rubber_tree,productivity,decrease) Common nodes causes between both Sepunggur and Lubuk : 3 att_value(rubber_tree,density,increase) att_value(part(rubber_tree,branch),number,decrease) att_value(process(root_disease,infestation),rate,increase) Unique nodes under Sepunggur : 1 att_value(part(rubber_tree,leaf),number,decrease) Unique nodes under Lubuk : 8 att_value(ground,weediness,increase) att_value(rubber_seedling,branching_ability,decrease) att_value(sunlight,availability,decrease) att_value(system,season,rainy) att_value(part(tree,crown),presence,yes) att_value(process(termite,infestation),intensity,increase) process(rubber_seedling,elongation) process(shading) End : cause_effect_comparison_between_groups_lj/0 on 22/10/2001 at 14:43:20 The higher level of articulation by Lubuk farmers (8 unique statements) compared to Sepunggur farmers (only 1 unique statement) becomes clear. 1.12.10 Closing a knowledge base and finishing off Close the knowledge base by selecting KB → Close KB… and close AKT by going to the main menu File → Exit from AKT. 1.13 Highlights of local knowledge about jungle rubber 1.13.1 Weed and rubber seedling growth In a mature rubber agroforest, seeding and seed germination is generally not a problem where underground vegetation is light. Additionally farmers may actively transplant seedlings, either because of no natural regeneration where required or where farmer prefers to plant better quality seedlings (e.g. from clonal plantations). Let us explore the knowledge base to see what farmers know about weeds. Using the boolean search feature, perform a search on weed. To do this select KB → Boolean Search, go to ‘Display KB terms of type’ and click on the downward arrow to select ‘object’, highlight ’weed’, click on Select and then on Search. The following nine statements are output by the system. 20 190: 191: 197: 198: 266: 339: 436: 447: an increase in competitiveness of weed causes a decrease in survival_rate of rubber_seedling an increase in weediness of ground causes an increase in competitiveness of weed an increase in rate of growth of weed causes an increase in competitiveness of weed covering weed weed_litter causes a decrease in rate of growth of weed a decrease in rate of growth of weed causes a decrease in weediness of ground a change in temperature of system causes a change in rate of growth of weed weeding of ground causes decomposition of weed_litter if left_behind of weed an increase in competitiveness of weed causes a decrease in rate of growth of rubber_seedling if the rubber_seedling size is small 564: an increase in availability of sunlight causes an increase in rate of growth of weed Generate a diagram of these statements by clicking on ‘Diagram Selection Type’ All Statements. Rearrange the diagram by dragging the nodes around using the left hand mouse button. The labels are obtained by clicking once on ‘Label Mode’, and may also be rearranged in the same way. One of the statements has been hidden from Figure 3 by clicking on ‘Hide’ Node/Link, clicking on the first node and dragging in the direction of the arrow to the second node, before releasing the mouse button. Figure 3: Farmers knowledge of weeds and rubber seedling interactions Farmers hence try to enhance growth of the rubber seedlings by clearing weeds around these wildlings. Without assistance, these plants cannot compete with the already established natural vegetation in the vicinity. High yielding grafted clonal plants are not planted in a sisipan context as farmers perceive that these clonal plants can be grown only under intensive, high input management. 1.13.2 Gaps, sunlight availability and seedling growth Farmers are fully aware of the fact that rubber does not perform well in a highly competitive environment such as that inside a mature agroforest. Young rubber plants, whether natural or planted, require deliberate management if they are to grow into productive trees. Local knowledge about requirements of rubber seedlings, in terms of gaps, both at the canopy level for light infiltration and at the ground level for nutrients and moisture, is well understood 21 by farmers. Perform another Boolean search in the same way as that in the previous section, but this time choosing ‘sunlight’. The following 19 statements are produced: 189: an increase in quantity of infiltration of sunlight causes an increase in availability of sunlight 213: an increase in height of tree causes an increase in quantity of infiltration of sunlight 234: the openness of durian_tree canopy is low causes a decrease in quantity of infiltration of sunlight 238: an increase in weediness of ground causes a decrease in availability of sunlight 273: slash_and_burn of land causes the sunlight availability is maximum 274: an increase in availability of sunlight causes an increase in rate of growth of rubber_seedling 312: a decrease in availability of sunlight causes the rubber_seedling form is elongate 313: a decrease in availability of sunlight causes a decrease in number of rubber_tree branch 328: an increase in openness of canopy causes an increase in quantity of infiltration of sunlight 349: the petay_tree crown density is light causes an increase in quantity of infiltration of sunlight 353: shading causes a decrease in availability of sunlight 354: the amount of sunlight is low causes elongation of rubber_seedling 355: a decrease in density of tree crown causes an increase in quantity of infiltration of sunlight 423: an increase in availability of sunlight causes an increase in productivity of rubber_tree 433: an increase in availability of sunlight causes an increase in survival_rate of rubber_seedling 437: the intensity of sunlight is high causes an increase in temperature of soil if the sand_content of soil is high and the land condition is unshaded 462: the intensity of sunlight is high causes a decrease in survival_rate of rubber_seedling if the land condition is unshaded 519: an increase in availability of sunlight causes an increase in rate of growth of tree 564: an increase in availability of sunlight causes an increase in rate of growth of weed A diagram of these statements can be produced and manipulated in the same way as the one for weed to produce something similar to the one below (Figure 4). Gap is a concept that is closely related to sunlight availability. If too large gaps are created, either naturally or deliberately, natural weeds take over these gaps; while rubber seedling growth is significantly retarded due to insufficient light infiltration if the gaps are too small. Rubber seedlings can tolerate, or even benefit from, some shading during the first year of establishment. However, for continued growth, gradual opening of the canopy is required. Figure 4: Local knowledge about canopy and sunlight in a sisipan system. 1.13.3 Ground vegetation and seedling growth In a sisipan field, ground vegetation competes with rubber for both soil nutrition and moisture. The concepts of weediness (amount of weed including both height and density of ground vegetation) and weed competition (implying the strength of ground vegetation to dominate other vegetation) were clearly articulated by farmers. Tall and dense vegetation 22 near and around rubber seedlings dominate rubber seedlings severely. Farmers report that under dense ground vegetation, sisipan is not practical (Figure 5 - a Boolean search for ‘weed or weediness’ – the diagram has been manipulated in the same way as in the previous sections). Light weeding is carried out around seedlings regularly until the seedlings are well established. Figure 5. Local knowledge about weed, weediness and rubber seedling growth in a sisipan system. Not all links are displayed in the diagram. 1.13.4 Weed and pig Wild pig (Sus scrofa) is an important problem in rubber production systems in Jambi, surpassing other management practices (Williams et. al., 2001). Do a Boolean search for ‘damage_by_pig’ – this will produce 17 statements. The pigs like to chew the sweet root collar of rubber seedlings, these seedlings may be broken or damaged when a pig scratches its body against them, or the seedlings can be uprooted when pigs dig soil in search of soil invertebrates. In Jambi all villages are predominantly Muslim and pigs are considered “haram” (or impure). Pork is not consumed in these villages and pigs are not actively hunted as it is considered “haram” to benefit from pigs. The relationship between weeding and pig damage to seedlings is well perceived by farmers. Rubber seedlings in a clearly weeded plot are more likely to be damaged by wild pigs due to increased visibility and access to seedlings. On the other hand natural ground vegetation provides hiding sites for pigs and their nests. 1.13.5 Soil properties Farmers report two types of soil in a jungle rubber agroforest – tanah dingin and tanah panas, which can be translated literally to cool soil and hot soil respectively. Search the knowledge base using the topic 'Hot_cold_soil'. To do this go to KB → Topics…, highlight the topic 'Hot_cold_soil' from the list on the left, click on Select, and then on Search. 13 statements are generated. This soil characterisation, but strictly not a classification system, seems to be based on farmers observations on how quickly the soil heated under sunlight 23 and farmers provided some descriptive and explanatory basis for this classification (Table 1). Cool soil is also referred to as black soil due to its higher organic matter. Table 1. Farmers’ knowledge about soil types in jungle rubber agroforests. Attribute (comparative) Tanah dinging (cool soil) Speed of heating under sun Sand content Sand particle size Organic matter content Color Porosity Water holding capacity Fertility value Location (usually) Erosiveness (under rain) slow low small high dark low high high forest and hill bottoms low Tanah panas (hot soil) fast high large low light high low low hill slopes high 1.13.6 Intra-species variability in rubber trees The single species of rubber trees in jungle rubber agroforests do not have a long history in Indonesia. However, farmers reported its existence in at least two distinct forms which can be distinguished by their leaf morphology, bark and latex productivity. Table 2 is a summary of the output of a topical search performed in the same way as the search in the previous section, but using the 'Rubber tree variants' topic. Table 2. Farmers’ knowledge about variants among Hevea brasiliensis. Attribute (Relative) Leaf shape Leaf size Leaf color Bark thickness Bark color Seed size Branching behaviour Growth rate Latex density (thickness) Red rubber tree round small dark green thick dark small profuse fast thick Yellow rubber tree narrow large light green thin light large less slow watery 1.13.7 Non-rubber trees Jungle rubber agroforests have a high species richness. Most of these species are tolerated rather than encouraged. Farmers make conscious decisions on removal of species that pose a threat to their rubber trees or latex production. Species such as Macaranga triloba, Trema tomentosa and Sterculia rubiginosa which appear rapidly in slashed and burned fields are removed from the system as these species are known to be aggressive and affect rubber tree growth and have little economic value. Species such as Syzygium polyanthum (timber) and Durio zibethinus (fruit) with high economic value are retained, despite their clear impact on rubber tree growth. All trees with fruit value, whether or not they affect rubber trees, are preserved in the system. Table 3 is a summary of information extracted from the sisipan knowledge base using a series of tools and boolean searches. 24 Table 3. Farmer recognised attributes of some commonly found tree species in jungle rubber agroforests. Local name kelat balik angin Time for dispersal Growth appearance agent speed after S&B 1-3 years bird fast Alstonia spp Ganua spp (Palaquium 1-3 years or Payena spp) wind Syzygium polyanthum 2 weeks wind fast Macaranga conifera durian tree Durio zibethinus petay tree Parkia speciosa manggis cempeda nangka rambutan jengkol Garcinia mangostana Artocarpus integer Artocarpus heterophyllus Nephenium lappaceum Archindendron jiringa kulim Hydnocarpus woodii 1-3 years petaling/ tenggris tembesu sekubung mahang Ochanostachys amentacea Fagraea fragrans Macaranga gigantea Macaranga triloba 1-3 years medang meranti menarung/ angrung Sterculia rubiginosa Shorea parvifolia Trema tomentosa 1-3 years wind 1 year wind Very quick wind pulai balam Botanical name Shade tolerance Coppicing ability Other attributes tolerant yes Soft wood Light wood yes Highly competitive with rubber and other vegetation kayu baru, shallow roots, poor competitor, no harm to rubber, short life - 15 years Tall tree with thick crown, long life – 50 years, dense root and highly competitive, fruit value Light crown with small leaves that decompose fast and has high fertilty value, also competitive, fruit value Light canopy but a short tree Fruit value, susceptible to fire damage Fruit value intolerant possible squirrel tolerant slow 2 weeks 2 weeks possible tolerant tolerant Fruit value Fruit value slow less tolerant yes slow less tolerant yes Hard wood, high timber value, getting scarce, seed eaten by pig Light canopy, hard wood, fire susceptible bird, squirrel bird, squirrel tolerant tolerant slow bird fast bird, wind fast intolerant intolerant fast slow yes yes poor yes intolerant Getting scarce kayu baru, dense crown, short life kayu baru, short life, retards rubber growth, low economic value Light crown, soft wood, retards rubber growth High timber value, small seed- far dispersal kayu baru, shallow roots, poor competitor, no economic value 2 PROBABILISTIC BELIEF NETWORK OF SOCIO-ECONOMIC FACTORS INFLUENCING JUNGLE RUBBER FARMERS’ MANAGEMENT DECISIONS In the following sections we will discuss efforts made to model farmers’ decision making process using a probabilistic approach. First a brief description of belief networks is given. 2.1 Belief networks and probabilistic inference A belief network (also known as a Bayesian network or probabilistic causal network; Jensen, 1996) captures believed relations (which may be uncertain, stochastic, or imprecise) between a set of variables which are relevant to some problem. They might be relevant because these variables, in our current case, influence jungle rubber farmers’ decisions and actions. However, these variables are explored and quantifiable, hence can be rendered to mathematical modelling. The theory of probability in this approach is well developed in the fields of mathematics and artificial intelligence. Good examples of belief networks exist in the medical domain. One good example is in the diagnosis of problem with medical patients as a decision support system for doctors. Here each new patient typically corresponds to a new case. The problem is to diagnose the patient (i.e. find beliefs for the unmeasurable disease variables), predict what is going to happen to the patient, or find an optimal prescription, given the values of observable variables (symptoms). Variables, either discrete, continuous, or propositional (true/false) can be diagrammatically represented using nodes. The nodes can then be connected with links to indicate existence of a parent-child or causal relationship. Probabilistic relations are then calculated for each node, which express the probabilities of that node taking on each of its values, conditioned on the values of its parent nodes. Some nodes may have a deterministic relation, which means that the value of the node is given as a direct function of the parent node values. After the belief network is constructed, it may be applied to a particular case. For each variable, the known value can be entered into its node as a finding (also known as “evidence”). The heavy mathematical computations are done by computer software to derive probabilistic inferences or belief values for other variables. These inferred values are immediately displayed in the model. Probabilistic inference only results in a set of beliefs at each node; it does not change the network. When the model needs to be applied to a different case, then all the findings can be retracted, new findings entered, and belief updating repeated to find new beliefs for all the nodes. 2.2 Modelling management decisions in jungle rubber agroforestry Two approaches were adopted to model socio-economic variables that influence farmers’ decisions regarding plot level management in jungle rubber agroforestry in Jambi. The first approach adopted participatory rural appraisal to investigate various factors and their relative weights in farmers’ decisions. In the second approach, the data gathered from questionnaire survey were tabulated and analysed. Component analysis, a standard statistical tool to analyse relationships between quantitative variables was employed. In both methods, the results were collapsed into probability models which is a standard approach in simple modelling of human decision making. NETICA software (Norsys Software Corp., Canada) was used. 27 2.2.1 Using participatory appraisal tools Discussions with six farmers in Jambi, representing six separate cases, initially provided various changes and their management of jungle rubber gardens over the last several decades. Elaborate discussions about past and present contexts led to identification of key factors that have influenced farmers’ management decisions, i.e. led the farmers to adopt the permanent system. After the individual interviews, information from these ‘case studies’ were collated and key factors or reasons for farmer decisions to adopt change were identified. Based on the collated information from individual interviews, group interviews in line with Participatory Rural Appraisal techniques were held in five villages in Jambi in the vicinity of Muara Bungo. Each group consisted of six to twelve farmers. Facilitated by ICRAF staff, farmer groups discussed individual decision factors and either accepted or rejected them as being influential in farmers’ decisions on whether to accept or reject adoption of the permanent system. Some previously identified factors were removed from the list, while others were added. Once a consensus was reached over the final list, the factors were weighed in terms of their importance. This was carried out by allocating a number of chickpeas to each factor corresponding to its importance. Sixteen factors influencing farmers’ choice between conventional slash and burn approach and sisipan or gap planting approach for rejuvenating a senescing jungle rubber agroforest were collated into six nodes (Table 4) that were then translated into a probabilistic belief network (Figure 6). Table 4. Factors and states that contribute towards farmers’ selection of sisipan Determinant State promoting sisipan State promoting slash and burn Household economic status New land availability Risk status Social status/pressure Plot status poor wealthy distant high towards sisipan near low towards slash and burn hopeless (less than 30% of normal production) grafted clone Planting material still worth tapping (over 30% of normal production) seedling 28 Percentage contribution to choice 44 19 14 14 9 only slash and burn if grafted clone Rubber price high 50.0 low 50.0 Latex production from plot Distribution of rubber trees high medium low evenly distri... 10.0 patchy 30.0 sparse 60.0 5.00 30.0 65.0 Satisfaction Daily wage rate high low 50.0 50.0 Reserve ample 50.0 little 50.0 Household income high 30.5 medium 33.0 low 36.5 Household status wealthy 42.5 poor 57.5 Social influence pro sisipan 5.00 pro slash an... 95.0 Plot status worth tapping 45.0 hopeless 55.0 Risk of failure Management choice sisipan 47.9 do nothing 0 slash and burn 52.1 Alternative income available 50.0 unavailable 50.0 Seedling growth rate fast 52.1 slow 47.9 Plot area over 1 ha 80.0 less than 1 ha 20.0 low high 27.6 72.4 Vertebrate pests High 56.0 Low 44.0 Land terrain piedmont 50.0 peneplains 50.0 New land availability nearby 15.0 far 85.0 Planting material grafted clone 15.0 seedling 85.0 Proximity to forest Far 80.0 Near 20.0 Figure 6. Probabilistic model developed from information gathered through participatory appraisal tools. In overview, the model is quite simplistic. Once loaded into Netica software, it is first compiled. Default values for all node variables are used. The node variables can be instantiated with values for variables that are known. The effect of change of probability in one node on the probability of incidence in other nodes, including management choice node, is automatically recalculated and displayed almost immediately. Further exploration of the network under various “scenarios” can be done very easily. 2.2.2 Using conventional socio-economic surveys A total of 13 villages in Jambi were purposively selected with stratification based on distance from Jambi city and accessibility. Six villages were in Bungo Tebo District and seven villages in Batanghari District. Random samples (5-10% intensity) among rubber farmers were selected. A total of 173 farmers were interviewed; 47% farmers were practicing gap replanting rejuvenation or sisipan at least in one of their rubber gardens while the remaining 53% of farmers have never tried gap replanting in a productive rubber garden. In each village, secondary data on village profile, overall socio-economic status of the village, number of households and rubber farming environment were collected from village chiefs and farmer leaders. This was followed by individual farmer interviews during which various socio-economic factors of the household were investigated. Additional verification of the rubber gardens was made through direct observation. The data collected served two purposes. Financial analysis (NPV, IRR, B/C ratio, return to labour) was carried out using the household financial, labour, and other data to compare between adopters and non-adopters of sisipan practice under different scenarios. A working paper has been written up based on this analysis (Wibawa, 2000). Secondly, a probabilistic model was developed using the survey data. More than 20 variables influencing the choice of sisipan as a rejuvenation method existed. Hierarchical cluster analysis was carried out on these using the Pearson option (SYSTAT computer software). From the hierarchical clusters (Figure 7), a group of variables were determined, starting from the furthest variable to the nearest variable. This analysis shows the “relatedness” of the variables investigated. 29 Variables related to labour, household income, area of immature rubber, proportion of income from rubber and age of farmers were considered important. Each variable was assigned two or three levels (such as low/medium/high or yes/no) based on range of values recorded for the variable. The probability value of each category of variable and of combination of various variables was calculated using frequency of respondents in the survey. These values were then used to develop a probabilistic model (Figure 8). Cluster Tree ARENONRU BB ACTLABOUR LABREQ LABSITUATION LABHIRED TOTLABOUR INCOFFFARM AREIM M PROPINCOFFF INCONFARM BALANCE INCTOT INCRUBB CONSP W EEKYIELD AREM AT LABAVAIL ARETOT AREOTHER AGE PROINCONFARM 0.0 0.1 0.2 0.3 0.4 0.5 Distances 0.6 0.7 0.8 Figure 7. Cluster tree analysis indicate distances between variables. T o ta l ho u se ho ld in co m e high m edium low S yste m of ch o ice 23.5 28.0 48.5 s is ipan c yc lical 35.4 64.6 Non-rubber inc om e F a rm e r's a g e Inc om e from rubber y oung old Non rubber land holding Land availability 80.0 20.0 E x ternal project support Forest location W eekly y ield Rubber tree dens ity E x tens ion A ctivities P est dam age Rubber tree age Tapped A rea Nurs eries Tapping Freq. S hare tapping P la ntin g m a te ria l c lone s eedling Labor availability 10.5 89.5 Fam ily labour Figure 8. Probabilistic model developed from information from questionnaire survey data. 30 2.3 Discussion and recommendations We have attempted under DFID project R7264 to represent farmers’ decision processes in rejuvenation of jungle rubber agroforests. As an exploratory exercise, this was deliberately kept simple in order to test the feasibility of the two approaches. It is true that in management options that are open to owners, besides re-planting rubber, there are other options such as planting oil palm and abandoning the plot altogether. These non-rubber options are becoming increasingly common in Jambi under the current environment with the very low price of rubber. This was extensively discussed in a recent workshop in Jambi looking at a broader view of production and biodiversity functions of jungle rubber agroforests. Both approaches, surprisingly or not, yielded very similar models. Perhaps this was partly because of the methodological requirements of the software (Netica) used. Regardless of the methods of collecting information, following five groups of factors play a role in farmers’ choice of rejuvenation method: • household economic status (including labour and need for continuity of income from the plot under consideration) • current productivity of rubber garden • new land availability • risk of pest damage • knowledge and confidence in the gap rejuvenation technique The need to assign probability for each combination of factors prior to instantiating a model in the probabilistic modelling approach is potentially problematic. As there was not reliable way to measure this objectively, we assigned these “belief” values based on our subjective assessment of the situation. Further verification in the field is likely to improve the reliability of the belief values and of the models. Looking at methodologies employed for collecting data, both approaches have strengths and weaknesses. The participatory approach was quicker and can be replicated relatively easily. However, variability among participant farmers and between villages poses some challenges methodologically in terms of interpreting data and drawing conclusions. Understandably, importance of certain factors in making farmer decisions was based on the group members’ perceptions, this is still qualitative and quantification of this type of information, although done by farmers themselves, was not always consistent. Further verification with other groups in these villages could improve these models. In the questionnaire survey approach, the frequency of farmer respondents mentioning a particular factor was used to measure the importance of that factor; however, this needs some careful rethinking as frequency count may not reflect severity of problems or importance of factors. However, this approach did provide reliable quantitative data that could be translated into a decision model. A combination of participatory approach and questionnaire approach is likely to lead to a more robust decision model than either approach alone can. The jungle rubber agroforestry system is in crisis at the moment. Coupled with pressure from other land use options (particularly oil palm), the very low price of rubber (lowest for the last 30 years), suggest that the dominant factor is economics. As pointed out in the workshop in Jambi, farmers’ ecological knowledge about their jungle rubber agroforestry was less influential in the process of making long term strategic decisions such as choosing between land use systems. 31 Suggestions for future developments 1. Further rationalization of decision determinants with appropriate nesting of causal factors of these determinants. Other participatory appraisal tools may be explored or developed if required. 2. Explore ways to combine group and individual survey approaches to acquire necessary information for modelling farmers’ decision making process. 3. Expand the decision options to include other land use forms, e.g. conversion to oil palm, choice between clonal rubber plantation or seedling plantation. 4. Calibration of the networks in different village scenarios. Running these models in front of the farmers will attract comments and suggestions that can improve these models significantly. 5. Explore and incorporate following variables where appropriate: alternative labour sources and sinks in the decision models (share tapping, hired labour, gotong royong); rubber price variability; availability of external support for land conversion; farmer categorization and its implications on their decision behaviour (e.g. the transmigrant Javanese and the local population have different perceptions and attitudes). 6. Consultation with experts in behavioral modelling domain to explore more efficient ways to gathering information and translating these into models. 32 3 REFERENCES Barlow, C., Jayasuriya, S. and Tan, C.S. (1994) The World Rubber Industry. Routledge, London. 364pp. Dixon, H.J., Doores, J.W., Joshi, L. and Sinclair, F.L. (2001) Agroecological Knowledge Toolkit For Windows: Methodological Guidelines, Computer Software And Manual For AKT5. School of Agricultural and Forest Sciences, University of Wales, Bangor, UK. Gouyon, A. (1999) The Sustainable Development of Tree Crops and the Prevention of Vegetation Fires in south Sumatra, Indonesia: Jungle Rubber. EU/Ministry of Forestry and Estate Crops, Indonesia. 61pp. Jensen, F.V. (1996) An Introduction to Bayesian Networks. UCL Press Limited, London. Joshi, L., Wibawa, W., Beukema, H., Williams, S., and van Noordwijk, M. (in press) Technological change and biodiversity in the rubber agroecosystem of Sumatra. Book chapter for J. Vandermeer (Ed.) Tropical Agroecosystems: New Directions for Research. Sinclair F.L. and Walker D. (1998) Acquiring qualitative knowledge about complex agroecosystems. Part 1: representation as natural language. Agricultural Systems 56: 341-363. Walker D. and Sinclair F.L. (1998) Acquiring qualitative knowledge about complex agroecosystems. Part 2: formal representation. Agricultural Systems 56: 365-386. Wibawa, G; S. Hendratno; M.J. Rosyid; A. Budiman and M. van Noordwijk (2000) The role of socio-economic factors in farmer decision making: factors determine the choice between Permanent Rubber Agroforestry Systems (PRAS) and Cyclical Rubber Agroforestry System (CRAS) by farmers in Jambi and South Sumatra. Progress report submitted to ICRAF SEA. 43 pp. Williams, S. E., Van Noordwijk M., Penot, E., Healey, J.R., Sinclair, F.L. and Wibawa, G., (2001) On-farm evaluation of the establishment of clonal planting stock in multistrata rubber agroforests. Agroforestry Systems 53: 227-237. 33