1
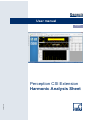
User manual English A4192-2.0 en Perception CSI Extension Harmonic Analysis Sheet Harmonic Analysis Sheet Document version 2.0 – February 2015 For Harmonic Analysis version 2.0.15056 For Perception 6.60 or higher For HBM's Terms and Conditions visit www.hbm.com/terms HBM GmbH Im Tiefen See 45 64293 Darmstadt Germany Tel: +49 6151 80 30 Fax: +49 6151 8039100 Email: [email protected] www.hbm.com/highspeed Copyright 2015 All rights reserved. No part of the contents of this book may be reproduced or transmitted in any form or by any means without the written permission of the publisher. A4192-2.0 en 1 Harmonic Analysis Sheet Table of Contents TABLE OF CONTENTS .......................................................................................................................... 2 1 INTRODUCTION ............................................................................................................................... 4 2 SCOPE .............................................................................................................................................. 4 3 GETTING STARTED ........................................................................................................................ 5 3.1 3.2 4 HARMONIC ANALYSIS SHEET ...................................................................................................... 8 4.1 4.2 4.3 4.4 4.5 4.6 4.7 4.8 4.9 4.10 4.11 4.12 4.13 5 GENERAL ..................................................................................................................................... 8 CALCULATIONS ........................................................................................................................... 11 HOW TO GET STARTED ................................................................................................................ 11 MODIFY AN EXISTING CONFIGURATION ......................................................................................... 15 REPORTING ................................................................................................................................ 18 HARMONIC ANALYSIS DATA SOURCES ......................................................................................... 19 HARMONIC ANALYSIS MENUS AND TOOLBARS .............................................................................. 22 PERSISTENCY............................................................................................................................. 23 W HEN DOES RE-CALCULATION HAPPEN ........................................................................................ 23 USE TIME MARKERS TO SHOW SELECTED CYCLE ....................................................................... 24 TABLE CREATION W IZARD ....................................................................................................... 25 EXAMPLE ON HOW TO USE THE @CYCLEDETECT() FUNCTION ................................................... 30 EXAMPLE USING THE FORMULA SHEET FOR CREATING TEST SIGNALS ......................................... 31 HARMONIC ANALYSIS RPC CALLS ........................................................................................... 33 5.1 5.2 5.3 5.4 5.5 5.6 5.7 5.8 5.9 2 INSTALLATION............................................................................................................................... 5 REQUIREMENTS............................................................................................................................ 7 RPC ISCALCULATING CALL ......................................................................................................... 34 RPC RECALCULATE CALL ........................................................................................................... 34 RPC CALCULATE AT SPECIFIED TIME CALL .................................................................................. 35 RPC CALL TO GET ALL TRACE NAMES AS USED BY THE CALCULATIONS........................................... 35 RPC CALL TO GET THE NUMBER OF CALCULATED HARMONICS ....................................................... 35 RPC CALL TO SET THE NUMBER OF HARMONICS TO BE CALCULATED .............................................. 35 RPC CALL TO GET THE NUMBER OF CYCLES USED BY THE HARMONIC ANALYSIS CALCULATIONS ...... 35 RPC CALL TO SET THE NUMBER OF CYCLES USED BY THE HARMONIC ANALYSIS CALCULATIONS....... 35 GETTING THE HARMONIC ANALYSIS CALCULATED RESULTS ........................................................... 36 A4192-2.0 en Harmonic Analysis Sheet A4192-2.0 en 3 Harmonic Analysis Sheet 1 Introduction Welcome to the Harmonic Analysis Sheet software manual. This document describes how to use this software application. The purpose of the software is to calculate the amplitude of the harmonic components of a periodic signal using the Fourier series. A special user interface is created to make this possible. The application is based on the Perception Custom Software Interface (CSI). This manual assumes you understand your Genesis HighSpeed Test and Measurement equipment, software and basic acquisition terminology. You may like to use the Perception User Manual as a reference. 2 Scope This Perception software extension enables the use of Harmonic Analysis Sheet with any GEN DAQ hardware. Via the new software the operator can do the following things: 4 Calculate a variable number of harmonics over a selected period of time. Period of time is selected by the active cursor and may use a cycle detect signal to find the correct start and end times. Show the harmonics graphically in a special display Show the numerical values of the harmonics in a table Calculate the Total Harmonic Distortion (THD) All used and calculated values are available as data sources. Therefore they can be used throughout Perception for displaying, reporting or special additional user calculations. Various wizards will help you to set up your configuration. One of the wizards is the table configuration wizard, via this wizard you can interactively configure a new or existing user table with results from the Harmonic analysis calculations. A4192-2.0 en Harmonic Analysis Sheet 3 Getting Started 3.1 Installation The Harmonic Analysis Sheet software is included with documentation on CD-ROM. Follow these steps to install the Harmonic Analysis Sheet software and documentation: Put the installation CD into your CD-drive. The following screen comes up: Click Next A4192-2.0 en 5 Harmonic Analysis Sheet Depending on the Perception version either a 32 or 64 bit install will be done. 6 Click Harmonic Analysis Sheet Click Next, and follow the on-screen instructions to complete the installation. When the process is complete, a message tells you that the option is installed. Click Finish. A4192-2.0 en Harmonic Analysis Sheet Now the software and manual should be installed on your PC. The Harmonic Analysis Sheet software is not a stand-alone program which can be started from the Windows Start menu! It is an integrated part of the Perception software program. Once you start Perception you will see an extra sheet called: Harmonic Analysis Sheet The manual has also been installed on your PC. It is a PDF file which can be opened via the windows HBM menu. If you cannot open this pdf file then you may have to install the Acrobat® Reader® which can be found on the installation CD. The manual is also available on the CD, you can read it before installing the software; to do this you just have to click User Manual Harmonic Analysis Sheet (See previous shown installation screen). 3.2 Requirements Harmonic Analysis Sheet software operates on any PC where Perception is running. The Harmonic Analysis Sheet application can only be used when the HASP® USB key CSI option has been enabled. You can check it has been enabled by going to the Help About dialog and click More…. The “More About Perception” dialog shows which options are enabled. The CSI option icon looks like: A4192-2.0 en 7 Harmonic Analysis Sheet 4 Harmonic Analysis Sheet 4.1 General The Harmonic Analysis sheet contains a Menu Panel, a standard Perception display, a standard Perception User table and a special display for showing the spectral components. 8 A4192-2.0 en Harmonic Analysis Sheet Before the calculations can be done the following things have to be prepared: The periodic signal of interest should be the active trace in the Harmonic Analysis Display. Optionaly a cycle detect signal can be defined, if not then the zero crossings of the signal itself will be used to find the correct cycle(s) The number of harmonics to be calculated has to be entered. The number of cycles used per calculation has to be entered. The cursor position and the cycle detect signal are used to find the correct cycle to be used for the calculations. The calculations can be done automatically after moving the cursor or can be done by pressing a special Re-Calculate button. The calculations will only be done automatically after cursor movement when you have not blocked the auto calculation via the Block Auto Calculation button. The results of the calculations are available as Perception Data Sources. These data sources can be used by a Perception User table: A4192-2.0 en 9 Harmonic Analysis Sheet The Spectrum waveform data source can be shown in a regular Perception display: But can also be displayed in the special spectrum display at the Harmonic analysis sheet: 10 A4192-2.0 en Harmonic Analysis Sheet 4.2 Calculations The Harmonic Analysis Sheet will calculate the various spectral components based on the Fourier series. The calculations are based on the following formulas: ∞ 2𝜋𝑘𝑡 2𝜋𝑘𝑡 𝑓(𝑡) = DC + ∑ (𝐴𝑘 cos ( ) + 𝐵𝑘 sin ( )) 𝑇 𝑇 𝑘=1 𝑇 = 𝑡2 − 𝑡1 𝐷𝐶 = 2 𝑡2 ∫ 𝑓(𝑡)𝑑𝑡 𝑇 𝑡1 𝐴𝑘 = 2 𝑡2 2𝜋𝑘𝑡 ∫ 𝑓(𝑡) cos ( ) 𝑑𝑡 𝑇 𝑡1 𝑇 𝐵𝑘 = 2 𝑡2 2𝜋𝑘𝑡 ∫ 𝑓(𝑡) sin ( ) 𝑑𝑡 𝑇 𝑡1 𝑇 𝐴𝐵𝑘 = √𝐴𝑘 2 + 𝐵𝑘 2 𝜑𝑘 = acos( 𝐴𝑘 ) 𝐴𝐵𝑘 The Total Harmonic Distortion (THD) uses the RMS of the function during the selected cycle ( 𝑈𝑟𝑚𝑠 ) together with the RMS of the fundamental (𝑈𝑟𝑚𝑠𝑓𝑢𝑛𝑑). The fundamental is the same as the first harmonic. 𝑇𝐻𝐷 = √𝑈𝑟𝑚𝑠 2 − 𝑈𝑟𝑚𝑠𝑓𝑢𝑛𝑑 2 × 100% 𝑈𝑟𝑚𝑠𝑓𝑢𝑛𝑑 𝑈𝑟𝑚𝑠𝑓𝑢𝑛𝑑 = 𝑇𝐻𝐷 = 4.3 𝐴𝐵1 √2 √𝑈𝑟𝑚𝑠 2 − 0.5 𝐴𝐵1 2 𝐴𝐵1 √2 × 100% How to get started When you have installed the Harmonic Analysis Sheet and then start Perception you will see the following rather empty screen: A4192-2.0 en 11 Harmonic Analysis Sheet Before you can continue you need to have at least one periodic signal which will be used for the analysis. This signal can come from a recording you just have recorded, or by opening an existing recording. So the initial steps you have to do when you start from scratch are: 12 Open an existing recording, or record a new one. We recommend you to use the formula database function @CycleDetect() for creating a cycle detect signal, see also chapter with example about the usage of the CycleDetect() function; This step is optional and can be skipped, then the zero crossings of the periodic signal itself will be used to determine the cycles. However often the results are better when using the @CycleDetect() function because it contains special logic to handle noisy signals. Press the Config Wizard button application. The following dialog will be shown: to initially configuring your Harmonic Analysis A4192-2.0 en Harmonic Analysis Sheet Now select the Periodic signal(s) you want to use for the calculations. Enter optionally the cycle signal, this is the signal which will be used to find the correct period (t1 and t2 in the formulas above) around the location of the first cursor. See information (@CycleDetect()) above. Enter the number of harmonics you want to be calculated Enter the number of cycles used per calculation. Your dialog can now look like: A4192-2.0 en 13 Harmonic Analysis Sheet 14 Press the OK button and the system will configure the Harmonic Analysis sheet and will also do the calculations. The result can look like: A4192-2.0 en Harmonic Analysis Sheet 4.4 You are now ready, after you moved cursor 1 the calculations will automatically be started again, using a new period. If you like the configuration you can save this in to a virtual workbench and reuse it later again. Modify an existing configuration If the default configuration is not what you want you can modify it. You can always add more traces to the Harmonic Analysis Display. The calculations are always done on all the traces in the display; if the active trace is the cycle signal then the program automatically will change the active trace to another trace. The cycle signal is the signal as defined via the Harmonic Analysis Properties dialog. The program assumes that the cycle signal can be used for all the traces you add to the Harmonic Analysis Display. Use the vertical or horizontal splitters to resize the displays or coefficients table. Press the Properties button to modify various properties. The Harmonic Analysis Properties dialog has four different tabs: o A4192-2.0 en Signals Tab You can change: The cycle signal The number of harmonics to be calculated The number of cycles per calculation 15 Harmonic Analysis Sheet 16 o Data Sources For some of the harmonic calculation results it is optional weather or not you want them to be available as data sources. These are: 𝐴𝑘 , 𝐵𝑘 𝑎𝑛𝑑 𝜑𝑘 (𝑖𝑛 𝑟𝑎𝑑𝑖𝑎𝑛𝑠 𝑜𝑟 𝑑𝑒𝑔𝑟𝑒𝑒𝑠) o Harmonic Display The X-axis of the Harmonic display can either be set to Frequency or Order. The spectral values can be the peak amplitude or the RMS of the amplitude o Coefficients Table st The coefficients table can show a percentage column, the 1 harmonic or fundamental frequency is set to 100% the other spectral components are related in percentage to this value. Use right mouse click on the displays to change the setup or properties. For the Harmonic Analysis Display you can use the Perception user manual to see what possibilities there are, however the spectral display called Harmonics Display works differently because it is not a standard Perception display. A4192-2.0 en Harmonic Analysis Sheet You can also use the toolbar buttons; they only appear when the spectral harmonic display is selected. Via the properties menu you can modify the Spectral display, most properties are selfexplaining and most of the time the default settings will be OK. Some properties which might be interesting are: o Header text You can modify the header text above the Harmonics Display; you can use data sources to create a dynamic header. If you have used the Configure Wizard you see the following header definition text: A4192-2.0 en 17 Harmonic Analysis Sheet Signal: '{Harmonic.Active.TraceName!Value}' Fundamental Frequency = {Harmonic.Active.F01!Value,####.!Units} Fundamental amplitude = {Harmonic.Active.Value.RMS.AB01!Value,####.!Units} This results in the following header: It is also possible to switch off the header. o Report Setup settings Those settings will be used when you want to use this display at a Perception report. For more information see chapter reporting. 4.5 You can modify the Coefficient Table; this table is a standard Perception user table, information on how to modify this can be found in the standard Perception user manual. Reporting The Harmonic Analysis sheet contains three main components, two displays and a table; all those components can be used by the report sheet to create nice reports. Read the Perception user manual to see how the standard Perception display and user table can be used by the report sheet. The spectral Harmonics Display however is not a standard Perception display and therefore it works different when you want to have this display at your report. You should use the report Image component and use the Harmonics Display as the local source. Steps for using the spectral Harmonics Display at a Perception report: 18 Before you start make sure the layout of your display is OK for you Go to the report sheet Select the Image in the Tools panel and drop it on the report Select the Harmonics Display as the local source A4192-2.0 en Harmonic Analysis Sheet Preferred setting for fitting is: Fit image proportionally however you can use a different setting as well. The best choice also depends on the harmonic display Report Setup settings. You just can experiment and find out what you like the most. An example of a report: 4.6 Harmonic Analysis Data Sources After the calculations have been done the various results are available as data sources. Per trace (as shown in the Harmonic Analysis Display) there will be a sub tree in the main entry called Harmonic. There is also always a sub tree called Active. This Active tree is a copy of one of the trace trees, and is controlled by the Harmonic Analysis Display. The results of the harmonic calculations of the active trace in the Harmonic Analysis Display are also available in the Harmonic.Active tree in the data sources. By doing this the Coefficients Table and the spectral Harmonics Display will be automatically updated when another trace is selected in the time display. Both these components are linked to this active data source tree. A4192-2.0 en 19 Harmonic Analysis Sheet In the picture above you can see that there are three results of three traces called i_1, i_2 and i_3 Next to this you can see the Active tree. All these trees have the same structure. Each sub tree has a TraceName field; this is the name of the trace used for the calculations. The sub trees are: Frequency F01 to F05 are the harmonic frequencies, where F01 is the fundamental frequency The number of frequencies depends on the selected number of harmonics to be calculated, in this example this was set to 5 Period The period contains: o DC is the DC component o Mean the mean value of the selected cycle o RMS the RMS value of the selected cycle o THD the Total Harmonic Distortion of the selected cycle o σ is the standard deviation of the selected cycle o t1 the begin of the cycle o t2 the end of the cycle Value This section contains information on the various harmonic coefficients: o Peak: The values are related to the signal Peak amplitude value, o Percentage: The values are related to the fundamental frequency o RMS: The values are related to the RMS value of the signal The Peak tree looks like: 20 A4192-2.0 en Harmonic Analysis Sheet In this example the number of harmonics is 5; the various data sources have the following meaning: A01 to A05 are Ak where k = 1 to 5 in the formula below. B01 to B05 are Bk where k = 1 to 5 in the formula below. ∞ 2𝜋𝑘𝑡 2𝜋𝑘𝑡 𝑓(𝑡) = DC + ∑ (𝐴𝑘 cos ( ) + 𝐵𝑘 sin ( )) 𝑇 𝑇 𝑘=1 AB01 to AB05 are ABk where k = 1 to 5 in the formula below. 𝐴𝐵𝑘 = √𝐴𝑘 2 + 𝐵𝑘 2 𝝋d_01 to 𝝋d_05 are 𝜑𝑘 in degrees where k = 1 to 5 in the formula below 𝝋r_01 to 𝝋r_05 are 𝜑𝑘 in radians where k = 1 to 5 in the formula below 𝜑𝑘 = acos( A4192-2.0 en 𝐴𝑘 ) 𝐴𝐵𝑘 PeakSpectrum_F is a waveform data source constructed from the spectral components the y-axis are the values AB01, AB02, etc... the x-axis is the frequency in Hz. 21 Harmonic Analysis Sheet PeakSpectrum_O is a waveform data source constructed from the spectral components the y-axis are the values AB01, AB02, etc... the x-axis is the order of the harmonic. Remark: The green marked data sources are optional; they can be disabled via the properties dialog! The Percentage tree looks like: The harmonic values are now expressed in percentage, where AB01 is set to 100%, the other values are related to this value. The RMS tree looks like: All the variables have the same meaning as the described for the Peak tree, except that now the values are RMS (= Peak values divided by √2). 4.7 Harmonic Analysis Menus and Toolbars The Harmonic Analysis sheet comes with the following menu and toolbar The menu items or toolbar buttons have the following functionality: 22 Load settings A4192-2.0 en Harmonic Analysis Sheet The configuration of the Harmonic Analysis sheet can be saved to and loaded from a Harmonic Analysis Settings file (*.pHAS). This mechanism is the same as for example the formula sheet where the configuration can also be saved and loaded from a *.pFormulas file. Via the Load settings menu you can however also load the Harmonic Analysis configuration from an existing Virtual Workbench or an existing Experiment. 4.8 Save setting Saving the existing configuration into a separate Harmonic Analysis Settings file (*.pHAS). Persistency The setup of the Harmonic Analysis Sheet is saved just like other setup settings of Perception into a virtual workbench file (pVWB) or recording file (pNRF). If you reopen a recording file or virtual workbench file the Harmonic Analysis sheet will be set the same as at the moment of saving. 4.9 When does re-calculation happen In the menu there are two buttons related to the Harmonic Analysis calculations: The first button is used to block or unblock the automatic recalculation of the Harmonics when moving st the 1 cursor. If the recalculations are blocked the button looks like: The Re-Calculate button can be used to force a re-calculation. The picture below shows the cycle signal (purple) and the periodic signal to be analyzed (yellow). The time markers t1 and t2 show the used cycle. When moving the cursor outside the current cycle a re-calculation will happen; this happens of course when the Block Auto Calculations is enabled. A4192-2.0 en 23 Harmonic Analysis Sheet 4.10 Use time markers to show selected cycle In the picture above you see two time markers which indicate the start and end of the used cycle. We will describe here how you can do this. 24 Make sure you have done a calculation and all information is available as data sources Add a time marker. You can do this by right mouse click at cursor 2 or use the toolbar button Change the properties of the time marker as follows: Create a second time marker and now use as label text t2 and set the Anchor 1(x) to Harmonic.Active.Period.t2 If you now move the cursor you will see the time markers are automatically repositioned to the correct start and end of the used cycle. A4192-2.0 en Harmonic Analysis Sheet 4.11 Table creation Wizard The table creation wizard can be used to create new or modify existing user tables. This wizard uses the data sources as created by the harmonic analysis calculations. You can interactively setup a table layout. The wizard can be started via the Create table Analysis sheet. button at the menu panel of the Harmonic The next page looks like: At the left you see the names of the traces as they are available in the Harmonic Analysis Display. However there is one extra item called -Active trace-, you should select this if you want to use the calculated results from the Harmonic.Active tree. A4192-2.0 en 25 Harmonic Analysis Sheet Select the traces from which you want to use the calculated results. In the picture below M, N, S and W are selected. The next wizard page shows the Header Lines selection. Via this page you can select which Header Lines per trace should be shown in the user table. The next wizard page you can select the columns definition. Per calculated order there will be a row added into the user table. Via this page you define which fields should be shown per order results line. 26 A4192-2.0 en Harmonic Analysis Sheet The next wizard page is used to define how the trace blocks should be layouted in the targeted user table. In the example below we have chosen for two trace blocks horizontal and also two blocks vertical. The next wizard page is used to see how the table will look like with the so far selected settings. This step is only for convenience and can also be skipped. If the layout is not what you expected you can go back and change the selections. A4192-2.0 en 27 Harmonic Analysis Sheet When you are pleased with the layout you can select an existing or create a new table and configure this table with your new configuration. The table selection entry shows all existing user sheets plus a -Create new table- selection. When you select this then a new user sheet will be created and a new user table will be added to this new user sheet. If you have done the correct table selection press the Configurate table button to actualy configure the selected table. Remark: If you configure an existing table the old content will be deleted completely and will be overridden by new data. If the Wizard does not excactly produce the content as what you want; you can always manualy change the user table. 28 A4192-2.0 en Harmonic Analysis Sheet For example if you do not like the formatting of the Frequency column in the table below. Select all the frequency cells you want to reformat: st Select the 1 menu option called Data Source Properties…, this will show the Format Data Source dialog. Now you can select the formatting of your choice. This will result in the following Frequency column: A4192-2.0 en 29 Harmonic Analysis Sheet 4.12 Example on how to use the @CycleDetect() function For better results we recommend to use the standard function called @CycleDetect(); The calculations might be faster and more accurate. Information on how the @CycleDetect() function works can be found in the Perception documentation. This chapter only shows you how this function can help you to get better results in doing the harmonic analysis calculations. It is very important to find the correct cycles when doing the harmonic analysis calculations, the @CycleDetect() function is specially built for finding the correct cycles. It contains special argorithms to make it perform better for noisy signals. One of the input parameters of this function is the Hysteresis input parameter. The example below shows you what this can bring to you. We have created a signal which is the addition of a 50Hz and a 200Hz sine signals, the amplitude of the 50Hz is 555mV and the 200Hz is 444mV. If we do the harmonic analysis without using a cycle detect signal we see the following results: The frequency of 61Hz is not correct, you can see from the picture that t1 and t2 are the found zero crossings which were used. If we now however use the @CycleDetect() function as shown below, we get better results. The detection Level is set to 0V and the Hysteresis is set to 300mV. The cycle signal is the red signal below. You can see that the calculated results are now correct because t1 and t2 are better. 30 A4192-2.0 en Harmonic Analysis Sheet The CycleDetect signal has also a parameter called SuppressTime, you can use this when you already know the main frequency to be expected, you then calculate the minimum required duration of half a cycle and use this value as the SuppresTime. 4.13 Example using the formula sheet for creating test signals To understand the working of the harmonic analysis calculations it might be helpful to generate some test signals using the formula sheet. The function @SineWave() can be used for this. The picture below shows an example of a simulated periodic signal by adding various sine waves with different frequencies and different amplitudes. A4192-2.0 en 31 Harmonic Analysis Sheet You now can use the signal Formula.Signal1 in the Harmonic Analysis sheet, for the cycle detection the formula Formuls.Cycle is used. The results are shown below. You now can check if the calculated amplitudes are simular to the amplitudes as entered in the formulas. 32 A4192-2.0 en Harmonic Analysis Sheet 5 Harmonic Analysis RPC calls This section describes the Harmonic Analysis RPC calls. These calls are only interesting for when you want to initiate the Harmonic Analysis calculations from within your own software program; for example from your own LabVIEW program. You can do the harmonic analysis calculations at a time specified by you; when the calculations are ready you can read the results into your own program. For more information on RPC and Perception we will recommend to get the appropriate information from the HBM web site section Products – Software – Perception – RPC. The RPC Harmonic Analysis Sheet implementation is using the general RPC function ExecuteCommand(): A4192-2.0 en 33 Harmonic Analysis Sheet There are a number of Harmonic Analysis Sheet related RPC calls: RPC call to check if the calculations are still busy RPC call to force a recalculation RPC call to do a calculation at a specified time. RPC call to get all trace names used by the calculations RPC calls to get and set the number of harmonics to be calculated RPC calls to get set the number of cycles used per calculation Note: You can only use RPC when the Remote API key item has been enabled! This item is a cost option and can be ordered at HBM. You can check if the option has been enabled by looking in the Perception main menu: Help – About Perception – More.. dialog. 5.1 RPC IsCalculating Call This RPC call is used to check if the Harmonic Analysis sheet is still busy with calculating the various harmonics. It is recommended to check this “IsCalculating” flag before you start a new calculation or change some settings. Below you see how you can create your own function to check if the calculations are still busy. private bool IsCalculating() { string strBusy; m_Perception.ExecuteRequest("HarmonicAnalysis", string.Empty, "IsCalculating", out strBusy); int nBusy = 0; if (int.TryParse(strBusy, out nBusy)) { if (nBusy != 0) return true; } return false; } In the above example you see that the ExecuteRequest function returns a string called strBusy. This string contains an integer value, where 0 means that IsCalculating is false and all other values mean that IsCalculating is true. 5.2 RPC Recalculate Call The recalculate command acts the same as what happens when the Re-Calculate button is pressed. The Harmonic Analysis Sheet will do a recalculating using the current cursor 1 position. The call looks like: m_Perception.ExecuteCommand("HarmonicAnalysis", string.Empty, "DoReCalculate()"); Where: private PerceptionCOM m_Perception = new PerceptionCOM(); Before you do this call, make sure that you are connected to Perception! m_Perception.SetServerAddress("localhost"); 34 A4192-2.0 en Harmonic Analysis Sheet m_Perception.ConnectToServer(); 5.3 RPC Calculate at specified time Call This call is used when you want to force a recalculation at specified time. The call looks like: m_Perception.ExecuteCommand("HarmonicAnalysis", string.Empty, "DoCalculateAtTime(0.02)"); The specified time in this example is 0.02 = 200ms. Attention: Use the correct decimal symbol! If you are not sure which decimal symbol you should use then check the Windows Region and Language settings. 5.4 RPC call to get all trace names as used by the calculations Via this call you get a list of all trace names used by the harmonic analysis calculations. string strTraceNames = String.Empty; m_Perception.ExecuteRequest("HarmonicAnalysis", string.Empty, "GetTraceNames", out strTraceNames); strTraceNames contains a semicolumn separated list of trace names. 5.5 RPC call to get the number of calculated harmonics You can use this call to get the number of calculated harmonics. string strHarmonics; m_Perception.ExecuteRequest("HarmonicAnalysis", string.Empty, "GetNumberOfHarmonics", out strHarmonics); strHarmonics is a string containing the number of harmonics. 5.6 RPC call to set the number of harmonics to be calculated You can use this call to set the number harmonics to be calculated. The example below sets the number of harmonics to 10. m_Perception.ExecuteCommand("HarmonicAnalysis", string.Empty, "SetNumberOfHarmonics(10)"); 5.7 RPC call to get the number of cycles used by the harmonic analysis calculations You can use this call to get the number of cycles used by the harmonic analysis string strNumberOfUsedCycles; m_Perception.ExecuteRequest("HarmonicAnalysis", string.Empty, "GetNumberOfUsedCycles", out strNumberOfUsedCycles); strNumberOfUsedCycles is a string containing the number of used cycles per calculation. 5.8 RPC call to set the number of cycles used by the harmonic analysis calculations You can use this call to set the number of cycles used per calculation. A4192-2.0 en 35 Harmonic Analysis Sheet The example below sets the number of harmonics to 2. m_Perception.ExecuteCommand("HarmonicAnalysis", string.Empty, "GetNumberOfUsedCycles(2)"); 5.9 Getting the Harmonic analysis calculated results As you can read above all calculated results are available as data sources; see chapter “Harmonic Analysis Data Sources”. Via the RPC commands DSGetNumericalValue, DSGetUnits and DSGetStringValue you can read them from Perception. 36 A4192-2.0 en Harmonic Analysis Sheet The code below shows how the peak values of the harmonics and corresponding frequencies can be read: for (int i = 1; i <= nHarmonics; i++) { strDSPathName = string.Format("Harmonic.Active.Value.Peak.AB{0:00}", i); m_Perception.DSGetNumericalValue(strDSPathName, out dHarmonicValue, out TimeOfUpdate); m_Perception.DSGetUnits(strDSPathName, out XUnit, out YUnit); strDSPathName = string.Format("Harmonic.Active.Frequency.F{0:00}", i); m_Perception.DSGetNumericalValue(strDSPathName, out dFrequency, out TimeOfUpdate); listBox1.Items.Add(string.Format("{0:00}: {1} {2} - {3} Hz", i, dHarmonicValue, YUnit, (int)dFrequency)); } The output of this code can look like: A4192-2.0 en 37 Harmonic Analysis Sheet Head Office HBM Im Tiefen See 45 64293 Darmstadt Germany Tel: +49 6151 8030 Email: [email protected] France HBM France SAS 46 rue du Champoreux BP76 91542 Mennecy Cedex Tél:+33 (0)1 69 90 63 70 Fax: +33 (0) 1 69 90 63 80 Email: [email protected] UK HBM United Kingdom 1 Churchill Court, 58 Station Road North Harrow, Middlesex, HA2 7SA Tel: +44 (0) 208 515 6100 Email: [email protected] USA HBM, Inc. 19 Bartlett Street Marlborough, MA 01752, USA Tel : +1 (800) 578-4260 Email: [email protected] PR China HBM Sales Office Room 2912, Jing Guang Centre Beijing, China 100020 Tel: +86 10 6597 4006 Email: [email protected] A4192-2.0 en © Hottinger Baldwin Messtechnik GmbH. All rights reserved. All details describe our products in general form only. They are not to be understood as express warranty and do not constitute any liability whatsoever. measure and predict with confidence 38 A4192-2.0 en