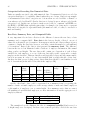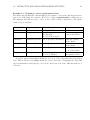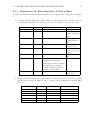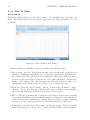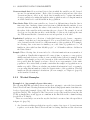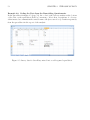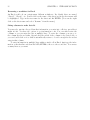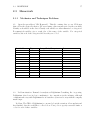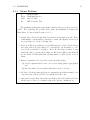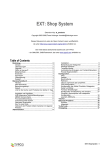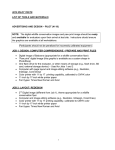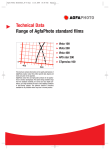
1
Chapter 2
Understanding the Role of Data1
Quantifying the world is often a bit more involved than simply determining how much there
is of variable A or how many there are of variable B. The complication: ”it depends.” There
may be other variables C or D that need to be taken into consideration. For example,
suppose you are the CEO of a large company and you want data on the salaries of your
employees in order to ensure fairness and equity, provide incentives, control costs, and yet
keep your company competitive. A simple approach: How much does employee 23 earn?
employee 24? Etc. This is certainly useful data to have at hand–you know how much of
variable A and how many of variable B. But that is not enough. As CEO, it would be much
more useful for you to know, in addition, the employee’s department, years of experience at
the company, job grade, educational level, age, and gender. What you really want to know
is how much of A and how many of B broken down by categories C, D, E, F, G, and H.
Quantifying the world, then, does not necessarily mean thinking of the world in terms of
numbers only, but also in terms of categories. We will learn how to distinguish and classify
various kinds of variable data in the first section of the chapter. In the second section, we
will practice coding these differing data in an EXCEL spreadsheet.
• As a result of this chapter, students will learn
√
√ The differences between numerical and categorical data
√ The importance of attending to units and categories
√ How to extract data from a problem situation
The purpose of identifiers in a data set
• As a result of this chapter, students will be able to
√
√ Design data collection forms
√ Code numerical and categorical data from a data collection form
√ Set up an Excel spreadsheet
√ Correctly enter data into an Excel spreadsheet
√ Properly define the required variable names in Excel
Insert comments about data variables
1
c
2011
Kris H. Green and W. Allen Emerson
33
34
2.1
CHAPTER 2. THE ROLE OF DATA
Extracting Data from the Problem Situation
In the previous chapter we learned how to define a problem. We recognized that a real-world
problem is often embedded in an interconnected web of events taking place in time and space
usually involving people, objects, or machines. To gather meaningful data about a problem
we must think of how the data is related to its surroundings. For example, in order to gather
the kind of data that we can use to identify and then correct excessive wait times at Beef
n’ Buns, we need to consider when a ”wait time” begins and when it ends and then connect
these wait times to the types of orders being filled during these wait times because not all
orders are created equal with regard to wait times.
In order to gather the kinds of data that we can use to identify and then correct excessive
wait times, we need to understand why not all orders are created equal with regard to wait
times. And one of the first things that we recognize as we try to understand this connection
is that there seems to be an inherent difference between wait-time data and type-of-order
data. In this section we move ahead by learning how to recognize different types of data in
a problem situation and how to record them on data collection forms. This is the process of
extracting data from the problem situation.
Before we can complete the data extraction process by recording the data on data collection forms, we need to know exactly what type of data we are recording in order to know
either ”how many of what” to mark down or what category to check, depending on whether
the data is numerical or categorical.
Types of Data
As we mentioned above, not all data has to do with numbers. Data that does have to do with
numbers, that is, counting or measuring something, is called numerical data and that which
has to do with classification or categorizing something is called categorical data. Examples
of numerical data are salaries, sales, heights, weights, number of customers, number of
children. Examples of categorical data are gender (male, female), job classifications (e.g.
office staff, management, vice president), day of week, marriage status. Sometimes it is
obvious what type of data we are dealing with in a particular problem situation; other times
we have to make a conscious decision as to whether we want to record our data numerically or
categorically. In the latter case, we have to ask ourselves if it would be more beneficial for our
analysis to retain the numerical differences between the individual things we are observing
or whether it would be better to group them into categories. Each has its advantages.
Almost any type of numerical data can be converted into categorical data by some sort
of classification scheme. For example, individual numerical heights could be lumped into
short, medium, tall, and very tall categories by some sort of scheme, such as, all heights
below 60 inches will be placed in the ”short” category, all heights between 60 inches and 68
inches will be placed in the ”medium” category, etc. Categorical data, however, cannot be
converted to numerical data, however. Take, for example, the gender categorical data. It
would not make sense to find the add-up-and-divide average of the categories ”female” and
”male” even if we decided to think of a female as ”0” and a male as ”1.” It would make no
sense to talk about (0+1)/2 or .5 as gender. In general, we can distinguish numerical and
categorical data by this rule of thumb: if you can do meaningful arithmetic with the data,
2.1. EXTRACTING DATA FROM THE PROBLEM SITUATION
35
it is numerical; if not, it is categorical.
When coding data, note that numbers can be used as codes for categorical data: E.g. 0
for male, 1 for female or 1-5 in opinion poll rankings. Without prior knowledge or provided
information, it is often difficult to distinguish between numerical and categorical data: E.g.
Age: 59, 52, 58, 12, 43, 23. This data could either be numerical or categorical, depending on
the purpose and design of the study. That is, if it were to be considered numerical, 59 would
have a different impact on the sum of all the ages, for instance, than would 52, whereas if
age were considered to be categorical data, then both 59 and 52 might be lumped into the
”middle-aged” category, whereas 70 and 80 might be counted in the ”senior” category.
Each type of data, numerical and categorical, has two subtypes. Numerical data can be
either discrete or continuous and categorical data can be either ordinal or nominal. In
short, continuous numerical data can take on values that fall anywhere within a continuous
range of numbers, whereas discrete numerical data can only take on particular number values
and nothing in between them (non-continuous); with ordinal categorical data, the categories
are related by some sort of ”more than” or ”later than” or ”better than” structure, whereas
nominal categorical data (name-only categorical data) does not have any kind of inherent
ordering structure (see Definitions and Formulas for examples). There are cases, however,
in which some of these distinctions break down, but the point of trying to make them in the
first place is that they give us more than just a way of focusing on and thinking about data
as we attempt to extract it from a problem situation. They also give us the vocabulary to
talk about it, especially when we are deciding how to record it.
The Units for Recording Numerical Data
Numerical data is recorded in units. In some cases, there is more than one choice for the
units. For example, bottled soft drink could be measured in metric units or conventional
English units. A bottle with volume 500 ML is 16.9 Fl oz., which could be measured as .5 L
or as .53 qt. The business manager must be constantly aware of units. For example, if you
hurriedly ran your eyes over an invoice and saw an order of 10000 bottles of soft drink, each
recorded on the invoice as having a volume of .5, you might assume that the order was for
10000 half-quart bottles. But if the unit is a liter, then you would be making a 200 quart
error.
The issue of units, however, is more fundamental than committing oversight errors. The
choice of units can change the nature of the data we are extracting from a problem context.
The different units in the bottled soft drink example all measure the amount of liquid as
volume. We could have measured the amount of soft drink in units measuring the mass of
liquid (grams or kilograms) or its weight (in pounds). Each unit, mL or grams, measures a
quantity of water, but the units of data, whether measured in volume or in weight, determine
the ease with which we can use incorporate the data into other problem contexts. For
example, if the soft drink is being transported, there may be a weight limit, but the units
are in mL (volume). In this particular case, we could, with time and effort, make the
necessary conversion from volume to weight to see if our shipment is under the weight limit.
The point is that we have to give some thought as to how our data might be used in the
future when we go about extracting it from its context.
36
CHAPTER 2. THE ROLE OF DATA
Categories for Recording Non-Numerical Data
Units are usually associated only with numerical data. Non-numerical data is recorded in
categories that have to be explicitly defined unless they are obvious. Gender is an example
of non-numerical data whose categories are obvious when recorded as Male or Female or
even when recorded as M and F. Gender data is not obvious, however, when recorded in the
categories 0 or 1. In this case, we have to make a note (called a ”comment” in EXCEL; see
the HOW to GUIDE) that explicitly states that, for example, 0 is being used to represent
Male and 1 is being used to represent Female (the numbers could, of course, be reversed for
male and female).
Raw Data, Summary Data, and Computed Fields
A very important idea in data collection is the difference between the raw data, a data
summary, and a computed field. Raw data is the data as directly collected: one set of
values for each variable per observation. In newspaper articles and other readings, it is not
common to display the raw data, however, as it may contain thousands (or even millions)
of observations. Instead, the data is often presented in summary form. The difference
between the two is best illustrated with a database of employee information, like annual
salary, gender, and height. The raw data would contain one observation of each of these
variables for each employee, so a row of the raw data table would correspond to a single
employee in the database. This raw data file would typically be large and have many entries,
but it is necessary in order to do any data analysis that you have this file of raw data.
Another clue that you are looking at raw data is that there should be an identifier for each
set of observations (in the table below, this is the employee ID.)
Employee
ID
90020
90034
92300
Annual
Salary
$1,000
Gender Height Gender
31.5
40.3
65.1
Male
Female
Male
Inches
68
64
72
(0=Male,
1=Female)
0
1
0
Height
Range
Monthly
Salary
$
Medium
Medium
Very Tall
2,625
3,358
5,425
On the other hand, data could be represented in a summary form by reporting the
number of male or female employees or the average salaries of male and female employees
or the number of employees over a certain height. In a summary, notice that we cannot
tell anything about individual employees; we have information about the aggregate set of
employees, instead.
Gender Count Average Height (inches)
Male
452
69.4
Female
309
65.6
The examples above also illustrate the idea of a computed variable (Gender as a 0 or
1; height range as a descriptor). In these cases, someone probably collected the raw data
2.1. EXTRACTING DATA FROM THE PROBLEM SITUATION
37
on the employees in terms of their heights and genders, then added a new variable that
compares the raw data (Gender as male or female; actual height in inches) to a set of values
and assigns a new number or name based on the employee’s information. Another example
of this would be the monthly salary variable above. Once we have the annual salary, we can
compute the monthly salary easily, we just divide by 12. And while the variable contains
no new information compared to the original raw data, it does show the information in
a different way. This might be useful if, for example, we are trying the put together a
project proposal that would involve some of these employees being assigned to the project
for different amounts of time than a full year; having the monthly salary would allow us to
cost out the project more accurately.
2.1.1
Definitions and Formulas
Numerical data Data that can be arithmetically combined in meaningful ways, that is,
added, subtracted, multiplied, divided, or averaged. E.g. number of children, age,
number of years of experience, salary, sales, acreage
Discrete numerical data This type of numerical data takes on whole number values and
usually represents a count of some kind. ”In-between” values do not, therefore, do not
make sense. E.g. number of children, age, number of years of experience. Note: This is
numerical data because adding, for example, numbers of children, ages, or years makes
sense. It is discrete because we usually round off age or years of experience to a whole
number of years for data collection in business
Continuous Numerical Data Apart from rounding, this type of numerical data could
theoretically take on any number of in-between values because it is not counting discrete things; rather it measures things whose magnitudes fall on a continuous scale.
E.g. salary, sales, weight, acreage. Note: This is numerical data because ”averaging”
salaries, sales, or weights makes sense. Weight and acreage are probably the only data
that clearly fall on a continuous scale, depending of course on the accuracy of the
scale (tenths, hundredths, thousandths, etc). Salary and sales are considered continuous for all practical purposes, because, theoretically, they could be broken down into
hundredths of a dollar (cents), which are not whole numbers.
Categorical data Data that is used to classify, type, or categorize groups of individual
things. E.g. Preference rankings (1, highest preferred, 5, least), Gender (male, female);
State (NY, WI, TN); Marriage status (M, U, D). Such data may be recorded (or coded)
using any kind of symbol: numbers, words, or letters.
Ordinal categorical data In addition to classifying or categorizing, this type of data also
has an inherent order that provides additional information. E.g. The numbers 1
through 5 in an opinion poll where 1 is the most preferred and 5 the least preferred
Note: This is categorical data because adding ”most preferred” to ”least preferred”
does not make sense. Also, the integers 1-5 are not used to ”count” data and hence do
not constitute discrete numerical data
38
CHAPTER 2. THE ROLE OF DATA
Nominal categorical data This type of categorical data contains no inherent order but
merely classifies or categorizes information. E.g. Gender (male, female); State: NY,
WI, TN; Marriage status (M, U, D)
2.1.2
Worked Examples
The worked examples below should help you decide what type of data you are extracting
from a problem situation as well as the units or categories in which it should be recorded.
Example 2.1. Salary Data: Type and Units
Consider organizing data about the salaries of employees at a company. We might be interested in each employee’s salary as well as his or her position with the company and
experience. Our analysis, and thus our findings, will clearly depend on what data we collect,
but just as importantly, the analysis will depend on how we record, or code, that data.
Even with just a few simple variables in our data, we have many options to consider. In the
first table, we record the data much as you might initially expect.
Variable
Employee
Salary
Dept
Type
IDentifier
Numerical continuous
Categorical nominal
YrsExp
Numerical Discrete
Units/Categories
No units
Dollars (e.g. $34856)
S = Sales
P = Purchasing
A = Accounting
R = Research
Years
Notes
Employee ID Number
Annual Gross Salary
Department in which
employee works
Years of working experience
(not necessarily all
with this company).
There is nothing wrong with this fairly straightforward approach to recording the data.
However, the salary data requires a good deal more information than probably needed, and
the years experience will vary widely across the company. So one might consider simplifying
these, recording the salary in thousands of dollars and treating experience as a categorical
variable.
Variable Type
Units/Categories
Notes
Salary
Numerical continuous Thousands of Dollars
Annual Gross Salary
(e.g. 34.9)
Dept
Categorical nominal
1 = Sales
Department in which
2 = Purchasing
employee works
3 = Accounting
4 = Research
YrsExp Categorical Ordinal
New: < 3 years
Years of working experience
Junior: 3 to <10 years
(not necessarily all
Middle: 10 to < 20 years with this company).
Senior: 20 or more years
2.1. EXTRACTING DATA FROM THE PROBLEM SITUATION
39
Note that we change how we can analyze the data we have collected pertaining to the
years-of-experience above by changing the data type, that is, the way we record the data.
Recording this as a number pinpoints the typical age of an employee in finding the mean age
because YrsExp is numerical data, whereas we cannot find such a number when the data is
coded categorically. On the other hand, the categorical coding offers us a broader picture
of the company’s workforce experience by counting the number of employees falling in the
junior, middle, and senior categories. Such a summary of the data would be more difficult
if the data were recorded in actual years of experience. For maximum flexibility, one might
even consider having two variables for years of experience: In one, the experience is recorded
in as in the first table, using the actual years; in the second version of the years of experience
variable, it is recorded categorically to allow for easier data summaries to be produced. In
fact, one could record the actual age and also include a second variable which is computed
from the first to be a descriptino of the age.
Example 2.2. Designing an observational data collection form
Consider the following request from Jenny Eggs, regarding her restaurant.
To:
From:
Date:
Re:
Oracular Consulting
Jenny Eggs, Owner of Over-Easy Diner
Today
Seating complaints
As you may be aware, my restaurant, Over-Easy Diner, has been serving
breakfast and lunch to the citizens of this fine town for the last 50 years. Recently
I have overheard a number of comments form the servers indicating that the customers are complaining to them about the comfort of the chairs in the dining
area. Last week an anonymous editorial appeared in our local paper branding us
”The Worst Seat in Town”. In order to better understand the potential causes
of customer discomfort, I would like for you to collect some data for me. I am
particularly interested in the following:
• What are the actual seating patterns (number of people in each seating area)?
• Where did the customer sit?
• When were the customers in the restaurant?
• What are the customers’ opinions of the restaurant layout?
• What are the customers’ opinions of chair comfort?
Over Easy serves breakfast and lunch. There are three distinct seating areas, the Nook,
the Cranny, and the Hole, where diners seat themselves. The manager wants to redesign
40
CHAPTER 2. THE ROLE OF DATA
the cafeteria and would like to collect data on the seating occupancy patterns in the three
dining areas every day over a two-week period beginning on Monday, June 9. Our goal is to
first design an observational data collection form, including an explanation of the units and
categories.
Step 1. Decide what data is to be collected
Variable
Date
Type
Numerical discrete
Units/Categories
MM/DD/YYYY
Time
Nook
M: Mon, F: Fri
T: Tues, S: Sat
W: Wed, N: Sun
H: Thurs
Numerical continuous HH:MM AM/PM
Numerical discrete
Customers
Cranny
Numerical discrete
Customers
Hole
Numerical discrete
Customers
Notes
Date
observations
were recorded
Day of Week Categorical
How many customers
are seated in ”Nook”?
How many customers
are
seated
in
”Cranny”?
How many customers
are seated in the
”Hole”?
Step 2. Design an data collection form for the OBSERVATIONAL data.
A simple data collection form for seating patterns might look like the sheet below, with
columns for each of the variables, and rows for each set of observations. In this case, we have
an observational form; someone will have to look around the restaurant at particular days
and times and record the data. Such observational data, no matter how they are gotten, are
essential for understanding what is actually happening in a problem situation.
BLANK DATA COLLECTION FORM FOR OVER EASY
Date
Day
Time
Nook Cranny Hole
(MM/DD) (MTWHFSN) (HH:MM AM/PM)
COMPLETED DATA COLLECTION FORM FOR OVER EASY
Date
Day
Time
Nook Cranny Hole
(MM/DD) (MTWHFSN) (HH:MM AM/PM)
06/12
M
09:30 AM
23
24
16
06/15
H
01:00 PM
28
15
34
etc.
2.1. EXTRACTING DATA FROM THE PROBLEM SITUATION
41
Example 2.3. Designing a survey questionnaire form
The memo suggests that the cafeteria manager also wants to collect some customer preference
data before remodeling the cafeteria. We need to design a questionnaire for this purpose.
The manager will offer free juice, coffee, or side orders to induce customers to fill out the
forms, one per customer.
Variable Name Type
FirstVisit
Categorical
Room
Categorical
ChairSize
Numerical discrete
Units/Categories
Y=Yes, N = No
P = Plenty
E = Enough
N = Need more space
1 to 4 (1=great, 4=terrible)
ChairCushion
Numerical discrete
1 to 4 (1=great, 4=terrible)
ChairFit
Numerical discrete
1 to 4 (1=great, 4=terrible)
Keep
Categorical
Y=Yes (keep)
N = No (combine)
Notes
Is this your first visit?
Is there enough room
between the tables?
Rank the comfort
of the chairs.
Rank the cushioning
of the chairs.
Rank the fit to the
body of the chairs.
Should we keep
the separate areas?
A possible survey form might look like the one below. Notice that this data is all opinion
data. This is why we need multiple methods of data collection to triangulate the data; this
gives us information and helps us corroborrate data from each of the different methods of
collection.
42
CHAPTER 2. THE ROLE OF DATA
Over Easy Customer Satisfaction Survey
Please circle your answers:
1. Is this your first visit to Over Easy? Yes
No
2. Is
there
enough
room
Plenty Adequate Need more space
between
the
tables?
3. Please rank the comfort of the chairs on a scale of 1 to 4 (1 is ”great;” 4 is
”terrible”)
(a) Size:
1
2
Great
3
4
Terrible
(b) Cushioning:
1
2
Great
3
4
Terrible
(c) Fit to Body:
1
2
Great
3
4
Terrible
4. Should we keep the Nook, Cranny, and Hole areas, or should we make one large
area?
Yes, keep them
No, make one large area
Doesn’t matter
5. Any additional comments about your experience at Over Easy?
Note: Questions 1, 2, and 4 collect categorical nominal data. Question 3 collects categorical ordinal data
2.1. EXTRACTING DATA FROM THE PROBLEM SITUATION
2.1.3
43
Exploration 2A: Extracting Data at Beef n’ Buns
Consider the situation at Beef n’ Buns that has been discussed in the examples from chapter
1.
1. Complete the following table, then design an observational data collection form for
recording the following data. Be sure to describe the units or categories for each:
Variable Name
Date
ArrivalTime
Type
Units/Categories
MM/DD/YYYY
Time customer
arrives in Restaurant
Time customer
begins placing order
Time customer
receives order
(to be computed
from above raw
data)
Drive in or walk
in?
OrderBegin
OrderCompletion
Wait time
Computed
Venue
Type of order
Day of week
Notes
1=small, non-labor intensive
2=small, labor-intensive
3=medium, non-labor intensive
4=medium, labor intensive
5=large, non-labor intensive
6=large, labor intensive
Computed
(to be computed
from date)
2. Design a customer opinion survey questionnaire to extract opinions of customers regarding
customer service at Beef n’ Buns. Be sure to complete a table defining your variables, units,
and codes.
Variable Name
Type
Units/Categories Notes
44
CHAPTER 2. THE ROLE OF DATA
2.1.4
How To Guide
Excel desktop
This lesson will introduce you to the Excel desktop. To begin this lesson, start Microsoft
Excel. The Microsoft Excel window appears and your screen will look similar to the one
shown here.
Figure 2.1: Microsoft Excel 2007 Desktop
Starting at the top of the Excel desktop, you will see the following items:
• The program control bar: This displays the name of the current workbook and provides
buttons for minimizing, maximizing, and closing the program on the right-hand side.
The left-hand side has a quick button for saving the workbook (the disk icon), undoing and redo-ing actions (the looping arrows), and a pull-down menu to customize the
interface. The extreme left of the program control bar has a Microsoft Office icon;
clicking this accesses features that let you save, open, or print workbooks.
• Menu tabs: These tabs, labeled ”Home”, ”Insert”, ”Page Layout”, ”Formulas”, ”Data”,
”Review”, ”View”, and ”Add-ins”, control the ribbon below. Unless you have installed
an Add-in (like StatPro) you may not see the last of these options.
• Ribbon: The ribbon (formerly the toolbar) has icons for most of the actions you might
need to perform in Excel. Selecting different menu tabs changes the icons on the ribbon
to the ones associated with that tab. Usually, these are grouped together. Hovering
the cursor over any of the icons provides additional information about the tool.
• Formula Bar and Name Box: The formula bar has two regions. The left area (the
Name Box) allows you to select, view, or name cell ranges in the current worksheet.
2.1. EXTRACTING DATA FROM THE PROBLEM SITUATION
45
The right area (the Formula Bar) displays the formula entered into the current active
cell, or allows you to type in a formula.
• Workspace: The main area of the screen is a grid of cells into which you enter information, data, and formulas. Each of these cells has a name, identified by first the column
(A, B, C, etc.) and then the row (1, 2, 3, etc.) So cell D6 is in the fourth column
(labeled D) and the sixth row.
• Worksheet Control: This area, just below the workspace, has tabs to select different
worksheets in the workbook.
• Status Bar: The status bar provides quick statistics for the region of data that is
currently selected in the worksheet along the right side. Along the left side is where
you will see error messages and notifications.
Saving and Opening Files
Remember, you should save your work early and often to avoid loss of data. Office 2007 saves
files in a new format compared to old versions of Office. When saving, make sure you know
where you are saving the file and what format you are using. For example, using the ”Save
As...” feature allows you to change the format of the file. To do this, use the pull-down
menu below the file name to select a different file type.
Figure 2.2: Microsoft Excel 2007 file menu
To open a file, you can either double-click the file icon in the browser or the Windoes
explorer, or you can open the file from within Excel. Simply open the file menu and choose
”Open”; then browse through the folders on the computer to locate the file you want.
46
CHAPTER 2. THE ROLE OF DATA
A Note About Naming Files
It is also helpful when saving files to name them meaningfully. If you name the first Excel
workbook for every course you take ”File1” you will have a lot of files with the same name.
It is helpful to come up with a naming convention that clearly helps you locate the files you
want. For example, you could name all your files with the following convention: Class+First
Initial+Last Name+Assignment. Then, a file named
MSTI130 KGreen Memo01.xlsx
clearly is the first memo assignment written by K. Green in the MSTI 130 class. If your
instructor collects work electronically, she may have a particular file-naming convention that
she expects you to use in order to make tracking everyone’s work easier. Be sure to check
your syllabus or ask your instructor.
Folders and Organization
When saving your files, it also helps to have some sort of plan for organizing the files. In
Windows, the way to do this is to use folders. These can be named anything you want, and
you can have as many folders inside a folder as you want. You can also put folders inside
other folders. Just be careful: it’s easy to create such a complex nest of storage folders that
you cannot remember where your files are.
2.2. ORGANIZING DATA IN SPREADSHEETS
2.2
47
Organizing data in spreadsheets
We are now at the place where we have learned something about extracting data from a
problem situation and recording it on data collection forms. Recording ”live” data that
we have extracted from a problems situation, however, may not be the only way to gather
the data we need to solve problems. Some or all of the data could have been collected by
someone else and stored in computer data banks or archived in some other medium. By
whatever means we have gathered our data, we need to input that data into a computer
program so that we can use that program to analyze the data. The most common kind of
program that is used in business to analyze data is the spreadsheet, and the most commonly
used spreadsheet is Microsoft Excel. This section will teach you how to code and organize
your data so that Excel can process it.
Data must be entered into an Excel spreadsheet in rows and columns. The intersection of
a row and column is called a cell. Each column in a spreadsheet contains the data associated
with a variable, e.g. salary, or age or gender or opinion. An observation is a complete
row of data and contains all the information about a particular individual or a particular
case of what we are studying.
EmpID
90020
90034
92300
92305
92307
92455
94500
94700
94545
AnnualSalary
Gender Height
Dept
YrsExp
(thousands of dollars)
(inches)
(years)
31.5
Male
68
Sales
5.4
40.3
Female
64
Research
0.5
65.1
Male
72
Admin
15.1
40.1
Male
69
Sales
6.1
32.6
Female
68
Admin
7.8
51.9
Male
70
Sales
3.1
28.9
Male
65
Research
3.2
44
Female
62
Sales
9.1
49.9
Male
71
Admin
8.3
There are a few rules that must be followed when entering data in a spreadsheet (see the
How To Guide). The main considerations about spreadsheet organization are these:
1. Every column of data must have a variable name at the top of its column. This is
the purpose of the column headings ”EmpID”, ”AnnualSalary”, ”Gender”, ”Height”,
”Dept”, and ”YrsExp” in the table above.
2. Every observation should have an identifier, usually at the beginning of its row. The
column ”EmpID” serves this purpose in the data above, clarifying to which employee
a particular row of data refers.
3. A data cell can contain only one kind of information; that is, two variables cannot
share the same cell. We will see examples of this later.
4. If the data is numerical, the units should appear in the column heading or a comment,
not as part of the data entered into the cell. The information in parentheses for each
variable defines the units in the table above, e.g., years, inches, thousands of dollars,
etc.
48
CHAPTER 2. THE ROLE OF DATA
2.2.1
Definitions and Formulas
Identifier A column of data in a spreadsheet, usually the leftmost column, that contains a
name or other piece of information for the purpose of identifying each set of observations
separately. Identifiers should be unique; that is, no two observations should have the
same identifier. Examples include: names of employees, social security numbers, and
home addresses. An identifier gives us a way of quickly and accurately locating all
the information about a particular observation from among all the observations in
the data set, something that we quite frequently have to be able to do in our analysis.
Sometimes an identifier is nothing more than what its name implies, a way of identifying
a particular observation, which is certainly important. In other situations, however,
identifiers might be coded in a way so that they do indeed contain information that
can be used for data analysis beyond their identification purpose. The point is that
the analyst must be on guard when it comes to identifiers. A column of identifiers
may look like data, and may even have a heading that looks like a variable name, but
because they are no more than identifiers they should not be included along with the
actual data when performing analysis. To do so might give rise to some very peculiar
- and erroneous - results. For the purposes of this book, all observations should have
identifiers in the spreadsheets.
Row (Observation or Record) Each row of a spreadsheet contains the observations of
the different variables that are all associated with each other. If data is collected
on people including name, age, education level, and salary, then a complete set of
information is called a record or observation of the variables. Usually the term record
is used in databases, and the term observation is used in statistical settings. Row
refers to the way the information is specifically organized on a spreadsheet.
Column (Variable or Field) Each column of a spreadsheet should contain information
on a single variable. In database terms, variables are called fields.
Coding This is the process by which the data is converted from information into entries on
a spreadsheet for analysis. For example, when collecting information on the gender of
employees, the data could be coded in several ways:
• You could enter the words ”Male” or ”Female”
• You could enter ”M” or ”F”
• You could enter ”0” for male, ”1” for female
• You could enter ”0” for female, ”1” for male
The choice you make determines the way the data is coded. It is a good idea to include
a comment for each variable that explains how it has been coded and what each code
means.
Computed Field A data item that is not collected directly from the problem situation, but
computed based on the collected data. For example, we might collect an employee’s
BirthDate, then compute his/her age as of a certain date.
2.2. ORGANIZING DATA IN SPREADSHEETS
49
Cross-sectional data Cross sectional data is data in which the variables are all observed
at some ”frozen instant in time”. Each of the observations is independent of the other
observations (has no effect on it). Such data is usually used to capture information
about a population by cutting through the entire population and recording information
on all the variables for each individual in the population.
Time Series Data If the same variables are observed at different times, then the data is
time series data. Analysis of time series data is more difficult than the analysis of cross
sectional data since usually the values of the variables at one time have an effect on
the values of the variables at the next time they are observed. For example, if a stock
closed up one day, this has an effect on the likelihood of the stock closing up the next
day. This means that the observations are not independent of each other.
Population Populations are collections of individual items (people, houses, companies,
countries, cars) that are being investigated. For cross-sectional data on populations,
each observation in the data is for a different member of the population. For example,
in collecting data on incomes for families, you could define a population to be ”all
families in cities with less than 100,000 people” or ”all families with two children in
the United States”.
Sample When collecting data, it is rare indeed to collect information from every member of
a population. Usually this is impractical because of time or expense, so some portion,
usually randomly chosen according to some carefully defined criteria, is sampled. Each
member of the sample produces an observation of the variables in the data. However,
it is possible that the sample you have collected is not representative of the entire
population. It is critical that you make certain that the sample and population are as
similar as possible. When you calculate any statistical information based on a sample,
you are using this information to infer the characteristics of the population. This will
usually modify the statistical calculations. (For an example, see chapter 3 (page 61)
on the standard deviation.)
2.2.2
Worked Examples
Example 2.4. An example of poor data entry
The following EXCEL spreadsheet shows an incorrect attempt to enter the data from the
Data Collection Form for Seating Patterns and the Remodeling Questionnaire form that were
developed previously (example 2 (page 39)). In order to save space, only three observations
are shown (A2-J4). The description of the categories for each of the variables is found in cells
C7-I10; normally these would appear as comments in the Excel file in the column headings
(see the How To Guide).
There are several major errors in the way the data has been entered into the spreadsheet
in figure 2.3 (page 50).
1. An observation in this spreadsheet incorrectly consists of two types of observations run
together, one from the Data Collection Form for Seating Patterns and the other from
50
CHAPTER 2. THE ROLE OF DATA
Figure 2.3: Example of poor data organization in Excel.
the Remodeling Questionnaire. An observation from the seating pattern form consists
of counting people in the three areas at a particular time of day. An observation from
the questionnaire consists of one person’s opinions.
2. The observations have no meaningful identifiers.
3. The variable names ”TABLE SPACE” and ”CHAIR COMFORT” each contain a space
(see the HOW TO GUIDE).
4. Cells G3, H2-H4, I3 all contain two or more entries.
5. The column under ”COMMENTS” does not contain coded data.
NOTE: The next two examples and spreadsheets show a way of entering the data from
the above data collection forms. (All of these are in data file C02 Over Easy.xls.) Two
spreadsheets are necessary because the observations cannot be combined into one spreadsheet, as we saw in example 4 (page 49). Explanations for the coding of the data from each
form are provided (these are not the only ”correct” answers; there are different options for
each). Four sample observations are shown in each spreadsheet.
Example 2.5. Coding the Data from the Collection Form for Seating Patterns
Our data collection form contains the following variables. Each variable is described,
along with its unit and categories. The data type for each variable is described in parentheses
after the description.
2.2. ORGANIZING DATA IN SPREADSHEETS
Variable Name Type
IDNumber
Identifier - Numeric
Date
Day
Numeric - discrete
Categorical - ordinal
Time
Numeric - discrete
Nook
Cranny
Hole
Numeric-discrete
Numeric-discrete
Numeric-discrete
51
Units/Categories/Notes
A one- to three-digit number identifying consecutive observations starting with 1, the
first observation taken on June 30 at 11:30
A.M.
M: Monday, T: Tuesday, W: Wednesday, H:
Thursday, F: Friday, S: Saturday, D: Sunday
The time of day will be converted to military time, where: 5:00 A.M. is 500, 5:30
A.M. is 530, 12:00 P.M. is 1200, 1:00 P.M. is
1300, 1:30 P.M. is 1330. Military time eliminates the necessity of using the A.M./P.M.
designators.
Although the conventional
A.M./P.M. way of recording time is probably more user friendly for the people who had
to collect the data, they disrupt the natural
order of time necessary for analysis.
The number of people in the Nook area
The number of people in the Cranny area
The number of people in the Hole area
Figure 2.4: Observational data for Over Easy entered into a well-organzed spreadsheet.
Notice that the name variable ”HOLE” has been selected in the spreadsheet (figure 2.4
(page 51)) and a pop-up comment has been displayed describing how this variable has been
coded. You can also see the other comment triangles in the upper right part of the other
cells in the row. These contain the descriptions of how each variable has been coded.
52
CHAPTER 2. THE ROLE OF DATA
Example 2.6. Coding the Data from the Remodeling Questionnaire
In the spreadsheet in figure 2.5 (page 52), the codes for the data are written at the bottom
of the data on the spreadsheet itself for convenience. Most often, descriptions of codes are
either inserted as comments in the variable name cells (as we saw above) or written separately
from the spreadsheet in the report of the analysis.
Figure 2.5: Survey data for Over Easy entered into a well-organzed spreadsheet.
2.2. ORGANIZING DATA IN SPREADSHEETS
2.2.3
53
Exploration 2B: Entering Beef n’ Buns Data into Excel
In exploration 2.1.3 (page 43), you designed a data collection form and a questionnaire
form for Beef n’ Buns. Enter these data into two separate Excel spreadsheets within the
same Excel workbook file. One spreadsheet will be for the observational data and one for
the survey data. Create comments for each variable name on the spreadsheet itself (as in
example 6 (page 52)), stating its units or categories. Rename each of the sheets i nthe
workbook with an appropriate title. Use the space below to span and record your thoughts.
54
CHAPTER 2. THE ROLE OF DATA
2.2.4
How To Guide
Variable names in Excel
In order to use the features of StatPro, you will need to make sure that whenever you
enter data into a spreadsheet, the top cell of each column of data contains a variable name.
Variable names should be typed as simple text, without an ”=” sign in front of the name.
(All Excel formulas must start with either an equal sign or a plus sign; text is not a formula,
so do not start text with an equal sign or a plus sign.)
When naming the variables, do not use spaces. If your variable name has two or more
words in it (like ”Annual Salary”), you can either
• Enter the name with an underscore character to separate the words: Annual_Salary,
or
• Enter the name as a single word, with the first letters of each sub-word capitalized:
AnnualSalary.
It is also very important that no special characters appear in variable names. In other
words, your variable names should be made up of only letters (upper and lower case), numbers, and the underscore character (”_”). Other software may have other requirements; be
sure you check the help guide or user manual.
Good Data Entry Practice
Organize your spreadsheets so that the data is stored with the variables in columns and
observations are stored in rows. Make sure that each variable has a heading at the top of
the column of data to identify it. It’s a good idea to add comments to each variable name
in order to explain the coding and the units of the data. Make sure each observation has a
unique identifier.
It is also very important that each cell in the data contain information from only one
variable. For example, if you are coding information about homes and you want to record
data on the garage, you have two things to deal with: whether the garage is attached to
the house or not, and the number of cars that the garage can hold. You would not want to
have the cells coded as ”Detached 2” and ”Attached 1” and so forth. That is mixing two
variables, type of garage and size of garage, into a single variable. It would be better to
either
• create two variables, one for ”Type,” coded as ”attached” or ”detached” and a separate
variable for number of cars, or
• code a single variable (nominal categorical) to include the information, perhaps using
the codes below
– 1 = attached, 1 car garage
– 2 = attached, 2 car garage
– 3 = detached, 1 car garage
2.2. ORGANIZING DATA IN SPREADSHEETS
55
– 4 = detached, 2 car garage
– 5 = other type of garage
– 6 = no garage
File naming/Saving
When you save your files (”Early and often”, remember) be sure to save them with a meaningful name. If the file includes your solution to homework 2, then include ”homework 2”
in the title. You may also want to save all the files for each course you are taking into a
separate folder, named for the course. Finally, if the file is going to be sent electronically
to your instructor (through email or some course management system) it’s a good idea to
make sure that your name appears on the file in some way. After all, unless you are the only
student in the class, the file name ”homework 2” could belong to anyone. Your instructor
may even establish guidelines for naming files in order to make file management for the entire
course easier on him/herself and the teaching assistants (if any). Be sure to check whether
your instructor has a preferred file-naming system.
Comments in Excel
Excel allows you to add notes, called ”comments” to any cell. These comments are not
part of the data or formulas in the cell, and they do not normally appear in the worksheet.
Instead, any cell with an attached comment will have a small red triangle in the upper right
corner. If you place the mouse pointer over a commented cell, the comment will appear.
Comments are used to include such information as the way in which a variable is coded, the
units of numerical data, and references to the source of the data.
To add a comment to a cell, right click on the cell. In about the middle of the context
menu, the option ”Add comment...” should appear. Select this option, and an editable
comment box will appear. Type your comment in the box. When you are done, select another
cell with the mouse. Your comment will be entered into the spreadsheet. To make changes
to an existing comment, right click on the commented cell and select ”Edit comment...” To
delete a comment from a cell, right click on the cell and select ”Delete comment...”
Copying and pasting between programs
Microsoft Office is designed so that you can select information in one program, copy it
(using either the keyboard shortcut CTRL + C or the menu command ”Edit/ Copy”) and
then paste it into another program. When you copy selections, they are placed in an area
called the ”clip board”. To take these selections from the clipboard and place them into the
document (either another location in the same document, or in another document altogether)
simply place the cursor where you want the information to go and either use the keyboard
shortcut ”CTRL + V” or the menu ”Edit/ Paste” to paste the object in the location you
have selected.
56
CHAPTER 2. THE ROLE OF DATA
Renaming a worksheet in Excel
An Excel workbook can contain many different worksheets. By default, these are named
”Sheet1”, ”Sheet2”, etc. Double-click on the name of the sheet and it the sheet name will
be highlighted. Type in the new name for the sheet and hit ENTER. (You can also right
click on the sheet name and select ”Rename” from the menu.)
Sizing columns to make data fit
You may also run into the problem that information you enter into cells in a spreadsheet
might not fit. You have two options to get information to fit: You can either resize the
columns or you can enter the text on multiple lines. To resize the columns, you can go to
the column header and either clip-and-drag the width of the column to the desired size or
you can double-click on it so that it automatically resizes to be wide enough for the widest
entry in that column.
To enter information in multiple lines within a single cell in Excel, first type the information on the first line and then hit ALT+ENTER to move to the second line. You can use
as many lines as you want.
2.3. HOMEWORK
2.3
2.3.1
57
Homework
Mechanics and Techniques Problems
2.1. Open the spreadsheet ”C02 Homes.xls”. This file contains data on over 270 homes
that sold in the greater Rochester, NY areas during a three-month period in the year 2000.
Identify each variable in the data. Classify each variable as either numerical or categorical.
For numerical variables, give a rough idea of the range of the variable. For categorical
variables, list each of the categories and how they are coded.
Variable Name
Type
Range/Units/Categories
Notes
2.2. Problem situation: Demand for analysts at Delphinium Consulting, Inc. is growing.
Delphinium often loses its best consultants to its competitors in the industry, although
consultants who stay with Delphinium for at least three years tend to stay with the company
much longer.
Problem: The CEO of Delphinium is concerned about the retention of her analysts and
has identified data she would like to collect below. Your job is to specify reasonable units or
codes for each of these variables.
58
CHAPTER 2. THE ROLE OF DATA
Variable
Description
Units/Codes
StartingSalary Salary upon hiring at Delphinium
OutOfOffice
Percentage of time consultant spends out of the office
working with clients
LocalGrad
Whether or not the employee graduated from a local university/college or not
Major
Undergraduate major
Tenure
Time employee has spent
with the company
2.3. In problem 2 (page 57), change the numerical variables StartingSalary, OutOfOffice,
and Tenure into categorical variables. For example, to change a numerical variable like
TaxPercentage into a categorical variable we might define three categories:
Low
less than 10%
Middle between 10% and 20% inclusive
High
greater than 20%
2.4. Create an Excel spreadsheet using the variables you defined in problems 2 and 4 above.
Create test (fake) data for 5 observations that demonstrate the range of values for each of
your variables.
2.3.2
Application and Reasoning Problems
Coming soon!
2.3. HOMEWORK
2.3.3
Memo Problem
To:
From:
Date:
Re:
Analysis Staff
Marketing Director
May 15, 2008
RFP from Ms. Way
The marketing team wants some further details for the proposal we developed
for Ms. Way regarding the possible issues with entertainment at Carnivorous
Cruise Lines. So here is what I want you to do:
1. Design data collection forms that I can include in the final proposal. These
forms might be questionnaires, attendance counts, sales figures, however you
are proposing to go about collecting data.
2. Develop an Excel spreadsheet for each different type of data collection form
and enter some test data (maybe 15 observations; you shouldn’t go overboard, but you should do enough to ”show off” the range of values of your
variables). Since you have more than one Excel spreadsheet, put them all
in one workbook with individual, relevant names, so that I don’t overlook
them.
3. Include comments below your data on the spreadsheet that
(a) Provide explanations for any codes you are using (where appropriate)
and
(b) Give the units of your variables when they are not obvious.
4. All data collection forms and their accompanying spreadsheets must be incorporated into a Microsoft Word document and sent to me.
5. Just under your mockup data in the spreadsheet, list each variable and identify the type of data, e.g. nominal categorical, discrete continuous, etc.
59
60
CHAPTER 2. THE ROLE OF DATA