1
An Electronic Chalkboard for Classroom and
Distance Teaching
Dissertation
zur Erlangung des akademischen Grades eines
Doktors der Naturwissenschaften
im Fachbereich Mathematik und Informatik
der Freien Universität Berlin
vorgelegt von
Lars Knipping
aus Itzehoe
14. Februar 2005
ii
Gutachter:
Prof. Dr. Raúl Rojas
Prof. Dr. Ruedi Seiler
Preface
Quis leget haec?
Persius, Satires, 1:2
Many people have contributed to the development of the system being described in this thesis. The project was conceived by Prof. Dr. Raúl Rojas, who
accompanied its development and provided many ideas.
The first prototype of the board software was written by Wolf-Ulrich Raffel.
The entire audio part is authored by Gerald Friedland, on the basis of the
WWR system by Gerald Friedland and Tobias Lasser and its successor WWR2
by Gerald Friedland and Bernhard Frötschl. Gerald Friedland also designed the
multimedia editor called Exymen and the video part of the E-Chalk system.
Kristian Jantz assisted in the video software development. He implemented
the SID plug-in for Exymen, the Maple connection for the board, and a number
of tools: one for converting lecture recordings to AVI and QuickTime movies,
another for generating board snapshots, one for updating the audio format, and
a tool for restoring damaged recordings.
Ernesto Tapia developed the mathematical handwriting recognition integrated in the board component. Mary Ann Brennan wrote the first version of
the PDF generator and the JMF audio plug-in for Exymen. Stephan Lehmann
implemented the program to convert E-Chalk recordings to Windows ASF files.
Dr. Peter Rüßman added capabilities for function definition and function plotting for the small built-in computer algebra system. Sebastian Frielitz and
Robert Günzler realized the connection with an Oracle database, and Thomas
Reimann implemented the tool for automatic upload to a BlackBoard LMS.
The handwriting synthesis is the work of Yark Schroeder and the PowerPoint
importer was done by Shirzad Kamawall and Alexandar Rakovski. Florian
Theimer has to be credited for the extraction of keywords by means of handwriting recognition on recorded board data.
The logic-recognition chalklet is the work of Marcus Liwicki. The TicTacToe
chalklet was realized by him, too. Chalklets described on algorithmic animations
are developed by Dr. Margarita Esponda. Olga Krupina authored the chalklet
on Neural Network simulations. Henrik Steffien and Brendan O’Connor developed the Python-interpreting chalklet.
The FU data wall was designed by Prof. Dr. Raúl Rojas. The laser pen
tracking used by the data wall is founded on the work of Michael Diener. The
bluetooth extension possibilities were tested by Jörg Rebenstorf. Most of the
actual work in setting up the data wall is to be credited to Christian Zick.
He also was of great practical assistance to all project members on numerous
occasions.
iii
iv
Joachim Schulte conducted the extensive user evaluations on the system in
university teaching. Stefanie Eule evaluated the usage in K-12 schools.
For valuable feedbacks, I would like to give thanks to many users, especially
to the MOSES team of Prof. Dr. Ruedi Seiler and Dr. Sabina Jeschke, including
Erhard Zorn, Sven Grottke, Robert Luce, and others. Special compliments
should also go to Dr. Ulrich Kernbach of the Deutsches Museum in Munich and
to the Himmel5 team.
I owe thanks to Guido Reuter of the MCR GmbH for expert information on
board hardware and software, for generously providing test hardware, and for
lots of interesting input.
For polishing up my English, I am indebted to Heike Hellner, Gerald Friedland, Christian Zick, and Peter Monnerjahn. Finally, for their kindness and
support, I want express my gratitude to my friends, my parents, and my beloved
Diana.
Contents
1 Introduction and Related Work
1.1 The E-Learning Landscape . . . . . . . . . . . . . .
1.2 E-Chalk: The Idea . . . . . . . . . . . . . . . . . . .
1.3 Board Hardware . . . . . . . . . . . . . . . . . . . .
1.3.1 Digital Boards . . . . . . . . . . . . . . . . .
1.4 Pen Computing Software . . . . . . . . . . . . . . . .
1.5 Pen-based Office and CSCW Tools . . . . . . . . . .
1.5.1 Personal Note-Taking . . . . . . . . . . . . .
1.5.2 Commercial Digitizing Whiteboard Software
1.5.3 Tivoli/MeetingBoard . . . . . . . . . . . . . .
1.5.4 Flatland . . . . . . . . . . . . . . . . . . . . .
1.5.5 i-LAND and FLUIDUM . . . . . . . . . . . .
1.5.6 IRoom/I-Workspace . . . . . . . . . . . . . .
1.5.7 Other CSCW Systems . . . . . . . . . . . . .
1.6 Course-Authoring Systems . . . . . . . . . . . . . . .
1.6.1 MANIC . . . . . . . . . . . . . . . . . . . . .
1.6.2 Cornell Lecture Browser . . . . . . . . . . . .
1.6.3 AudioGraph . . . . . . . . . . . . . . . . . . .
1.7 Presentation and Classroom Enhancement . . . . . .
1.7.1 BIRD Note-taking System . . . . . . . . . . .
1.7.2 ConferenceXP Presenter/Classroom Presenter
1.8 Lecture Recording . . . . . . . . . . . . . . . . . . .
1.8.1 Desktop Grabbing . . . . . . . . . . . . . . .
1.8.2 Just-In-Time Lectures . . . . . . . . . . . . .
1.8.3 NoteLook . . . . . . . . . . . . . . . . . . . .
1.8.4 DEBBIE/DyKnow . . . . . . . . . . . . . . .
1.8.5 Classroom 2000/eClass . . . . . . . . . . . . .
1.8.6 AOF . . . . . . . . . . . . . . . . . . . . . . .
1.8.7 Lecturnity . . . . . . . . . . . . . . . . . . . .
1.8.8 Tele-TASK/t-Cube . . . . . . . . . . . . . . .
1.9 Conclusion . . . . . . . . . . . . . . . . . . . . . . .
.
.
.
.
.
.
.
.
.
.
.
.
.
.
.
.
.
.
.
.
.
.
.
.
.
.
.
.
.
.
.
.
.
.
.
.
.
.
.
.
.
.
.
.
.
.
.
.
.
.
.
.
.
.
.
.
.
.
.
.
.
.
.
.
.
.
.
.
.
.
.
.
.
.
.
.
.
.
.
.
.
.
.
.
.
.
.
.
.
.
.
.
.
.
.
.
.
.
.
.
.
.
.
.
.
.
.
.
.
.
.
.
.
.
.
.
.
.
.
.
.
.
.
.
.
.
.
.
.
.
.
.
.
.
.
.
.
.
.
.
.
.
.
.
.
.
.
.
.
.
.
.
.
.
.
.
.
.
.
.
.
.
.
.
.
.
.
.
.
.
.
.
.
.
.
.
.
.
.
.
.
.
.
.
.
.
.
.
.
.
.
.
.
.
.
.
.
.
.
.
.
.
.
.
.
.
.
.
.
.
1
1
5
7
8
9
11
11
12
12
13
14
14
15
16
16
17
17
18
19
19
20
20
22
22
23
23
24
25
25
26
2 User Interface
2.1 Overview . . . . . . . . . . . . .
2.2 Usability Considerations . . . . .
2.3 Installing E-Chalk . . . . . . . .
2.4 The E-Chalk Server Application
2.4.1 Setup Dialog . . . . . . .
.
.
.
.
.
.
.
.
.
.
.
.
.
.
.
.
.
.
.
.
.
.
.
.
.
.
.
.
.
.
.
.
.
.
.
27
27
28
32
32
33
v
.
.
.
.
.
.
.
.
.
.
.
.
.
.
.
.
.
.
.
.
.
.
.
.
.
.
.
.
.
.
.
.
.
.
.
.
.
.
.
.
.
.
.
.
.
.
.
.
.
.
.
.
.
.
.
vi
CONTENTS
2.5
2.4.2 The Board Component . . . . . . . . . . . . . . . . . . . .
Remote Access . . . . . . . . . . . . . . . . . . . . . . . . . . . .
3 The E-Chalk Application
3.1 Main Configuration . . . . . . . . . . . .
3.1.1 Dynamically Loaded Classes . .
3.1.2 Multiuser Configuration . . . . .
3.2 Data Model of the Settings . . . . . . .
3.3 Connecting Computer Algebra Systems
3.4 Bookmark Files . . . . . . . . . . . . . .
3.5 Audio Profiles . . . . . . . . . . . . . . .
3.6 Starting a Lecture Recording . . . . . .
3.7 HTML Templates . . . . . . . . . . . . .
3.8 Help System . . . . . . . . . . . . . . . .
3.9 Localization . . . . . . . . . . . . . . . .
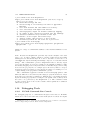
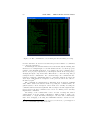
3.10 Debugging Tools . . . . . . . . . . . . .
3.10.1 E-Chalk Command-Line Console
3.10.2 Message Logging . . . . . . . . .
38
43
.
.
.
.
.
.
.
.
.
.
.
.
.
.
.
.
.
.
.
.
.
.
.
.
.
.
.
.
.
.
.
.
.
.
.
.
.
.
.
.
.
.
.
.
.
.
.
.
.
.
.
.
.
.
.
.
.
.
.
.
.
.
.
.
.
.
.
.
.
.
.
.
.
.
.
.
.
.
.
.
.
.
.
.
.
.
.
.
.
.
.
.
.
.
.
.
.
.
.
.
.
.
.
.
.
.
.
.
.
.
.
.
.
.
.
.
.
.
.
.
.
.
.
.
.
.
.
.
.
.
.
.
.
.
.
.
.
.
.
.
.
.
.
.
.
.
.
.
.
.
.
.
.
.
45
45
47
47
47
48
50
51
52
54
56
56
59
59
64
4 Board Server
4.1 Painting on the Board . . . . . . . . . . . . . .
4.2 Drawing Lines . . . . . . . . . . . . . . . . . .
4.3 Typing Text . . . . . . . . . . . . . . . . . . . .
4.4 Images and Applets . . . . . . . . . . . . . . .
4.5 Undo, Redo, and Clear All . . . . . . . . . . . .
4.6 Custom GUI elements . . . . . . . . . . . . . .
4.7 Board Resource Loading . . . . . . . . . . . . .
4.7.1 URL Loading . . . . . . . . . . . . . . .
4.7.2 Requests to Computer Algebra Systems
4.7.3 Decoding . . . . . . . . . . . . . . . . .
4.7.4 Chalklets . . . . . . . . . . . . . . . . .
4.7.5 Resource Handling . . . . . . . . . . . .
4.8 Stroke Delivery . . . . . . . . . . . . . . . . . .
4.8.1 Chalklet Strokes . . . . . . . . . . . . .
4.8.2 Handwriting Recognized Strokes . . . .
4.9 Mathematical Handwriting Recognition . . . .
4.10 Applet Control . . . . . . . . . . . . . . . . . .
4.10.1 Applet Events . . . . . . . . . . . . . .
4.11 Event Storage . . . . . . . . . . . . . . . . . . .
4.11.1 Encoding . . . . . . . . . . . . . . . . .
4.11.2 Structure . . . . . . . . . . . . . . . . .
4.12 Live Server . . . . . . . . . . . . . . . . . . . .
.
.
.
.
.
.
.
.
.
.
.
.
.
.
.
.
.
.
.
.
.
.
.
.
.
.
.
.
.
.
.
.
.
.
.
.
.
.
.
.
.
.
.
.
.
.
.
.
.
.
.
.
.
.
.
.
.
.
.
.
.
.
.
.
.
.
.
.
.
.
.
.
.
.
.
.
.
.
.
.
.
.
.
.
.
.
.
.
.
.
.
.
.
.
.
.
.
.
.
.
.
.
.
.
.
.
.
.
.
.
.
.
.
.
.
.
.
.
.
.
.
.
.
.
.
.
.
.
.
.
.
.
.
.
.
.
.
.
.
.
.
.
.
.
.
.
.
.
.
.
.
.
.
.
.
.
.
.
.
.
.
.
.
.
.
.
.
.
.
.
.
.
.
.
.
.
.
.
.
.
.
.
.
.
.
.
.
.
.
.
.
.
.
.
.
.
.
.
.
.
.
.
.
.
.
.
.
.
.
.
.
.
.
.
.
.
.
.
.
.
65
65
66
67
67
68
68
69
71
73
75
76
77
77
77
79
79
82
83
85
85
87
91
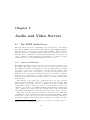
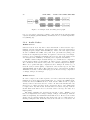
5 Audio and Video Servers
5.1 The WWR Audio Server . . .
5.1.1 Server Architecture . .
5.1.2 Audio Codecs . . . . .
5.2 Smart Audio Recording . . .
5.2.1 Sources of Interference
5.2.2 Enhancing Recordings
.
.
.
.
.
.
.
.
.
.
.
.
.
.
.
.
.
.
.
.
.
.
.
.
.
.
.
.
.
.
.
.
.
.
.
.
.
.
.
.
.
.
.
.
.
.
.
.
.
.
.
.
.
.
.
.
.
.
.
.
93
93
93
94
95
95
96
.
.
.
.
.
.
.
.
.
.
.
.
.
.
.
.
.
.
.
.
.
.
.
.
.
.
.
.
.
.
.
.
.
.
.
.
.
.
.
.
.
.
.
.
.
.
.
.
.
.
.
.
.
.
.
.
.
.
.
.
.
.
.
.
.
.
.
.
.
.
.
.
.
.
.
.
.
.
.
.
.
.
.
.
.
.
.
.
.
.
.
.
.
.
.
.
.
.
.
.
.
.
CONTENTS
.
.
.
.
.
.
.
.
.
.
.
.
.
.
.
.
.
.
.
.
.
.
.
.
.
.
.
.
.
.
.
.
.
.
.
.
.
.
.
.
.
.
.
.
. 97
. 99
. 100
. 102
6 Tools, Converters, Add-ons
6.1 Export to PDF . . . . . . . . . . . . . . . . .
6.1.1 PDF Structure . . . . . . . . . . . . .
6.1.2 Images . . . . . . . . . . . . . . . . . .
6.1.3 Color Conversions . . . . . . . . . . .
6.2 Export for Replay in Windows Media Player
6.3 Export to QuickTime and AVI Video . . . . .
6.4 Creating Board Snapshots . . . . . . . . . . .
6.5 Audio Format Updater . . . . . . . . . . . . .
6.6 Repairing Damaged Recordings . . . . . . . .
6.7 Import of PowerPoint Presentations . . . . .
6.8 Keywords from Handwriting Recognition . . .
6.9 Macro Recorder . . . . . . . . . . . . . . . . .
6.10 Automated DB or LMS Storage . . . . . . . .
6.11 Handwriting Synthesis . . . . . . . . . . . . .
6.12 Example Chalklets . . . . . . . . . . . . . . .
6.12.1 EchoChalklet and TicTacToe . . . . .
6.12.2 Animated Algorithms . . . . . . . . .
6.12.3 Simulation of Neural Networks . . . .
6.12.4 Simulation of Logic Circuits . . . . . .
6.12.5 Python Interpreter . . . . . . . . . . .
6.13 Post-production with Exymen . . . . . . . . .
6.13.1 Plug-in Management . . . . . . . . . .
6.13.2 Data Structures . . . . . . . . . . . . .
6.13.3 Editable Formats . . . . . . . . . . . .
.
.
.
.
.
.
.
.
.
.
.
.
.
.
.
.
.
.
.
.
.
.
.
.
.
.
.
.
.
.
.
.
.
.
.
.
.
.
.
.
.
.
.
.
.
.
.
.
.
.
.
.
.
.
.
.
.
.
.
.
.
.
.
.
.
.
.
.
.
.
.
.
.
.
.
.
.
.
.
.
.
.
.
.
.
.
.
.
.
.
.
.
.
.
.
.
.
.
.
.
.
.
.
.
.
.
.
.
.
.
.
.
.
.
.
.
.
.
.
.
.
.
.
.
.
.
.
.
.
.
.
.
.
.
.
.
.
.
.
.
.
.
.
.
.
.
.
.
.
.
.
.
.
.
.
.
.
.
.
.
.
.
.
.
.
.
.
.
.
.
.
.
.
.
.
.
.
.
.
.
.
.
.
.
.
.
.
.
.
.
.
.
.
.
.
.
.
.
.
.
.
.
.
.
.
.
.
.
.
.
.
.
.
.
.
.
.
.
.
.
.
.
.
.
.
.
.
.
.
.
.
.
.
.
.
.
.
.
.
.
.
.
.
.
.
.
.
.
.
.
.
.
.
.
.
.
.
.
.
.
.
.
.
.
105
105
107
108
109
110
111
113
113
114
114
115
117
118
119
120
120
120
121
121
122
123
124
125
125
7 Client Applets
7.1 Client Control Panel and Masi Interface
7.2 Board Client . . . . . . . . . . . . . . .
7.2.1 Event Handling . . . . . . . . . .
7.2.2 VCR Operations . . . . . . . . .
7.2.3 Scrolling . . . . . . . . . . . . . .
7.2.4 Handling Applets . . . . . . . . .
7.2.5 Board Parameters . . . . . . . .
7.3 Audio Client . . . . . . . . . . . . . . .
7.3.1 VCR Operations . . . . . . . . .
7.3.2 Parameters . . . . . . . . . . . .
7.4 Video Client . . . . . . . . . . . . . . . .
7.5 Slide Show . . . . . . . . . . . . . . . . .
.
.
.
.
.
.
.
.
.
.
.
.
.
.
.
.
.
.
.
.
.
.
.
.
.
.
.
.
.
.
.
.
.
.
.
.
.
.
.
.
.
.
.
.
.
.
.
.
.
.
.
.
.
.
.
.
.
.
.
.
.
.
.
.
.
.
.
.
.
.
.
.
.
.
.
.
.
.
.
.
.
.
.
.
.
.
.
.
.
.
.
.
.
.
.
.
.
.
.
.
.
.
.
.
.
.
.
.
.
.
.
.
.
.
.
.
.
.
.
.
.
.
.
.
.
.
.
.
.
.
.
.
.
.
.
.
.
.
.
.
.
.
.
.
129
130
132
132
132
133
134
134
138
138
138
140
141
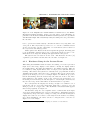
8 Experiences and Evaluation
8.1 Case Studies . . . . . . . . . . . . . . . . . .
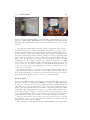
8.1.1 Hardware Setup in the Lecture Room
8.1.2 Uses for Remote Access . . . . . . . .
8.1.3 Replay on Hand-held Devices . . . . .
.
.
.
.
.
.
.
.
.
.
.
.
.
.
.
.
.
.
.
.
.
.
.
.
.
.
.
.
.
.
.
.
.
.
.
.
.
.
.
.
.
.
.
.
143
143
144
146
147
5.3
5.4
5.2.3 Setup . . . . . . . . . . . .
5.2.4 During Recording . . . . .
The WWV Video Server . . . . . .
Video and Board Image Combined
vii
.
.
.
.
.
.
.
.
.
.
.
.
.
.
.
.
.
.
.
.
.
.
.
.
.
.
.
.
.
.
.
.
.
.
.
.
.
.
.
.
.
.
.
.
viii
CONTENTS
8.2
8.3
8.4
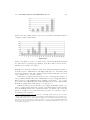
Evaluations . . . . . . . . . . . . . . . . . . .
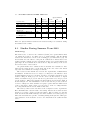
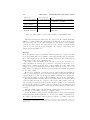
Studies During Summer Term 2003 . . . . . .
Studies During Winter Term 2003/04 . . . . .
8.4.1 Comparative Studies . . . . . . . . . .
8.4.2 Qualitative Study on E-Chalk Courses
.
.
.
.
.
.
.
.
.
.
.
.
.
.
.
.
.
.
.
.
.
.
.
.
.
.
.
.
.
.
.
.
.
.
.
.
.
.
.
.
.
.
.
.
.
.
.
.
.
.
.
.
.
.
.
148
149
154
154
156
9 Outlook
163
10 Conclusion
167
Bibliography
169
Web References
191
Appendix
199
Chapter 1
Introduction and Related
Work
Computers promise the fountains of utopia, but only deliver a flood
of information
Langdon Winner, Mythinformation, Whole Earth Review, Jan. 1985
1.1
The E-Learning Landscape
The history of-computer supported education is rooted in the early era of mainframes. In 1963, the PLATO system [Woo94] (Programmed Logic for Automated Teaching Operations) was developed at University of Illinois. It had
custom-built multimedia teaching terminal stations connected to the mainframe.
A proprietary language called TUTOR was created for authoring educational
software. More than 15,000 hours worth of instruction material were developed
for PLATO. Features like online chat and bulletin-board notes were added in
the early 1970s, long before the Internet. In 1976 Control Data Corporation
(CDC) established PLATO-IV as a commercial educational product, with its
successor still around [75].
Recent years have witnessed considerable activity in the field of computeraided education. With an access to the Internet being almost omnipresent,
people envision a new age of learning: the learners will be free to learn when
and where they want, learning efficiencies will be heightened by a multimediaenriched learning experiences, and training costs can be cut by reusing teaching
content.
Production Costs
Unfortunately, creating e-learning material is a laborious process. Production
costs are reckoned to be in the range of 50 to 200 man hours for one hour of
learning content. [CMMS03] reports on the development of static or dynamic
HTML pages:
On the average, one can calculate one person working for a half to
up to a full year for the preparation of electronic learning content
for only one course.
1
2
CHAPTER 1. INTRODUCTION AND RELATED WORK
While the costs of any software and hardware equipment amortize rapidly if
enough material is produced, the huge costs in personnel make it economically
not viable unless the content is either aimed at a very large audience or can be
reused many times. For the teaching at universities, the situation is particularly
grave, as the contents taught tend to change very fast.
A cause for this tremendous effort is that traditional teaching know-how does
not easily match with contemporary authoring tools. Apart from technical effort it requires a huge amount of work to structure didactic content for the Web,
even if presented only linearly. As a side note, the e-learning community often
argues for producing highly interactive material supporting constructivistic style
learning, following the learning theory rooted in the works of Jean Piaget and
Lev Vygotsky. According to constructivism, knowledge cannot be simply transmitted. Instead the learners have to actively construct their understanding of a
subject. In reality, most Web-based learning courses rely on delivering information and rote learning. Interaction is usually limited to online multiple-choice
tests and possibly a few interactive experiments such as Java Applets or flash
animations. Complex interaction and feedback are almost non-existent [MN02],
at the very best providing chat, e-mail discussions, or automatically examined
multiple-choice tests [Tsi99].1 Since even simple and linear material is laborintensive and expensive to produce, more complex approaches are rarely realized
and almost always stay in the realm of theoretical concepts.
On the other hand, a huge amount of content is already produced on a
regular basis in traditional teaching. As [Tsi99] puts it:
Universities generate content every day through their courses and
seminars. They then throw it away. There is a certain charm with
this approach but it is not cost effective.
Trying to avoid the expenses of standard e-learning module authoring, many
universities resort to mere video capturing of their standard lectures, see for
example [106].
This approach has the advantage of making use of existing teaching qualifications of the lecturer, instead of requiring the lecturer to acquire new teaching
skills. If the recordings manage to transport the feeling of the lecture, they
can produce high-quality teachings as a kind of by-product of traditional teaching. The resulting e-learning content will be linear, but then everyday academic
teaching by lecture2 is linear by nature. Also, the instructor does not have to
have intimate knowledge of the production process. Normal authoring systems
for e-learning modules either require the teacher to learn how to operate the
authoring software or the authoring process to be handled by a team of at least
1 In fact, with the popularity of constructivistic teaching, even systems offering the replay
of plain lecture recordings have claimed to be interactive and constructive, just because of the
control of the recordings replay. The developers of MANIC (described in Section 1.6.1) write
in [SSL+ 97]: To provide for interactivity, students are given the opportunity to browse the
material at their own pace, stopping and starting the audio at will and in [SVPM01] they even
claim: We have based the overall design of the system in Constructivism [...]. We believe
that the features of the MANIC system described above (audio controls, controls to move back
and forth between the slides, a table of contents, and a search engine) allow for a greater
participation of the students in their learning process.
2 The instructivistic teaching style embodied by lectures can be clearly considered as the
dominant teaching form in the natural sciences and in engineering subjects. Even though
criticized for its one-way communication, teaching by lecture nevertheless remained popular
because of its efficient way to educate large numbers of students.
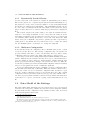
1.1. THE E-LEARNING LANDSCAPE
3
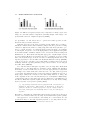
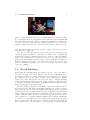
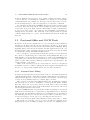
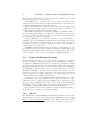
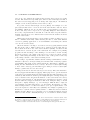
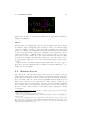
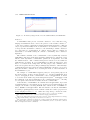
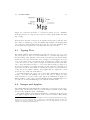
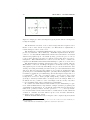
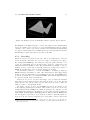
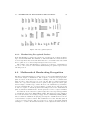
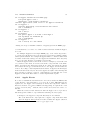
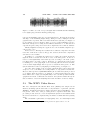
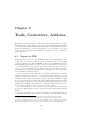
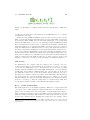
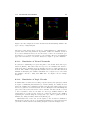
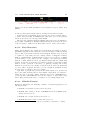
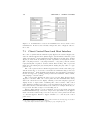
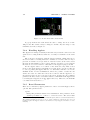
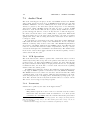
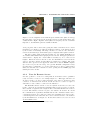
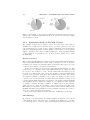
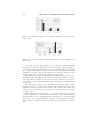
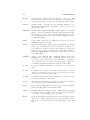
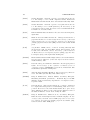
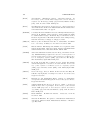
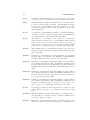
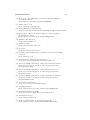
Figure 1.1: Effects of frequency-based lossy compression on sharp edges. Left:
image encoded with lossless compression (as PNG). Right: same image compressed with reduction of higher frequencies (JPEG).
two specialists: one who knows how to operate the technology and one who
knows the subject and the didactics.
Still this approach needs extra personnel present during the recording to
handle the camera and the audio hardware, plus provisions to put the recording
online in a digital form. Naive recording setup will cause these systems to produce poor audio and video recordings from live lectures as their codecs assume
a clean signal. In practice one needs high-quality sound equipment and qualified technical staff to eliminate audience noise, reverberation effects, changes in
illumination, etc. Even when tailoring this approach to a light-weight creation
process, Carnegie Mellon’s Just-In-Time Lectures 3 calculated a post-processing
time of about 30 hours per one hour of lecture, not including the time for recording and preparation. For the Microsoft Technical Education Group (MSTE),
costs are reported to amount to more than $500 per talk for their video-taped
trainings, with the expenses primarily being costs for staff to record and put
the talks online [LRGC01].
Not only that this is still quite expensive, but encoding with off-the-shelf
Internet video tools is inadequate for lecturing content. Writing and drawings,
from slides or from a blackboard, are not encoded appropriately. Compression
of a single video frame with state-of-the-art video encoding technology relies
on dropping the higher-frequency parts from images resulting in the loss of
sharp edges. Either the content becomes unreadably blurred or, using only
weak compression, the video stream takes up lots of bandwidth. JPEG image
compression is based on the same approach, see Figure 1.1 for an illustration of
the effects. Thus these systems require the instructors to modify their teaching
style for the sake of tele-presence quality [Tsi99]:
[...] any teaching materials must be prepared with consideration of
legibility to tele-viewers. The writing on blackboards or the transparencies shown on overhead projectors may be clearly visible to
classroom participants but extremely hard to read for remote participants.
Even then, considering the bandwidth restrictions the typical remote user faces
at home, low resolution and lossy encoding often result in unacceptable quality.
One approach to avoid badly-encoded writing is to send lossless encoded
presentation slides of the talk separately instead of encoding them as video
3 The
Just-In-Time Lectures concept is described in Section 1.8.2.
4
CHAPTER 1. INTRODUCTION AND RELATED WORK
image. They are either sent as a collection of all slides, requiring the remote
user to trigger the slide transition manually4 , or their display is synchronized
with the audio/video stream5 . Some specialized lecture recording tools allow
to give presentations and automatically store the transitions for replay, others
require to add the transition times by extra manual effort in a post-processing
phase.
Teaching with Slideware or Desktop Environments
Teaching with slideware tools like PowerPoint is prevalent, regardless of the
lectures being recorded or not. However, this has been heavily criticized [Cre97].
The advantage of slides is their easy reuse and the wide availability of slideware
tools on computers. On the other hand, they are devised for presentations
and not for teaching. Edward Tufte argues that PowerPoint is a good tool to
convincingly “sell” something while complex arguments tend to get lost [Tuf03a,
Tuf03b].
As stated by Richard Clark, the human brain can be easily overloaded by
the sensory input that e-learning and multimedia technology is capable of generating [Cla99]. While obviously there are people who can give great classes
using slide presentations, these tools foster a tendency to overwhelm learners
with rapid deliverance of information. The lecturers, of course, already have a
deeper understanding of the subject and they often tend to continue with a speed
too fast for their students to follow when not restrained by the teaching technique. Also, classes given with slideware tend to be much more predetermined
and less spontaneous. To use the words of a university lecturer, “PowerPoint
sucks the life out of a class” [And04].
Some lecture-recording tools record work by recording the computer desktop6 , see Section 1.8.1. While technically this allows an instructor greater freedom and encompasses the recording of slide shows, it is an unsuitable approach
for teaching. The desktop metaphor is tailored for personal work, as a virtual
extension of the physical desktop, meant to be used with a mouse and a keyboard by a single person and not to be shared with an audience. The desktop
metaphor needs sustained attention to be operated due to the prevalence of
modes.7 Disruption of the users workflow is common, for example by requiring
complex interactions with dialogs. The universality of the desktop paradigm
turns into a drawback in the lecturing situation. As a teacher giving a lecture,
one is already quite busy with getting the content across, even without having to deal with desktop dialogs, like creating folders or killing the MS Office
Assistant, that are a source of distraction for both lecturer and students.8
4 See
for example iLectures [36].
for example the Cornell and the BMRC Lecture Browser [5] described in Section 1.6.2.
6 Again, most of these systems have the encoding problem mentioned above, as almost all
use standard video compression codecs.
7 See Section 2.2 for a short discussion of modes in user interfaces.
8 These examples are not as uncommon as they might appear at first glance. Both have
been witnessed more than once by the author in sales presentations of whiteboard software
for teaching.
5 See
1.2. E-CHALK: THE IDEA
1.2
5
E-Chalk: The Idea
The main fault in the approaches described lies in being technology-driven,
focusing on what can be done with computer today, instead of being led by
the demands of teaching.9 Looking instead for established teaching techniques,
one finds that the chalkboard has been an unmatched teaching tool for ages
in many disciplines. In 1855, the abolitionist Samuel Joseph May wrote about
the introduction of the blackboard to classrooms10 , being at his time the most
modern instruction technology:
[...] in the winter of 1813 & ’14, during my first College vacations,
I attended a mathematical school kept in Boston by the Rev. Francis
Xavier Brosius [...] On entering his room, we were struck at the
appearance of an ample Black Board suspended on the wall, with
lumps of chalk on a ledge below, and cloths hanging at either side. I
had never heard of such a thing before. There it was forty-two years
ago that I first saw what now I trust is considered indispensable in
every school the Black Board and there that I first witnessed the
process of analytical and inductive teaching.
The chalkboard is an adequate interface metaphor for a common display used
in teaching an audience. It provides a shared view for instructor and students.
The board ensures that information stays available, providing context for talk
and discussion. The learners can see how ideas are developed rather than being
overwhelmed with final results – they are helped to follow the conceptual process. The teacher is slowed down to the speed of his or her handwriting, giving
the students time to follow the lecturer’s train of thought.
The “chalk and talk” approach results in a much more flexible teaching
style than relying on prepared slides. Working on a chalkboard supports creative thinking, illustration and sharing. Board drawings can also be used to
draw attention to details using circles, arrows, underlines, checks, grouping, etc.
The inherent impreciseness and vagueness of freehand drawings holds extra information. With these great qualities in teaching, it comes as no surprise that
the chalkboard is still so popular in teaching in many disciplines, especially for
subjects where complex reasoning has to be taught, as in mathematics and the
natural sciences.
These considerations inspired the development of a system called E-Chalk
[22]. Ideally, the lecturers are enabled to teach with the system like with a
regular blackboard and produce distance teaching material as a by-product.
During classroom teaching, the lecturer works directly on a pen-active wall
display. The system tries to enhance teaching in the classroom by allowing the
instructor to integrate multimedia elements. At the same time, the lecture is
being saved and transmitted live over the Internet without extra effort required
of the instructor. The system transmits audio, video, and the animated board
image of the lecture. A PDF file is also generated as a static copy of the board
content for printing. The goal is to preserve the didactic advantages and the
easy handling of the traditional chalkboard, while augmenting the classroom
9 This is a problem that is not specific to the e-learning domain. As argued by Donald
Norman, the prevalence of PCs result in most information technologies being technologycentered instead of being human-centered [Nor98].
10 Quote cited according to [And04].
6
CHAPTER 1. INTRODUCTION AND RELATED WORK
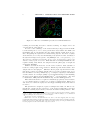
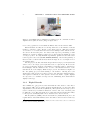
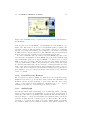
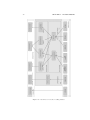
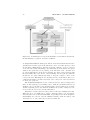
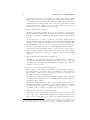
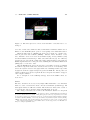
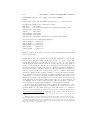
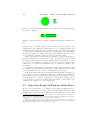
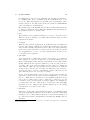
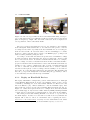
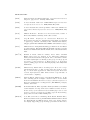
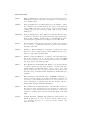
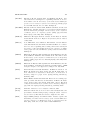
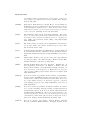
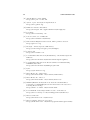
Figure 1.2: The idea of E-Chalk represented as an E-Chalk sketch.
teaching and extending its reach to distance learning. See Figure 1.2 for an
overview sketch of the system.
In order to take advantage of the lecturers already being proficient in chalkboard lecturing, the tool to be developed should closely resemble the chalkboard
in handling and avoid burdening the user with technical details as far as possible. Integrating the system in a non-interfering way into the users’ everyday
environment does not only ease the handling of the system, it is also essential for
the system’s widespread acceptance. As [BAT99] noted, “our experience [...] is
that even for scheduled activities like classes, users are reluctant to spend a few
minutes setting up the classroom.” With this aim of blending E-Chalk into the
regular teaching environment, the design follows the philosophy of Ubiquitous
Computing [WGB99].
Similar observations hold true for the remote learners. Most systems for
lecture-recording require remote learner to install a special client software often
designed as a browser plug-in.11 This introduces a psychological barrier for firsttime users, compare for example [Nie99]. Moreover, remote learners often do not
have the skills or even the permissions (e. g. on campus computers) to install such
a client software. For example, [ZS02] reports students having trouble installing
the Transparent TeleteachingTool (TTT) player12 , even though they “only” had
to install Java, JMF (Java Media Framework), and the TTT application.
The learners should not be required to install any proprietary viewer software
or codec and should not be restricted to a certain operating system. Therefore it
was decided to realize the replay as a Java Applet running in any Java-enabled
browser.13
The system is not designed to replace teaching in the classroom. The recordings should “capture the live experience” of the lecture’s natural flow, as well as
having the teaching style formed by interactions with a learning audience. The
11 For example AOF, Lecturnity, and Camtasia require proprietary player software. Others
require to install certain Windows Media codecs or rely on the RealPlayer, or a combination
of these techniques. See Sections 1.5 to 1.8 for details.
12 See Section 1.8.1 for a description.
13 While there are some browsers that are not able to run Java Applets, this is a usage
requirement that is much lower than all available alternatives that allow for dynamic playback.
It was also decided to stick with Java version 1.1 for the replay, as most pre-installed Java
browser plug-ins are still of this rather early Java version.
1.3. BOARD HARDWARE
7
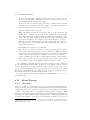
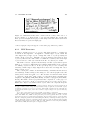
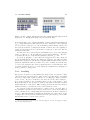
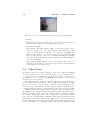
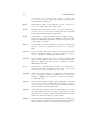
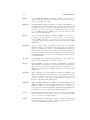
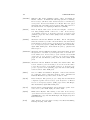
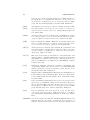
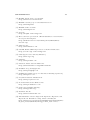
Figure 1.3: The ChalkBoard PowerPad by Chalkboard Inc. was an early example of a digitizer tablet. It was available for the C64 and the Atari 800/XL/XE
and came with educational software. Additional edutainment programs were
sold for the PowerPad. Each came with a plastic clamshell box to serve as a customized template that was laid over the PowerPad’s surface. Image from [51].
approach merges classroom teaching, distance teaching, and the production of
courseware into a single task.
Not only does the replay allow for pure distance-teaching scenarios, it also
relieves the classroom students of the burden of writing down everything and
gives them more time to participate in the lecture, as the recording is a dynamic
script of the class where the teacher’s side notes are not lost. Experiences
showed that automatically-generated script does not eliminate note-taking by
students. Instead, their notes become less literal copies of the board content
and more summaries capturing “the essence of the lectured material in their
own words” [TA99].
1.3
Board Hardware
When using the E-Chalk system, the instructor needs to have some kind of
electronic pen-input device and a display for the audience. In situations where
the hardware needs to be portable, a Tablet PC with a data projector to display
the computer screen for the class is a viable option. Alternatively, digitizer
tablets can be used. The tablets come in a broad range of variants, including
tablets with integrated LCD screen [104], greatly easing the required hand-eye
coordination in writing and drawing. Both Tablet PCs and digitizer tablets
track the pen using electrical induction.
An early example of digitizer tablets which even used the chalkboard metaphor is shown in 1.3. The first commercially available notebook-sized computer
with integrated input pen was the GRiDPad from GRiD Systems, released in
September 1989. Its operating system was based on MS-DOS. In 1991 another
tablet computer, the Momenta Pentop [Mom91] from Go Corporation, became
available, this time with a dedicated operating system, called PenPoint. These
early examples were commercial failures, suffering from available handwriting
recognition not being sufficient for user requirements, and from the product’s
high cost and weight. The Momenta, for example, weighed seven pounds and
had a purchase price of about $5,000. So pen computers beyond PDA size did
8
CHAPTER 1. INTRODUCTION AND RELATED WORK
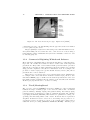
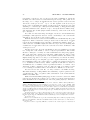
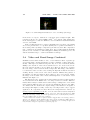
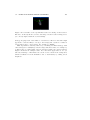
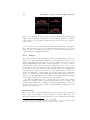
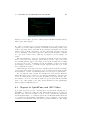
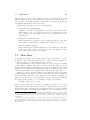
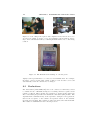
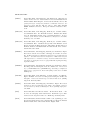
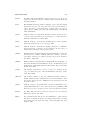
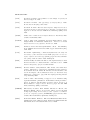
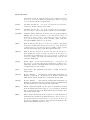
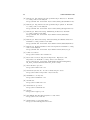
Figure 1.4: E-Chalk with a plasma-screen display, here in combination with a
digitizer tablet (Wacom Intuos [103]) as input device.
not become popular before the Windows Tablet PCs, released in late 2002.
When hardware mobility is not an important factor, the instructor should
ideally be enabled to write directly on the shared screen. This way, learners
do not have to look back and forth between the talking teacher and the screen,
as both are in the same place. For this, technologies for pen-writing on wall
displays are required. Display technologies of such solutions usually use front
or rear projection. In early E-Chalk experiments, plasma screens with touch
technology were also tested [Raf00,RKRF00,RKFF01], but the susceptibility of
these screens to burn-in effects made them an inapt choice. See Figure 1.4 for
an example usage.
A front-projected solution is much cheaper than a rear-projection system and
easier to move, as rear-projection systems tend to be quite heavy. However, the
projection of the latter is superior in brilliance, is less susceptible to interference
from sunlight, and the instructor also does not cast shadows when he or she
stands in front of the display. With front-projection, the instructor might look
into the glaring projector when turning to the audience. Moving the board
changes the relation between position on the board and in the displayed image,
and requires recalibration of the system. In the near future, organic displays
are expected to be available for large screens, eliminating these drawbacks in
display technology.
1.3.1
Digital Boards
Xerox PARC not only pioneered the GUI with the introduction of the Xerox
Star System [JRV+ 89], its former division LiveWorks also produced the first
digital whiteboard, the LiveBoard [EPT+ 92]. The system used a rear-projection
screen controlled by a built-in workstation or PC14 , and a set of tracked pens
for different colors. The system allowed overlay annotations and had the ability
to interoperate seamlessly with remote LiveBoards in other locations.
The BrightBoard [SFR96] and the ZombieBoard [Sau98, BBJ+ 98] are both
regular whiteboards with markers, where the whiteboard actions are tracked by
14 The research version used Solaris workstations. The version later sold as a commercial
product used PCs running Windows 95.
1.4. PEN COMPUTING SOFTWARE
9
a video camera. Drawing commands triggered actions by the system, like a save
of the video-scanned board content.
A number of digital whiteboards use basically the same tracking technology
as digitizer tablets. The boards mainly differ in being larger than the pads and
being mounted upright. Examples include products like the Numonics IPM
series [69], the Promethean ActivBoard series [77], the GTCO whiteboards [31],
the TeamBoard [91], and the Panasonic Panaboard [73]. They can track the pen
both when it is near the board but not touching it (similar to hovering mouse
cursor) and when the pen is pressed down for writing (similar to a mouse drag).
Many also feature an extra button on the pen, allowing to emulate a second
mouse button.
With the products Mimio [102] and EBeam [21] one can turn regular whiteboards into digitizing ones. The product is compromised of sheaths for normal
whiteboard pens and sensors to be attached to the whiteboard by vacuum cups.
When the pens are pressed down for writing, they are located on the board by
a combination of ultrasonic and infrared signals. In early experiments of the
E-Chalk project with Mimio, the device exhibited observable delay, too large
for it to be conveniently used in combination with a front projection.15
The SmartBoard products from Smart Technologies [88] include both frontand rear-projected systems. Their pen input is based on touch technologies,
registering pressure on a touch-sensitive film by measuring changes in the electrical resistance. A finger can be used instead of a pen, but the input system
does not distinguish between a mouse drag and a mouse move. The SmartBoard
handles several colors of writers and an eraser tool. This is done by trays to
keep the writing tools in. The system assumes the writing tool to be used for
which the associated tray is empty. When the user holds a pen in each hand or
puts a pen in the wrong tray, things can quickly become confusing.16
PolyVision Visual Communications [76] Webster LT Series uses lasers to
track the reflective bands of the pens and erasers. Different pens have different
reflective patterns, so that they can be distinguished. The Webster TS Series
from the same company uses resistive sensors.
The StarBoard Series from Hitachi Software [35] features both front- and
rear-projected whiteboards. Some of the pen-tracking systems for the frontprojection systems are based on electrical induction, others use a combination
of infrared and ultrasonic tracking. The rear-projected StarBoard R-70X tracks
the pen with an infrared laser.
1.4
Pen Computing Software
A number of pen-input metaphors have been considered, including writing in
notebooks, for example Filochat [WHW94] and Dynomite [WSS97a], both described in Section 1.5.1, on cocktail napkins [GD96] or onion skins [Kra94],
the flip-chart metaphor, e. g. Flatland [IMEL99], see Section 1.5.4, or the oilpainters-palette-and-easel metaphor, see M-Pad [Rek98] in Section 1.5.7. The
15 A project spawned from these experiments for developing GNU/Linux driver for several
whiteboard interfaces including Mimio [19].
16 Even worse, in one of the schools where the use of digitizing boards was evaluated within
the CidS! (Computer in die Schulen!) project – see Section 8.1, the eraser tool was stolen,
causing the board to interpret all writing actions as being done with the eraser. A dummy
had to be put into the eraser tray as a workaround.
10
CHAPTER 1. INTRODUCTION AND RELATED WORK
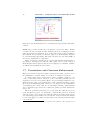
Figure 1.5: Writing the word “finished” with a single stroke using Cirrin. Figure
from [MA98].
Apple Newton MessagePad [App93] used writing on sheets of paper as a metaphor. The interface of the PenPoint OS [CS91] was based on a notebook
metaphor, and the use of the pen as the primary, and for most uses only, input
device. It was a product of the Go Corporation, the earliest operating systems
written specifically for graphical tablets and personal digital assistants, running
for example on the Momenta and AT&T’s EO Personal Communicator.
For creating text input with a pen or mouse, a number of approaches have
been devised. The simplest approach is the use of a software keyboard [SRS+ 93],
like the one provided on Windows platforms. Handwriting recognition is another
popular approach; i. e. the CalliGrapher [74] recognition engine by Paragraph
International was integrated in the Apple Newton, and the recent version is part
of the Windows CE and XP Tablet editions. The Xerox Unistroke Recognizer
[Gol97, GM93] is a gesture-based system loosely based on the Roman alphabet,
using a single stroke per letter. A similar system is the PalmPilot [72] OS’s
Grafitti.
To submit commands with pens, context menus with a dial instead of a
linear arrangement are often used. These pie menus [Hop91] allow the user to
learn the command selections in a kind of stroke gestures. On the downside,
they are hard to extend when new commands are added, and for control by
pen input they suffer from occlusion by the writing hand. T-Cube 17 [VN94] is
a system to type input in the absence of a keyboard (i. e. with a mouse or a
pen) using pie menus, predicting this being faster than linear menus or software
keyboards, according to Fitts’ Law18 [Fit54]. Quickwriting [Per98] also uses
circular menus, but tries to reach interruption-free input sequences by returning
to the home position between keys instead of signalling each key input by lifting
the pen. Cirrin [MA98] is a key-input software originally designed for users with
repetitive strain injury. Like Quickwriting it allows to enter the keys without
having to lift the pen before a word ends, quickly training the user to remember
the key input motions as kind of gestures. Its main difference to Quickwriting
17 The input system called T-Cube is not related to the distance-teaching system t-Cube
from Universität Trier described in Section 1.8.8.
18 Fitts’ Law states that the time to acquire a target is proportional to log(d/s) with d the
distance of movement from start to target center, and s is the size of the target.
1.5. PEN-BASED OFFICE AND CSCW TOOLS
11
is that it arranges the letters in a circle, giving a rather fine-graded “wheel”
of choices instead of a hierarchical organization, see Figure 1.5. For standard
commands instead of key inputs, the flowmenus described in Section 1.5.6 also
use the homing strategy to allow for rapid input of consecutive commands.
For entering text with Dasher [WBM00], the user selects the rectangle for the
next letter, where size and position of the rectangles depend on the probability
of the letter as the next input element. This makes it easier and thus faster
to select a probable letter. Note that the size-determining probabilities are
language-model dependent. The drawback of the system is that it requires
constant visual attention to operate, and it is still slower than the traditional
keyboard.
1.5
Pen-based Office and CSCW Tools
Boards are often used in companies as a tool for presentation and brainstorming support. In offices, they are also used as memory-extension tools as well as
a semi-public drawing area shared with collaborating visitors [Myn99]. When
digitizing whiteboards entered the market, the first applications were in commercial settings. Other pen-input-enabled electronic devices are also prevalent
in commercial contexts, like PDAs and Tablet PCs.
As a consequence, pen-based interactions have mostly been researched in
the context of computer-supported collaborative work (CSCW) and office tools.
Most CSCW tools provide shared workspaces according to the WYSIWIS principle (what you see is what I see) and often allow one to capture the results of a
session (“collaborative capture systems”), though in most cases they allow only
a static snapshot of the result.
Many of the research projects are closely related to the idea of Ubiquitous
Computing. In fact, according to [Wei93], the first Ubiquitous Computing technology to be deployed was a digital whiteboard, the Xerox LiveBoard.
1.5.1
Personal Note-Taking
Storing pen-based annotations as personal notes is one of the main applications
of PDAs and Tablet PCs, coming with pen-input software like the aha! Inkwriter
[aha93] and the Windows Journal. In contrast to the CSCW tools, these types
of notes are not primarily meant to be shared with co-workers.
The objective of the Dynomite [WSS97a, WSS+ 97b] (dynamically organized
ink and audio notebook) is to maintain to-do lists, personal diaries, address
lists, and other notes. It records pen actions, audio may be added optionally.
The handwritten notes are given creation timestamps. For retrieval of the notes
a keyword-query interface was created.
Filochat [WHW94] aims at replacing the traditional dictaphone. It uses an
LCD tablet for indexing the recorded audio by hand-written notes. A header
with time and date information plus space for a handwritten topic and name is
automatically generated for each new notes section. The recorded audio can be
accessed for replay by a seek option or by selecting the associated note.
The Audio Notebook [Sti96, Sti97, SAS01] is another approach to combine
a digital audio recorder and a notebook, but it is built as a physical device
using real paper for note-taking, see Figure 1.6. It relies on a digitizing pen for
12
CHAPTER 1. INTRODUCTION AND RELATED WORK
Figure 1.6: An Audio Notebook prototype. Figure from [SAS01].
computerized access to the handwriting and the paper sheets used are marked
to be recognized by the device.
Marquee [WP94] is a system for annotating videos with handwritten notes.
For synchronizing the notes with the video, time zones are created using a
horizontal-line gesture. Handwritten keywords are manually converted to text
for indexing purposes.
1.5.2
Commercial Digitizing Whiteboard Software
Most customers of digitizing whiteboards buy the hardware to equip their meeting rooms. As a result, the software for these boards focuses on meetings and
presentations. They build on the standard desktop GUI and allow pen-based
annotations. Some support desktop sharing for interaction with local co-workers
using personal computers, some allow for distributed work. For example, the
products of Centra Symposium [9] and WebEx Training Center [107] aim at
presentations to remote audiences.
Often, these tools can save the board content in static pages; ACTIVstudio
for example, that comes with the Promethean ActivBoard [77], allows to save
materials as HTML pages or as Microsoft PowerPoint presentations. Some even
have limited replay capabilities, like the software of the SmartBoard from Smart
Technologies [88], that is able to do audio recording.
1.5.3
Tivoli/MeetingBoard
The objective of Tivoli [PMMH93] from Xerox PARC is to support informal
business meetings of small groups on an electronic whiteboard. It handles
pen-based writing, drawings, wiping, and gestural editing. Tivoli has grouping
techniques based on automatic recognition of implicit structures and a flexible
re-grouping mechanism [MCvM97]. The interface is optimized for sorting, categorizing, and annotating whiteboards content. Board strokes are represented
as splines. Gestures are used to select, move, and change the properties of objects shown on the board and to zoom in or out. Scripts can be plugged in for
additional stroke processing [MvMC98a, MvMC98b, MvM00]. Various people
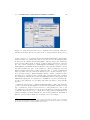
1.5. PEN-BASED OFFICE AND CSCW TOOLS
13
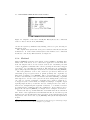
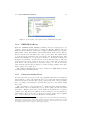
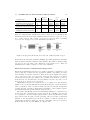
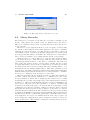
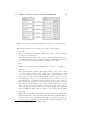
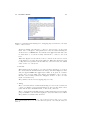
Figure 1.7: Snapshot of the Xerox LiveWorks MeetingBoard, the commercial
version of Tivoli. Picture from [MCvMK95].
can use the system by simultaneously running connected copies, allowing for
distributed work.
The original Tivoli system was developed for Sun-based LiveBoards and Sun
workstations. A version named MeetingBoard was marketed for commercial
LiveBoards controlled by Windows PCs, see Figure 1.7.
1.5.4
Flatland
Flatland [MIEL99] is another development of Xerox PARC for digitizing office
whiteboards. Like Tivoli, it is a collaborative application for informal office
work. Its design is based on a two-button event model: a standard pen-down
on the board surface is translated into a stroke, pressing an extra button triggers
a pie menu19 for controlling the application. The input space is organized into
pages, using a flip-chart metaphor. Sessions are stored automatically [IMEL99].
The basic primitives of the board content are pen strokes, which are automatically grouped together based on spatial proximity into “segments” by
using their bounding boxes [IELM00]. The board elements can be dragged
around or automatically reordered. It features automatic shrinking of segments
when squeezed to screen border (“screen real estate management”) and a layout control to prevent overlapping. Segments can be applied “behaviors” to
be triggered by the context menu, for example modifying to a map-like output
replacing single strokes by double line “streets”, adding check boxes to lines of
written text, straightening line segments of sketches, or a calculator behavior
processing inputs of numbers and basic calculations. New behaviors can be
plugged into the system [MIEL00]. See Figure 1.8 for examples on behaviors.
Flatland also has a powerful multi-undo mechanism that allows rollback in
time. Each of the segments has an individual time-line stored with a special
transaction model, allowing undos and redos based on the segment’s history and
independent of the other board objects [EILM00]. The system was implemented
in Java.
19 Flatland uses the variant of pie menus with the homing strategy for uninterrupted input
sequences. See Section 1.4 for a short description of pie menus.
14
CHAPTER 1. INTRODUCTION AND RELATED WORK
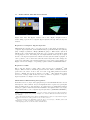
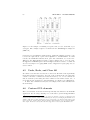
Figure 1.8: Left: Several Flatland segments with different behaviors applied
to them. Right: Adding a single stroke to a segment with the map behavior.
Figures from [IELM00].
1.5.5
i-LAND and FLUIDUM
The Fraunhofer i-LAND [SGH98] project is inspired by augmented reality and
Ubiquitous Computing. Computer-augmented “roomware” is created by integrating computer-based information devices into parts of a room (e. g. furniture,
doors, walls) and to form co-operative environments, rooms, and buildings. The
project tries to create the “workspaces of the future” [SGH+ 99] as an interactive
landscape for creativity and innovation, for example group work and informal
meetings where participants are at different locations. The controlling beach
software is written in Smalltalk. [STMTK01].
Apart from a mechanism for establishing relations between physical objects
and information objects called the Passage mechanism, the project created
an interactive table (called InteracTable), computer-enhanced mobile and networked chairs called CommChair, and an interactive electronic wall called DynaWall. This is a 4.5×1.1 m back-projection wall with a resolution of 3072×768
pixels, realized as a combination of three Smart rear projectors, each of the three
segments using its own computer. Its software supports video-conferencing and
sharing content material between the local and the remote meeting sites. As
described in [Gei98], it also supports gestures for
[...] shuffling display objects around, throw them to office users
standing at the opposite side of the wall, [...] take objects and put
them back at another location
exploring new forms of interaction with electronic boards.
The FLUIDUM [27] (flexible user interfaces for distributed ubiquitous machinery) lab research at Universität des Saarlandes is of a similar vein, with
the goal of developing techniques and metaphors for differently-scaled Ubiquitous Computing scenarios, like interactive desks, rooms, and buildings. Among
others, the wipe gesture is researched as an interaction technique.
1.5.6
IRoom/I-Workspace
The Stanford I-Workspace [WJF02] is another project on interactive workspaces.
Their IRoom (interactive room) is equipped with a display-enhanced table, and a
high-resolution back-projection wall, the Stanford Interactive Mural, measuring
6×3.5 feet with a 64 dpi resolution and realized with a 4×3 array of projectors.
1.5. PEN-BASED OFFICE AND CSCW TOOLS
15
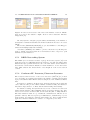
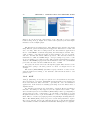
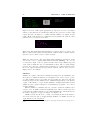
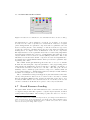
Figure 1.9: The Web-based NotePals Note Browser, showing thumbnails of the
notes matching the query. Picture from [DLC+ 99].
The IRoom allows visitors to interact with the room components via PDAs connected with PPP over serial cable or with WLAN [FJHW00]. They can control
the room light, the projectors, PowerPoint presentations shown on the Mural,
annotate them (called Smart PowerPoint by the developers), and share data
objects and applications. In contrast to the i-Land project, the IRoom strategy
is to support standard Unix or Windows applications as regular components of
the environment.
For managing the communication between different components, the Javabased room display manager uses a special event heap transmitting the events
to all receiving clients. The transmission strategy is specially designed for robustness [Win01a].
The IRoom applications and interaction schemes researches focus on CSCW
tools, brainstorming, and direct interaction with board elements, mainly modification of size and position. Their preferred user interface metaphor are a pen
and virtual sheets of paper [Win01b]. To achieve what they call a fluid interaction using pen input, the command mechanism relies on flow menus, a variant of
pie menus [GW00, GMW01].20 The advantage of flow menus is that they avoid
the necessity of visual feedback once learned as stroke gestures by the user and
thus reduce the cognitive involvement in submitting the commands. Another
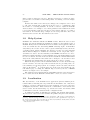
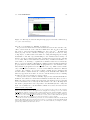
concept used is the typed drag and drop, where board objects can be assigned
types to determine their behavior when dropped onto another typed object.
The interface allows continuous freehand scaling, and all actions are logged to
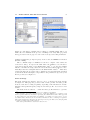
supply an infinite undo mechanism. Visual snapshots can be taken [GSW01].
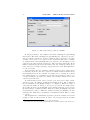
Applications developed for testing the concepts are a brainstorming tool called
PostBrainstorm [Gui02] and the GeometersWorkbench [GWW00] for differential
geometry by informal sketching, using Wolfram Mathematica for the calculations.
1.5.7
Other CSCW Systems
DOLPHIN [SGH+ 94] is a system to capture informal work-group meetings,
supporting synchronous and asynchronous settings. It manages both shared and
private documents. Text, images, handwriting, and audio can be transmitted
20 See
Section 1.4 for a short description on pie and flow menus.
16
CHAPTER 1. INTRODUCTION AND RELATED WORK
synchronously. Asynchronous access to a meeting’s documents is allowed, but
the interaction is not recorded for replay.
Coral [MHJ+ 95] is a “confederation” of tools to support real-time capture
and replay of free form meetings. It captures materials shown on the whiteboard
including freehand markings and the audio stream.
The transBOARD [IU97] is a physical whiteboard with pen-tracking based
on infrared laser scanning. Remote users can view whiteboard activity both
synchronously and asynchronously via a Java Applet.
The CSCW system described in [Rek98] combines one PalmPilot PDA per
user and a single shared whiteboard. The Palms, called M-Pad by the authors,
serve as tool palette and data-entry palette for the whiteboard, implementing
an oil-painters-palette-and-easel metaphor.
NotePals [DLC+ 99] is a note-sharing system for work groups running on
PalmPilots. It records timestamped handwritten notes and adds some context
information, the name of the author and the project name. In an optional postprocessing step, pattern recognition is applied to the notes to support additional
retrieval methods. See Figure 1.9.
DUMMBO (dynamic ubiquitous mobile meeting board) is intended to capture informal meetings. It records board history and audio as WAV. The recording starts automatically when more than two people gather at the board or when
somebody starts to write or erase on the whiteboard [BAT99, DSA01].
1.6
Course-Authoring Systems
Course-authoring systems are tools for the non-live development of e-learning
material. A number of authoring systems for general HTML page building or
for interactive multimedia applications are often used for generating e-learning
modules. Commercial examples of the first type include Microsoft Frontpage and
MacroMedia DreamWeaver, the second type includes ToolBook [89], SWISHmax
from SWISHzone [90], MacroMedia Director [59], and AuthorWare 21 [58]. Most
multimedia authoring tools require specific runtime environments or browser
plug-ins for replay (for example Authorware Player, Flash Player, ShockWave
Player), others can create native applications, e. g. Multimedia Fusion [15] can
compile its animation to Windows applications.
In addition to these general multimedia authoring systems, there is a range
of systems that focus on generating interactive educational material on specialized subjects, for example Cinderella [RGK99] [11] for Interactive Geometry and JavaView [PKPR02] [45] for 3D geometry viewing and mathematical
visualization, both producing using Java Applets. Another example is Flashdance [Esp04], creating Flash animations for algorithm visualization.
The following sections describe a number of authoring systems focusing on
the production of courseware for university teaching.
1.6.1
MANIC
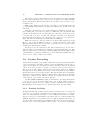
The MANIC [SSL+ 97,PK99,BKT02] [60] (multimedia asynchronous networked
individualized courseware) system delivers slides as HTML documents and GIF
images, optionally with timed highlighting effects. This is synchronized with an
21 MacroMedia
AuthorWare is even specifically targeted at authoring e-learning content.
1.6. COURSE-AUTHORING SYSTEMS
17
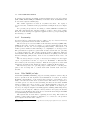
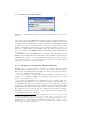
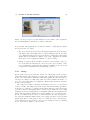
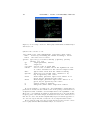
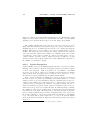
Figure 1.10: A MANIC lecture on Unix network programming with RealVideo
and RealAudio.
audio stream encoded in RealAudio, experimentally also with RealVideo, see
Figure 1.10. The audio is encoded for low-bandwidth quality, requiring only
a modem connection. The system also comes with a connection to a MYSQL
database for storing and searching courses, with the access interface being built
as PHP scripts for Apache Webservers. The MANIAC 2.0 server is written in
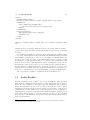
Perl, the previous version (numbered 1.5) was implemented in Java.
To create a MANIC course, the author creates the HTML pages and/or images externally. To highlight text in the HTML pages, the author manually adds
a special MANIC tag into the document’s HTML code. Audio is encoded from
DAT or videotape recordings. The Timing Data Recorder (TDR) application
creates program timing events for the presentations. At the server, the replay
is controlled with CGI scripts. At the client side, a JavaScript-enabled browser
with cookies enabled and the RealAudio plug-in installed is needed to view the
course. The viewer’s navigation options include starting and stopping the replay, jumping to the next or the previous slide, and random access of slides via
a table of contents.
1.6.2
Cornell Lecture Browser
The Cornell Lecture Browser [MS99] [17], which is also used by Berkeley as the
BMRC Lecture Browser [5], shows slides with a synchronized RealAudio and
RealVideo stream. It uses JavaScript to pre-load the slides into the browser
cache to reduce delays in slide transitions. All slides have to be converted
manually by the author to a browser-supported image format.
1.6.3
AudioGraph
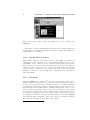
AudioGraph [JSS98, Jes00, Jes01, Jes03] [2] is an authoring system combining
images, lecturer annotations, highlighting of selected areas, and playback of
sound clips. The author sequentially adds elements like hand-drawn images or
imported images to a slide and determines the transition times between the
elements, meaning that the elements appear one after another. He can also
add audio to be played, the length of the audio chunks usually determining
the transition times between graphical elements. The system generates one
18
CHAPTER 1. INTRODUCTION AND RELATED WORK
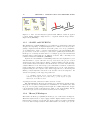
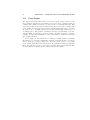
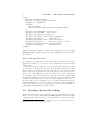
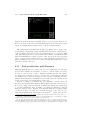
Figure 1.11: An AudioGraph lecture on transformers [61] replaying a handwritten slide.
HTML page per slide and the user can navigate between the slides. Within
one slide, the user can start the slide animation from the beginning as well as
pause and resume the animation. A progress bar shows the position within the
slide animation, but random access is not supported. AudioGraph is designed
for low-bandwidth requirements. The audio stream is encoded using GSM 6.1
mobile telecommunication compression.
Figure 1.11 shows a snapshot from a purely hand-drawn AudioGraph lecture, using a Java Applet for playback. The replay of more recent versions of
AudioGraph lectures requires a custom browser plug-in to be installed, available
for Macintosh and Windows PC browsers.
1.7
Presentation and Classroom Enhancement
This section describes systems to assist lecturing in the classroom and tools for
live transmission of classes, which do not aim at recording the experience.
A common approach for lecturers who want to transmit a class is to use
a video-conferencing solution. However, video-conferencing systems have not
explicitly been created for teaching. Their conception assumes symmetric communication and relies on all participants to have equivalent hardware. Great
effort is spent transmitting audio and video, but support for the transmission
of teaching-specific content, such as board drawings, is lacking. Using standard
video-compression approaches, they exhibit the quality problems discussed in
Section 1.1.
The most prominent presentation tool is PowerPoint, which has been already discussed in Section 1.1. Demands to augment slide shows by freehand
annotations were often expressed to make the talks more flexible than it is the
case when using prepared slides only. To this end, several research systems had
been devised and by now, Microsoft has added some annotations functionality
to PowerPoint.22
22 The
Office XP for Tablet PC (Tablet Pack) adds “ink” features to Office applications. In
1.7. PRESENTATION AND CLASSROOM ENHANCEMENT
19
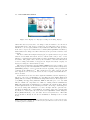
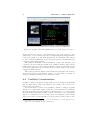
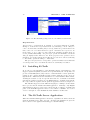
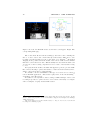
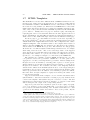
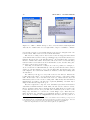
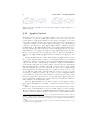
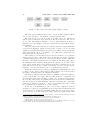
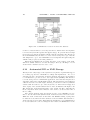
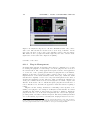
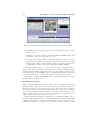
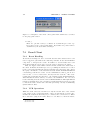
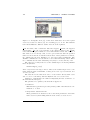
Figure 1.12: Classroom Presenter. Left: View of the instructor’s screen. Middle:
View projected for the audience. Right: View for remote students. All three
images from [13].
An early system to integrate prepared slides, handwriting of the instructor,
and student contributions submitted from their desks is the Lecturer’s Assistant
[BP94].
The Pebbles [MSG98, Mye00, Mye01] project uses PDAs for controlling presentations including stylus-based drawing.
ActiveClass [RSTG03] uses PDAs to promote interaction by allowing students to submit text-based questions to the instructor and to respond to polls
submitted by the instructor.
1.7.1
BIRD Note-taking System
The BIRD (beacon-identified realtime display) Note-taking System [30] is an
application based on .NET that allows the lecturer to use annotated slides. The
students use laptops with wireless access to the same subnet as the instructor
uses and use a client software installed on their machines to receive the lecture
data. That software also allows them to save snapshots of the received screen
content.
1.7.2
ConferenceXP Presenter/Classroom Presenter
The ConferenceXP Presenter or Classroom Presenter [AAS+ 04] [13] is used
for both classroom teaching and synchronous distance teaching and was first
deployed in summer 2002. The Presenter is designed to run on Windows Tablet
PCs.
In lectures, it organizes content in pages: slides are shown by the lecturer and
can be annotated. To provide a kind of whiteboard functionality, the instructor
may insert empty slides to be filled with freehand writing and drawings.
For distance teaching, the system is used by a video conference in connection
with ConferenceXP [16]. The transmission is two-way and a client needs to have
Classroom Presenter, ConferenceXP, and PowerPoint (XP or 2000) installed.
The data transfer is built on top of multicast communication, which does not
guarantee delivery. The developers report difficulties to transmit large objects,
such as slides, especially in a wireless environment [13]. As a workaround the
application allows a manual re-broadcast to be triggered by the client.
Office 2003, these are already integrated.
20
CHAPTER 1. INTRODUCTION AND RELATED WORK
The system produces three different views: the instructor’s desk, including
special controls, the image sent to the projector in classroom teaching, maximizing the current slide with its annotations, and a third view for remote access,
see Figure 1.12.
While being designed for mobile use, according to a survey this feature did
not rank highly among instructors [AAS+ 04]. Instead, the preferred use was
stationary.
Students’ contributions to the common display are usually done by the lecturer passing his or her tablet around, see [AAS+ 04], but experiments with
real-time feedback from remote participants as collaborative work in the classroom have also been done. To this end, students connecting via a Tablet PC
may send annotated slides to the instructor, who can choose to present those
slides and annotate them him or herself [AAV+ 03, SAHS04].
While the setup in connection with the ConferenceXP application would
allow to encode the transmitted session to a (huge) stream for replay with
Windows Media Player, the reported use of the Classroom Presenter so far is
exclusively in synchronous teaching.
At sub-projects, the annotations and slide transitions were stored and a
custom replay tool was built, albeit exclusively for post-analysis purposes. The
annotation patterns of lecturers were analyzed [AHP+ 04b] and the effectiveness
of handwriting recognition for this kind of content was studied [AHP+ 04a]. See
Section 6.8 for a short outline of the results.
1.8
Lecture Recording
AutoAuditorium [Bia98] [3] from Telcordia Technologies (formerly named Bellcore) is a system for automatic camera control in transmission and storage of
classroom presentations. AutoAuditorium setup uses three cameras, one having
a front view on the lecturer on a stage, one fixed at a projection screen for a
slide projection, and a third looking at the lecturer from a side view. Multiple
microphones are used, usually at the stage, in the auditorium and optionally a
wireless microphone worn by the speaker. The system mixes the sound signals,
tracks the lecturer with the cameras looking at him or her and uses a heuristic
approach to switch between different cameras. For example it shows the view
on the slide projection when a new slide appears.
We-Met [WRZO91, WRB92] (window environment – meeting enhancement
tool) is a tool for an electronic whiteboard to show slides with pen annotations. Interactions are stored for replay, but audio capturing is not supported.
Handwriting is saved as timed vector data, keeping its storage size small.
1.8.1
Desktop Grabbing
Applications that grab desktop activity and store them as video for replay can
be used to record lecture presentations, especially if they allow to record the
audio of lecturers narration and have tools for adding annotations. For example
Camtasia Studio [8] by TechSmith Corporation [92] is a commercial Windows
2000/XP application for real-time screen recording and synchronized audio. It
also allows place marks with cursor-highlights, and, in a post-production phase,
captions, text boxes, and graphics can be added. To avoid the detrimental
1.8. LECTURE RECORDING
21
Figure 1.13: Replay of a Tegrity recording about using Tegrity.
effects introduced by lossy video encodings, a custom lossless codec, the TechSmith TSCC Codec, was developed. However, it requires the remote viewer to
install the codec for replay, which is only available for Windows. The presentations can be exported to standard video formats (AVI, QuickTime, RealVideo)
with standard encodings, but this re-introduces the problems of hard-to-read
contents.
Another commercial example is Tegrity [93]. It captures the screen, provides
software for freehand annotation, and records the audio and/or video of the
instructor. A Java Applet player handles both live transmission and replay from
an archive. The player can be used by the students to add their annotations
to the recording, as freehand or as typed text. Figure 1.13 shows a replay of a
Tegrity recording in a Java-enabled browser.
The Transparent TeleteachingTool [ZS02] (TTT) is a screen-recording tool for
teaching developed at Universität Trier. It uses the Virtual Network Computing
[RSFWH98] (VNC) tools for a networked screen capturing of the presentation
computer at the TTT server.23 The captured screen, audio, and an optional
video signal are encoded by the server, stored for replay, and multicasted to
remote viewers.
In synchronous access, the audio signal is transmitted as uncompressed µlaw mono, the video as M-JPEG, encoded using the Java Media Framework
(JMF). The screen image is transmitted using VNC’s Remote Framebuffer Protocol (RFB). For supporting multicast, TTT modified the protocol to use UDP
instead of TCP. To compensate for UDP not offering reliable transmissions,
TTT added information transmitted for redundancy in critical updates. Bandwidth requirements are about 50-60 kbps for audio, an average of 50-60 kbps for
the screen, with peaks estimated to be twice as high, and the optional video
ranging from hundreds to over 1,000 kbps, depending on the video stream quality. In the recorded lecture, the video is stored in QuickTime format using the
H.263 [Zhu97, BCD+ 98] codec, the audio is stored as µ-law mono. The VNC
screen stream is directly stored as it is transmitted. Examples can be found
at [95].
23 In [ZS02] the authors report difficulties with handling the audio recording and the transmission on the same computer. As a workaround, they use different servers for the two tasks
of archiving and live transmission.
22
CHAPTER 1. INTRODUCTION AND RELATED WORK
Figure 1.14:
[CKRW99].
The NoteLook client for synchronous access.
Figure from
The client for both live transmission and replay from recording is realized as a
Java application, providing platform-independent access. The client application
requires JMF to be installed.
1.8.2
Just-In-Time Lectures
With Carnegie Mellon’s Just-In-Time Lectures [47] (JITL), the instructor’s
teaching is recorded on analog video. Later this is digitized and encoded as
a QuickTime movie. Slides are stored as high-resolution images and synchronized with the video stream by the Just-In-Time Lecture Player. An additional
textual sections overview is added to provide contextual navigation. The system uses e-mail for questions to the teachers and access to the online library
(a FAQ) as “interactive” features. Disk space requirements for the streams are
quite high [DC97].
1.8.3
NoteLook
NoteLook [CKRW99] is a Dynomite 24 successor, but with the focus on notetaking in a shared lecture instead of on office work. It allows synchronous remote
access to the lecture and uses the student’s control for capturing individual
recordings. The students are equipped with wireless connected pen notebooks,
and can switch between different video channels (usually takes on the room or
on the presentation material). The selected video stream is stored for replay
and single video frames can be grabbed and annotated. It also features a mode
for automatic grabbing when the video image changes, which can be used for
detecting slide transitions. See Figure 1.14. The system creates (static) HTML
pages with the grabbed snapshots of the notes. Selection of an image starts the
video playback beginning at the snapshots time offset.
24 Dynomite
is described in Section 1.5.1.
1.8. LECTURE RECORDING
23
Figure 1.15: A replay of an eClass lecture with slides and audio.
1.8.4
DEBBIE/DyKnow
With the DEBBIE [BJJ01, BBW04] (DePauw electronic blackboard for interactive education) system and its commercial offspring DyKnow [20] (dynamic knowledge transfer), students are equipped with PCs with “video tablets”
(Tablet PCs or PCs with digitizer tablets with built-in LCD screens). The instructor uses an electronic whiteboard or also a video tablet. The system allows
to present prepared material, keyboard typing, and freehand sketches. The
material is transmitted over a network connection to all student workstations.
Students can add their own annotations, both freehand and typed. The students may send portions of their work space to the teacher, who can integrate
them in his or her presentation for the entire class to see. At the end of the
class, students can save their workspace for static viewing, printing, and replay.
Audio capture is not supported.
The DyKnow Implementation is based on Microsoft .NET Framework and
runs under Windows 2000 and XP.
1.8.5
Classroom 2000/eClass
Georgia University developed a technology originally named Classroom2000 and
later renamed to eClass [Abo99, Bro01] [14]. It records lecture slides and handwritten annotations as static Web pages together with audio and (optionally)
video recordings of the instructor and any Web page he or she visited during
the lecture.
The presentation component ZenPad 25 handles showing slides in GIF or
JPEG format, added beforehand in a pre-production phase, as well as freehand
annotation. “Empty” slides can be added during the presentation to be used as
a whiteboard. Any Web page URL the lecturer visits is recorded by having the
demonstration Web browser use a custom proxy server. Audio and low-quality
video of the lecturer are encoded in RealVideo and RealAudio.
25 ZenPad is a pure Java successor of the original ClassPad program written in Visual Basic.
The ClassPad application produced static annotated slides, but involved manual upload and
structuring of lectures with about four man hours per lecture. ZenPad was developed to have
an automatic upload and to support certain replay features.
24
CHAPTER 1. INTRODUCTION AND RELATED WORK
Figure 1.16: Tools from the AOF package. Left: The mlb tool for recording
lectures, image from [1]. Right: A recorded lecture replayed by the Java implementation of the aofSync player.
The ZenStarter program is used to start different eClass system components
using different options. Starting ZenPad triggers the ZenStarters for audio and
video encoding. After the recording session, the StreamWeaver application is
used to build HTML documents integrating the timestamped streams. Also,
a list of links to each annotated slide as well as links to the encoded audio
and video streams and visited URLs is produced. The annotated slides are
transformed to GIF and JPEG images. Post-processing is reported to take
about one minute for a complete lecture. The generated material is stored in a
database. The HTML pages generated from slides have a size of about 20-200 kB
per lecture, the audio stream 3-5 MB and the video 5-7 MB.
For replay, the viewer can browse through the graphic slides and choose the
Real stream to jump to the time position of a slide. See Figure 1.15 for an
example.
The StuPad [TA99, TAB99] (students notepad) extension of eClass broadcasts the instructor’s writing to the students’ desk and allows them to add
private notes.
1.8.6
AOF
AOF [1] (authoring on the fly) is a system for both synchronous and asynchronous delivery of lectures. Transmission includes whiteboard activities, in
most cases annotated slides and audio, optionally also video and animation
applications. AOF lectures are usually given using electronic whiteboards or
digitizer tablets.
For asynchronous delivery, the client has to download all the presentation
material. Streaming is only supported for the synchronous scenario. Synchronous delivery is based on the MBone [Eri94,Cla98] technology. Originally, it
directly used vic (video conferencing tool), vat (audio conferencing tool), and
wb (shared whiteboard tool) from the MBone tool set for showing PostScript
slides. These tools allow for paging up and down plus simple drawing functionalities. The AOFwb [BO96] was developed for several Unix platforms to replace
wb for more features. Its successor mlb (media lecture board) shown in Figure
1.16 is available for Microsoft Windows and handles drawings as vector graphics.
1.8. LECTURE RECORDING
25
It can import PostScript and PDF documents (using Ghostscript [28]), images
(GIF, JPEG, TIFF, XBM) and MPEG-1/-2 streams. Audio is transmitted and
stored as uncompressed PCM (.aif).
The aofRec application is used as a synchronous client. For replay of
recorded lectures, a different client program named aofSync is used, see Figure
1.16.
For optional post-production, an editing tool named AOFedit is available for
Unix. The AOF system also features a number of other tools for preprocessing,
like the PowerPoint importer application ppt2aof, and for post-processing, like
the indexing tool aofSE.
1.8.7
Lecturnity
Lecturnity [50] is a commercial lecture-recording tool by imc Advanced Learning
Solutions [37] written in Java and run on Windows.
The Lecturnity Assistant uses MS PowerPoint slides and images (BMP, GIF,
JPEG) as the basis of a slide recording to be captured with annotations. The
presentation can also use a screen-grabbing functionality. Annotation tools
include pointer, marks, freehand drawing tool, a highlight tool, and typed text.
The presentation is captured together with an audio stream and can optionally
be combined with video. The capture application runs on Windows, using the
Java Runtime Environment, the Java Media Framework (JMF), and the Java
Advanced Imaging (JAI) library. Video is encoded with the Indeo Video 5.0
codec.
The Lecturnity Player for replay of Lecturnity recordings is a Java application. A presentation can also be exported to RealMedia or Windows Media formats by the Lecturnity Publisher. This allows replay in browsers with
JavaScript, StyleSheets and RealPlayer plug-in or Windows Media plug-in.
The Lecturnity editor for optional post-processing allows to cut and paste
parts of the recording and to combine them with external audio and video
streams.
1.8.8
Tele-TASK/t-Cube
Tele-TASK [CMMS03, MSCM03] [94] (tele-teaching anywhere solution kit) is
used for synchronous and asynchronous transmissions of lectures. It delivers
RealAudio and RealVideo of the lecturer plus a sequence of screenshots – normally of an annotated slide show by the lecturer. The slides are captured at
one frame per two seconds. For live streaming, the slides are streamed as BMP
images, requiring the remote viewer to use a high-bandwidth connection. In
a post-processing step, a narrow-bandwidth version (ISDN or modem) is produced by encoding the snapshots as PNG graphics, utilizing PNG transparency
to achieve an encoding into difference and key frames. For replay, the RealPix
technology from RealNetworks [79] is used to stream the slide images and SMIL
for synchronizing the different streams.
The system uses an extra PC for capturing and encoding. The solution is
available commercially as all-in-one hardware to be connected to the presentation computer under the name t-Cube.26
26 Note that t-Cube is unrelated to the pie-menu based key input system T-Cube described
in Section 1.4.
26
1.9
CHAPTER 1. INTRODUCTION AND RELATED WORK
Conclusion
The approach presented here tries to solve the problem of huge costs for creating courseware material by generating it as a by-product of regular classroom
teaching. The chalkboard lecture becomes a form of e-learning authoring. The
approach benefits from many professional lecturers being able to simply walk
to the chalkboard and start up a spontaneous talk with a high degree of learner
interaction. A good chalkboard lecture should automatically result in a good
e-learning lesson. The didactic advantages and the easy handling of the traditional chalkboard should be preserved while extending its reach to distance
learning. Storage and transmission of the lecture must be realizable with negligible additional effort.
In the classroom, the system tries to enhance teaching quality by enabling
the instructor to integrate multimedia elements. Students should be given the
time to grasp the concepts. After the course, they have access to a recording
of the lecture with all relevant information. To minimize barriers for first-time
users, they should be able to replay the recordings using just a standard Web
browser, without requiring them to install any special software.
Chapter 2
User Interface
2.1
Overview
In the Lecture Room
The E-Chalk system starts with a setup dialog for the recording settings. In
most cases, the instructor just keeps the settings that were stored from the
previous session, changing just the entries for the lecture title and the path to
store the lecture to. After hitting the OK button, the system’s user interface
metaphor changes from the computer desktop to the chalkboard, a display to
be shared with an audience. The E-Chalk board window occupies the whole
screen. The instructor draws and writes on the board with a pen-like input
device.1 A tool-box type dialog allows to change drawing colors and widths.
It also provides access to a number of multimedia elements, like adding images
from a local hard drive or the Internet to the board, or integrating interactive
animations.
The board can be scrolled up and down vertically, providing the lecturer
with a virtually unlimited surface to write on. Instead of using a desktop-style
scrollbar, two drag handles are provided at the top and at the bottom of the
screen. The user grabs the board at a drag handle with the pen and drags the
board up or down.
All actions on the board are tracked and recorded. The development of the
board content can be viewed by a remote learner, both as a live transmission
and as an asynchronous replay. The voice of the lecturer is recorded along with
the board stream. These data streams already capture most of the teaching
substance. Optionally, a video stream of the instructor can be added to give
the remote lesson a more personal touch.
The system does not require the user to explicitly trigger a save. Everything
is automatically stored for viewing with a Web browser.
Remote Access
When remote students open E-Chalk’s generated Web page of a given course
with a browser, replay starts in the form of self-synchronizing Java Applets. One
1 Different hardware solutions for pen-like input devices and big displays are described in
Section 8.1.
27
28
CHAPTER 2. USER INTERFACE
Figure 2.1: Replay of the first E-Chalk lecture recorded [85] in a browser.
Applet is started for each recorded data stream, board, audio, and video. Another Applet, a control panel, is provided for VCR navigation through archived
lectures, see Figure 2.1. All these Applets run in a standard Java enabled
browser2 , without requiring the user to download a plug-in, and this solution is
completely platform independent.
The required bandwidth for the transmission of audio and dynamic board
content for the setup with the default audio quality is 64 kbps. The network
traffic generated by the board content is negligible compared to the traffic needed
by the audio signal, since the board uses a vector format. Using a video stream
requires a further 64 kbps.3
The replay provides the distance learner with a live script where the teacher’s
side notes are preserved. In addition, a static copy of the final board image as
an Adobe PDF file is included for the students to print.
2.2
Usability Considerations
Usability considerations played an important role in the design of the E-Chalk
system. Only with an easy-to-use interface, the software can be expected to
gain the user’s acceptance.
For the interaction on the board, guidelines common for desktop programs
will have to be taken with a grain of salt. The board explicitly uses a different
interaction metaphor and the guidelines sometimes have to be bent, keeping
their underlying arguments in mind. On the other hand, new requirements
appear, for example the use of the keyboard is very disruptive when working
with a pen at the board and should be avoided as far as possible. Also, double
2 The Applets need only Java 1.1, to avoid the requirement of a Java upgrade for the
browser, and they need not be signed.
3 Again, the given bandwidth is for the default setup.
2.2. USABILITY CONSIDERATIONS
29
clicks should not be required. Some persons already have trouble doing double
clicks with mice, and these are even more difficult to do with pen input devices.
Control by Keyboard
Common usability guidelines recommend that an application should be fully
controllable with the keyboard, with no need to use the mouse. Reasons are,
that expert users will often be faster with keyboard-only inputs and that one
should still be able to control the program in the absence of a pointing device.
Consequently, the E-Chalk setup dialog and all its sub-dialogs provide mnemonic
keys for all input elements.4
However, this does not hold true for the main board operations, painting and
handwriting. These cannot be naturally performed with a keyboard. The board
is meant as an interface for a pen device instead of a keyboard. Still, most nonpainting board actions can be controlled via the keyboard, for example [Ctrl]-Z
is mapped to Undo.
In the case of having no mouse or pen device to operate the board, it is
important that the standard shortcut for exiting the application, [Alt]-[F4],
works on the board. This can be crucial if one starts E-Chalk without a pointing
device, or if a battery-powered input device runs out of power.
The keyboard shortcuts are also useful to control the board with configurable
hardware devices. Several digitizer tablets and digital whiteboards allow to
map key strokes to special regions of the input area. With the board receiving
these keystrokes and mapping them to board actions, these serve as buttons for
board control. This interfacing technique is also used for the bluetooth hardware
extension of the pen described in Section 8.1.1.
Consistency
Consistency is an important aspect in user interface design.5 This avoids confusion in users and helps them to learn to use the interface quickly. What is also desirable is consistency with other applications – the interface should adhere to accepted standards. Standard GUI elements and symbols as well as standard label
names should be used wherever they are appropriate. Various platforms provide
guidelines for adhering the the platform’s standards [App92,App01a] [29,49,68].
Since the E-Chalk software is a multi-platform development in Java, the corresponding guidelines for Java programs [Sun99, Sun01] were used.6
Interface Logic
The interface must adhere to the logic of the user’s view, not of the internal
workings. It has to focus on users and their tasks, not on the underlying tech4 The only input elements without associated mnemonic shortcuts are those operated with
the [Enter] or [Esc] keys, typically OK and Cancel buttons. Of course, access by controlling
focus with keyboard tabbing is also supported.
5 This is listed first among the “Eight Golden Rules of Interface Design” in [Shn98].
6 For multi-platform programs, some special considerations have to be taken into account.
For example, the color reduction algorithms for different OS produce different output. Graphics that look good on one platform may be ugly on another. [Sun99] gives rules for designing
graphics like button icons, that will appear acceptable on all platforms.
30
CHAPTER 2. USER INTERFACE
nology. For example, there is no good reason to require E-Chalk users to trigger
an explicit save. Instead, sessions are always stored.7
The language in the interface must use clear wording and avoid “tech-speak”.
Interface texts should be short and to the point since lengthy explanations
are rarely read. A common mistake in graphical interfaces is the attempt to
compensate for explanations not being read by adding even more text.
Short explanations via tooltips are unobtrusive and should be used wherever
possible. For more detailed explanations, a context-sensitive help should be
used. Ideally, all texts are localized to the user’s language.
Interfaces must heed the fact that “people make errors routinely” [Nor88].
With a possibility to undo any action, users are provided with a low-risk environment. It invites them to explore the program and promotes learning.
The users should be guided by the software. Handling errors should be
prevented in advance, instead of returning error messages when they occur.
For example, when the computer has no sound card, the E-Chalk setup option
for recording audio is made inaccessible. The corresponding input element is
deactivated and grayed out.
User should not be burdened with technical work which it can be done
by the system. Guidance and avoiding an excess of choices greatly disburden
users. This is especially important for the board interface, as the operating
persons will concentrate on the task of lecturing. Distracting them is very
unfavorable. This is an experience also reported with other lecturing tools,
for example the developers of the Classroom Presenter learned their “lesson of
parsimony” when they observed that “instructors were strikingly restrained in
their use of Presenter’s features” [AHP+ 04b].
While users should be guided, they should always be in control. They should
be assisted in their tasks, not constrained. Common operations should be quick
and easy, while uncommon things should be still possible.
Avoiding Modes
Mode errors occur when the user misclassifies a tool’s status resulting in inappropriate actions, for example when one tries to fast forward on a VCR during
record mode, or when one turns the car key when the engine is already running.
The notion of mode errors was first defined in [Nor81].
Several types of modes are distinguished. Spatial modes dependent on location of input tool, like click on which element. The locus of attention is usually
at mode determining object and therefore these types of modes are not prone
to errors. Quasi modes depend on the state of the system and use a kinesthetic
feedback to the user. Examples are pressing down the shift key, mouse dragging (with mouse button down), and opening popup menus while holding the
mouse button down. Experiments have shown that these modes are also not
prone to user mistakes [SKB92]. Temporal modes depend on the internal state
of the system. Temporal modes increase the cognitive load of users and are
7 An objection to this might be that it uses disk space, even if the session is only meant for
drawing a quick illustration, as E-Chalk is sometimes used in brainstorming sessions. Also,
first-time users were sometimes irritated because they were already “trained” by numerous
applications to always explicitly save their documents. However, in this case the value of
adhering to the standard hardly outweighs the risk of losing recordings of complete lectures,
just because instructors forgetting to save them.
2.2. USABILITY CONSIDERATIONS
31
error prone. For example the [Caps-Lock] key introduces a mode for typing
actions. The situation is especially grave when a user is interrupted in his or
her action between triggering a mode change and employing it. An infamous
example of a mode-heavy interface is the Unix vi editor.
To get rid of modes was strongly voiced by [Tes81]. An example of a computer system that tried to avoid modes in the user interface was the Canon
Cat [Ras00]. When modes are encountered in a group situation on the electronic board, they can be expected to be especially disruptive. The instructor
is not only occupied with the board task, he or she also has to keep the audience
in mind, and any mode error distracts the lecturer and the audience from the
content of the lecture.
While temporal modes should be avoided where possible, it will not be possible to eliminate them fully. When allowing the user to draw with different
colors in a painting application or on the E-Chalk board, having the current
color as a mode is necessary.
Often the interface can help to avoid mode errors by giving visual feedback
like the mouse cursor. This feedback can go unnoticed as the task and not
the feedback is in the locus of the user’s attention [Ras00]. Feedback works
best when it is observed as part of the task itself. For example, in a painting
program, the size and shape of the drawing tools can often be chosen. Setting
the mouse pointer to the outline of the selected tool can protect from a wrong
shape or size setting in drawings, as the user focuses on the position of the very
pointer shape when he or she starts a drawing action.
According to experiments, visual feedbacks can help, but kinesthetic ones are
much more effective, both in preventing errors and in terms of reducing cognitive
load [SKB92]. Important for the effectiveness is the “kinesthetic continuity” by
having the user maintain the mode actively. Re-active feedback (like having
to hold down a button) performs much better than pro-active feedback (like
having to push a button before the action).8
Temporal modes are also introduced by modal dialogs. They were first introduced by Apple with the Mac OS [App87]. Their purpose is to get the attention
of the user by preventing them from interacting with the main application. Unfortunately, this means modal dialogs are highly disruptive. Dialogs change the
locus of attention and often hide information on the screen that is needed by
the user for the interaction.9 Modal dialogs are sometimes acceptable to guide
users in tasks they triggered themselves. The most disruptive usage of modal
dialogs is to display messages, e. g. error messages. This should be employed
very sparingly, especially when used to get user input. Frequent use of confirmation dialogs tends to condition the users so as to give a quick answer, even
before the request is consciously noticed [Ras00]. For example, requiring a confirmation for each file deletion quickly trains to confirm any deletion without
thinking [Nor98]. This does not only fail to protect against involuntary deletion
anymore, it also means continually having to do one click more than necessary.
8 Typically, those tasks already occupy the user’s visual attention. Visual feedback on the
mode has to compete for the user’s attention. Using different sensory channels is thus more
effective, for example auditory feedback can also reduces mode errors [Mon86].
9 This observation caused the introduction of semi-transparent dialogs in the Mac OS.
32
CHAPTER 2. USER INTERFACE
Figure 2.2: The E-Chalk package added to the Windows start menu.
Responsiveness
Responsiveness of applications is essential to avoid user frustration [Joh00].
Giving no feedback for longer durations is very irritating to users. They become concerned that something may be wrong. When an operation takes some
time, some sort of feedback should be given. Tolerances are reported to lie
in the range of one to three seconds, with most guidelines working with one
second [Joh00, Sun01, Shi00]. For prolonged operation in E-Chalk, a feedback
dialog is displayed after half a second. If the progress of the operation can be
measured, a progress bar is shown. Ideally, the process can be canceled, allowing
to discontinue operations taking too much time.
The perceived performance of responsive operations is much better than that
of non-responsive ones, even when the latter are technically a bit faster.
2.3
Installing E-Chalk
To provide for easy installation of the E-Chalk software, an installer for each
supported platform (Windows, Linux, and experimentally also OS X) has been
provided. InstallAnywhere [110] is used to build installers for these platforms,
setting up the complete E-Chalk software package with all resource and configuration file. This includes the installation of a Java Runtime Environment,
enabling the software to rely on a specific Java version to be installed. On Linux
systems, the package is registered to the RPM database, on Windows and OS X,
the components are registered in the platform application menu, see Figure 2.2.
The installer supports several different languages, localizing both the installation process and the installed E-Chalk application. Currently, only English
and German are supported. An older version was also localized to Spanish, and
parts of the E-Chalk application have been localized to Turkish. See Section
3.9 for a description of the E-Chalk internationalization architecture.
2.4
The E-Chalk Server Application
When the main E-Chalk application is started, a splashscreen window is shown
until the E-Chalk setup dialog appears. Showing this splashscreen gives the
user feedback on the applications loading process still running.
2.4. THE E-CHALK SERVER APPLICATION
33
Figure 2.3: Left: Setup dialog for General settings. Tabs for Video and Live
Server are deactivated as their corresponding checkboxes are not selected. Right:
E-Chalk text editor started for the expert-mode configuration.
2.4.1
Setup Dialog
The E-Chalk setup dialog allows to change the user recordings setting. All these
settings are stored persistently in a human-readable format.10 The different
settings are grouped into tabbed pages, with the General settings selected at
startup, as shown in Figure 2.3. Users can set the lecture’s title and the path
of the directory to store the recording to. They may select which types of
material to store (board stream, audio stream, video stream, PDF from board
content) and whether the lecture should be transmitted live. In most sessions,
the settings on the following pages can remain unchanged.
The dialog serves as a graphical interface to conveniently change all parameters commonly-used. Some configuration entries, however, are only interesting
to expert users. To avoid these settings cluttering the dialog, they are to be
changed directly in the file where they are stored. To this end, a button labeled
Expert Mode ... is part of the general setup page, see Figure 2.3. It is used to
load the settings file in a text editor. The editor appears and the dialog is hidden. When the text editor is closed, the dialog re-opens with the newly-loaded
settings. See Figure 2.3 for a snapshot of the settings file loaded into the text
editor.
On hitting OK, the settings are stored and the lecture recording starts.
Cancel can be used to discard any changed, the Exit button stores the changes
and closes the session without starting to record.
Each tabbed page of the setup dialog features a Help button, which starts a
built-in browser on the page’s help section of the system’s HTML documentation.
Board Settings
The settings controlled with the board page control the size and background
color of the board, see Figure 2.4. The width and height values accepted by
10 See
Section 3.2 for details on the format.
34
CHAPTER 2. USER INTERFACE
Figure 2.4: Left: The board settings page. Right: Dialog for extended board
options, shown from the board’s page with the More ... button.
the dialog are bound to the display resolution. The Auto button sets the size
to full screen. Initial values for the board drawing tools (colors and sizes) can
be set, with the logarithmic-style size choosers shown identically in appearance
in the board interface. The boards mathematical handwriting recognition can
be bound to a drawing color, and a computing algebra server program can be
connected for use on the board. See Section 4.8 for a detailed description of the
handwriting recognition. For details on the setup of computer algebra systems,
see Section 3.3.
The dialog allows to choose the board background color among 18 different
colors. In practice, however, black is almost always used, with a few users
preferring white for similarity with a paper background. Black not only yields
the best resemblance with the blackboard, white on black writing is better
readable than vice versa, at least for vision-impaired and older people [Gat03,
Byr00].11
The board supplies access to a number of bookmarks, see Section 2.4.2.
These include bookmarks for images and Applets to be pasted to the board, for
board macros to be played12 , for CGIs to be queried, and chalklets for interactive
board animations. Each of the associated buttons starts a bookmark editor. An
editors allow to add URLs and associate labels and icons with them, see Figure
2.5. The editors support editing by drag and drop and allow to import the
files of a directory as a list of bookmarks. For macros, replay speed can be
set and extra information on the macros is shown, like minimum board width
required for replay and background color. The CGI bookmarks have a list of
CGI parameters associated with them. Each parameter has a number of entries,
11 Many electronic magnification tools for vision-impaired users include the option of reverse
polarity display, because of negative contrast (white letters on black) being often more readable
than positive contrast. Similarly, the Windows magnifier tool optionally allows reverse polarity
for accessibility. A known cause for inverse polarity being superior is that physiological changes
in older eyes can lead to an increased sensitivity to glare [EW90]. Also, experiments showed
that vision-impaired readers with cloudy ocular media perform better with white letters on a
dark background [LRPS85].
12 Board macros are generated with the macro recorder described in Section 6.9
2.4. THE E-CHALK SERVER APPLICATION
35
Figure 2.5: Left: The bookmark editor for image bookmarks. Right: The bookmark editor for chalklets in the process of defining a new entry. The properties
dialog provides a tabbed page for each of the four expected build parameters.
defining formal name, prompt for query on the board, and HTTP send method
(POST or GET).
The bookmark setup for chalklets is even more complex. New entries are
created in a dialog. It expects the URL where the chalklet’s code should be
loaded from and the name of the ChalkletKit class13 to produce the chalklet
instance. To make the setup easier, the Create Bookmark dialog allows to automatically search the classpath URL for all ChalkletKit classes.14 After that,
a dialog showing the properties can be displayed: the meta information defined
by the kit is shown and input components for the parameters expected by the
kit are provided, see Figure 2.5.
Audio Settings
The audio settings page allows to select a codec to be used for the audio stream,
see Figure 2.6. The page also provides a list of audio profiles. An audio profile
is used to tune the recording for quality, depending on the information on audio
hardware and speakers frequency range stored in the profile. See Section 5.2 for
details.
The Button labeled Create ... starts the audio profile wizard15 to generate
13 See
Section 4.6.4 for a technical description of chalklet programming.
alternative approach would have been to require the chalklets to be packed in a Jar
archive together with meta information specifying the ChalkletKit’s name. This approach
is often pursued in component-based programming, for example for Java beans or for Oscar/OSGi bundles. However, the need for meta information can be confusing for beginners.
The required packing also introduces an extra step for developers. This can be annoying when
one wants to quickly test modified versions.
15 The audio profile wizard is described in Section 5.2.3.
14 An
36
CHAPTER 2. USER INTERFACE
Figure 2.6: Left: The audio settings page. Right: The tabbed pages on the
audio profile properties.
a new profile. With a selected profile, the audio settings allow to activate
the Microphone Monitor during recording, showing a warning dialog when the
microphone signal is lost, usually due to batteries running low in a wireless
microphone.
To help for remembering which profile belongs to which configuration, one
can select to display the properties of the profile. Information about the date
the profile was created and the hardware setup are shown in addition to the
equalizer settings and the audio wizard’s summary report, see Figure 2.6.
Video Settings
In the settings for the video stream, the user can choose the video source to
capture, and the resolution and the frame rate to be used. Resolution and
frame rate have to be chosen with care with regard to the bandwidth they will
consume.16
During the installation process, E-Chalk scans for available video sources. As
this process takes several seconds, it is not done every time E-Chalk is started.
However, the video settings page allows to trigger the scan process manually to
make newly installed video sources known to the system. See Figure 2.7 for a
snapshot of the video settings page.
Live Settings
In the live settings page, a maximum number of live connections can be defined,
depending on the server’s performance. The TCP server ports the streams are
sent over can be redefined. This is only important if the default ports are already
occupied on the server or if their use is disallowed by a firewall.
16 A planned extension to the setup dialog is to display the average and worst case bandwidth
in the setup dialog, both for individual streams and in total.
2.4. THE E-CHALK SERVER APPLICATION
37
Figure 2.7: The video settings page.
PDF Settings
In the settings for the PDF version of the board lecture, paper orientation and
format17 of the produced PDF can be selected. Regardless of the background
color used for the board, the PDF may be produced with white background
to save printer color. See Section 6.1.3 on provisions taken to preserve a good
contrast of the writing against the white background. Finally, the setup allows
to generate a grayscale version of the PDF for black-and-white printing, a color
PDF, or both. See Figure 2.8 for a snapshot on the PDF page.
Recording
When the OK button is hit to start a recording, the system checks if the output
directory already contains a recorded session. In this case, the user is queried if
E-Chalk should overwrite the session, continue the old session by appending, or
if the recording should be abandoned, returning to the setup for changing the
output directory.
Following that, the setup dialog is hidden, and the different recording components (board, audio, video) are initialized for recording. As the setup may
take a few moments18 , a dialog with an animated indeterminate progress bar is
shown if it takes more than half a second.
During the recording, stream data are written continuously to the disk. This
avoids potentially long saving times at the end of a lecture and minimizes data
loss in case of an abnormal program termination.
When the recorded streams include the board stream, the recording is ended
by exiting from the board interface. Otherwise, the system displays an information dialog with an indeterminate progress bar animation and a button to stop
the recording, see Figure 2.9 for an example.
After the recording, a recorded board stream is converted to a PDF transcript, if the option was chosen in the setup. Again, if the process takes longer
than half a second, dialogs with progress bars are shown.
17 The paper formats supported in the current implementation are DIN A0 to A6, letter,
half-letter, legal, note, and ledger.
18 Especially appending to a long previous session may cause the board initialization take
some time, because the board must load the complete data of the old session.
38
CHAPTER 2. USER INTERFACE
Figure 2.8: Left: The live server setup page. The video server port element is
disabled because video recording is disabled in the general settings. Right: The
tabbed page on PDF generation.
Figure 2.9: Information dialog during recording when only the audio stream is
stored.
2.4.2
The Board Component
Tool Dialog and Basic Drawing
When the board component is started, the user can use the pen device for
painting. Color and drawing thickness are controlled with a tool dialog, see
Figure 2.10. One can also change from the standard drawing tool (the “chalk”)
to the eraser tool. It draws with the background color and has the drawing
width defined independently from the chalk tool, as a bigger stroke is usually
wanted for the eraser. The sliders to control the sizes of the drawing tools (and
any typed text) use a logarithmic scale, since fine size control is much more
important for the smaller sizes. The mouse pointer on the board is shown as a
circle of the current drawing/erasing size or as symbolic chalk/eraser icon, when
they become too big19 , see Figure 2.11.
The tool dialog includes buttons to cause undo or redo actions on the board
contents. The undo stack is not bound to a fixed number of actions.
A rarely used option of the tool dialog is a button to clear the whole board.
19 The
maximum size of mouse pointer images depends on the platform’s window system.
On Windows, the maximum image size is 32×32 pixel, on X windows systems, up to 64×64
pixel are allowed.
A possible improvement would be to show the drawing tool pointer in the current drawing
color.
2.4. THE E-CHALK SERVER APPLICATION
39
Figure 2.10: Left: E-Chalk tool dialog. Below the two action button rows are
the radio buttons for selecting a chalk color or the eraser tool. The three sliders
at the bottom control the size of the chalk tool, the eraser tool, and typed text,
respectively. Right: Dialog for selecting an image to add to the board content.
Drag Handles
The virtual length of the board is not limited. In the setup, the board can be
configured to feature a vertical scrollbar. However, the board interface provides
another possibility for scrolling which resembles the interaction style of a traditional blackboard more closely. At the top and the bottom of the screen, two
drag handles are part of the board. When the instructor starts a drag action at
one of these handles, he or she moves the board content up or down, like pulling
a blackboard up or down. The mouse pointer is shown as a hand icon during
dragging and when it is above the drag handle, see Figure 2.11.
Images and Applets
The system allows the user to paste images from local hard drives or from the
Internet. Pressing the add image button, a dialog displays the image bookmarks
with titles and thumbnail icons, see Figure 2.10. The user can pick one of the
bookmarks, or type in an image URL, or select an image file with a file dialog
from a local disk. The file dialog applies a file filter to show only the supported
file formats, GIF and JPEG.20
When the user has selected an image, the loading process starts. This process
may take a noticeable time, as remote image locations are allowed. If it should
take more than half a second, a progress dialog with a cancel button is opened,
enabling the user to abort lengthy loading actions.21 Except for the cancel
20 PNG images can also be handled by the server software. However, in the default setup
their usage is disabled, because the PNG format is not guaranteed to be displayable in remote
E-Chalk clients. The client relies on the Java decoding of images, and Java versions before
1.3 lack PNG support in some browsers.
21 The same approach is taken for other types of resources that can be added to the board,
like CGI calls or requests for mathematical computations.
40
CHAPTER 2. USER INTERFACE
Figure 2.11: Top row, left to right: Drawing-tool mouse pointer, eraser-tool
pointer, pointers for tools of big sizes, the hand pointer over the top drag handle, placement of an image or Applet, positioning a chalklet, and dragging the
chalklet area bigger, with currently selected area painted semi-transparent over
an existing board drawing. At bottom: Positioning a macro.
option, the board does not accept any interaction during the loading process.
When the image data have arrived, the user is expected to place the image on the
board. The mouse pointer changes to a cross-hair and the bounding rectangle
of the image is attached, see Figure 2.11. The image’s upper left position is set
by a mouse click. Once put on the board, it can be regularly painted with board
drawings, letting the instructor annotate the image.
Another button provides the same functionality for adding Applets to the
board content. Their URLs reference HTML pages with embedded Applets.
When the selected page contains more than one Applet, all of them have to be
positioned by the user. Like in a Java-enabled browser, the board then executes
the Applets, which can be interacted with regularly22 , see Figure 2.12. Unlike
the images, one cannot draw on the Applets with the board tools, because all
mouse events on the Applet screen areas are consumed by the Applets.
Typing Text
Another board option is to add keyboard typing to the board content. When the
associated button is pressed, one can select the start position for the text input.
The positioning to be performed is signalled by changing the mouse pointer to
a text cursor, see Figure 2.11. Text typing is then added to the board until the
text input is closed by hitting the [Enter] key or by adding other contents to
the board (a drawing, an image, an Applet, a new key typing, etc.). If the text is
too long to fit into a single line, dynamic line breaking is provided automatically.
Explicit line breaks can be added by [Shift]-[Enter]. Editing by backspace
and delete is supported, as well as moving the key cursor in the typed text with
the left and right arrow key. Text inputs are stored in a text history and the
history entries can be accessed by the up and down arrows.
Keyboard input added to the board content just for writing text are of little
value, but they can be used as requests to a connected computer algebra system
or to CGIs, as described below.
22 The replay of Applets actions poses a number of principal problems. For this reason,
handling Applets in E-Chalk remained at a very experimental stage. See Section 4.9 for a
detailed discussion of the problems.
2.4. THE E-CHALK SERVER APPLICATION
41
Figure 2.12: Left: An Applet added to the board. Right: Snapshot from a
lecture using a plot from a computer algebra system, already annotated by the
lecturer.
Requests to Computer Algebra Systems
Mathematical requests can be processed by the board using an interface to
computer algebra systems, such as Mathematica by Wolfram Research [Wol03]
[108] or Maple by Waterloo Maple [MGH+ 97] [105].23 When such a system is
installed, the corresponding button allows to type a request, exactly like normal
text typings are done. On closing the text input with the enter key, the request
is sent to the algebra system and evaluated. If the system returns a graphic, it
can be pasted to the board in the same interaction style that other images are
positioned. Otherwise, any textual result is typed below the request string. See
Figure 2.12 for an example of a plotting request evaluated with Mathematica.
Requests to CGIs
The board also allows to make calls to Web services as bookmarked24 CGI
scripts. When a CGI bookmark is picked from the CGI bookmarks, the user
positions a text cursor on the board. For each of the CGI parameters defined
in the bookmark, the user is prompted for a value.25 The CGI is then called
and a text or image result is added to the board like for requests to computer
algebra systems. See Figure 2.13 for examples.
Mathematical Handwriting Recognition
As mentioned before, keyboard typing in the pen based E-Chalk interface are an
interruption of the workflow. Keyboard inputs should be replaced by pen inputs
when working in the board metaphor. For this reason, a mathematical handwriting recognition was included in the E-Chalk board right from the very beginning as an interface to the computer algebra systems, see [RKRF01a,RKRF01b].
23 An interface for MuPAD by SciFace [65] [66] is under development. A built-in system for
calculator-type requests and plotting of simple one- and two-dimensional functions has also
been written.
The current implementations for Maple and Mathematica require a locally installed algebra
system, but it would be easily possible to use a remote server.
24 See Section 2.4.1 for bookmarking. CGI can only be accessed by bookmarks, as the CGI
parameters to be sent over must be declared in advance.
25 Prompting texts are set in the CGI bookmark editor.
42
CHAPTER 2. USER INTERFACE
Figure 2.13: Left: CGI request (parameter prompt text “a word:”, user input
“Kreide”) and answer from a CGI script using the Leo [52] server. Center: CGI
request (prompt “12 digits:”) to a CGI returning a EAN code graphic and its
result. Right: CGI request for a CGI with several parameters, with the third
parameter not yet entered by the user.
Figure 2.14: The mathematical handwriting recognition employed on the board.
The recognized term is printed along with the result from the computer algebra
system to give feedback on the recognition result.
While the early version could only handle simple arithmetic expressions, it has
now moved to more complex mathematical formulas [FKRT03]. A color can
be reserved for input to the recognition module in the setup. Writing a special
“tick” symbol marks the end of a handwriting request. The recognized string
is sent to the connected computer algebra system (or to a simple built-in calculator, if no algebra system is set up), and the result is added to the board. See
Figure 2.14 for an example.
Chalklets
Chalklet are a kind of interactive animations designed for the E-Chalk board.
On creation, a chalklet is assigned a rectangular section of the board to operate
on. The chalklet then receives what the user draws into that area and may
itself draw strokes in the chalklet’s area. Chalklets implemented so far include
a game of Tic-Tac-Toe, a logic circuits simulator working hand-drawn circuits
definitions, and a python interpreter for handwritten programs. See 6.12 for
example chalklets.
When a chalklet bookmark is selected, one has to define the chalklet’s area
on the board. A chalklet defines its minimum area. When a click is used for
positioning, the chalklet instance receives this minimum area. Alternatively, the
area can be dragged to a bigger rectangle. See Figure 2.11.
Chalklet’s areas are allowed to overlap. User-drawn strokes in the intersection of the areas are sent to all the listening chalklets. A chalklet scrolled out
of the visible area is deactivated.26
26 This prevents chalklets from changing the board image without the user being able to
notice.
2.5. REMOTE ACCESS
43
Figure 2.15: A macro for showing the Bubble Sort algorithm as animation.
Figure from [Esp04].
Macros
Another kind of bookmarks that can be used are E-Chalk board macros. These
are simply board recordings that can be replayed on the board. After selecting
a macro bookmark, one has to position the replay by defining the vertical start
position, see Figure 2.11. Writing and images from the macro are then added
to the board, with the speed they were originally recorded scaled by a factor
defined in the macro bookmark. When a new element would be located in a
part of the board not visible due to the current vertical scroll offset, the offset
is adjusted accordingly, automatically scrolling the board. The macro can be
aborted anytime. Any edit to the board other than scrolling stops the macro
replay.27
Macros can be created like regular lectures with a macro recorder tool28 , or
they can be generated synthetically, for example for showing animations.29 See
Figure 2.15 for an example.
2.5
Remote Access
One only needs to open the Web page for the lecture in a browser to view the
lecture replay. The replay client is realized as several Java Applets embedded
in the Web page. Each of the three possible streams is received by an Applet,
the board, audio, and video client. For live transmissions, these Applets open a
TCP socket connection to the lecture server.30 Audio and video clients decode
their data streams and output them. For the board, the handling is slightly
more complex due to the event-based representation of the board format. In
the case of a late connect, it has to load all past events to build up the current
board image.
27 A further extension can be the possibility to resume stopped macros and an interactive
control of the replay speed.
28 The macro recorder is described in Section 6.9.
29 A tool to generate E-Chalk macros for animating algorithms is described in [Esp04], see
Section 6.12.2.
30 Due to the security instructions on Applets, the client Applets can only connect to the
Web server they come from. For this reason the E-Chalk main application must run on the
Web server in live transmissions. An alternative would be to run a proxy on the Web server,
which hands just hands the data over.
44
CHAPTER 2. USER INTERFACE
Figure 2.16: Left: An E-Chalk lecture seen in the board Applet. Right: The
corresponding PDF page.
The board client allows vertical scrolling by the remote user, enabling the
user to look at older board content already scrolled away. This can be done
by using a scrollbar featured by the board client or by dragging.31 Horizontal
dragging is also possible when the width of the remote client board is smaller
than the board at the server side. This is usually the case when the full board
does not fit on the receiving computer’s screen, because of its resolution being
too low.
For replay from the archive, an additional Applet is opened to provide VCRlike controls, allowing to pause and resume, to fast forward and rewind, and to
jump to any point in the recording timeline.
In contrast to the live transmission, this type of access does not connect a
remote E-Chalk application. Instead the replay relies on the file-streaming32
capabilities of the Web server.
In addition to the dynamic board recording, a PDF transcript of the board
recording is provided to print out the board content comfortably. See Figure
2.16 for examples of replay and the PDF version.
31 The
dragging is similar to the server side drags using the board’s drag handles. It just
allows to start a drag anywhere on the board surface: drags are not interpreted as drawings
on the client board.
32 The client Applets process the streamed data, i. e. they do not need to load the full
recording before starting to play.
Chapter 3
The E-Chalk Application
This chapter describes the system architecture and implementation of the main
E-Chalk server application. The user front-end of this main part is the setup
dialog described in Section 2.4.1. It handles the settings for the E-Chalk session and controls the subcomponents board, audio, and video, as well as the
subcomponent for creating the PDF transcript.
The setup of the main application is represented as java.util.Properties1
and is stored in the Java Properties file format. Two Properties files are of
central relevance to the system. The file for the configuration setup described
in Section 3.1 controls the whole E-Chalk application. The other file contains
the settings for a lecture recording, changed by the setup dialog and read by
the above-mentioned subcomponents.
The entire application was written in Java [GM96] and requires the libraries
of Java version 1.3 or later. The audio and video server components rely on the
Oscar [70] implementation of the OSGi component framework. When using the
video component, the Java Media Framework (JMF) [44] library is also needed.
See Chapter 5 for details.
3.1
Main Configuration
The general setup Properties are read from the standard Java system Properties and the E-Chalk startup configuration file <echalk install dir>/conf/main.conf, stored in the Java Properties file format. The entries define,
among others, the locations of secondary files, like bookmarks and online documentation, may activate the debug output mode, and give class names of
components to load dynamically.
The property entries in the startup configuration do not need to define
the entries as literal strings. The entries may use other property entries2
which will be evaluated recursively when the application accesses the property entry, where faulty definitions, which are due to circular references, will
be detected. A property is referenced as ${<property key>}, for example
${echalk.conf.dir}/audiowizard.conf, the default entry for the audio wiz1 Java
Properties objects are hash tables which map String keys to String entries.
properties may include the startup configuration properties as well as some
special E-Chalk properties made available at runtime.
2 Referenced
45
46
CHAPTER 3. THE E-CHALK APPLICATION
main.conf
echalk.conf
prefs.conf
streamer.conf
console.rc
console.dat
echalk.log
streamer.log
audio/audiowizard.conf
audio/converter.conf
audio/profiles.xml
audio/wwr3.xml
board/texthistory.dat
bookmarks/applets.xml
bookmarks/cgis.xml
bookmarks/chalklets.xml
bookmarks/images.xml
bookmarks/macros.xml
profiles/
templates/templates.conf
templates/archived.def
templates/live.def
templates/recording.def
video/wwv.xml
E-Chalk’s startup configuration
lecture settings
user’s preferences on suppressing warnings
configuration for audio/video streaming
console startup command file
console command history file
session log file (error messages, etc.)
log file for audio/video streamer system
configuration for audio profile wizard
configuration of audio format converter
audio profile list
audio components graph definition
board text history file
bookmarks of Applets
bookmarks of CGI calls
bookmarks of chalklets
bookmarks of images
bookmarks of board macros
data directory containing audio profiles
HTML template handler setup file
localized template for replay
localized template for live transmission
localized template for ongoing recording
video components graph definition
Listing 3.1: Files installed in the configuration directory.
ard’s configuration file path, defining it locally to the entry for the configuration
directory. The character $ as a literal can be represented in entries by the empty
variable ${}. For properties with no definitions in the startup configuration file,
default values are used.
The settings for a lecture recording which are changed by the setup dialog are stored in a second Properties file, referenced by the startup property
echalk.lecture.conf.
After reading the properties from the main configuration file, the application’s command-line parameters are evaluated in order of appearance. Three
types of command-line parameters are recognized. Parameters in the form of
-X<key>=<value> are used to override setup dialog property entries stored
in the settings file. This may be used to start E-Chalk from a script autogenerating the lecture’s output directory, e. g. using a combination of user name
and date. Parameters with the syntax <key>=<value> without a leading -X
are used to override entries from the startup configuration file.3 Entries without a = character or in the form -f<path> are interpreted as property file, from
which startup configuration properties are loaded (with the ability to override
the entries from the standard startup configuration file). See Listing 3.1 for the
list of E-Chalk configuration files.
3 Because all of E-Chalk’s configuration properties start with a lowercase letter and not
with a dash, there is no problem in distinguishing the two parameter types.
3.2. DATA MODEL OF THE SETTINGS
3.1.1
47
Dynamically Loaded Classes
Several components of the system are realized as dynamically loaded classes.
The boards connection to computer algebra system4 and the handwriting recognition system5 belong to these, as well as a number of components implementing
the interface de.echalk.util.Launchable.6 The Launchables include the audio, video and board subsystems as well as the PDF converter and some debugging tools. The classes to be loaded are defined as properties in the configuration
files.
The system delegates the class loading to the class de.echalk.util.Resources.7 Its loading mechanism does not only search the classes from the
Java VM’s classpath, but from classes stored in the directory <echalk install
dir>/addons, either residing directly in it or stored in a Jar archive file. This
allows developers of E-Chalk components to quickly test their components by
adding them to the addons directory without the need to compile the classes
into the E-Chalk system core libraries or to change the classpath.
3.1.2
Multiuser Configuration
In the standard setup, all configuration files of E-Chalk reside in the <echalk
install dir>/conf directory. The startup configuration file can redefine the
property echalk.conf.dir to point to an alternative directory. All secondary
configuration files are referenced by using paths relative to this property.
To manage several users working with a single E-Chalk installation but individual configurations, the echalk.conf.dir can be set8 to a user-defined directory. For example it can be changed to ${user.home}/.echalk, using the Java
system property user.home, pointing to the user’s home directory. This also
avoids write-permission problems, when E-Chalk configuration files are installed
write protected against non-owners on multi-user platforms.
To avoid requiring first-time users to manually copy these configuration files,
this is handled automatically by E-Chalk: When the echalk.conf.dir directory does not exist or does not contain the configuration files, the files are copied
from the original configuration directory and its subdirectories. The original
configuration directory in turn is defined by the property entry echalk.conf.src.dir. A property named echalk.conf.src.filter defines a file-name filter
for the files to be copied to prevent the copying of system files like the error log
file.
3.2
Data Model of the Settings
The class echalk.main.Settings serves as a data model for the collected input
elements of the setup dialog, which is stored in the lecture settings file, with its
file path defined in the configuration entry echalk.lecture.conf. It is saved
in the Java Properties file format.
4 Described
in Section 4.6.2.
in Section 4.8.
6 The Launchable interface id described in Section 3.10.1.
7 Loading the Java resources like images for image buttons is also handled by this class.
8 It can be redefined either by editing the conf/main.conf file or using command-line arguments, as described in Section 3.1.
5 Described
48
CHAPTER 3. THE E-CHALK APPLICATION
All GUI elements of the startup dialog that accept user input are registered
in the dialog’s Settings object. The associated Property key as well as a
mapping between localized GUI values and their internal Property values may
be accessed via the Settings object. It also allows to change a registered input
component’s state by setting its corresponding Property value via its key. This
mechanism is used to change settings by commands using the command-line
console, see Section 3.10.1.
Structure Preserving Property Parsing
A Java Properties file can contain both key-value pairs and comments.9 They
are processed line by line, while lines end at the end of the file or with one of
the line terminators \n, \r, or \n\r. Comments are lines that start with one of
the characters # or !. Except for empty lines, all lines are interpreted as keyvalue pairs. Key and value are separated by a whitespace, a :, or a =. If these
characters appear in the key, they must be escaped by a \. Whitespaces directly
after the separator are also ignored; if the entry starts with a whitespace, it must
be escaped. Entries may also be distributed over several lines, as escaped line
terminators are ignored in entry parsing.
In the standard E-Chalk installation, the echalk.lecture.conf file has
extensive comments and a semantic ordering to assist novice user changing the
settings using a text editor, see Section 2.4. If the setup dialog would simply use
the standard Java Properties load and store methods to make the key-value
pairs of changed settings persistent, comments and ordering would get lost.
For this reason, the E-Chalk application represents the documents structure
in an instance of echalk.util.PropertyDoc. It reads in the complete string
representation of a Property file and determines the character intervals of the
keys and the corresponding values in this string. A PropertyDoc object provides
methods to replace the entry for a key, to add new key-value pairs and to write
the document back, all while preserving the complete structure.
Expert Mode
For expert-mode editing 10 , the PropertyDoc’s string representation is loaded
into an echalk.util.TextEdit instance, which implements a graphical text
editor with all the standard features. The setup dialog is hidden and the text
editor is shown instead. When the text editor is closed, it executes a callback
method to show the setup dialog again. The PropertyDoc for the setup dialogs
settings is updated, if the echalk.lecture.conf file has changed.
3.3
Connecting Computer Algebra Systems
The list of computer algebra system available in the setup11 is defined by the
configuration entry echalk.computingserver.add. It is a comma separated
list of de.echalk.util.EvaluatorKit classes. These classes provide static
builder methods that returns a de.echalk.util.Evaluator instance to serve as
9 The format is given in the API documentation of the load and store methods of
Properties, see [40].
10 See Section 2.4.
11 See part on board settings in Section 2.4.
3.3. CONNECTING COMPUTER ALGEBRA SYSTEMS
49
Figure 3.1: Setup dialog generated for a computing server setup info with three
parameters, showing the tabbed panel of the boolean parameter Transparency.
actual connection to a computer algebra system like Mathematica. Other static
methods return a localized name and an optional icon for the EvaluatorKit
as well as a de.echalk.util.KitSetupInfo, which describes the parameters
needed by the builder method, and an overall (localized) description of the kit.
For each of these parameters, a KitSetupInfo.ParamInfo object is given by
KitSetupInfo. ParamInfo itself is an abstract class, with the available concrete
subclasses defining the type of the parameter. Allowed parameter types are
strings, strings without line breaks, passwords, files, booleans, enumerations
(list of possible choices), and whole numbers (for a declared interval, up to
the long integer range). Each ParamInfo instance defines a parameter name
and may give a description and a default value, with all texts being localized.
For example the echalk.util.cserver.MathematicaKit needs the path of the
Mathematica kernel file as a parameter.12 ParamInfo objects for files may also
provide a customized file chooser using appropriate file filters to help with file
selection.
When the user selects to configure an EvaluatorKit, a dialog automatically
generated from the KitSetupInfo is shown with input fields adequate for the
type of parameter: check boxes are used for boolean parameters, combo boxes
for enumeration parameters, text areas and text fields for strings (depending
on whether these are allowed to contain line breaks), password input fields for
password strings, text fields with file choosers for file parameters, and number
spinner objects for whole numbers. See Figure 3.1 for an example.
12 For convenience, the Mathematica kit provides an intelligent default value by scanning
the file system’s standard installation paths of Mathematica for a kernel executable, preferring
the most recent version if several installations are found.
50
CHAPTER 3. THE E-CHALK APPLICATION
<!DOCTYPE E-Chalk:bookmarks [
<!ELEMENT E-Chalk:bookmarks (entry*)>
<!ATTLIST E-Chalk:bookmarks title CDATA #REQUIRED>
<!ELEMENT entry (name, url, thumbnail?, arg*, property*)>
<!ELEMENT name (#PCDATA)>
<!ELEMENT url (#PCDATA)>
<!ELEMENT thumbnail (ziprgb | href)>
<!ELEMENT ziprgb (#PCDATA)>
<!ATTLIST ziprgb width CDATA "16">
<!ATTLIST ziprgb height CDATA "16">
<!ELEMENT href (#PCDATA)>
<!ATTLIST href width CDATA "16">
<!ATTLIST href height CDATA "16">
<!ELEMENT arg (prompt, id)>
<!ATTLIST arg post (yes|no) "yes">
<!ELEMENT prompt (#PCDATA)>
<!ELEMENT id (#PCDATA)>
<!ELEMENT property EMPTY>
<!ATTLIST property key CDATA #REQUIRED>
<!ATTLIST property value CDATA #REQUIRED>
]>
Listing 3.2: DTD of bookmark files and the audio profile list.
3.4
Bookmark Files
All bookmarks are stored in XML files with the inline DTD13 shown in Listing
3.2. Each entry has an name to identify it and a URL to load the data from.
As an optional14 field, an icon entry named thumbnail is provided for visual
identification in the dialogs. An icon is stored as a URL reference to an installed
image resource or as raw image data. A reference is used for an icon image
supplied with the E-Chalk system15 , accessible in the bookmarks editors with
the Set Icon>Choose ... menu. Raw images, as produced from the Thumbnail
and Import ... sub-menus of Set Icon, are stored as hexadecimal zipped RGB
data. For the icon size of 16*16 used in the bookmarks, even uncompressed raw
RGB pixel data is often smaller than standard image formats like GIF or PNG
due to the size overhead from format headers.
For image and Applet bookmarks, these are the only informations that are
stored. CGI bookmarks additionally provide a list of CGI parameters. A parameter is denoted by the key arg and has entries for the parameter’s name,
the HTTP method to send it for the CGI request (GET or POST) and a string
to prompt the user for input. See Listing 3.3 for an example entry.
Macro bookmarks use the key-value pair entries to store the board width
and board background color used in the macro to enable the board to decide
13 The document type definition, or DTD, provides the grammar for a class of XML documents [BPSM+ 04].
14 The bookmark dialogs of the board show a default icon for bookmark entries that do not
define their own icons.
15 The supplied images are installed as Jar bundles, so the URL uses the Java specific jar
protocol with the syntax jar:<URL of jar file>!{<entry in Jar archive>}.
3.5. AUDIO PROFILES
51
<entry>
<name>Calendar</name>
<url>http://www.online-lectures.org/cgi-bin/cal.cgi</url>
<thumbnail>
<href width="16" height="16">
jar:file:lib/icons.jar!/icons/cgi16.gif
</href>
</thumbnail>
<arg post="false">
<prompt>[[month] year] </prompt>
<id>date</id>
</arg>
</entry>
Listing 3.3: Example CGI bookmark entry for a calendar resembling Unix’s
cal.
which macros are compatible with the current board setup without having to
load the macro itself. A third key-value pair defines the speed used for replaying
the macro.
For chalklet bookmarks, the URL entry is the classpath to the chalklet classes
to be loaded. Additional key-value pairs define the minimum height and width
of the chalklet (enabling the board to sort out chalklet bookmarks that would
not fit on the board), the name of the ChalkletKit class to be used to build
the chalklet16 , and the parameter values to be passed to the chalklet kit’s build
method as well as the localized parameter names, enabling the board to show a
user-friendly tooltip, see Section 4.5. For providing the user-guided interface to
set the parameter, a ChalkletKit has to define the description of expected parameters in the bookmark editor, like an EvaluatorKit does for the setup. See
Section 3.3 for an description of the KitSetupInfo provided by ChalkletKit.
An excerpt from a chalklet bookmark file is shown in Listing 3.4.
3.5
Audio Profiles
The list of available audio profiles17 is stored as an XML file, using the same
DTD as the bookmarks shown in Listing 3.2. The URLs define the location of
the profile data identified by the name entry, the thumbnail entry is unused.
Additional information is stored as key-value pairs with the entries. These
informations are shown in the Properties dialog for the profiles to help the user
identifying the profiles. While most of this information is stored explicitly or
implicitly in the profiles, storing them in the XML list makes it available to the
setup dialog without having to load the relatively big audio profile data files.
As a side effect, this makes the setup dialog independent from format changes
in the profile-data files.
16 See
17 See
Section 4.6.4 for more on the abstract ChalkletKit class and Chalklet interface.
part on audio settings in Section 2.4.
52
CHAPTER 3. THE E-CHALK APPLICATION
<entry>
<name>Logicrecognation</name>
<url>file:etc/logicrecognition.jar</url>
<thumbnail>...</thumbnail>
<property
key="classname"
value="de.echalk.logicrecognition.LogicAnimationKit"
/>
<property key="minheight" value="300"/>
<property key="minwidth" value="300"/>
<property key="param.no" value="3"/>
<property key="param.0.name" value="feedback"/>
<property key="param.0"
value="true"/>
<property key="param.1.name" value="ini file"/>
<property key="param.1"
value="etc/logicrec.conf"/>
<property key="param.2.name" value="diagram"/>
<property key="param.2"
value="false"/>
</entry>
Listing 3.4: Example chalklet bookmark entry referencing the logic-circuitssimulating chalklet described in Section 6.12.4. Thumbnail data is omitted in
this example.
Audio Profile Wizard Launch
For creating a new audio profile in the setup dialog, the audio profile wizard
application is started.18 See Section 5.2.3 for a description of how the profile
wizard works.
The wizard directly changes the audio profile list when started as a standalone application. Started as a component of the E-Chalk setup dialog, profiles
should only become permanent when the setup dialog is exited with OK or Exit
and not with Cancel. To this end, the setup dialog creates a temporary file
with a copy of the XML audio profile list. This copy is given to the wizard
for modifying. When the setup dialog exits with Cancel, the original XML
file remains unchanged and any newly created audio profile, identified by being
referenced in the temporary copy but not in the original file, is removed. If
the setup dialog is closed with Exit or if a recording is started with OK, the
temporary XML file is copied to the path of the audio profile list XML file
and any user delete action on the profile list by users is made permanent by
removing any now unreferenced profile data file.
3.6
Starting a Lecture Recording
When a recording is started, the output directory is generated, and the necessary
files for remote access are written, like the HTML index file and the Jar archive
containing client classes. See section 3.7 for possibilities to customize these files.
18 Starting the profile wizard from the setup dialog relies on the wizard implementing the
Launchable interface, described in Section 3.10.1.
3.6. STARTING A LECTURE RECORDING
53
echalk.board.class=\
echalk.board.Launcher
echalk.board.class.args=\
board.overwrite=${board.overwrite},${echalk.lecture.conf}
echalk.audio.class=\
de.echalk.audio.EchalkAudio
echalk.audio.class.args=\
${echalk.conf.dir}/streamer.conf
echalk.video.class=\
WWV.Launcher
echalk.video.class.args=\
${echalk.lecture.conf}
Listing 3.5: Recording components properties in file main.conf.
If the lecture is recorded in append mode and with audio recording data in the
old audio format, it is transformed into the new format.19
Components for the streams to record, board, audio, and/or video are loaded
and started dynamically. The names and parameters of the components are
defined in the startup configuration files as properties, see Listing 3.5. The
loading process relies on the components implementing the interface Launchable
described in Section 3.10.1. Using the interface methods, the initialization phase
and the execution phase are put into different methods because the time needed
for initializing the components may differ considerably. For example, the time
for setting up the board component for append mode depends on the size of the
previous recording, as the board must load the old content.
After hiding the setup dialog, each component is started in a different thread
and execution blocks until the board thread returns, as the board component is
the only one that allows the user to end the session. If the board is not among
the recording components started, an indeterminate progress dialog with a stop
button is shown instead, see the part on recording in Section 2.4.
If starting the recording fails, for example when there is no write permission
on the output directory, a localized error message is presented to the user and
the setup dialog reopens, enabling the user to change any erroneous settings
and retry to record.
When the recording was successful, the output directory is set up for archived
access. First, the PDF version(s) of recorded board data is/are generated, again
relying on the board-to-PDF converter being realized as a Launchable. See Section 6.1 for details. The length of the recorded lecture streams is determined and
with this information the HTML index file for the archived replay is generated,
as described in Section 3.7.
19 Like
the recording components, the converter is started by using the Launchable interface.
To be more specific, the conversion is implemented using the Progressible sub-interface of
Launchable, allowing to show a feedback on the conversion progress. See Section 3.10.1 for a
description of the interfaces. For a description of the old WWR2 and the new WWR3 audio
format, see Section 5.1.
54
3.7
CHAPTER 3. THE E-CHALK APPLICATION
HTML Templates
The E-Chalk server creates three different kinds of HTML index files in recording directories. First, there is an index file for an ongoing recording without
live transmission available. The HTML file serves to inform remote users about
the lecture not being available yet. Then there is an HTML file for a live transmission that embeds the Applets for receiving the transmitted stream (board,
audio, and/or video) and the relevant transmission parameters, like which TCP
port to listen to. Finally, there is a page for archived replay, embedding the
replay Applets of the recorded streams, which are the same Applets as those for
the live transmission, but with different parameters, plus an Applet similar to a
VCR control.20 Also, PDF transcripts of the lecture are linked from this page.
For these pages to be customizable in advance by the user depending on
the lecture parameters21 , they are generated from templates interpreted by the
echalk.main.util.TemplateProcessor class. The configuration file conf/template/template.conf determines which of the template files is used for
which of the three HTML files, the character encoding used by the template,
and the names of the HTML files to produce. The character encoding property
allows the use of localized templates with managed character sets, for example
when using a Korean locale. Also, source and target name of the Applet’s
client Jar file and optional skin data for the VCR control Applet are specified.
Optionally, a list of files to be copied to the lecture recording directory can be
specified, too, for example for images to be embedded by the HTML files.
The templates are a mixture of literate HTML and interpreted code. The
code parts are enclosed in {} brackets. Within the code area, parts can be
aggregated to blocks by enclosing them in {} brackets. Literate strings in the
interpreted section are marked by enclosing pairs of quotes or double quotes.
Tokens, which are not literals, predefined keywords, brackets, or operators are
interpreted as variables. For a variable, the value of the Property with the
variable name defined in the E-Chalk system is used, or the empty string if it
is undefined. For property lookup, the lecture settings and the startup configuration properties are used. In addition, a few runtime properties are defined,
like time, date, and (in templates for replay from archive) the values of the
recorded lecture’s length.
Supported statements in the template code are if-else statements with a
syntax similar to Java and a statement for setting a property variable in the
context of the template, with syntax being set <varname> <value>. All other
statements are terms formed by literates, variables, or operators on sub-terms
and are interpreted as output of the corresponding values.22
Supported operators are the comparison operators != (not equal), == (equal),
<, <=, >, >=, and the boolean operators && (and), || (or) and ! (not). Comparison operators work with lexical string order. Possible return values of boolean
operators are the strings "true" and "false". As boolean operand, only the
20 The
VCR control Applet is described in Section 7.1.
example, the default pages use the lecture title as page title.
22 The syntax could easily be extended by additional statements like loops or arithmetic
operators to make the template syntax computationally complete. Also, allowing an operator
for indirect addressing might be introduced then. For the templates produced here, the power
of the provided statement is enough and the simple syntax makes the template definition less
error prone. When targeting at a full-fledged programming language, it would make more
sense to use a standard script language like Perl or Python.
21 For
3.7. HTML TEMPLATES
55
<HTML><HEAD>
<TITLE>E-Chalk: {echalk.title}</TITLE>
<META name="author" content="{user.name}">
<META name="date" content="{date}">
</HEAD>
<BODY bgcolor="#000000" text="#FFFFFF">
<DIV align="center"><H1>{echalk.title}</H1><P>
{ if (echalk.pdf) {
if (pdf.create=="both") {
’The session as PDF files: ’
’<A href="pdf/lect_col.pdf" target="_TOP">color</A> and ’
’<A href="pdf/lect_bw.pdf" target="_TOP">b/w</A>.\n</P>’
’<P>\n’
} else if (pdf.create=="color") {
’The session as <A href="pdf/lect_col.pdf" target="_TOP">’
’Portable Document Format</A> file.\n</P><P>\n’
} else {
’The session as <A href="pdf/lect_bw.pdf" target="_TOP">’
’Portable Document Format</A> file.\n</P><P>\n’
}
}
if (echalk.audio) {
’<APPLET archive="’template.archives’" code=’
’"wwr.wwrclient.class" width="1" height="1" name="audio">\n’
if (echalk.audio.sync.alpha!=null) {
’ <PARAM name="syncalpha"’
’ value="’echalk.audio.sync.alpha’">\n’
}
’ <PARAM name="archivemode" value="audio/">\n’
’ <PARAM name="loopmode" value="on">\n’
’</APPLET>\n’
}
if (echalk.video)
[...]
if (echalk.board)
[...]
}
<APPLET archive="{template.archives}" code="console.Console"’
’ width="1" height="1" name="console">
<PARAM name="title" value="{echalk.title}">
<PARAM name="seconds" value="{echalk.recordingtime.seconds}">
{ if (template.skin.src!=null) {
’ <PARAM name="initfile" value="skin.ini">\n’
}
’ Please activate Java!’
}</APPLET></P></DIV></BODY></HTML>
Listing 3.6: Default English template for archived replay. Video and board
Applet parts are omitted due to space constraints.
56
CHAPTER 3. THE E-CHALK APPLICATION
string "true" is interpreted as true. Bracketed sequences of values are interpreted as the concatenation of their string values. See Listing 3.6 for an example
template.
Besides user-defined text and layout changes, the templates can be used
to add other elements like a chat line in the live page, to communicate with
the lecturer or a teaching assistant. It can also be used to adjust the E-Chalk
client’s behavior, for example to set a client parameter that results in the client
board being displayed embedded in the browser window instead of opening a
new frame.23 For another usage example see the setup with three live board
clients described for the FU data wall in Section 8.1.1.
3.8
Help System
E-Chalk’s user manual is installed in HTML format. When the user accesses
the help, the system displays the manual in a simple browser which is part of
E-Chalk. Early versions of E-Chalk used an external browser application instead
of its own, which uses the Java Swing HTML rendering engine. In E-Chalk’s
early history, the browser model could be guessed with high accuracy from the
operating system, simply assuming the Netscape browser for Unix platforms
and the Internet Explorer on Windows. Nowadays, it is no longer that easy to
determine a browser to use automatically, as the HTML viewers have become to
manifold on Linux systems for such a simplistic approach and E-Chalk provides
its own one instead. For historical reasons there is still the echalk.htmlviewer
entry in the conf/echalk.conf, which can be changed to use another browser
for displaying the manual when it is started from the boards tool dialog.
When the help is started from within E-Chalk, the browser shows the help
section relevant to the subcomponent it was started from, providing basic context sensitivity for the help system. For example, when it is started from the
audio profile wizard24 , it opens the help page at the section describing the current wizard page, accessing the different help sections by the use of HTML
anchors. See Figure 3.2 for an example.
The built-in browser implements the Launchable interface and can therefore
also be started from the E-Chalk command-line console, see Section 3.10.1.
3.9
Localization
The user interface of the E-Chalk server application (and its installer) is internationalized, including subcomponents like the E-Chalk board. Only those
software tools and documentations provided exclusively for developer use have
an English-only interface. These include the command-line console described in
Section 3.10.1, the internal message log described in 3.10.2, the included API
documentation, and the comments in the configuration files.
Localizations realized are English (US variant) and German (DE variant).
An old version of the server is also available in Spanish, and parts of the interface
23 This
feature was actually requested by the department of Economics at Universität Regensburg. Multimedia-supported lectures were produced at the department in a project of
the Virtuelle Hochschule Bayern framework. To this end, RealAudio and RealVideo streams
were combined with E-Chalk board recordings.
24 See Section 5.2.3.
3.9. LOCALIZATION
57
Figure 3.2: The help browser showing the help page for the audio wizard’s step
on “gain control tuning”.
have also been translated to Turkish, see Figure 3.3.
To provide the mnemonics for GUI elements and text in the current locale,
calls to static methods of the class de.echalk.util.Txt are used. The class
Txt loads a java.util.ResourceBundle for the locale set.25 E-Chalk uses
Java’s property resource bundles, meaning a property file is loaded to map
lookup keys to localized entries. In addition to using this mapping, the loading
mechanism of Txt has a special handling for the echalk.l10n.load key. It
allows to specify a comma-separated list of additional property resource bundles
to be loaded. These can in turn have such an entry of additional bundles to be
loaded and so on, allowing to organize the localization data in a tree hierarchy.
The root property bundle for E-Chalk’s localization is dat.echalk (meaning the
property files are named dat/echalk de.properties for the German locale,
dat/echalk es.properties for the Spanish locale, etc.). This resource bundle
only contains a list of bundles to be loaded, with different bundles for different
contexts. For example, one resource bundle contains all error messages and
another bundle contains all labels occurring in the E-Chalk GUI. When the
same key appears in more than one resource bundle already loaded, a warning
is printed to the error stream, see Section 3.10.2.
One special resource bundle is initially empty in the standard E-Chalk installation: the bundle etc.usertexts is installed as files in the directory etc.26
While the other resource bundles are packed into Jar archives, the property files
for etc.usertexts can be directly modified with a text editor, allowing users
who want to plug in their own components to the E-Chalk system to easily add
their own localizations to the E-Chalk localization resources and use the Txt
class for their components.
25 Java’s loading strategy for loading the resource bundles uses the most specific available
match for the defined locale in the applications classpath. For example, for a locale named
de DE EURO, the language German for the country Germany in the variant with Euro currency
symbol, the bundles for de DE EURO are searched for first. If they cannot be found, bundles for
de DE will be loaded. Failing this, de bundles are loaded, and as a final fallback the general
resources with unspecified language are used. For details, see [41] or [DC01].
26 The directories etc and addons are provided to store user-defined additions to the E-Chalk
system. The addons directory is used for all resources to be available via the standard E-Chalk
class-loading mechanism described in Section 3.1.1. All other additions, for example local files
generated by chalklets, should reside in etc.
58
CHAPTER 3. THE E-CHALK APPLICATION
Figure 3.3: The setup dialog localized to Turkish.
To map a key string to its localization, the method String Txt.get(String
key) is used. The method String Txt.get(String key, Object[] a) is provided for formatted messages. In the localization entry, references to the array
elements can be used to be replaced by the elements transformed to strings,
for example in the entry "Reading file {0} failed.", the substring "{0}" is
replaced by the array element at index zero. The referencing syntax also allows
further formatting specifications, like number and date format specifications. It
is the same as for formatted message output with java.text.MessageFormat,
see [39] for details.
A problem introduced by dynamic localization is that lookup of keys cannot
be statically checked by the Java compiler. Localization fails at runtime if the
key is missing in the resource bundles, for example due to a typing error. Flaws
in localization have to be identified by test runs, but reaching a complete code
coverage is difficult, especially for localized error messages, which are accessed
only in exceptional cases.
To address this problem, some tools have been developed for static checks,
described below. In addition, a fallback mechanism is used: The localization
used by E-Chalk are the English strings to be displayed. When a lookup for
a key fails, the failure is written to the error log27 and the key itself is used.
As a result, the user gets the English version displayed instead of some cryptic
internal messages or blank field. The drawback of using the English versions as
keys is that there cannot be different localized texts where the English locale uses
identical texts. This may be undesirable for translations which differ according
to context.
The GrepTxtCall command-line application from the echalk.tools.l10n
package28 scans for all keys used in calls to the Txt.get methods and lists
27 See
Section 3.10.2 for the error-message logging mechanism.
is often abbreviated with L10N and internationalization with I18N, hence
28 Localization
3.10. DEBUGGING TOOLS
59
> java echalk.tools.l10n.GrepTxtCall
usage> java echalk.tools.l10n.GrepTxtCall [-h|-k|-l|-s|-p|-0]
[-nw] [-v] [-r] <file> ...
-h Print this message and exit.
-k Plain listing of all L10N keys in order of appearance
(default).
-l List with filename and line number for each key.
-s List sorted keys with duplicated removed.
-p Sorted property output for default (identity) mapping.
-0 No output of keys. Useful for getting just the warnings.
-m Search for mnemonics keys instead of text keys.
-nw Nowarn - do not report non-literal keys.
-v Verbose output. Only used for -s and -p modes.
-r Recursively search all dir files for *.java files.
> java echalk.tools.l10n.KeyCmp
usage> java echalk.tools.l10n.KeyCmp <propfile1> <propfile2a>
[<propfile2b> ...]>
Listing 3.7: Usage of command-line utilities for the internationalization of the
system.
them. Because the GrepTxtCall performs only a static analysis of the Java
source code, it cannot evaluate variables or method calls as keys and prints
warnings if it encounters such keys. To be able to use this tool, the source code
of E-Chalk uses only literal strings and strings composed of concatenated literal
strings.29 The command-line options of GrepTxtCall allow to directly output
a property file usable as a resource bundle for the English localization, using
the identity mapping between keys and entries. It handles any special encoding
needed for the property file, for example spaces in the key must be escaped,
as unescaped spaces separate property keys from entries. See Listing 3.7 for a
complete listing of the program’s command-line options.
The command-line application echalk.tools.l10n.KeyCmp prints a Unix
diff style difference between the keys in a single property file and the set of keys
from a list of property files, see Listing 3.7. This allows to conveniently check the
keys from all the property files for a single locale against a list of all keys from
the source code, generated by the GrepTxtCall tool. The combination thus
provides a static check of the resource bundle entries against the localization
calls in the program.
3.10
Debugging Tools
3.10.1
E-Chalk Command-Line Console
For debugging purposes, a command-line interpreter was added to E-Chalk,
which can be run at the same time as the main system. It shows all outputs
the package name.
29 GrepTxtCall is able to parse keys like "Reading file {0} "+"failed." and assemble
them to a single string. It can also handle bracketed expressions.
60
CHAPTER 3. THE E-CHALK APPLICATION
Figure 3.4: The command-line console listing the threads during recording.
from the standard out and error streams and provides a number of commands
to control the application.
Commands provided include instructions to list and modify the running Java
threads, see for example Figure 3.4, as well as instructions to access the property
settings of the E-Chalk application. For example, the sset command can be
used to set a property represented by a GUI input element in the setup dialog,
changing the input component’s value. This allows to control all setup dialog’s
settings from the command line. For convenient usage, the command line also
features a persistent command-line history, controllable with the up and down
arrow keys. Calls which are a duplicate of the previous call are not added to
the history again.30
The commands are implemented by inheriting from an abstract Command
class, which declares an abstract method reporting the command name, argument syntax, a short description, and a method for actually executing the
command with the included arguments. The description and the argument syntax are used by the help command of the console. See Listing 3.8 for currently
implemented commands.
On startup of the command-line console executes a startup file, named
conf/console.rc in the default configuration. This is useful to define command aliases, to output information messages to the user, and to immediately
start other debugging tools using the Launchable interface described below.
30 This is equivalent to duplicate settings being ignored in Unix shells, e. g. histdup=prev in
the tcsh or HISTCONTROL=ignoredups in the bash.
3.10. DEBUGGING TOOLS
61
[echalk] 2004-06-21 15:41:44 Middle Europe Time started by user
knipping.
>help
# [<string> ...]
comment, no effect
alias [<alias> [<cmd>]]
list/set command aliases
cat <file> [...]
print out files
clear
clear console
close
disposes console
cset [<key> [<value>]]
list/set config properties
cunset <key>
remove config property
deorbit <no>
request termination of job <no>
destroy <no>
destroy thread <no>
echo [<string> ...]
output strings
exec <command> [<arg> ...]
execute native system command
finalize
request of pending finalizations
free
show memory statistics
gc
request garbage collection
help
show this help
history [<n>]
print console history entries
hsave <file>
dumps history to file
hsetsize <n>
sets command history length
hsource <file> [...]
load commands into history
iconify
iconify console
info
show echalk copyright info
interrupt <no>
interrupt thread <no>
jobs
list jobs (launchables started in
bg with ’&’)
launch <class> [<arg> ...]
starts a launchable
ls [-alFQRkhfStXr] [<file> ...] list directory contents
mkdir [-v] <dir> [...]
make directories
ps
list processes (launchables
started)
quit
request programm shutdown
resume <no>
resume thread <no>
rmdir [-vp] <dir> [...]
remove directories
save <file>
dump console content to <file>
seppuko
exit w/o saving (dangerous)
set [<key> [<value>]]
list/set system properties
setpriority <no> <pri>
set priority <pri> to thread <no>
source <file> [...]
execute commands from file(s)
sset [<key> [<value>]]
list/set echalk settings
suspend <no>
suspend thread <no>
ts
list threads
tstop <no>
stop thread <no>
unalias <alias>
remove an alias
unset <key>
remove system property
version
show echalk version info
Listing 3.8: Log from the command-line console: List of available commands.
62
CHAPTER 3. THE E-CHALK APPLICATION
# uncomment to start memory monitor tool on console startup:
#launch echalk.tools.debug.MemoryMonitor &
# alias definitions:
alias ?
help
alias !
exec
alias print
echo
alias alloc
free
alias kill
deorbit
alias whoami
set user.name
alias uname
set os.name
alias arch
set os.architecture
alias pwd
set user.dir
alias la
ls -aF
alias ll
ls -alhF
alias edit
launch echalk.util.TextEdit
alias topdf
launch echalk.tools.pdf.Board2PDF
alias browse
launch echalk.util.HtmlViewer
alias showmem launch echalk.tools.debug.MemoryMonitor
# print welcome message:
echo "E-Chalk command line console.
Enter ? for help."
Listing 3.9: Example console.rc file.
See Listing 3.9 for an example startup file.
The Interfaces Launchable and Progressible
Several parts of the E-Chalk system are loaded and started dynamically, see
Section 3.1.1. Their names and the parameters are not hard-coded, but defined
in the startup configuration files as properties. The loading process relies on
the components implementing the de.echalk.util.Launchable interface and
such Launchables can also be loaded and started from the command-line console
using the launch command.
Examples for Launchables in E-Chalk are the components for the streams
to record, board, audio, and/or video. Further examples are the audio profile
wizard, the board-to-PDF converter, the html browser used for the help system,
and the text editor used to edit the configuration files in the expert-mode setup.
The Launchable interface specifies three methods, a void init(String[])
method, a void launch() method, and a void deorbit() method. The init
method initializes the components with component-specific arguments. The
launch method actually starts the recording process without further delay. The
two phases are separated to establish a synchronization point when used to start
E-Chalk’s different stream-recording components, see Section 3.6. The launch
method is expected to block the thread it was called from until the Launchable’s
process is terminated31 or until it is stopped externally by calling the deorbit
31 For example, the PDF converter does not respond until the conversion process from board
data to a PDF file is finished.
3.10. DEBUGGING TOOLS
63
Figure 3.5: A memory-usage monitor for the JVM realized as Launchable.
method.32
A Launchable must provide a default constructor. Note that there is no
language mechanism in Java to enforce the presence of the default constructor33
or any other constructor signature in classes implementing an interface. This can
only be specified informally in the documentation. It would have been possible
to merge the init call with the constructor, but demanding a default constructor
for components by documentation is common practice (like for example for
Java Beans or for OSGI bundles) in contrast to demanding other constructor
signatures.
The launch command of the command-line console dynamically loads the
Launchable class given as the first argument, instantiates it, calls init on the
instance with any further command-line parameters as arguments, and calls
the launch method. The command interpreter’s thread is blocked until the
launch method returns. To avoid Launchables blocking the interpreter, they
have to be started in the background. For this purpose, any command can be
started in a separate thread by using a trailing & sign, similar to Unix shell-style
commands started in the background. The Launchable can then be stopped by
using the deorbit command on it, executing the method of the same name on
the Launchable object.
An example of a Launchable supplied purely for development purposes is
the memory-usage monitor shown in Figure 3.5. Another Launchable used
only for debugging from the command-line console is OscarLaunch. It allows
to access the Oscar OSGi component management system.34 Launching it adds
all commands of the Oscar OSGi shell to the command interpreter35 , allowing
to load, update and start Oscar bundles from the command line.
A sub-interface of Launchable, de.echalk.util.Progressible, is provided
for implementing processes which can report their progress when launched. For
example, the module converting E-Chalk audio data from the old WWR2 format to WWR3 is a Progressible. The sub-interface extents the Launchable
by adding a getProgress() method which returns the relative progress as a
double ranging from zero to one. When the setup dialog converts the audio
32 For
example, recording by the audio component needs to be stopped by deorbit.
default constructor is a constructor with an empty parameter list.
34 The Oscar OSGi system is used by the audio and video server implementations to manage
encoding and streaming components, see Sections 5.1.1 and 5.3.
35 The Oscar shell command are assigned a common prefix in the E-Chalk command interpreter. This prefix, given as an argument to the Launchable, serves to avoid name collisions
with the interpreter’s built-in commands.
33 The
64
CHAPTER 3. THE E-CHALK APPLICATION
format to WWR3, it can show a progress bar for the conversion to give the user
feedback.
3.10.2
Message Logging
The E-Chalk system defines its own java.io.PrintStream class for message
streams. Its constructor allows to specify a label to prepend to each output
line. The system uses this to mark output by the component it came from:
the board component’s output starts with [board], the PDF converters output
with [pdf], output from the main control with [echalk], etc. With the stream
inheriting from PrintStream and handling the tagging of a line start internally,
it can also be used for printing tagged exception stack traces by calling the
printStackTrace(PrintStream ps) method of a java.lang.Throwable.
With the default settings for the E-Chalk configuration the stream output
is sent to the system’s standard output stream, the command-line console (if it
was activated), and to a log file, by default named conf/echalk.log.
The E-Chalk components use two output streams, one being the tagged
standard output stream and another for debugging purposes. When the system
is started with the echalk.debug property set to true, the debug stream is set
to the standard output stream. Otherwise it is set to a /dev/null-like stream,
ignoring all output calls.
Chapter 4
Board Server
4.1
Painting on the Board
The code for displaying content on the board is shared between the client and
the server-side board for maintenance reasons. With the client Applet required
to run in a browser supporting only Java 1.1, this shared code cannot use more
recent Java library additions.
The elements that are painted are represented as instances of the abstract
class echalk.shared.form.Form: the subclass StrokeForm is used to represent
a stroke composed of a sequence of connected line segments, a TextForm a typed
text, an ImageForm an image on the board, and an AppletForm an Applet. A
Form object stores its position on the board, and provides a paint method to
draw itself and a method to test for an intersection with a given rectangle, which
is used to determine the visibility of Form objects on the board for the current
scroll offset. The Forms are stored sequentially in a dynamically growing array
in order of creation.
The board uses double buffering to avoid having to call the paint methods of
each visible Form each time a repaint request is issued by the window system, for
example when a portion of the board becomes visible again after being obscured
by another window. Whenever a new Form is added to the board content, it is
painted both to the screen and to the board’s offscreen buffer. On a repaint, the
offscreen buffer is simply copied to the screen, resulting in a fast and flicker-free
repaint.
A complete redraw of the offscreen buffer is only needed when scroll events
happen or when a clear-all command or an undo is issued, see Section 4.5. In
this case, all Forms have to be checked for their visibility given the current scroll
offset, and the visible ones have to be painted in the order they were added to
the board contents. The original brute-force approach ran sequentially through
all Form elements, roughly about 2.000 objects per hour of recording. On the
server-side board, the resulting redrawing behavior was still perceived as fast
enough in real lectures.1 However, rewinding and fast-forwarding the client
1 This
was even true for extensive tests running on a 500 MHz, 256 MB Pentium III Windows
laptop, when the original data representation resulted in roughly 25,000-50,000 Form objects
per hour of lecture. The original data representation created a Form for each line segment
drawn. Now the board merges all line segments belonging to the same user stroke into a
single Form, which creates less than a tenth of the original number of Forms, speeding up
65
66
CHAPTER 4. BOARD SERVER
Figure 4.1: Typed text with the first line break created automatically and the
second defined explicitly by the user with [Shift]-[Enter].
board felt too slow. For fast redrawing, a data structure that allows fast access
to all visible Form objects in the order they are to be drawn is now used. The
virtual board space is separated into pages of the visible board area size. For
each page, there is a (dynamically growing) array of references to all Form
elements that intersect the given page, stored in their order of creation. For
each given scroll offset, the visible board area is then contained in up to two
pages and only the Forms referenced in the pages’ arrays have to be checked for
visibility. With the Forms of a single page being already ordered, all the relevant
Forms can be retrieved in the correct order from the page arrays in linear time.
Elements which are shown only temporarily on the board, like image-placing
frames and text-input cursors, are not painted to the offscreen buffer. Instead,
they are painted directly to the screen using XOR paint and removed by repainting with another XOR paint.
For the board client, an instance of the echalk.shared.DrawPanel class is
the component handling the actual display of the board content, implementing
double buffering and processing board events into new Forms or changes to existing ones. The subclass echalk.board.gui.ActiveDrawPanel is used for the
server-side board. The ActiveDrawPanel is capable of processing user inputs
to create board events. To allow adding Applets to the DrawPanel (see Section
4.10), the DrawPanel class inherits from the container2 java.awt.Panel.
4.2
Drawing Lines
The board feature used most is the plain drawing feature. A drawing action
is achieved by a mouse-drag-like motion with a pointing device. The board
receives the points of the drag movement and connects these points to a stroke
in the current drawing color and drawing width. Eraser actions are handled like
drawings in the background color.
A stroke to be painted is stored in a echalk.util.form.StrokeForm object.
A StrokeForm stores the list of its vertex points, stroke width, and a color. The
line segments forming the stroke are drawn as if the pen were a circle with the
given width, i. e. round line joints and caps are used. A convenient way to draw
these lines would be to use an instance of the class java.awt.Graphics2D for
painting and set its drawing shape to circle with the setStroke method. Unfortunately, Graphics2D is not available in Java 1.1. Because the code for drawing
redraws considerably.
2 In Java, GUI components that permit embedding of other components are subclasses of
java.awt.Container.
4.3. TYPING TEXT
67
Figure 4.2: Vertical font metrics to consider for laying out text. Similarly,
horizontal advance is composed into left side bearing, glyph width, and right
side bearing.
lines should be the same on the server and client sides and the because the client
side cannot be guaranteed to have the Graphics2D available, the drawing must
rely on the more basic drawing methods provided by java.awt.Graphics. The
board draws a line segment as a rectangle with circles at its ends.3
4.3
Typing Text
An echalk.shared.form.TextForm represents typed text by text color, font
size, and position on the board. If it is still active, i. e. is still being changed by
user key typing, it also displays a cursor in the text. The user can add all regular
characters to the text as well as use delete, backspace, left and right text arrows
to move the cursor in the text, and the home and end keys to jump to the start
or the end of the text. Also, paste from clipboard with Ctrl-V and emacs style
cut to clipboard (kill from cursor to end of line with Ctrl-K) are supported,
as well as a text history accessible with the up and down keys. The history is
kept between session. The number of entries in the history is determined by
a property in the echalk.conf file. Key inputs that are duplicates to their
predecessor are omitted from the history.
A TextForm splits the typed text in rows with dynamically created line
breaks to avoid the text running out of the board area, see Figure 4.1. The
vertical metrics of a font needed for the layout are illustrated in Figure 4.2.
When painting, a call to the java.awt.Graphics method drawString is done
for each row, because drawString does not handle newlines itself.
4.4
Images and Applets
An echalk.shared.form.ImageForm contains the board position of the represented image and the image data as java.awt.Image. Is paints itself by using
the java.awt.Graphics method drawImage.
An echalk.shared.form.AppletForm instance encapsulate an Applet as an
java.applet.Applet and its position on the board as rectangle. The painting
3 Because the basic circle drawing with Graphics results in drawings with displeasing asymmetries for even circle diameters due to a Java bug (see IDs 4080106, 4151279, 4151636 and
related in the Java bug database [43]), E-Chalk relies on its own implementation of the Bresenham circle drawing algorithm [Bre77].
68
CHAPTER 4. BOARD SERVER
Figure 4.3: An example of handling a sequence undos, redos, and Form object
creations. The example sequence is taken from the UndoManager example in
[LEW+ 02].
is delegated to the Applet’s paint method. When the Applet is added to the
board, it is registered as a java.awt.Component to the DrawPanel. For this
reasons, the DrawPanel inherits from java.awt.Container, see Section 4.1.
Whenever the AppletForm’s absolute position changes due to a scroll event,
the Applet’s setBounds(java.awt.Rectangle) method is used to redefine its
area. For description of logging AWT events of Applets for replay purposes, see
Section 4.10.1.
4.5
Undo, Redo, and Clear All
To realize Undo and Redo actions, the board stores all Form events sequentially
in an array and keeps an index to the next point of insertion into the array, like
a stack.4 An undo command decreases the index by one, a redo reinserts an
undone element by increasing the index. When a new Form is added, redo of
previously undone elements becomes unavailable. See Figure 4.3 for illustration.
A Clear All command is rarely used. It simply removes all elements from
the Form array.
4.6
Custom GUI elements
The board features a few GUI elements specifically customized for the E-Chalk
application. For choosing a drawing color, a subclass of javax.swing.Checkbox
4 The
Java package java.swing.undo provides an extensive collection of interfaces and
classes for undo and redo features. Unfortunately, the undo/redo managing mechanism is not
available with Java 1.1 and can therefore not be used in the code shared between the board
server and client. Another shortcoming is that the implementation does not support infinite
undo depth. For these reasons, the Java undo support is not used by the E-Chalk board.
4.7. BOARD RESOURCE LOADING
69
Figure 4.4: Custom color and size chooser elements from the board’s tool dialog.
was implemented to allow graphical color labels (or an image of an eraser
as a label for the eraser tool) instead of textual labels. Instead of a regular
javax.swing.Slider an equivalent component with a logarithmic scale was
used for selecting the size of the drawing tool and the font size for typed text,
because the exactness of drawing sizes is the more important the smaller the
drawing size is. See Figure 4.4 for an illustration of the chooser components.
The implementation of the logarithmic slider relies on Java Swing Components
delegating their painting and controls to a ComponentUI class, using the modeldelegate variant of the model-view-controller (MVC) architecture. The board
instantiates a standard Java Slider component and sets its ComponentUI to
an echalk.util.LogarithmicSliderUI, which provides the logarithmic style
in painting and control.
The echalk.board.gui.URLDialog allows the user to choose a bookmark.
To make the Java Swing list component (an instance of the javax.swing.JList
class) display the thumbnail icons saved with the bookmarks5 , an instance of
a custom list cell-renderer class is set to the list.6 The dialog also shows a
summary of the bookmark properties in the tooltips of a bookmark, which can
be especially helpful for bookmarks with parameters, namely for CGIs, chalklets,
and macros. See Figure 4.5 for an example.
The bookmark lists for images and Applets are just named links to files without any extra parameter data needed to load the resource. For these bookmark
lists, the displaying URLDialog also features an input line for the user to type
in a known URL address. For convenient selection of local files, a file chooser
can also be launched. Its file filters are preset to show only relevant files.
4.7
Board Resource Loading
The class echalk.board.rc.RcLoader handles access to external resource data,
i. e. Applets, images, CGI calls, requests to computer algebra systems, as well as
loading animations/chalklets. After loading, it passes the data on to resource5 See
Section 3.4.
class echalk.util.CellRenderer implements the java.swing.ListCellRenderer interface and is used here. It also implements the java.swing.table.TableCellRenderer interface to be used for rendering the thumbnails in the bookmark editors, where the bookmark
entries are shown in java.swing.JTable objects.
6 The
70
CHAPTER 4. BOARD SERVER
Figure 4.5: URL bookmark dialogs of the board, left with textual input line
and button to launch a file chooser, right with tooltip for a chalklet bookmark.
type-specific handler objects which manage how they are integrated into the
board content. Macros are not loaded via the RcLoader.
The resource loading tasks for the resource loader are triggered in the GUI’s
event handler thread, and because (potentially) longer actions should never be
handled directly in the event handler thread7 , the RcLoader uses a separate
thread to handle these tasks. As described in Section 2.4.2, a feedback dialog
is shown when a load task needs more than half a second, and the dialog also
provides a cancel action for the task.
Canceling a load task is not easily done: it is not possible, for example, to
abort a read from a URL immediately. As long as the thread is IO bound, it
cannot process the message to stop. As a workaround, the thread is not only
sent a signal to die, but it is also marked as “invalid”, so that any resulting data
are discarded.
For efficiency reasons, not every task creates a new thread. Instead the
loading thread is reused8 , except when the user selects to cancel the loading
task. In the latter case a new thread is created to ensure that the user can
immediately start a new resource loading task. This means the RcLoader is
implemented according to the thread pool pattern [GHJV95], but with only a
single worker thread being in the pool.
Resource requests are composed of two subtasks, represented in an abstract
class named echalk.board.rc.Task. First, the raw resource data are loaded,
like for example getting data of an image from its URL. In the second step, the
loaded data is decoded to an object that can be handled by the board, i. e. the
image byte data has to be converted to a Java Image object. After that, the
image is passed on to a handler object which knows how to add the resource to
the board. For example, the ImageHandler lets the user select the position of
7 Responding to user input is done in the event handler thread. Having a longer action
being handled in the event handler effectively renders the program non-responsive. It would
not even handle cancel actions from the user until the pending action is finished.
8 This is an implementation of the worker thread pattern, see [GHJV95].
4.7. BOARD RESOURCE LOADING
71
an image on the board.
The LoadTask objects contain the resource loading and decoding implementation as well as the methods for accessing information about the current
progress to display in the progress/cancel dialog: a textual message with a localized description of the step the loading process is currently performing and
a numerical progress, if it is available.9
The loading subtask also tries to determine the MIME-type of the resource
loaded. For most requests, like using image bookmarks, it is known in advance
what kind of data will be returned, but for CGI requests it cannot be decided
a priori which content decoding and handling is needed. The system then uses
the MIME-type information to decide which decoder to use.
See Figure 4.6 for an overview of the classes involved in board resource
loading.
4.7.1
URL Loading
Many of the board resources are loaded from URLs. In the case of CGI scripts,
there can be also POST arguments given for the URL request.10
For a URL loading task, a URL connection is opened, any POST arguments
are sent sent over, and the returned data is read from the connection. If the
URL is a file URL, the URLLoad object does not use the Java URLConnection
mechanism. Instead, the more efficient standard file read is used. An early
implementation, which relied on the standard URL mechanism, suffered from
a noticeable slowdown due to overhead introduced by the Java URLConnection
mechanism.11
Java also allows access to URLs which need authentication. The programmer
has to set a java.net.Authentificator to use the mechanism. The E-Chalk
board defines the echalk.board.util.LoginAuthentificator as such an authenticator. When a user tries to access a protected URL resource, an authentication dialog is displayed. The dialog shows all the information available for
the request, the authentication message from the remote side, and the address
of the protected resource, and allows it to input the user’s password without
the password to be shown, see Figure 4.7. On a failed authentication, the dialog
reopens until the user successfully authenticates or chooses to cancel. An authentication for a resource is only needed once per session since authentication
data are cached by E-Chalk for the next request.
The standard URL handling of Java supports authentication only for HTTP
requests. However, Java allows to replace the handling mechanism of URLs
on a protocol basis (and to define handlers for new protocols) by a call to the
java.net.URL method setURLStreamHandlerFactory. In the E-Chalk system,
the FTP protocol handling was extended to support authentication.12
The HTTP protocol handling is also replaced in E-Chalk if it runs with a
Java version lower than 1.4 to improve user messages in case of a resource access
9 The progress cannot always be determined numerically. For example, if a task for loading
a file from a URL is still waiting for the connection to the remote server, there is no way to
tell how long it has to wait. In these cases, the dialog displays an indeterminate progress bar.
10 GET arguments cannot only be specified for the CGI requests, but also for any other
URL loading request, as they are encoded within the URL, see [FGM+ 97, FGM+ 99].
11 So far, this speed was only tested in JRE 1.2.
12 For Java 1.3 it also fixes a bug that prevents the specification of an alternative port in
FTP URLs, see Java bug 4320992 [43]. In Java 1.4, this problem no longer occurs.
72
CHAPTER 4. BOARD SERVER
Figure 4.6: Overview of resource loading classes.
4.7. BOARD RESOURCE LOADING
73
Figure 4.7: Authentication dialog shown for loading password-protected resources.
error. The java.net.HttpURLConnection has a method getResponseCode(),
which would allow the URLLoad to return the HTTP request’s response code
to examine failed loadings in more detail, for example to distinguish between a
document not found, a forbidden access, a timeout, or a user-canceled authorization. Unfortunately, this method does not always return the response code
when the document was not successfully loaded. It often throws an exception
due to a Java bug.13 The HTTP handling mechanism used in E-Chalk fixes this
problem.
For HTTP requests, the MIME-type is accessible via the URLConnection, as
HTTP-Server sent this information with their reply (for HTTP versions since 1.0
[BLFN96]). For other protocols, this information is guessed from the extension
of the URL’s file-part, or, if an extension is not given, from the data content,
using the magic number entry for file types.
4.7.2
Requests to Computer Algebra Systems
Another type of resource access are requests to computer algebra systems.
E-Chalk’s API provides interfaces to develop connectors for arbitrary system.
The connectors for Mathematica and Maple are already provided as well as the
connector to a simple built-in calculator.
Note that requests to computer algebra systems must be cancelable, as it is
possible to send an infinite recursion or computing requests that are beyond the
power of the computer (e. g. 999 ).
A connector is implemented by inheriting from the abstract class de.echalk.util.EvaluatorKit. It provides the localized setup information for
the E-Chalk setup dialog described in Section 3.3 and a static factory method
to build an object implementing the de.echalk.util.Evaluator interface. The
EvaluatorKit also defines the parameter list for the factory method and how
the parameters are set by user in the above-mentioned setup dialog. If an EvaluatorKit is activated, a connection to the computer algebra system is made
by building an Evaluator at startup.
13 To be more precise, in Java 1.3 URLs for which the server’s response code was over 400
and where the URL file path does do not end in /, .htm, .html, or .txt trigger a java.io.FileNotFoundException whenever calling any of the methods getResponseCode(), getResponseMessage(), getErrorStream(), getHeaderField(String name, long def), or getInputStream(). See Java bug 4160499 and the related 4150792, 4191207, 4222009, 4300174,
4314717, 4406592, 4492994, 4655826 [43].
74
CHAPTER 4. BOARD SERVER
Figure 4.8: Maple plot without transparency (left) and modified for transparent
background (right).
The Evaluator is notified of the board’s background and is registered as a
listener to the board’s current foreground color. This allows for adjustments of
returned images for the board’s colors.
The Evaluator for Wolfram Mathematica uses a Java connection package
provided by Wolfram, called JLink [46]. E-Chalk’s implementation allows to
connect to a locally-installed Mathematica Kernel and can handle both textual
answers and graphical plots. As default plotting options, the plot color is set
to the board’s current foreground color and the plots background color is set to
transparent. When Mathematica is connected, it is also used to evaluate the
requests from E-Chalk’s mathematical handwriting recognition, see Section 4.9.
The EvaluatorKit for Maple was integrated due to user requests. Like the
Mathematica connection, the Maple integration can handle both text output
and graphical plots. It directly starts Maple as a process and realizes the data
exchange as reading and writing text data via the process’s standard IO streams
and plots data via temporary files. Maple does not support transparent background in plots, but E-Chalk’s MapleKit optionally allows transparency. This
is realized by parsing the plot’s GIF image data and setting its background color
to transparent.14 Also, any color that is equal to or very near to the board’s
background color is set to black (on light backgrounds) or white (on dark backgrounds), so that they remain visible. See Figure 4.8 for an example. This color
modification is not possible for some older Maple versions, as they only allow
to plot in JPEG format, where transparency is unavailable.
To evaluate the mathematical terms identified by the handwriting recognition15 without Mathematica being available, a simple calculator program is part
of E-Chalk as an Evaluator. It can handle terms with integers and fraction
numbers as operands, brackets, and the operators +, −, ∗, /, and exponentiation. A student has extended this calculator to handle function calls, definitions
of function, constants, and basic function plots for two and three dimensions,
see Figure 4.9 for example output.
With the E-Chalk API it is easy to integrate other computer algebra systems
14 GIF images have a color table of up to 256 colors. One of the colors can be marked to be
fully transparent.
15 The mathematical handwriting recognition is described in Section 4.9.
4.7. BOARD RESOURCE LOADING
75
Figure 4.9: Example plot from E-Chalk’s built-in computer algebra system.
like MuPAD or use different ways to connect, like using a remote Mathematica
server via a TCP socket connection. So far only Mathematica and the built-in
calculator can be used to process the results of the mathematical handwriting
recognition. In the future, the communication between the Evaluators and the
handwriting recognition should become part of the API.
4.7.3
Decoding
When the resource is loaded as raw byte data, it is transformed to data the
board can handle. Text data is decoded according to its character encoding.16
For text/plain MIME-type the character is directly passed directly to the
board. For text/html the text is parsed and converted to plain text by the
echalk.board.util.HtmlDoc class. The transformation is similar to the formatting done by a text-only browser like Lynx [57], though only a subset of
HTML is currently supported. See Figure 4.10 for an example.
An alternative would be to convert the HTML to an image by using the
HTML-rendering capabilities of Java. The drawbacks are that using images
would need more bandwidth for the transmission, that the Java HTML interpretation often fails due to non-standard HTML data, that its implementation
is very heavy weight and perceivably slow.
Images are decoded to an java.awt.Image object by using the standard
Java image creation methods. Before the image is given to the board, the raw
image data are saved in the image resource directory17 in order to make the
image accessible to any E-Chalk clients.
An Applet resource is given by an HTML page where the Applet is embedded and its parameters are defined. The resource’s bytes are decoded by
transforming them into HTML text, taking the character encoding into account
and parsing all <applet>-blocks with the corresponding parameters using the
class echalk.shared.applet HtmlAppletBlock. After storing the HTML data
into the Applet resource directory (to make it accessible to E-Chalk clients, see
Section 7.2.4), the referenced Applets are loaded using a custom class loader
16 For data returned from an HTTP request the encoding may be specified in the
Content-type header field. If unspecified, it defaults to iso-8859-1 (ISO Latin1) [FGM+ 99].
17 See Section 4.11.2.
76
CHAPTER 4. BOARD SERVER
Figure 4.10: The author’s home page converted to plain text on the board, only
top section of converted page shown.
and initialized. The class loading process also stores all class data in the Applet
resource directory. See Section 4.10.1 for further details.
4.7.4
Chalklets
When the user selects a chalklet bookmark, the ChalkletKit referenced by the
bookmark is loaded as a resource load task. To access the kit class from the
class path URL, the loading process uses the java.net.URLClassLoader and
Java reflection. The ChalkletKit is asked for the minimum area size its chalklets need. Next, the echalk.board.rc.ChalkletHandler lets the user select
the board area the chalklet should live in, as described in Section 2.4.2. The
construction of the concrete chalklet instance is done in the handler following
the area selection, because the user-selected board area is needed in a parameter to the chalklet building method. In addition to the parameters given by
the chalklet bookmark18 , the factory is passed a echalk.board.rc.ChalkletContext instance, which serves as a communications interface between chalklet
and board. The ChalkletContext can be queried about information on the
environment the chalklet lives in, for example the location of the chalklet area
and the background color of the board, and provides methods for the chalklet to
send stroke paintings to the board. When the chalklet instance is constructed,
its area is outlined in gray on the board and it is registered as a stroke listener
to user strokes drawn in its area. See Section 4.8.1 for a detailed description of
the mechanisms for strokes being passed from the server-side board to chalklets
and vice versa.
In contrast to images and Applets, the server does not have to mirror the
chalklet, because the client does not have to load the chalklet itself. It only
receives the strokes produced by the chalklet and saved as board events.
18 See
Section 3.4 for setting chalklet parameters.
4.8. STROKE DELIVERY
4.7.5
77
Resource Handling
The echalk.board.rc.TextHandler pastes the text to handle directly a text
row below the request that produced the text.19
The echalk.board.rc.ImageHandler lets the user place the image resource
to the board as described in Section 2.4. Applet resources are placed similar
by the echalk.board.rc.AppletHandler, see Section 4.10 for the details of
Applets instantiation.
The echalk.board.rc.ChalkletHandler lets the user select the chalklet’s
area and marks it by drawing the area’s border. Once the area is determined, the
de.echalk.util.ChalkletContext for the new Chalklet can be constructed
and the ChalkletFactory is used to build a new Chalklet instance.
The new object is registered to the echalk.board.rc.StrokeSender queue,
which handles the forwarding of user-stroke events to the stroke listeners, see
Section 4.8.1. After that, the board returns to the default user paint mode.
The echalk.board.rc.MacroHandler lets the user select where the macro
should start and then starts to play the macro on the board in an extra thread.20
Any user action on the board stops the macro. The board behaves like a client
while in macro play mode, as pre-recorded events are delivered to the board.
4.8
Stroke Delivery
4.8.1
Chalklet Strokes
The board sends all its users line drawing events as well as its undo and redos
of line strokes to the associated echalk.board.rc.StrokeSender instance.21
Whenever a full stroke has arrived, e. g. when the a drawing is terminated by
a mouse-up event, or a stroke is undone, the StrokeSender sends this to its
echalk.board.rc.StrokeReceiver. Each registered StrokeListener like a
Chalklet is encapsuled StrokeReceiver, which checks the stroke events for
their relevance to the listener. In the case of a Chalklet, a stroke is considered
relevant if it occurred in the chalklet’s observed area and if the stroke was not
created before the chalklet became active. The latter restriction is important
for consistency when undos and redos occur. Any relevant stroke event is passed
on to the listener. That stroke is handled in a separate thread for each of the
listeners to avoid having a StrokeListener instance blocking the board. See
Figure 4.11 for an illustration of the stroke flow.
When a Chalklet wants to draw into its board area, it sends Strokes to
its ChalkletContext.22 The strokes are put into the board’s echalk.board.19 The implementation of the TextHandler also allows to handle text resources without a
specified request position. In that case the handler would let the user place the text as in the
add text action described in Section 2.4. For the time being, there is no way to produce such
text resources.
20 The rate of board events sent by the macro thread is restricted to 100 Hz to avoid bandwidth bloats. See Section 4.11.1.
21 Line drawings that are not drawn by the user, like the strokes produced by Chalklets are
not collected. The stroke forwarding is purely meant for interpreting human drawing actions.
This also prevents infinite loops that might easily occur if Chalklets are allowed to react to
Chalklet’s output with drawings.
22 Similar to an AppletContext for Java Applets, the ChalkletContext is the communication
interface for a chalklet to its environment it runs in. The ChalkletContext for a chalklet is
provided when it is built, by passing it on as a parameter to the ChalkletKit’s chalklet build
78
CHAPTER 4. BOARD SERVER
Figure 4.11: Communication between the E-Chalk board and its stroke listeners,
the handwriting recognition, and active chalklets.
rc.RequestStrokeQueue. This queue has an extra thread which takes the linedrawing data from the queue and sends them to the board. The queue processes
strokes using a FIFO strategy. The line segments a Stroke object is composed
of are associated with timestamps. If a timestamp is in the future, the queue
waits for the given time before passing on the line-draw event, otherwise it is
processed immediately. If the user is drawing, the draw event is delayed until
the user finishes his or her stroke. Users drawings can also split the synthetic
strokes into two parts. This is important to keep the complete control of the
board to the user. Handling the two drawing actions concurrently would not be
a suitable alternative, as this would destroy the connection of the user strokes
for undo/redo purposes.
The RequestStrokeQueue does not send the strokes’ data at a higher rate
than one line segment per ten milliseconds to limit the bandwidth taken up by
chalklets. As a comparison, user drawings with a typical USB mouse generate
125 line segments per second, while the chalklets are bound to 100 per second.
See Section 4.11.1 for a more detailed discussion.
When the board area is scrolled, the position of all active chalklets is checked.
When the area of a chalklet is no longer completely visible, it is deactivated.
It is unregistered from the StrokeSender, its pending strokes in the RequestStrokeQueue are removed, and the Chalklet instance itself is notified of its
deactivation, so it can release any resources it still holds.
method.
4.9. MATHEMATICAL HANDWRITING RECOGNITION
79
Figure 4.12: Recognized symbols.
4.8.2
Handwriting Recognized Strokes
If the handwriting recognition is activated, it gets the stroke events from listening to the StrokeSender, like chalklets do. The main difference is that its stroke
receiver tags all strokes as relevant which have the color which is associated with
the recognition, see board settings description in Section 2.4.1.
The results of the handwriting recognition are requests to an Evaluator,
see above. An overview of the included handwriting recognizer is given in the
following section.
4.9
Mathematical Handwriting Recognition
The first on-line handwriting recognition developed for the E-Chalk system used
a k-nearest neighbor classification. The sequence of strokes was grouped into
symbols, based on intersections of their bounding boxes and a constraint that
symbols can be only formed by one or two strokes. The recognizer returned its
result once a special end symbol was recognized. The approach worked quite
well for simple, calculator-type terms. However, the classification performance
decreased dramatically once a greater number of symbols were introduced and
it was not capable to handle spatial relationships between the mathematical
symbols, which are fundamental to the interpretation of more complex formulas.
For this reason, the current recognizer engine uses a two-step strategy similar
to well-known approaches [BG96, LW97, CY00]. The first step is the classification of the stroke data, now relying on Support Vector Machines (SVMs) [TR02],
whose non-linear classifications [Vap98] yield superior classifications for the increased number of symbol classes. The classification now also handled symbols
composed of three strokes. The second step is to apply a structural analysis
technique to obtain a hierarchical structure of the expression which describes
80
CHAPTER 4. BOARD SERVER
the mathematical relationships among the symbols. A detailed description of
the on-line mathematical handwriting recognizer can be found in [Tap04].
Data Preprocessing
Strokes delivered by the E-Chalk board are considered part of the same symbol if their distance (considering the strokes brush radius) is below a certain
threshold. The online data is then preprocessed [TR03, FKST04] in a standard way for handwriting recognizer. First the direction of the stroke data is
normalized. A fixed number of points is then taken from the stroke’s list of
support points23 , the points are smoothed by averaging the coordinates with
those of their neighbors24 . The points are then resampled equidistantly: the
sequence of points (p1 , . . . , pn ) is replaced by a sequence of points (q1 , . . . , qn )
having the same distances between successors on the polygonal chain formed by
(p1 , . . . , pn ). Finally, the stroke data are scaled and translated to get a normalize size and position for the bounding box of all strokes belonging to a single
symbol.
The feature vector used as input for the classifier is constructed from a number of local and global features. The local features for a stroke of length ` formed
by the preprocessed points (p1 , . . . , pn ) are the coordinates of the points pi , the
turning angle25 between the two consecutive segments (pi−1 , pi ) and (pi , pi+1 ),
Pi−1
the points’ relative length position defined as `i = k=1 (||pk − pk+1 ||)/` for
the point pi , and the change of the turning angle26 for two consecutive turning
angles. Global stroke features represented in the input vector are the center of
gravity of the stroke points, the length ` of the stroke, the relative stroke length
`/d, where d is the distant between the first and last point of the stroke, and
the accumulated angle, i. e. the sum of all turning angles.
The SVM classifier
Three classifiers are used, depending of the number of strokes that form the
symbol. For symbols that there composed of more than one stroke, the feature
vector of each stroke is constructed and the concatenation of the feature vectors
content forms the full input vector which represents the symbol.
The classifier implementation uses DAG-SVMs [PCST00] as a multi-class
SVM-classifier with an RBF kernel for all the classification nodes and the first
modification of the Sequential Minimal Optimization (SMO) algorithm from
[Pla99, KSBM99] with γ 2 = 0.001.
Experimental Classification Results
Experimental data were obtained by having a volunteer writing 50 samples of
each of the symbols shown in Figure 4.12 with a Wacom Graphire 2 tablet.
The number of symbols was then artificially increased ten times by means of
transformations related to the tangent distance [SM96]. The data were randomly split into three sets. 50 % of the samples were used for training, 25 %
for testing, and the remaining 25 % for validation. For comparison, an Artificial
23 In
the current implementation, 16 points are taken.
is done using the Kernel (0.25, 0.5, 0.25).
25 The angles are represented as their sine and cosine values.
26 Again, the difference angles are represented as their sine and cosine values.
24 Smoothing
4.9. MATHEMATICAL HANDWRITING RECOGNITION
classifier type
Support Vector Machines
Artificial Neural Networks
Support Vector Machines
Artificial Neural Networks
Support Vector Machines
Artificial Neural Networks
strokes
1
1
2
2
3
3
support
vectors
29.65 %
36.73 %
39.41 %
-
train
0.31 %
0.72 %
0.00 %
0.69 %
0.00 %
0.00 %
error
test
0.93 %
1.17 %
0.62 %
1.31 %
0.00 %
1.17 %
81
validate
0.76 %
1.27 %
0.70 %
2.09 %
1.17 %
1.17 %
Table 4.1: Experimental classification rates for Support Vector Machines and
Artificial Neural Networks with classifiers built for symbols composed of one,
two, or three strokes. The column support vectors gives the share of training
vectors stored as support vectors in the SVM representation.
Figure 4.13: Regions, thresholds, and centroids of different symbol types.
Neural Network was trained with the RPROP algorithm applying the standard
sigmoid and its standard parameter values [RB93]. The number of hidden units
for each one were the same of the dimension of the feature vector. Table 4.1
summarizes the results obtained for each of the classifiers.
Structural Analysis of Mathematical Expressions
Relations in mathematical notation are defined explicitly or implicitly by the
position and size of symbols in the expressions [Cha70]. Depending on a symbol’s meaning, it can have relations to symbols in regions classified as top-left,
above, superscript, right, subscript, below, below-left, and subexpression. Figure
4.13 shows such regions. For example, the operands of the fraction operator, a
horizontal bar, are the numerator and denominator and are expected to lie in
the regions above and bottom, respectively.
Mathematical notation is represented by a recognizer in a data structure
similar to the one used in [ZBC02], as a hierarchical structure of nested baselines,
where a baseline is a list of symbols which represent a horizontal arrangement
of symbols in the expression. Each symbol has links to other baselines, symbol
lists which satisfy the spatial relations mentioned above.
The method in [Mat99] describes a minimum-spanning-tree construction for
groups of strokes, considering the centers of the stroke bounding boxes as nodes
of a completely connected weighted graph with a custom weight function. The
approach is robust in terms of stroke grouping, but not in terms of structural
analysis, so the algorithm is used in the recognizer to build the baseline tree,
which is then recursively changed to take the constraints of the above-described
spatial relations into account [TR04]. See Figure 4.14.
82
CHAPTER 4. BOARD SERVER
Figure 4.14: Left: Baseline tree after the first recursion. Right: Final tree of
spatial relations.
4.10
Applet Control
As mentioned in Section 4.7.3, any Applet added to the board content is loaded
by an instance of a custom ClassLoader. This object saves a local copy of the
loaded classes to make them available for the client-board Applet, see Section
7.2.4. The board then acts like a kind a Java-enabled browser for the Applet: It
constructs an instance of the Applet using the default (i. e. the parameterless)
constructor, and then sets a java.applet.AppletStub by calling the Applet’s
setStub method. The AppletStub and the java.applet.AppletContex accessible through the stub serve as interface between the Applet and the “browser”
it is running in. For example, the Applet accesses its parameters and any other
Applet on the same Web site through these classes.27 Therefore E-Chalk provides its own AppletStub and AppletContext classes for the Applets to run
with.
Actually E-Chalk has two classes implementing the AppletContext interface, because Java 1.4 made a change to the interface which is not backwardcompatible to Java 1.1. In 1.4 the two methods getStream and setStream where
added to the interface. Unfortunately, a Java 1.4 compatible implementation
of the interface will cause an exception when loaded in a Java 1.1 environment
with JIT (just-in-time) compiling. The JIT compiler looks at all the classes
methods, including the new ones, which use the class java.io.InputStream
in their signatures. Because this class is not available in Java before 1.2, the
process will fail. Using such a class will cause the exception, even in code parts
not run due conditional execution. To be able to provide an AppletContext
to the JVM on both the server side running on 1.4 and the client side, which
may run in any Java version from 1.1 on, the appropriate AppletContext is
loaded dynamically, utilizing reflection and therefore preventing the JVM from
JIT compilation of an inapplicable class.
After the AppletStub is set, the init() method of the Applet is called,
where all the initializations depending on parameters should be made by the
Applet.28
Then the Applet is placed by the user on the board and added as a component to the boards DrawPanel, see Section 4.4 The Applet’s position and size
are set by calling the Applet’s setBounds(java.awt.Rectangle) method. The
Applet’s execution begins by calling its start() method, after adding a number
27 A distinct AppletStub instance is used for each Applet running in a browser, while an
instance of AppletContex exists for each HTML page with Applets. The Applets parameter
are accessible through the stub and the other Applets can be communicated with through the
context.
28 These cannot be done in the constructor, because at that time an Applet has no access
to parameters via the AppletStub.
4.10. APPLET CONTROL
83
for all Applet definitions from HTML page
load given Applet class c
instantiate c with default constructor
construct AppletContex (with access to all Applets instances)
for all Applets a
construct AppletStup s from definition and context
call a.setStub(s)
for all Applets a
call a.init()
for all Applets
user places Applet a on board to Rectangle r
call dp.add(a) for DrawPanel dp
call a.setBounds(r)
for all Applets a
call a.start() in a new thread
Listing 4.1: Steps to initialize a number of Applets given in an HTML page.
of event listeners, to be able to record the lecturer’s interaction with the Applet,
see below.
For multiple Applets from a single HTML page, each of these steps has to
be executed for all Applets before the next step is performed, realizing a simple
barrier synchronization. For example all Applets must be constructed and made
accessible via the stub setting before the Applets are initialized, where they may
try to access other Applets. See Listing 4.1 for details.
When an Applet is removed from the board, for example by a clear-all event
or by rewind on the client, it is removed from the component list of the DrawPanel, its stop() and destroy() methods are called, the thread the Applet
were started in is stopped, and all references to the Applet and its classes are
cleared. According to Java’s implementation advises on Applets, the destroy()
method should release any resources the Applet used (like extra threads) and
they can then be garbage collected. Unfortunately, it seems that few of the
Applets around in the Web adhere to Java’s implementation guide.
4.10.1
Applet Events
To be able to transmit the user interaction to the remote clients, the AWT events
on the Applet’s components have to be logged. To do that, AWT listeners are
registered to the Applet and recursively to all its subcomponents. When a
listener is notified of a low-level AWT event happening, it registers the event
to the board for storing29 , thus the remote client can recreate the event to be
handled.
While the lecturer’s basic interaction with the Applet can be reproduced,
this strategy has a number of problems with achieving an exact replay:
• Changes to the Applet’s component hierarchy are not handled.
The event listeners are only registered to Applet components that exists
after the Applets init() method returned. When the Applet adds new
29 See
Section 4.11.2 for the event format for logged Applet events.
84
CHAPTER 4. BOARD SERVER
components afterwards, events delivered to them will be lost in replay.
This problem can be solved by adding a java.event.ContainerListener
to the Applet and all its subcomponents that inherit from java.awt.Container (and can thus contain other components). The listener is then
notified whenever an adding or removal of components happens and can
add and remove the event listeners accordingly.
• Extra windows are not handled.
Applets opening their own windows do not only break the board metaphor,
but the windows and their subcomponents go unnoticed by the described
recursive event listener registration. All events on these components will
be lost.
On the server side, it would be possible to prevent the Applet from accessing the frame display methods via a java.lang.SecurityManager,
throwing a java.lang.SecurityException on an access attempt. The
SecurityManager can also be used to prevent the Applets from increasing the priority of their threads or accessing E-Chalk’s system threads.
Unfortunately this mechanism cannot be used on the board client to
achieve identical results for the replay: the board client is an unsigned
Applet and is therefore not allowed to change the system’s SecurityManager.30
• Applets may modify their listener registration.
The Applet logic may remove E-Chalk’s event listeners, for example by
removing all event listeners to replace them. Also, the logic of the Applet may rely on the registered event listeners, an Applet state which we
changed on the server side.
• Platform or time-dependent Applet behavior.
If the behavior of the Applet is dependent on random numbers given by
the Java system or on execution time or information about the platform,
like OS name or Java version, the Applet’s behavior on the server side
may differ from that on the client side.
In addition, the different thread scheduling-mechanisms of the underlying
operating system may introduce race conditions and result in platformdependent replay behavior.
Finally the Applets themselves may rely on special versions of the underlying Java system, for example by using library classes not available
in older versions, by relying on running as a signed Applet, or even by
depending on the occurrence of bugs fixed in later Java version.
• Different execution speed on server and client.
The execution speed of the Applet on the client side and on the server side
can be expected to differ, as they usually run on different hardware and
share resources with different processes. For example when the lecturer
30 While this security mechanism does not really help for Applets on the board due to its
restriction to the server side, it would be worth to integrate it for the use of chalklets, as these
are only running on the server side, while the board client only handles their stroke events.
4.11. EVENT STORAGE
85
clicks on a moving target displayed in an Applet at the server board and
the target moves with a different speed on the client board, the mouse
event might miss the target in the replay.
Even worse, the board has no appropriate way to handle time-dependent
states in replay for navigation in time, leading to inconsistencies when the
user uses fast forward or rewind on the replay.
• Applets reading from the network.
When the Applet reads from a network connection, the data read will
usually not be available for the replay. For example the lecturer might
use a chat client Applet, that reads the communication data from a chat
server. The chat server must run on the same server the chat Applet came
from, as the security model of Java does not allow Applets to connect to
different locations. During replay, the chat Applet can only connect to
the side where the board replay came from, and usually there will be no
appropriate chat server.
• User AWT events generated on client side.
The remote user cannot be prevented from interacting with the Applet
in the replay. By having Applets receive both kinds of AWT events, the
lecturer’s recorded events and the input at the client side, the Applet may
easily reach inconsistent states, for example if it keeps track of the mouse
pointer, assuming these is only one mouse while receiving events from two.
Even if the internal logic can cope with the remote users events, it will
not resemble a replay of the Applet’s behavior during recording.
As a summary, replaying Applets in general is a hard problem. Many of
the problems disappear when the reproduction of the AWT events is dropped
and the Applets are more used as an interactive element in the lecture to be
operated by the individual learner. However, this does not fit well to the overall
philosophy of E-Chalk lecture recording, where remote participants should get
the same information as the listeners in the class room.
For these reasons, the handling of Applets in E-Chalk stayed at a very experimental stage.
4.11
Event Storage
4.11.1
Encoding
All board events are concurrently stored to a file named board/events in the
lecture recording directory. Applets and images are referenced indirectly in the
events file and stored in extra directories, see below. An event file is organized
by lines.31 Everything is stored in plain text (ISO Latin-1 encoding). This
makes the events files readable to humans, a great advantage in debugging. On
the other side, this results in higher bandwidth use for transmission than for
a binary representation. In practice, the bandwidth consumed by the board
31 E-Chalk’s event parsers allow any of the platform-dependent end-of-line markers, single
newline, single line feed, or a new line followed by a line feed. The board always saves events
with Unix-style line breaks.
86
CHAPTER 4. BOARD SERVER
is negligible compared to the one used by the audio transmission. As shown
in Table 4.2, real lectures need less than 1 kbps in average. The peaks are in
the range of 3 to 5 kbps, as standard mouse devices generate between 50 and
125 mouse events per second.32 Up to one line segment event is stored per
mouse event. Considering the syntax of a line form event described below, and
assuming x coordinates up to 4095 (hexadecimal F F F ), y offsets with scrolling
less than 64*1024, lecture duration of up to 4.5 h (less than 167 milliseconds),
and Unix-style line breaks (single newline character), a line form event needs
up to 46 bytes.33
Note that for embedded image and Applet resources total bandwidth may
peak higher, although these data are loaded concurrently to the event stream
and thus do not block the board event’s loading.
With the introduction of macros and chalklets, the bandwidth may also peak
higher if no limit for their line events production rate is introduced. For this
reason, the stroke-handling queue currently constraints the chalklet output34 to
a line-event rate of 100 Hz, roughly the same rate as produced by drawing with
a USB mouse. For the same reason, the event rate for a macro is limited to 100
events per second.35
Another approach to keep the bandwidth produced by chalklets low enough
is to change the event format to a more compact representation. The format
should be changed to a binary one with a differential encoding being applied.
The event data will compress very well using a differential encoding, because
it consists largely of long sequences of line segments with its data entries only
slightly changed (position on board) or even identical (color and stroke width).
An additional entropy encoding like gzip can be applied afterwards, except for
live transmission where the events cannot be gathered in packets as they have
to be transmitted without delay. While compression will still not allow for
an unlimited rate of chalklet events, it permits the limit to be relaxed. As a
drawback of using compressed event encoding, the task of providing a repair
tool for damaged event files will become much more difficult, see Section 6.6.
For the text-encoded event file, one may consider to use XML encoding.
The main advantage of using XML is the availability of generic parsers for the
overall structure. Also, one gains a self-documentation of the format with the
DTD for the XML data.
While Java includes XML parsing support since version 1.3, there is no XML
parser in 1.1. Because the events need to be parsed on both the client and server
sides, E-Chalk needs to implement its own event parsing anyway.36 Therefore
32 Serial mice report at a rate of 33 Hz, PS/2 mice default to 40Hz on Win98/ME and to
60 Hz on WinNT/2000, but can sometimes be speeded up to a rate of up to 200 Hz. USB
mice have a default sampling rate of 125 Hz, wireless mice often below that. The data rates
of commercial pen-input devices tested by the author (Numonics IPM whiteboard, Hitachi
StarBoard, different Wacom Tablets) range from 50 Hz to 80 Hz. Specifications for high-end
graphic tablets (Wacom Intous2 and Cintiq) state up to 205 Hz, but in practice rates of about
110 Hz are produced.
33 Logging mouse-move events on Applets may produce even bigger events, as the size depends on the depth of the Applet’s component tree, see below for Applet event formats.
Because Applet support in E-Chalk is rather rudimentary, it is not analyzed here in detail.
34 See Section 4.8.1.
35 Macros are nevertheless able to produce undesirably high data volumes by rapidly loading
images. A mechanism to limit the bandwidth in this scenario still needs to be introduced to
the server board.
36 A parser would be especially difficult to realize for the lecture repair tool described in
4.11. EVENT STORAGE
topic
bubblesort (capsule) [81]
quicksort (capsule) [82]
wavelets [83]
colors [84]
two’s complement [85]
eigenvalues [80]
eigenvalues [87]
eigenvalues [111]
optics [96]
thermodynamics I [97]
disc. Fourier-transformation [6]
polynomial interpolation [7]
surface integrals [98]
stokes’ theorem [99]
87
length
min:sec
12:16
20:51
73:27
71:00
16:43
102:12
103:18
102:51
94:03
91:57
89:24
79:38
99:11
89:23
events
total
/s
8124
8.3
12910 10.3
58661 13.3
38535
9.0
14352 14.3
70039 11.4
52897
8.5
77080 12.5
47334
8.4
42202
7.6
88233 16.5
78190 16.4
90992 15.3
89913 16.8
bytes
total
/s
335297 455.5
528955 422.8
2570274 583.2
1663785 390.6
596287 594.5
2975178 485.2
2244007 362.0
3292172 533.5
1985525 351.9
1829194 331.6
3832611 715.8
3362383 703.7
3978159 668.5
3919085 732.1
Table 4.2: Recorded E-Chalk sessions from courses at Freie Universität Berlin
and at Technische Universität Berlin. Capsules denote short modules recorded
without listeners, the other entries are produced as full lectures held with
E-Chalk. Horizontal lines separate recordings from different authors.
it makes more sense to implement a simple custom format that is both better
readable for humans and simpler to parse by programs. Also, using XML would
introduce a structuring overhead that would noticeably increase the size of the
representation.
4.11.2
Structure
The first five lines form the header of the file, starting with the magic file marker
ec1 in the first line, followed by width and height of the board in decimal ASCII
representation, a line containing the lecture’s title, and finally the background
color. All colors in the event file are stored as hexadecimal α-RGB values, even
though α-values are not yet supported. Any α other than FF (intransparent) is
currently ignored.37
Each of the following lines contains an event, given in the order of creation
time. An event line is separated into tokens by the character $. The first token is
always the timestamp of the event, given in milliseconds relative to the lecture’s
start time. It is saved in hexadecimal formar, like all numerical values in the
event file if not stated otherwise.38 After the timestamp, tokens specify the
type of event, followed by tokens for the event-specific parameters. Any extra
trailing tokens are ignored. In the following events, these optional entries are
only given for the NOP operation, where they are used for commentaries, see
Section 6.6, which then would have to be able to parse files in an erroneous format.
37 Transparency for images is supported, but the color values of images are not saved directly
in the events file, see below on image events.
38 Any usage of decimal numbers is due to historical reasons. Examples are the numbers for
image and Applet resource file and the decimal encoding for board width and height entries
in the header.
88
CHAPTER 4. BOARD SERVER
ec1
680
420
Example Lecture
ff000000
0$Nop$created 03-10-28 14:50:36 GMT+01
ed3$Form$Line$48$2a$48$59$ff00ff00$3
efe$Form$Line$48$59$47$65$ff00ff00$3
[...]
31e9Form$Line$218$117$218$118$ff00ff00$3
4d2e8$Nop$end 03-10-28 14:50:52 GMT+01
4d2e8$Nop$append 03-10-28 15:05:13 GMT+01
5325$Scrollbar$6
5340$Scrollbar$16
[...]
54a5$Scrollbar$13c
6567$Form$Text$$42$19e$ff00ff00$c
6e0c$Text$SetTxt$plot([t,sin(t),t=-Pi..Pi]);
7406$Text$End$plot([t,sin(t),t=-Pi..Pi]);
83b6$Form$Image$0$3e$1a8
908a$Undo
[...]
Listing 4.2: Excerpt from a board event file.
below.
Nop, Scroll, Clear All, Undo, Redo, Terminate
The simplest event is NOP, having no mandatory parameters:
timestamp$Nop{$plain ascii text}
The board creates these at the start and end of a recording as commentary
entries: date and time are stored as a commentary token, as well as the creation
mode (created or appended). See Listing 4.2 for an example.
The events for clearing the whole board, for undo and redo also do not need
any parameters, and scrolling events use the single parameter scrolloffset, the
new vertical offset of the board’s top position:
timestamp$RemoveAll
timestamp$Undo
timestamp$Redo
timestamp$Scrollbar$scrolloffset
The terminate event is exclusively used in live transmissions to signal to a
client the end of transmission, see Section 4.12:
timestamp$Terminate
4.11. EVENT STORAGE
89
Line Segments
A line segment from point (x0 , y0 ) to point (x1 , y1 ) drawn with stroke radius r
in color c has the form:
timestamp$Form$Line$x0 $y0 $x1 $y1 $r$c
with all numbers given in hexadecimal. Again, see Listing 4.2 for an example.
Images
An image added to the board with (x, y) being the position of the upper left
corner is represented as
timestamp$Form$Image$id$x$y
with the image itself is stored in the file images/id.dat in the lecture session
directory. The id parts are created as ascending decimal numbers, but the
event-file parsers do not rely on this.
Applets and Applets Events
An Applet with (x, y) being the position of the upper left corner is represented
as:
timestamp$Form$Applet$id $x$y
with the HTML file containing the definition being stored as applets/id.html.
Again, the file names are created as ascending decimal numbers.
Input events on Applets are also encoded. The event
timestamp$AppletEvent$Mouse$n$id $mod $x$y$clicks$popup{$comp}
encodes a mouse or mouse-motion event for the Applet, internally numbered n.
The integer entry id is the Java event identifier for distinguishing between mouse
pressed, mouse released, mouse moved, etc. and mod is the integer modifier key
mask for Shift, Ctrl, Alt, and/or Meta key down. The values (x, y) give the
position of the mouse event in its triggering component, clicks is the click count
for this event, for example for identifying double clicks, and popup is true or
false, marking the mouse event as a pop-up trigger on the platform where
the event was created.39 The originating component is encoded by a trailing
list of indices: the sequence n0 $. . .$nk−1 $nk means the event is on the nk th
subcomponent of the nk−1 th subcomponent etc. of the n0 th subcomponent of
the Applet.40 If the list is empty, the mouse event is on the Applet itself.
Action events and key events have the form
timestamp$AppletEvent$Action$n$id $actionname$mod{$comp}
timestamp$AppletEvent$Key$n$id $keycode$mod{$comp}
39 The pop-up-triggering mouse event is platform-dependent. For example, on Mac OS X,
the pop-up menus are triggered by the mouse button being pressed down, on Windows on the
mouse button being released.
40 To identify the event component, the client relies on the subcomponent enumerating
methods returning the elements in the same order. As the Java API does not specify this
order, it may differ among different Java environments, even though this has not been observed
in tests of E-Chalk so far.
90
CHAPTER 4. BOARD SERVER
with n, id, mod, and component sequence given, the same as for mouse events.
The entry actionname is the command string associated with the action event,
keycode is the integer key code of the key typed, pressed, or released with the
event.
Text and Text Input
The event for creating a new text form takes the following arguments: string,
its initial value; (x, y), the inital baseline position for the text; c, the text color;
and size, the font size. The event is defined by
timestamp$Form$Text$string$x$y$c$size
where the string is MIME-encoded to ensure encoding-independent representation. As long as the text is in edit mode, it features a text-input cursor and
accepts editing changes from the user. The text-creating event positions the
cursor at the end of the text. When the user presses the enter key, the text
form is closed by a
timestamp$Text$End$string
event and the cursor is removed. The string text stored in the event is the
MIME-encoded final content of the text form including any line breaks from the
board’s dynamic line breaking. The client board does not need this information
for replay, but it is used by the PDF converter. With this extra field, the PDF
converter does not have to recalculate the text layout from the automatic line
breaking done by the board.
A text is also automatically closed when a new Form is created. or when an
Undo event happens. This means there can never be more than one TextForm
receiving key input.
A key input of the printable character c for an open TextForm is represented
as
timestamp$Text$Char$c
with c being MIME-encoded. Some control characters, backspace and delete,
and the cursor-moving left and right arrow keys have their own events:
timestamp$Text$Backspace
timestamp$Text$Delete
timestamp$Text$Left
timestamp$Text$Right
When the user sets the whole text content using the text history (with the up
and down arrow keys), the event
timestamp$Text$SetTxt$string
is used to set the TextForm’s content to the content of the MIME-encoded
string. For pasting from the clipboard, a string is inserted at the current cursor
position. The event
timestamp$Text$Str$string
4.12. LIVE SERVER
91
with the MIME-encoded string is used. Finally, for bringing the cursor to the
beginning of the text with the home key or to the end with the end key, the
event
timestamp$Text$Cursor$idx
allows to move the cursor to an arbitrary character index idx.
4.12
Live Server
The board’s live server thread listens at the TCP server socket for incoming connections. When a client connects, a connection thread is spawned for the client
and the offset to the board’s initial time index (the offset to event timestamp
0) is sent as hexadecimal ASCII followed by a newline. This enables the clientboard Applet to synchronize its timing with the server-board timestamps. Then
the current content of the event file is flushed over the socket connection. The
connection is maintained until the server or the client terminates. Whenever a
new event is created on the board, is it sent over to all open client connections.
For a description of the client side, see Section 7.2. When the board session
ends, it sends clients a single terminate event, see Section 4.11.2.
92
CHAPTER 4. BOARD SERVER
Chapter 5
Audio and Video Servers
5.1
The WWR Audio Server
The audio subsystem used for E-Chalk is a pure Java successor of the World
Wide Radio (WWR) system [FL98] [109], initially named WWR2 [Man99],
with the change to a new audio format renamed WWR3. The system is a
TCP/IP-based audio streaming system, that uses lossy compression to achieve
interruption-free transmission over small-bandwidth Internet connections. In
order to guarantee continuous playing, sound data have to be buffered, creating
a small delay between recording and playback, see Section 7.3.
5.1.1
Server Architecture
The WWR3 streaming server is modeled as a flow graph, see Figure 5.1 for
an example. The graph consists of five basic types of nodes: Sources, Targets,
Forks, Mixers, and Pipes. Technically, any component that wants to live inside
the graph becomes a node by inheriting one of these five superclasses.1 The
graph that connects these components to a directed graph is specified by an
XML file. Nodes are described via general properties, for example, to make the
system select a certain audio codec that compresses down to a certain bandwidth. The system then searches for an appropriate codec, first locally and then
in the Internet.
The structure of the graph can be changed and the nodes can be updated
while the system is running. All data are synchronized automatically. This
allows clients to trigger the server to be updated on the fly to match their
requirements, instead of forcing the client to load an updated module. For
example, nodes exists for both WWR and Windows Media Player. The system
can be configured to load the appropriate modules when a client connects with
either Windows Media Player or with the Java-based client for a live connection.
The nodes of the flow graph are realized as components of the SOPA (selforganizing processing and streaming architecture) framework [FP04]. SOPA
is built on top of the OSGi [71] (open services gateway initiative) standard, a
mechanism originally coming from the field of ubiquitous computing. It specifies
1 This task requires a developer to overwrite up to ten methods for building a wrapper to
a streaming service one wants to integrate.
93
94
CHAPTER 5. AUDIO AND VIDEO SERVERS
Figure 5.1: A simple audio streaming server graph.
how to load, update, and delete software components from the Internet while
a system is running [OSG02, HC04a]. SOPA uses the Oscar OSGi implementation [HC04b] [70].
5.1.2
Audio Codecs
WWR2 Codecs
Current browsers often only have a Java environment of Java version 1.1 preinstalled. In such environments, Java Applets cannot play back sound with a
sampling frequency higher than 8999 Hz [38]. Hence, the basic input format
chosen for WWR2 was 8 kHz, 8 bit µ-law mono (as defined in [Int88]), the
format used for digital telephone lines. It requires a connection speed of 64 kbps.
Several codecs for different bandwidth, CPU speeds, and audio-quality levels
were integrated into WWR2 by modifying older compression standards.
WWR2 contains a simple and fast 50 kbps codec, which uses no compression
but the Java’s built-in gzip algorithm. To achieve better compression, WWR2
also contains the 4-bit version of the µ-law codec, which is adapted from [Int88].
This codec, together with gzip, compresses down to 20 kbps. To achieve a good
trade-off between sound quality, compression, and execution speed, the ITU
ADPCM [Int90] was modified. The result were 4-bit, 3-bit and 2-bit modified
ADPCM codecs that, combined with gzip, give an effective average compression
of 30 kbps, 22 kbps, and 15 kbps.
WWR3 Codecs
In order to improve the sound experience for remote users with Java plug-ins
installed in browsers supporting 16 kHz (Java 1.3 or later), the WWR3 audio
format uses 16 bit, 16 kHz linear mono audio stream. This can also be played
directly, if the browser uses Java 1.3 or later. In Java environments that only
support 1.2 or earlier, the audio client converts the data to 8 bit, 8 kHz µ-law
to replay them. By this means, all Java-enabled browsers can play back the
stream while users with a more recent Java version can enjoy the audio at a
higher quality.
The higher sampling rate increases the amount of data. WWR3 codecs
have been implemented for 32 kbps, 48 kbps, 64 kbps, and 128 kbps, with the
numbers designating the maximum bandwidths needed. However, the format
change was accompanied with the introduction into the recording system of
filtering techniques2 that drastically reduced the amount of recorded noise. In
2 See
Section 5.2 for a description.
5.2. SMART AUDIO RECORDING
95
Figure 5.2: The steps of the audio profile wizard.
practice, the required bandwidth is much lower, as the cleaner signal compresses
significantly better, see part on filtering techniques in Section 5.2.4.
5.2
Smart Audio Recording
As described in Section 8.4.2, the audio quality in replay was the most important
weakness of the E-Chalk system according to user evaluations. This caused the
change from WWR2 to WWR 3 format, but a much greater impact can be
achieved by ensuring the quality of the recorded signal before encoding.
Although often advertised, most current audio recording systems cannot
yield professional quality recordings just by plugging a microphone into a sound
card and starting the lecture. Good-quality recordings require full-time technicians to set up and monitor the signals, or expensive professional-grade equipment, or both. The idea was to replace the technicians and the specialized
hardware by self-controlling software components as far as possible [FKT04].
It is important that the system relieve the user of the technical setup details.
Currently, the audio technology is not easily usable for a layperson:
[...] generally the networking and video setup was fairly simple, but
audio setup and operation was cumbersome. We had continual problems with audio levels, microphone placement, mixer setups, feedback
etc. Following the audio path from a microphone to remote speaker
it turns out that there were many (eight or nine) points where audio
gain could be adjusted. This, and the fact that the microphones were
frequently mispositioned, caused many difficulties in establishing stable and comfortable audio levels. [Tsi99]
5.2.1
Sources of Interference
Unfortunately, there are many potential audio distortion sources in lecture halls
and classrooms. Those with the greatest impact on the recording will be mentioned here. For a more detailed discussion of these problems see for example [Dic97, Kat02].
Any room is filled with multiple sources of noise: Students are murmuring,
doors slam, cellular phones ring. Reverberation effects depend on the geometry
of the room and on the amount of occupied seats. Professional speakers are
trained to keep their voice up at a constant level, but lecturers rarely do so.
When the audience get less quiet at the end of a lecture, teachers unconsciously
raise their voice with negative effects to the recording quality if the signal is
96
CHAPTER 5. AUDIO AND VIDEO SERVERS
Figure 5.3: Soundcard ports are scanned for input devices.
not leveled out. Even movements of the lecturer can create noise. Coughs
and sneezes, both of the audience and the speaker, result in irritating sounds.
Additional noise can be introduced by the sound equipment: Hard disks and
fans in the recording computer produce noise, cables can cause electromagnetic
interference that results in noise or humming. Feedback loops can also be a
problem if the voice is amplified for the audience.
The lecturer’s attention is entirely focused on the presentation so that technical problems like just forgetting to switch the microphone on are easily overlooked. Weak batteries in the microphone cause a drastic reduction in the
signal-to-noise ratio, often without the speaker noticing. Many people also
have problems with the operating system’s mixer. It differs from sound card
to sound card, and from operating system to operating system and usually has
many knobs and sliders with potentially wrong settings. Selecting the right port
and adjusting mixer settings can take even experienced users minutes.
Another subject is equipment quality. Some sound cards cannot deliver highfidelity audio recordings. In fact, most sound cards focus on sound playback
but not on sound recording. Games and multimedia playback are their most
important applications. On-board sound cards, especially those in laptops, often
have very limited recording capabilities.
The quality loss introduced by modern software codecs is perceptually negligible compared to the problems described above. Improving audio recording
for lectures held in lecture halls means first and foremost improving the quality
of the input signal before it is processed by the codec. Having audio technicians
and professional-grade hardware dealing with these problems is no feasible solution for our scenarios due to their high costs.
5.2.2
Enhancing Recordings
The approach taken by E-Chalk focuses on the special case of lecture recording.
The system relies on the lecturer using some kind of directional microphone or
a headset. Both eliminate the influence of room geometry and of cocktail-party
noise [Hay03]. Headsets provide good quality but they may restrict the mobility
of the speaker.
A lecture recording system like E-Chalk has the advantage that information
5.2. SMART AUDIO RECORDING
97
Figure 5.4: A report gives a rough estimation of the quality of the equipment.
Speech intelligibility is calculated according to IEC 268.
about speaker and equipment are accessible in advance. Using this fact divides
the approach into two parts:
• An expert system presented via a GUI wizard guides the user through a
systematic setup and analyzes the recording equipment and the speaker’s
voice. This information is stored for the later recording phase. The wizard
assists users in assessing the quality of the audio equipment and makes
them aware of the equipment’s influence on the recording.
• During recording, filters, hardware monitors, and automatic gain control work with the information collected by the expert system. Classic recording-studio equipment like graphical equalizers, noise gates, and
compressors are simulated and automatically operated.
5.2.3
Setup
Before lectures are recorded, the user creates a so-called audio profile. It represents a fingerprint of the interplay of sound card, equipment and speaker. The
profile is recorded using a multi-step wizard that guides the user through several steps, see Figure 5.2. This setup takes about three minutes and has to be
done once per speaker and sound equipment. Each speaker uses their own audio
profile for all recordings.
The setup screen asks to assemble the hardware as it is to be used in the
lecture recording. The wizard detects the sound card and its mixing capabilities,
see Figure 5.3. Using the operating system’s mixer API, the sound card’s input
ports are scanned to find plugged-in recording devices. This is done by briefly
reading from each port with gain set to maximum, while all other input lines are
muted. The line with the highest noise level is assumed to be the input source.
If noise level differences are below a certain threshold, the user is required to
select the line manually. With a single source plugged in, this occurs only with
digital input lines because they produce no background noise. At this stage,
several hardware errors can also be detected, for example if noise is constantly
at zero decibel there must be a short-circuit.
98
CHAPTER 5. AUDIO AND VIDEO SERVERS
Figure 5.5: The chain of the audio signal during recording.
The audio system analyzer takes control over the sound card mixer. There
is no need for the user to deal with the operating system’s mixer.
The next step is to record the sound card background noise. The user is
asked to remove any input device from the sound card.3 A few seconds of noise
are recorded. The signal is analyzed to detect possible hardware problems or
handling errors. For example, overflows or critical noise levels result in descriptive warnings.
After recording sound card noise level, the user is asked to replug and switch
on the sound equipment. Again, several seconds of “silence” are recorded and
analyzed. Comparing this signal to the previous recording exposes several handling and hardware errors. For example, a recording device plugged into the
wrong input line is easily detected.
After having recorded background noise, the user is asked to record phrases
with special properties. The phrase choice is language-dependent. A phrase
containing many plosives is used to determine the range of gain.4 This measurement of the signal dynamics is used to adjust the automatic gain control.
By adjusting sound card mixer input gain at the current port, the gain control
levels out the signal. The average signal level should be maximized, but overflows must be avoided. If too many overflows are detected, or if the average
signal is too low, the user is given a choice of possible improvements.
During the frequency test, a sentence containing several sibilants is recorded
to figure out the upper-bound frequency. The system looks at the frequency
spectrum to warn the user about equipment anomalies.
The final recording serves as the basis for a simulation. The user is asked to
record a typical start of a lecture. The recording is filtered5 , compressed, and
uncompressed again. Users can listen to their voice exactly as it will sound in
the recording. If necessary, an equalizer allows experienced users to further finetune the frequency spectrum manually.6 The time for filtering and compressing
is measured. If this process takes too long, it is very likely that audio packets
are lost during real recording due to a slow computer.
At the end of the simulation process, a report will be displayed, as shown
in Figure 5.4. The report summarizes the most important measurements and
grades sound card, equipment, and signal quality into the categories excellent,
good, sufficient, scant, and inapplicable. The sound card is graded using back3 On notebook computers this is not always possible, because built-in microphones cannot
always be switched off. The wizard then adjusts its analysis process.
4 In English, repeating the word “coffeepot” gives good results.
5 The filters applied are described in Section 5.2.4.
6 This might be assisted by supplying equalizer presets for different pitches of voice like
bass and tenor, and by automatically preselecting the preset fits best.
5.2. SMART AUDIO RECORDING
99
Figure 5.6: Without (above) and with (below) mixer control. The speech signal
is expanded and the cough is leveled out.
ground noise and the card’s DC offset7 is calculated from the recordings. Grading the equipment is based on background noise recordings and frequency shape.
This is only a rough grading, assisting non-expert users to judge the equipment
and identify quality bottlenecks. Further testing would require the user to work
with loop-back cables, frequency generators, and/or measurement instruments.
Among other information, the created profile contains all mixer settings, the
equalizer settings, the recording, and the sound card’s identification.
5.2.4
During Recording
For recording, the system relies on the equipment profile. If changes are detected, for example a different sound card, the system will display a warning at
start up. Figure 5.5 illustrates the signal-processing chain.
The mixer settings saved in the profile are used to initialize the sound card
mixer. The mixer monitor will display a warning if it detects a change in the
hardware configuration, such as using a different input jack. It supervises the
input gain in combination with the mixer control.
The mixer control uses the values of the dynamic test to level out the input
gain using the sound cards mixer.8 This makes it possible to level out voiceintensity variations. Coughs and sneezes, for example, are leveled out, see for
example Figure 5.6. Note that the success of this method depends on the quality
of the sound card’s analog mixer channels. Sound cards with high-quality analog
front panels, however, are becoming cheaper and more popular.
Mixer control reduces the risk of having feedback loops. Whenever a feedback loop starts to grow, the gain is lowered. As in analog compressors used
in recording studios, the signal-to-noise ratio is lowered. For this reason, noise
filters are required.
To reduce noise, the DC offset of the signal is removed, the sound card background noise level recorded in the profile is used as a threshold for a noise gate,
and the equipment noise is taken as a noise fingerprint. The fingerprint phase
is aligned with the recorded signal and subtracted in frequency space. This
7 High
DC offset implies low quality of the card’s analog-to-digital converter.
analog pre-amplifiers of the mixer channels thus work like expander-compressorlimiter components used in recording studios.
8 The
100
CHAPTER 5. AUDIO AND VIDEO SERVERS
Figure 5.7: Three seconds of a speech signal with a 100 Hz sine-like humming
before (light gray) and after filtering (dark gray).
removes any humming caused by electrical interference. Because the frequency
and shape of the humming might change during a lecture9 , multiple noise fingerprints can be specified. The best match is subtracted [Bol79]. See Figure 5.7
for an example. It is not always possible to pre-record the humming, but if so,
this method is superior to using electrical filters, which have to be fine tuned for
a specific frequency range and often remove signal data more than is desirable.
Finally, Equalizer settings are applied before the normalized signal is processed by the codec.
As noted above, filtering also results in more efficient compression. Because
noise and overflows are reduced, entropy also scales down and the compression
can achieve better results.
In addition to controlling the signal for recording, the system checks the
signal from the soundcard for the floor noise of the microphone. If the floor
noise becomes significantly lower than expected according to the audio profile,
it is likely that a problem occurred. Batteries of a wireless microphone may
be running low, or the plug might been accidently pulled from the soundcard,
or the lecturer might simply have forgotten to switch the microphone on. The
system warns the lecturer by displaying a warning dialog, see Figure 5.8.
Of course, if the quality of the recording equipment (microphone and soundcard) is too low, even enhanced recording will not be enjoyable for the listener.
However, first experiences [FKST04,FJK04b] showed that the system produced
good quality when used with good amateur or semi-professional-grade equipment, which can be employed at significantly lower cost than professional audio
equipment and audio technicians. In addition, the system’s wizard already assisted a number of users in analyzing their audio hardware for shortcomings.
5.3
The WWV Video Server
The video subsystem called World Wide Video (WWV) was designed as an
Internet streaming system that runs on any hardware or platform, just like
WWR2/3. Explicitly included are small computers, such as handhelds or mobile phones. Since video data processing is more expensive than audio data
processing, it was decided to create an asymmetric system. It was assumed that
the server side has more computational performance at hand than the replaying
client.
The bandwidth requirements for high-quality video are much higher than
9A
typical situation that changes humming is when the light is turned on or off.
5.3. THE WWV VIDEO SERVER
101
Figure 5.8: The microphone floor noise level has sunk – batteries have to be
changed.
for board or audio data, while the value as information channel is much lower.10
Therefore, the E-Chalk system opted for a low-quality, low-bandwidth solution.
When the first version of WWV was developed, no method to capture video
data in pure Java was available [FKR02]. Instead, native interfaces of the
video hardware device were used, under Linux relying on Video4Linux 2 [101]
and under Windows interfacing to Microsoft’s DirectX 8.0a [62]. For efficiency
reasons, the encoder was also realized as a native implementation. Recently, the
WWV implementation became pure Java, utilizing the Java Media Framework
(JMF) [44] to access video data.
Like the WWR3 audio server, the new video server has been developed within
the SOPA component architecture described in Section 5.1.1. On startup of the
server, the system creates a flow graph with video handling SOPA components
as graph nodes from a graph description given as an XML file. Among other advantages, this keeps down development efforts to integrate new filters or support
other output formats.11
For a description of the buffering strategy used in the WWV client, see
Section 7.4.
Codec
The video stream is encoded by a very simple differential frame coder. The first
frame recorded or sent when a client connects is an I-Frame (a full image). All
subsequent frames are difference frames. The frames are divided into blocks of
8×8 pixels and only blocks that changed significantly are stored.
The change is measured as a sum of the Euclidean distances of all pixels
10 From the very beginning of E-Chalk, the system focussed on transmitting the information
by board content and voice stream. This philosophy is backed by experiences from other
projects: the lecturer’s voice stream is reported to be the most important information channel
for learners [BGL96, EGE97], followed by the whiteboard/blackboard/slide stream [MO02],
with the video stream of the lecturer mainly being of interest to create a sort of social context.
11 The current implementation of the WWV server can already produce non-E-Chalk formats, for example QuickTime video.
102
CHAPTER 5. AUDIO AND VIDEO SERVERS
Figure 5.9: Semi-transparent instructor over board image (montage).
in the YUV color space, with the Y component given a higher weight. The
relevant blocks are encoded in JPEG format.12 Decoding is easily manageable
in the Java Applet, because the JPEG decoder is available in standard libraries
even for older JVMs.
In the teaching situation recorded for E-Chalk purposes, where only a small
area of the picture has to be updated (mainly due to gestures and mimics of
the lecturer), this very simple compression performs very well. The compression
ratio obtained in experiments is roughly 40:1. In recordings with the E-Chalk
system, a video resolution of 192×144 (quarter NTSC) and 4 frames per second
was the standard setup to obtain a bandwidth of 64 kbps.
5.4
Video and Board Image Combined
E-Chalk lectures which include a video of the instructor share a psychological problem with conventional distance lectures consisting of slides plus video
stream. Although every human being has only one locus of attention [Baa88,
Ras00]13 , the attention of the remote student is led to two areas of the screen:
the video window and the board or slides area. Hence it was tried to separate
the video image of the lecturer from the background. The image of the instructor can then be laid over the board, creating the impression that the lecturer is
working directly on the screen of the remote student. Mimics and gestures of
the instructor would appearing in direct relation to the board content. Ideally,
the image of the lecturer can be made semi-transparent or even turned off, as
illustrated in Figure 5.9.
The first approach to separate the lecturer’s image from the background used
an observation from the WWV video encoding: blocks stored in the difference
frames almost always contained the lecturer’s image. Changes in board content
rarely result in differences the encoder rates as significant. However, the difference frames seldom contained the complete image of the instructor, and parts of
the background might be briefly obscured by a moving lecturer only to appear
again later. To compensate for these effects, the background was “learned” by
storing repeated (similar) blocks into a block cache with a least-recently-used
12 Strictly speaking, the term “JPEG format” is incorrect. The right term should be JFIF
(JPEG file interchange format), whereas the specification can be found in [ISO92]. However,
the term “JPEG format” is used more commonly.
13 Some results from research on spatial attention suggest that it is actually possible to
attend to two spatial locations simultaneously under certain circumstances [HK98, BCP99].
The model of assuming only a single locus may be simplistic, but concerning its application
in user-interface design, it is preferred for practical purposes.
5.4. VIDEO AND BOARD IMAGE COMBINED
103
Figure 5.10: Screenshot of the experimental version for cutting out the lecturer.
The video is already shown over an board image, but the lecturer’s image is not
yet correctly aligned with the board drawings.
strategy, keeping track of the number of recurrences. Those blocks with a high
appearance count are likely to belong to the background, others are considered
foreground blocks, i. e. the lecturer. For details, see [JFR04].
This algorithm is currently refined by combining the initial strategy with
other strategies for classifying between background and lecturer, for example by
looking at the color histograms of the blocks and by using edge-detection filters.
Figure 5.10 shows an example result. Note that these approaches do not yet
take any advantage of information about the board content in the background,
which is available from the E-Chalk board or alternatively by taking screen
snapshots.
104
CHAPTER 5. AUDIO AND VIDEO SERVERS
Chapter 6
Tools, Converters, Add-ons
This chapter describes a number of sub-components and stand-alone tools of the
E-Chalk systems. These include converters for the E-Chalk formats, E-Chalk
components implementing E-Chalk API classes like the Launchable interface1
and board Chalklets2 , as well as stand-alone tools for working on recorded
lectures. Unless explicitly stated otherwise, stand-alone tools are realized as
Java applications.
6.1
Export to PDF
As mentioned in Section 2.5, the E-Chalk system can automatically produce
a transcript of a board recording as an Adobe PDF file. The board-to-PDF
converter echalk.tools.pdf.Board2PDF is called as a Launchable from the
main E-Chalk application, but it can be also used as a stand-alone application.
In a first phase the board data from a given lecture are parsed by the converter to get the board image as it looks like at the end of the lecture. Invisible
actions, like scroll events and drawings removed with undo, are ignored, all other
board elements are kept in memory.
For line strokes, the first phase also drops inner points which are collinear
with their neighbors, as they are not needed in statically painting pages. For
example, connecting the sequence of points (0, 0), (1, 0), (7, 0), (8, 0), (8, 1) will
result in the same image as the sequence (0, 0), (8, 0), (8, 1). E-Chalk recordings
store each point delivered by the mouse driver during drawing actions. Because
mouse drivers often deliver points faster than users change drawing directions,
omitting the redundant points results in a considerable data reduction. In practice, the stroke points are reduced by a factor of two or three.
For obvious reasons, it is not possible to directly include an interactive Applet into the PDF. Instead, they are represented as an image with an Applet
symbol.3
In the second phase, page breaks are determined, and in the final phase the
actual PDF representation is constructed and written. An early implementation
1 Launchable
and its sub-interface Progressible are described in Section 3.10.1.
Section 4.6.4 for implementation details of Chalklets and associated classes.
3 In fact, the PDF converter looks for a saved snapshot image of the Applet to include.
When no such snapshot is found, it uses a standard Applet icon to mark the Applet’s place.
However, the implementation of the server-side board does not store such snapshots yet.
2 See
105
106
CHAPTER 6. TOOLS, CONVERTERS, ADD-ONS
knipping@localhost> java echalk.tools.pdf.Board2PDF
usage>
java echalk.tools.pdf.Board2PDF [<key>=<val>...] <lecture dir>
Recognized standart keys and their values:
pdf.conf
<filename>
pdf.media
a[0-6]|letter|halfletter|legal|note|ledger|11*17
pdf.portrait true|false
pdf.bw
true|false
pdf.bg2white true|false
pdf.outlines true|false
pdf.outfile <filename> (relative to <lecture dir>/pdf/)
Key-value pairs
pdf.grabjfifs
pdf.grabgifs
pdf.bin2ascii85
pdf.noflate
echalk.debug
for debugging purposes:
true|false
true|false
true|false
true|false
true|false
Listing 6.1: The board-to-PDF converter program prints a summary when called
without arguments.
simply split the data into pages at fixed offsets. The distribution of page breaks
has depended only on the PDF output paper format, not on the content. The
present algorithm uses a greedy strategy. It tries to place the next break as
a horizontal cut with as much content as possible put onto the page while no
visible4 board element is being cut. If no such page break is found which uses
at least the upper two thirds of the page for content, and a kind of minimal cut
is searched for in the lower third of the page. This is realized by computing the
amount of “ink” weight of the content by the vertical coordinate. Each visible
elementary drawing (a line segment, an image, a typed text) adds its width to
the y-interval of its vertical extension. A weighted partition is generated of the
y-interval [0, ∞[, represented as a list of weighted intervals.5 The weight of each
interval is a measure of how much board content is cut by a horizontal page
break which lies in the interval. The weight gives only an approximation, as
overdrawings and the rounded caps and joints of line strokes are not taken into
account, but in most cases this is sufficient to get pleasing page breaks.
Board content where horizontal cuts as breaks are not adequate due to written lines overlapping vertically cannot be handled well by this method, see for
example Figure 6.1. A possible strategy to solve this would be to construct a
graph of board elements as nodes and edges between touching elements. Pages
are generated by distributing the elements on the pages so that elements of a
4 Drawings in the board background color, like eraser actions, do not prevent the page
break.
5 While the insertion of the weighted interval may take quadratic run time in the worst case,
the implementation used in the converter runs in near linear time for real world lecture data.
It uses the fact that almost all board elements have only a small y-offset from the previously
generated element. Using the previous insertion position as start position for searching the
next position results in a drastic speedup.
6.1. EXPORT TO PDF
107
Figure 6.1: Handwritten lines that contain vertical overlay, either due to a
sloped baseline or to high ascents or low descents running into neighboring
lines, prevent straightforward page breaks using horizontal demarcation lines.
Descender lines are plotted in light gray.
connected graph component appear on the same page whenever possible.
6.1.1
PDF Structure
A PDF is organized as a tree of objects. The main element to organize the
document is the PageTree. A PageTree contains Pages objects, which list
other Pages and/or Page objects. A Page has a list of objects specifying the
actual content of the page. All PDF objects are numbered and used in other
objects by this reference. The trailer of a PDF file contains a table that maps
object references to their byte address in the file. See [Ado03] for details.
The PDF converter outputs a flat hierarchy of PDF objects that keeps the
number of objects low. This makes the resulting PDF smaller as the overhead
for defining objects is reduced. It also speeds up the process of loading and
rendering a PDF. Only a single Pages list is used and each Page has only a
single content object.6
The content part consists of basic PDF drawing commands, like line strokes,
text drawings, included images, and changes to the current graphic state, like
setting stroke width and paint color. The Portable Document Format allows
to compress content data7 with a range of compression filters, including runlength-encoding (RLE), LZW [ZL78,Wel84], and flate compression [ZL77,DG96,
Deu96]. The PDF converter program uses flate compression8 on the page content data, except for content objects where this does not save storage space.
This is true only for very small content objects, where the compression specifi6 There may be a few extra objects for images and text: images are referenced indirectly in
the page contents and the image data representation may be split into several PDF objects,
for example a separate object for a color table. If the PDF contains text, the font must also
be included as a PDF object, but in the converter’s output a single font object is shared by
all pages.
7 To be more exact, PDF stream data of PDF objects may be compressed.
8 The compression factor achieved with flate is usually slightly superior to LZW and much
better than RLE. Also, LZW encoding was still protected by patents when the converter
application was developed. The US patent [Wel83] owned by Unisys expired on June 20, 2003,
and the counterpart patents in the United Kingdom, France, Germany, and Italy expired on
June 18, 2004. The Japanese counterpart patents expired on June 20, 2004, and the Canadian
counterpart patent expired on July 7, 2004. See [100]. IBM also holds a US patent [MW83]
with claims to LZW, that will expire on August 11, 2006.
108
CHAPTER 6. TOOLS, CONVERTERS, ADD-ONS
Figure 6.2: Full GIF image (top left), truncated non-interlaced image (top
right), truncated interlaced image (bottom left), and reconstruction of this interlaced image (bottom right). Original image from the libungif [53] package,
version 4.1.0.
cation overhead of about 20 bytes is bigger than the gain from the compression.
Note that compression can be more effective having all the data of a page in a
single content object. This way, all of it can be compressed together instead of
compressing several chunks individually.
6.1.2
Images
Accessing pixel data by the Java image rendering mechanism is used as a generic
method for getting the PDF representation of an image included in a board
lecture. The image file is loaded as a java.awt.Image, and a java.awt.image.PixelGrabber is applied. The converter then tries to get a more compact
representation of these data. If the image contains 256 colors or less, a colorlookup table is used. The image data are compressed using flate if this reduces
the amount of data. If a color table exists, it is also flate-encoded. Transparent
color can also be handled in the PDF converter, as PDF allows to mark color
entries as transparent.9 Semi-transparency, a feature supported by PNG files,
cannot be represented in current PDF versions. Even full transparency is not
supported by all printer drivers. For example on PostScript printers, PostScript
level 3 must be supported for transparency being available.
For GIF and JPEG data, the converter uses faster methods by directly
parsing these formats. Still, the pixel-grabbing method serves to handle other
formats and as a fall-back, for example for damaged JPEG files, see below. At
the time being, the only image format used in E-Chalk recordings that is not
directly parsed is PNG.10
JPEG Parsing
The encoded image data from JPEG images can be directly included in a PDF
image object, as the JPEG decoding is supported by PDF. This is not only
much faster than the pixel-grabbing method, it also returns smaller PDF files
9 The
mechanism is called mask images by color in PDFs.
are not used in E-Chalk with the default setup, see Section 2.4. Still, the direct
parsing of PNG files in the PDF converter is a desirable future extension.
10 PNGs
6.1. EXPORT TO PDF
109
Figure 6.3: Examples of outlined strokes and text element from a PDF transcript.
because the raw pixel data of the DCT encoded JPEG images do not compress
well with flate encoding.
Still parts of the JPEG data must be parsed by the converter for two reasons.
First, even though the image dimension and color space (like RGB or gray scale)
is given in the inline JPEG data, the information must also be stored in extra
fields of the PDF image objects. Second, inserting corrupted JPEG image data,
like for example from a truncated file, corrupts the whole PDF document; standard PDF viewers do not display such PDFs. For these reasons, the converter
scans the JPEG data for dimensions and color space and checks the integrity of
the image. If the image is damaged, the pixel-grabbing method described above
is used as a fall-back mechanism, as the Java rendering mechanism can also
handle truncated files, filling in the unknown portions with a background color.
If the data are damaged so badly that even the pixel-grabbing method fails, the
image is omitted from the PDF. In this case, it did not appear on the board
anyway, because the board relies on the Java image rendering mechanism, too.
GIF Parsing
For GIF images, the complete data are parsed by the converter. Its colorlookup table is extracted, and the LZW encoded-data are decoded11 to be flateencoded in the PDF image object. As mentioned above, the flate encoding
usually compresses slightly better than LZW. Transparent colors are handled
in GIF data. If the GIF is a multiple image file, only the first one is used for
the PDF, like it was on the board. If the image data is truncated, the rest of
the image is reconstructed as far as possible: if the GIF image uses interlacing,
the empty pixels are copied from neighboring rows, see Figure 6.2. For noninterlaced images, the data are filled with transparent color, if that is available
from the color table, or with the background color defined in the GIF data.
See [Com87, Com90] for details on the Graphic Interchange Format.
6.1.3
Color Conversions
The main application of the PDFs is printing. When the board’s background
color was not set to white, using the original background color would use a lot of
printer toner. For this reason, the background color in the PDF version is set to
white by default. In an older version of the PDF converter, background color and
white were simply exchanged. The drawback of this method is that it does not
preserve the contrast between drawings and background. For example, yellow
11 As mentioned above, Unisys patented the LZW algorithm. However, decoding data with
LZW was always considered free of charge by Unisys. Only software that encoded was subject
to patent fees.
110
CHAPTER 6. TOOLS, CONVERTERS, ADD-ONS
Figure 6.4: For images with transparency, the outline border for the intransparent parts is computed.
Figure 6.5: An erasure stroke crossing a regular stroke interferes with the outline.
writing has good contrast against a black background, but are hard to read
against white. Also, drawings on images may be lost, for example if black board
drawings on white image parts are used with a black board background. Trying
to solve this by converting the background color in images is not recommendable,
as this often destroys the image impression and is difficult to handle properly
on colors which are similar, but not the same, like shades of white.
In the current version, a black outline for all visible board elements is added12
when the background color is changed to white. For line strokes and texts this
is realized by drawing these elements, slightly fattened and turned to black,
below the colored elements. See Figure 6.3 for an example. For images, their
outline has to be computed, as transparency is to be handled, see Figure 6.4 for
an example.
A drawback of this method is that erasure marks crossing normal drawings
are not handled well, as illustrated in Figure 6.5. Unfortunately, there is no way
to handle this without the converter computing the rendered page.
Because the PDF version is often printed in black and white, the PDF converter supports creation of grayscale PDFs. Here, outlining board elements is
not necessary. Instead, all visible line drawings and text elements are created
in black. Images are converted to grayscale. A possible improvement would be
to use grayscale colors for the drawings with gray values corresponding to the
contrast of the original color to the background.
6.2
Export for Replay in Windows Media Player
To allow recorded lectures to be displayed in the Windows Media Player, a
Windows command-line converter to ASF13 was implemented in Visual C. The
E-Chalk audio data is encoded as WMA (Windows Media Audio) in the ASF
12 This is the default behavior now when the background color is changed. The old method is
still available through the E-Chalk settings or from the converter’s command-line parameters.
Background color conversion can also be suppressed. See Listing 6.1.
13 ASF is the acronym for Advanced Streaming Format, later renamed in Advanced Systems
Format from the Windows Media framework. It is a general wrapper format for multimedia
data, allowing arbitrary codecs to be used for its contents.
6.3. EXPORT TO QUICKTIME AND AVI VIDEO
111
Figure 6.6: A recording converted to ASF replayed with Windows Media Player
using a DirectShow plug-in.
file. The board data is stored as the timestamped vector data given by the
original board events. This avoids huge bandwidth and blurring of sharp edges
in the board image that would result from generating a standard video stream
format based on DCT compression. On the other hand, this introduces the
need for installing a DirectShow plug-in for Windows Media Player, enabling
it to decode the events for video playback. See Figure 6.6 for an example of a
replay.
The implementation of the decoder plug-in can handle the most frequently
used board events: line drawings, pasted images, scrolls. Also, text events
are partially handled: typed text is supported, but the dynamic line breaking
provided by the board14 is missing, as well as handling of cursor movements
and backspace and delete. Clear-all requests, Applets, and undo/redo events
are not implemented either.
While this approach requires the user to install a plug-in, it has the advantage
of preserving the lossless representation of the board stream and thus enjoying
the advantages of clear board drawings with low storage space requirements.
For encoding the audio stream, the standard encoders from the Windows
Media API can be selected. However, decoding the E-Chalk-encoded audio and
re-encode it with another codec decreases the quality of the audio stream. Also,
the available codecs are often less specialized to speech data than the E-Chalk
audio codec. The quality of the audio stream usually decreases significantly
unless a higher bandwidth is used.
6.3
Export to QuickTime and AVI Video
A program was developed for converting the board and audio streams into a
QuickTime or AVI video using the Java Media Framework for encoding the
streams. The converter is realized both as a Java command-line application
and as Progressible to be easily integrated into the E-Chalk main system and
to be usable from the E-Chalk command-line console. Available codecs depend
on which one are installed on the system the program is running on. The calling
14 See
Section 4.3.
112
CHAPTER 6. TOOLS, CONVERTERS, ADD-ONS
Figure 6.7: A recording converted to AVI replayed with Windows Media Player
with 50 % zoom.
syntax for the converter tool is:
java echalk.tools.video.Echalk2Video [<options>] <dir> <file>
<dir>
directory containing the echalk recording to encode
<file>
the video file to write
options: [-qt|-avi] [-c=<codec>|-c#=<n>] [-fps=<n>] [-w=<n>]
[-h=<n>] [-v] [-d]
-qt
output quicktime, default
-avi
output avi
-c=<codec> selects codec of given name
-c#=<n>
select codec of index <n> in the alphabetical list
of codecs available for the selected output format
-mute
ignore audio track from the echalk recording
-fps=<n>
frame rate for encoded video, defaults to 25,
may be ignored by some codecs
-w=<n>
frame width, preserves aspect ratio unless -h is
given, may be ignored by some codecs
-h=<n>
frame height, preserves aspect ratio unless -w is
given, may be ignored by some codecs
-v
verbose output of progress
-d
debug mode, makes error output more verbose
To get the available codecs listed, two other Launchable/command-line applications are included in the echalk.tools.video package: LsAviCodecs for
an alphabetical list of all AVI codes and LsQtCodecs for the QuickTime codecs.
Most video codecs suffer from quality problems introduced by dropping higherfrequency parts of the frame images, as discussed in Section 1.1. However, note
that the encoded board stream is significantly superior in visual appearance to
encoded video-taped material, because the encoded signal is much cleaner.
Re-encoding the audio faces the problems already described for the conversion for playback with Windows Media Player, see Section 6.2.
6.4. CREATING BOARD SNAPSHOTS
113
Figure 6.7 shows the playback of a lecture converted to AVI. The original
E-Chalk recording has a size of 39 MB for about 96 minutes. 37 MB of the data
were allocated by audio data. The board used a resolution of 1016×740. The
AVI video is encoded with the ms-mpg4 v2 encoder using 24-bit color and 25
frames per second and uncompressed 16-bit mono PCM audio. The AVI has a
size of 255 MB, 164 MB of that being allocated by the audio.
6.4
Creating Board Snapshots
A tool for creating static board images from board recordings was developed
as a side product from the converter to QuickTime and AVI videos described
in Section 6.3. Output formats supported so far are JPEG and PPM.15 The
converter is implemented both as a Java command-line application and as an
E-Chalk Launchable. The calling syntax for the command line is as follows:
java echalk.tools.video.Board2Image [...] <lecture dir> <trg>
options: [-w=<n>] [-h=<n>] [-jpg|-ppm] [-p=<n>|-yoff=<n>|-yatend]
[-t=<ts>] [-d]
-w=<n>
output width, preserves aspect ratio unless -h given
-h=<n>
output height, preserves aspect ratio unless -w given
-jpg
output as jpeg (default)
-ppm
output in portable pixmap file format (*.ppm)
-p=<n>
show scrolled to page no <n> (defaults to 0)
-yoff=<n> show for scroll offset <n>
-yatend
show for scroll offset used at last event
-t=<ts>
load only events up to timestamp <ts>, format
[[<hh>]:<mm>:]<sec> with <hh>,<mm> integers,
<sec> float (significant up to milliseconds)
-d
debug mode
6.5
Audio Format Updater
Another tool available both as a command-line application and a Progressible
component is a converter for updating audio recordings from the WWR2 format
to WWR3. It was integrated into the main E-Chalk application to make the
append mode with the new audio format available on existing lectures recorded
with the old format. When a user chooses to append to such a recording, the
audio format is upgraded, showing a progress dialog with a cancel option during
the process.
When executed as a stand-alone application, it allows to define an audio
profile16 for basic noise reduction and to choose the codec by its bandwidth:
usage> java wwr2wwr3.Wwr2wwr3 [<options>] <infile> <outdir>
options: [-p <profile>] [-c <codec>]
-p <profile> audio profile for sound quality improvement
-c <codec>
one of {128, 64, 48, 32} kbps, 128 being lossless,
default tries to conserve bandwidth
15 Portable
16 See
PixelMap (PPM) is the color image format from the netpbm [67] package.
Section 5.2 for creating and using audio profiles.
114
CHAPTER 6. TOOLS, CONVERTERS, ADD-ONS
When executed as a Progressible from the main E-Chalk system to upgrade
the lecture to append, the system assumes the audio profile selected to be applicable to the old recording as well: speaker and recording equipment should
be the same in both. The current profile will be used for the conversion. The
upgrading process chooses the lowest bandwidth for the codec that is not lower
than the original bandwidth. This should preserve the original quality without increasing the data volume too much. The same behavior is used for the
command-line application when no codec option is given.
6.6
Repairing Damaged Recordings
From regular use of the E-Chalk system the demand arose for a tool to restore
damaged recordings. At Technische Universität Berlin, several recordings were
damaged due to a faulty memory chip in the machine running the E-Chalk
server. The recorded data were corrupted by bit flips, and sometimes even the
OS crashed. The recording was then shut down without properly closing the
output files, so that nonsense data were appended.
A command-line tool was developed for checking the integrity of audio and
board data and restoring them by replacing damaged audio packets with silence and dropping invalid board events.17 The tool can handle both E-Chalk
audio formats, WWR2 and WWR3. Checking and repairing video is not yet
supported.
usage> echalk.tools.checker.Main [<options>] <lecture>
options: [-o<outdir>] [-na|-va] [-nb]
-o<outdir> write fixed lecture to the given directory
-na
do not check/repair audio data
-va
output verbose audio packet info
-nb
do not check/repair board data
Replacing the damaged audio packets with “silent” packets prevents board
and audio from becoming unsynchronized, unless the audio data is so badly
damaged that the number of packets cannot be identified anymore. In this
case, synchronization must be adjusted manually using the Exymen editor, see
Section 6.13. A possible extension would be a capability to repair board events
where the redundancy of the event representation allows reconstruction.
6.7
Import of PowerPoint Presentations
With the abundance of material already produced as PowerPoint presentations,
there is considerable demand to import this material into other lecturing tools.
The eClass 18 system includes the TransferMation tool for automatically converting PowerPoint presentations to images and importing them into eClass
17 Note that damaged board events in unrepaired lectures do not prevent the recording from
being used for replay or append mode, as the board event interpreter just skips unrecognized
events with logging a warning to its error stream, unless the option to abort on invalid events
is explicitly set. The same holds true for the PDF converter and for the events interpreter
used by Exymen.
18 For a description of eClass, see Section 1.8.5.
6.8. KEYWORDS FROM HANDWRITING RECOGNITION
115
sessions. Written as a wizard interface in Visual Basic, it runs only on Windows98 [Bro01].
Another example is the ppt2aof [1] add-on for PowerPoint, which enables
PowerPoint to export the presentation to the format used by the AOF 19 tool
AOFwb, a .wb index file and GIF images of the individual slides.
For E-Chalk, a program originally developed as a student’s project will
convert Microsoft PowerPoint presentations into E-Chalk board macros. The
ppt2echalk converter is a Windows command-line executable written in Delphi, relying on the MS PowerPoint automation API to convert the presentation’s
slides into image files. This means the converter program needs PowerPoint to
be installed on the system and running the converter starts PowerPoint, though
the application is partially hidden since as it runs in iconified mode.
The resulting macro adds the slides one after another to the board, from
top to bottom. Depending on the converter’s command-line options, the macro
contains scroll events to change from one slide to the next:
usage> ppt2echalk [<ts>|(<ts>)] <lecture dir> <out dir>
When called without any options, all the slides are added to the board immediately and the macro ends, allowing to scroll the slides at the user’s own
pace.
When a number <ts> is given, it denotes the time in seconds that the macro
pauses between slide images before the next slide is added and a scroll event is
issued to move to the new slide image, simulating a slide show with automated
transitions. When the number is given in brackets, it will only be used on those
slides for which the presentation does not define its own transition time.
The board width the macro will produce is determined by the width of the
output slide images. The converter provides no option to choose this size, as
the PowerPoint automation API does not (currently) allow to change the image
dimensions. To provide control over the macro’s dimension, the slide images
would need to be scaled by the converter program, a feature that has not been
implemented so far.
6.8
Keywords from Handwriting Recognition
To automatically generate keywords for indexing purposes, both speech recognition on the recorded audio data [HKW02,Hür03] and handwriting recognition
on the board data may be used. For the given purpose, even a relatively low
recognition rate is sufficient.
The performance of the handwriting recognition that comes with the Tablet
PC Edition of Microsoft Windows XP has recently been tested with recordings
from the Classroom Presenter described in Section 1.7.2. The recognition engine
was tested on slide annotations from five lecture recordings, with segmentation
done by manual preprocessing. Recognition was reported as “good” (68 %),
even though the lectures are considered to be a difficult recognition task by the
authors [AHP+ 04a].
An application has been developed for E-Chalk to extract text from board
writing using a handwriting recognition [The04a]. Like in the Classroom Presenter project, it uses the handwriting recognition that is part of the Microsoft
19 For
a description of AOF and its tools, see Section 1.8.6.
116
CHAPTER 6. TOOLS, CONVERTERS, ADD-ONS
Figure 6.8: The indexing tool as a GUI-based application with control output
for the developer. Figure from [The04a].
Windows XP Tablet PC Edition and Microsoft Windows CE. The analyzer
works as a post-processor for recordings, implemented both as Java library and
as a stand-alone application with a graphic front-end. The application is shown
in Figure 6.8.
The recognition process performed rather poorly in distinguishing between
drawings and text. This part of the segmentation process is handled by the
Microsoft Tablet PC SDKs Divider, see [63]. This caused drawings to be
interpreted as text, cluttering the good recognition results with random ones.
Several approaches for a post-processing have been tried in the project to remove
the bad recognitions from the output. Simple heuristics on word structure and
dictionary lookups were applied. Unfortunately, dictionary approaches often
remove the most significant of the correctly recognized keywords since more
unusual words are more important for indexing purposes. See [The04b] for
details.
Any further development of this tool should improve the Divider’s strategy.
A likely reason for the poor performance of the Divider provided by the SDK is
that the development kit currently does not allow to tag the strokes generated
from the board with timestamps.20
20 Strokes fetched from a connection with a mouse driver are generated with time information, but there is no method to add them to strokes generated synthetically. The SDK allows
to associate extra information with its Stroke objects by lookup keys. It it possible that a
key already exists for timestamps, but none is given by the current SDK documentation.
6.9. MACRO RECORDER
117
Figure 6.9: The setup dialog of the macro recorder.
6.9
Macro Recorder
The format for a board macro is the same as for a lecture containing a board
stream. Only Applet and clear-all events are disallowed in board macros.
Macros are basically a short lecture recording with the board being the sole
recorded stream.
The macro recorder application allows to create a sequence of macros using
the current board settings from the main application. To enforce compatible
assumptions between the macro recording and the board session, a macro is
only available at the board if they use the same background color and the width
is not bigger than the current board width. Note that macros recorded with the
macro creator are available on recordings with the current board settings.
When the macro recorder is started, it opens the dialog shown in Figure
6.9. It allows the user to define the storage path and macro name as well as
optionally appending the macro to the macro bookmark list. The entries for
macro name and path are preset to generic names, enabling the user to start
recording immediately. If a previous recording made is encountered, the name
is generated from the previous recording’s name plus a trailing number, or by
increasing an already existing trailing number. Path name generation is done
the same way, only adding capabilities to handle name clashes with existing files.
Path information is saved from the last macro recording and used to determine
the preset to be displayed at the next macro recorder start.
When the user hits OK, the application starts recording after checking for
any write conflicts, like possible overwrites to be confirmed by the user or any
storage permission problems. The code that prepares a directory for recording
and starting the recording components is part of the main application described
in Chapter 3. With the main E-Chalk application being a Launchable, the
macro creator just uses it as a subcomponent to be started. Normally, this
would show the main setup dialog. To prevent that from appearing, certain
configuration properties are redefined. Others properties are used to suppress
dialogs like the Append/Overwrite/Cancel dialog21 , as the macro recorder already handles such conflicts itself. The redefinition of the properties is realized
by calling the Launchable’s init method with arguments. These arguments are
handled exactly like the command-line parameters for E-Chalk being executed
as an application, see Section 3.1. Parameters in the form <key>=<value> are
used to change the configuration properties. Parameters -X<key>=<value> are
used to modify the recording settings, to assign title, and target directory, and to
21 See
part on Recording in Section 2.4.
118
CHAPTER 6. TOOLS, CONVERTERS, ADD-ONS
Figure 6.10: Communication between browser and database.
set the recorded streams to board only, as well as to disable macro-incompatible
board actions (clear-all requests and Applet usage). To prevent these settings
from being stored in the standard echalk.conf file and thus being effective at
the next E-Chalk start, the macro recorder creates a temporary copy of the file
and assigns the copy to the Launchable as a settings file through setting the
echalk.conf property by an init parameter.
When the user finishes the recording, the macro creator dialog opens again,
with new default values set for title and target directory, allowing to record
another macro until the user chooses to close.
6.10
Automated DB or LMS Storage
Already in the early stages of the system’s development, experimental support
for creating repositories of E-Chalk recordings was implemented. A tool for
automated storage of lectures into an Oracle database was developed in addition
to a middleware to provide access to the replay feature [FKR02]. The insertion
tool was developed as a command-line application, but it was also integrated for
automatic call in some early E-Chalk versions. The user interface was realized as
a Web front-end for a search engine, allowing to search for lectures by different
criteria, such as lecturer, topic, dates, keywords, etc. The front-end supported
direct replay of the search results in the browser, as illustrated in Figure 6.10.
The system also included management of the clients’ Jar files, delivering the
latest compatible client version instead of the client code used at the time of
the recording.
Since Oracle database supports random access to stored BLOBs, it is possible to use the fast-forward/rewind audio methods described in Section 7.3.1.
While the audio format used at that time was WWR2, lacking a jump table
for random access, insertion in the database created a similar data structure to
enable random access by time offsets using the middleware. User administration
for access restriction to the recordings are also featured. Administration of the
6.11. HANDWRITING SYNTHESIS
119
Figure 6.11: Board output generated by handwriting synthesis for the input
string "handwriting synthesis".
Figure 6.12: Tic Tac Toe test chalklet. The computer places crosses, the human
player circles.
database content and the users is done via another Web interface.
This is not the only repository support tested with E-Chalk. In the context of a lecture given in the winter term of 2003/04 where E-Chalk and a
Learning Management System (LMS) were employed22 , a GUI application was
created for storing into the LMS, namely BlackBoard [4] Version 6. However,
the implementation of the tool remained at a very experimental stage.
6.11
Handwriting Synthesis
Another application that started as a student project converts ASCII text to
handwritten text on the E-Chalk board. The output features script-style connections between different characters of a word, and strokes are timed. Figure
6.11 shows an example of the output. The handwriting synthesis application
was written as a command-line tool that generates an E-Chalk lecture usable
as a board macro. Another application provides a graphical interface to define
character shapes and the types of connection with neighboring characters.
The application can be thought of as an inverse handwriting recognition
software, generating human-like output from machine input. A later version
might be used in future E-Chalk implementations to replace all remaining ASCII
output on the board, like the text output of computing algebra servers or from
CGI queries. In addition, a converter for text to board strokes should be added
to the E-Chalk API for the benefit of chalklet developers.
22 The lecture is the course on Neural Networks evaluated in the study described in Section
8.4.2.
120
CHAPTER 6. TOOLS, CONVERTERS, ADD-ONS
Figure 6.13: Chalklet for animated algorithms in mid-operation. Left: Sorting
handdrawn lines according to their height with Bubble Sort. Right: Finding
the shortest path in a weighted graph with Dijkstra’s algorithm. Figures from
[Esp04].
6.12
Example Chalklets
6.12.1
EchoChalklet and TicTacToe
Two chalklets that were not developed for use in actual lecturing are nonetheless included to serve as examples for developers using the E-Chalk API to
create their own chalklets. Their source code is linked in the documentation
of E-Chalk’s Java API classes. The EchoChalklet just reflects any Stroke it
receives at a center line in its input area, with a certain delay to the input.
The delay and whether the reflection is to be done horizontally or vertically are
parameters for the chalklet’s bookmark setup.
The TicTacToe chalklet allows to play a game of Tic Tac Toe against a
computer opponent, see Figure 6.12. The computer does not play an optimal
strategy, it only pre-computes the results for one move of the opponent, giving
human players a chance to win. The chalklet does not take any parameters.
Which player gets the first move is determined at random. As long as the
match has not reached a decision, undos are handled by the chalklet. Marks to
positions already set or marks that can be attributed to more than one position
are considered invalid and are deleted with background-colored repaints by the
chalklet.
6.12.2
Animated Algorithms
A number of animated sorting and graph algorithms have been realized as chalklets [Esp04], see for example Figure 6.13. They aim at visualizing algorithms in
computer-science teaching. These chalklets take user strokes as handdrawn input to the algorithm, e. g. a collection of strokes to sort according to their height,
or handdrawn graphs, using the lengths of the connecting edges as weights.
[Esp04] also presents an engine called Flashdance that produces algorithm
animation in Flash from pseudocode input and provides a framework for generating E-Chalk macros via Flashdance. The algorithm uses handdrawn strokes
from an E-Chalk recording as input. The event file with the strokes and the
definition of the algorithm are fed into an animation generator, producing a
6.12. EXAMPLE CHALKLETS
121
Figure 6.14: Two snapshots from the Neural Networks simulating chalklet. Images courtesy of Olga Krupina.
Flashdance script that is then converted to an E-Chalk macro. This allows to
generate macros showing animated algorithms. Unlike the chalklets described
above, these animation macros are not interactive on the board, and their operations have to be generated in advance to the teaching. However, in [Wat04] an
approach is researched to extend the Flashdance engine to produce chalklets.
6.12.3
Simulation of Neural Networks
A solution for simulating biological and pulse-coded Neural Networks is presented in [Kru05]. The author has developed a board chalklet that allows to
define networks by drawings and pen-drawing actions for loading parameters of
neurons. The chalklet can graphically simulate these networks. The numerical
simulation underlying the chalklet visualization is computed by a server that
the chalklet connects to using Java RMI calls. See Figure 6.14 for example
snapshots.
6.12.4
Simulation of Logic Circuits
A chalklet has been written for teaching computer-architecture principles, which
is capable of simulating hand-drawn logic circuits [Liw04]. To classify the user
input, the chalklet uses a multilayer neural network trained with backpropagation. It recognizes clock elements, And, Or, Not, Multiplexer and Demultiplexer
gates, and connections between the control elements. Circuits can also be saved
to the local disk for reuse as “modules” in other logic chalklet instances. Elements that are touched by the eraser are completely erased by the chalklet,
repainting the element using the background color. The recognized circuit is
simulated by using the Hades framework [Hen98] [32].
Handwritten zeros and ones set the inputs of the circuits for simulation.
Alternatively, the user can choose an animated simulation for all possible inputs,
optionally combined with a state-timing diagram, as shown in Figure 6.15.
122
CHAPTER 6. TOOLS, CONVERTERS, ADD-ONS
Figure 6.15: The logic circuits chalklet simulating a clocked RS Flip-Flop. High
inputs are shown with red lines, low inputs with blue lines. A state-timing
diagram for the circuit is shown at the bottom left. Figure from [Liw04].
The chalklet usability has been tested in a video-taped laboratory test.23
Eight users with different background knowledge about logic circuits and the
E-Chalk system got a 15 minute introduction into logic circuits and using the
chalklet. Then they received a number of exercises, requiring them to use the
chalklet. Afterward, they were interviewed for their experiences and opinions.
Some minor interface flaws in the chalklet were identified in the test, notably
of features not being being recognized as connected by wires (due to the recognizer’s distance tolerance being to small) and in the workflow for storing
circuits for reuse. The feedback resulted in certain adjustments being made to
the chalklet. See [Liw04] for details.
6.12.5
Python Interpreter
Python [vRD03] [78] is a programming language that was conceived as a teaching
language. The technical overhead from language syntax is very small compared
to most other languages. Python programs look very similar to algorithms
in pseudo-code notation. The idea of building a Python-interpreter chalklet
came in mind when Computing Science lecturers were looking for a tool to
interactively teach programming and algorithms with E-Chalk.
Hence, a Python interpreter chalklet was developed [Ste04]. Its supports
interaction types of a Python programming environment interface to be used
during a lecture. It accepts handwritten Python commands that are then recognized by the chalklet. Recognized lines can be combined and reordered into
a Python script by drag-like pen drawings. Recognized writing can also be
inserted at arbitrary program positions, again by a drag-like gesture, and recognized letters can be deleted by a strike through. As a fallback input possibility,
the chalklet provides a keyboard-like input. It shows all letters and takes any
letters stroked out as input. The scripts can be run using the Jython [48] interpreter, a Python implementation in Java. A running script can be stopped by
the lecturer, allowing to exit from programs with long runtimes or with infinite
loops. As scripts and program output can be too long to fit in their chalklet
areas, horizontal and vertical scrolling by horizontal and vertical pen strokes is
supported.
23 For
a short introduction to usability laboratory tests, see [Shn98].
6.13. POST-PRODUCTION WITH EXYMEN
123
Figure 6.16: Python interpreter chalklet. At the top, the program “window”, at
the bottom an area used for both handwriting input by the user and program
output for running Python scripts. Image courtesy of Henrik Steffien.
The handwriting mechanism uses the Microsoft Tablet PC recognizer.24 To
avoid having to run E-Chalk on Windows XP Tablet PC edition, a Java interface
to the recognizer engine has been developed which allows to be queried by RMI
calls. With this approach, one can use the Python chalklet on any platform with
using the handwriting recognizer by remote calls, as long as the server program
can be connected via a network connection. When E-Chalk actually runs on a
Tablet PC Windows, the server can be started locally and queries can be made
without a network connection.
6.13
Post-production with Exymen
Although E-Chalk has been conceived as a tool for capturing live and spontaneous lectures, instructors would like, of course, to edit the result of a lecture
in order to correct errors or just to eliminate superfluous parts. By editing,
recordings can be shortened, parts of lectures can be reused and recombined,
and lectures can be dubbed. For this, an editor capable of handling the three
multimedia streams used by E-Chalk is needed: audio and video streams as well
as the event-based board format must be supported.
Instead of writing a specialized editor for E-Chalk, a generic editor for
streamed data formats called Exymen [Fri02a, Fri02b] [25] has been developed.
It provides a single GUI for all kinds of multimedia editing and a framework
to represent multimedia data. A number of formats are handled by plug-ins
filling the abstract data containers of the Exymen API and providing editing
operations on them. To make for convenient extension of the editor, a powerful plug-in management system has been included.25 Figure 6.17 shows a
24 The
Java connection to the Tablet SDK is based on the work described in Section 6.8.
of the E-Chalk client, a major point in usability was to avoid having to install
plug-ins or any other special viewer software, see Section 1.2.
On the other hand, employing a plug-in architecture is not a problem for the server side,
where the Exymen editor is used. The server software needs to be installed anyway, and all
necessary Exymen plug-ins are installed automatically by the E-Chalk server installer. The
25 Speaking
124
CHAPTER 6. TOOLS, CONVERTERS, ADD-ONS
Figure 6.17: Exymen being used to edit three E-Chalk streams: video, audio,
and board. The streams are shown at the bottom along a timeline. At the
upper left, the state of the board for the timeline’s cursor position is visible.
The frames at the top right and middle right show the video and the audio
signal curve for the same time. Figure from [Fri02b].
screenshot of the editor.
6.13.1
Plug-in Management
Programs using plug-ins often irritate their users by consuming a lot of time
for loading the plug-ins on each startup, even if the plug-in is not needed for
the current session. Also, many applications require a restart of the application
or, even worse, of the operating system when new plug-ins have been installed.
Exymen avoids these problems by using a solution based on an open-source
implementation of the OSGi standard, named Oscar [70]. While the OSGi
standard was originally conceived for component management in the field of
Ubiquitous Computing, it is also suited for desktop applications. Having been
developed for small, mobile devices, it was designed to be small, compact, and
efficient. It allows the editor to install and update plug-ins via the Internet or
remove installed ones, all while the application runs and without requiring a
restart.
Plug-ins can also manage themselves for handling version updates or installing other plug-ins. For example if an Exymen format handler encounters
an unknown data format, it may search for a plug-in to handle it, install the
plug-in and let it loose on the data. Plug-ins may also extend other plug-ins,
providing a kind of modular construction system. The Oscar/OSGi system takes
care of all resulting dependencies. On shutdown, all plug-in states are stored to
plug-in mechanism is effectively hidden from the standard E-Chalk user. The same holds true
for the SOPA plug-in architecture underlying the audio and video server components. In both
cases, the plug-in architecture is only relevant for developers extending E-Chalk.
6.13. POST-PRODUCTION WITH EXYMEN
125
Figure 6.18: Board chunk visualization and explanatory legend. Figure from
[Fri02a].
provide for fast system startup without checking the dependencies again.
Download time for installations and updates is low since plug-ins tend to
be small. Even including an HTML-based online help, none of the plug-ins
described in Section 6.13.3 is bigger than 200 kB.
The approach of Exymen is inspired Emacs philosophy of free extensibility of
the program, formulated by Richard Stallman [Sta81]. It motivated the choice
of the acronym for “EXtend Your Media Editor Now! ” as the editor’s name.
6.13.2
Data Structures
Media data in Exymen are organized in a hierarchical way, similar to Apple’s
QuickTime [App01b] format, which also serves as a wrapper for different media
types.26 The top-level data structure is the Program, which would correspond
to a film reel of the analogous video cutting domain. A Program contains a
number of MediaTracks. A MediaTrack is composed of a sequence of Chunks
(corresponding to a tape snippet in video cutting), ordered along the timeline
without overlaps within the track. An Exymen plug-in fills the chunks with
its data. It may use an arbitrary representation and has to implement a small
number of basic operations on the data, e. g. splitting, merging, and cloning.
With these operations, video-cutting operations along the time scale in Exymen
become possible. A plug-in also has to provide a graphical visualization along
the time scale. See Figure 6.18 for an example.
Optionally, a plug-in may provide media chunk scaling, in both time and
space, and define arbitrary effects on its chunks, called filters, for example to
adjust the gain of an audio chunk. Plug-ins can provide a MediaEditor to
record new data. A MediaEditor also acts as a replay tool. Optionally, it may
allow editing actions in the space coordinates, see for example Figure 6.20.
6.13.3
Editable Formats
Exymen is distributed [26] including a number of standard plug-ins for the
following formats:
• E-Chalk board format, described in Section 4.10,
• E-Chalk audio format, both the old WWR2 and the new WWR3 audio,
described in Section 5.1,
• E-Chalk video format, described in Section 5.3,
• E-Chalk slide-show format, described in Section 7.5,
26 The
ISO based their file format specification for MPEG-4 on QuickTime, too [PE02].
126
CHAPTER 6. TOOLS, CONVERTERS, ADD-ONS
Figure 6.19: Editing an E-Chalk lecture combing a slide show and audio.
• E-Chalk lecture recordings, handled by a meta-plug-in using all four plugins listed above,
• JMF-supported audio formats [44], including MP3, QuickTime audio, and
PCM audio data (.wav, aiff, .snd, .au, etc.),
• C64 SID audio [Com82, Yan83]. This was integrated mainly for educational purposes on historical computer architecture. The fact that the C64
SID format is a fully computationally complete program format made the
editing support of this format quite challenging [JFK03, FJK04a].
The audio plug-ins allow to convert a stream of any of its supported formats to any other of the audio formats listed above. Another Exymen plug-in
available with the standard distribution allows to convert Microsoft PowerPointPresentations exported as HTML pages to the E-Chalk slide-show format and
to be edited with the above mentioned plug-in for the slide-show format.
An example of editing an E-Chalk lecture of a slide show including an audio
stream is shown in Figure 6.19.
E-Chalk Board Plug-in
While editing the multimedia data for audio, video, and slide shows is pretty
straightforward, editing the board content poses a few challenges. The board
stream represents the development of the board content as a sequence of timed
events, but events are not independent from previous events. For example, a
redo event is only allowed after an undo event and a line drawing can only
happen on the visible portion of the board, meaning it is dependent on the
offset generated by the antecedent scroll event.
These structural and spatial dependencies are classified in [Fri02a]. It describes how the plug-in manages to constantly maintain the dependencies within
a Chunk for all editing operations. The main idea behind preserving the nonspatial dependencies is to organize the board chunks’ content data into atomic
6.13. POST-PRODUCTION WITH EXYMEN
127
Figure 6.20: Removing a vertical board interval with the board MediaEditor.
Figure from [Fri02a].
sequences of dependent events.27
The MediaEditor for the board stream not only allows recording new chunks
and replay of the stream. It also lets the user insert scroll events and apply
other spatial editing operations. Users may select rectangular board sections
for cut, copy, and paste operations, as well as for moving the selected elements
by dragging. They may also remove vertical intervals from the board, see for
example Figure 6.20.
27 A coarse separation into atoms would seriously constrain the editing facilities on board
data. Fortunately, the atoms are almost always single strokes. Only interactions with Applets
and undo/redo operations can create longer atoms.
128
CHAPTER 6. TOOLS, CONVERTERS, ADD-ONS
Chapter 7
Client Applets
A recorded E-Chalk lecture is replayed by Applets. When the remote user
opens the lecture’s Web site, one Applet per transmitted data stream is opened:
a board Applet, an audio Applet and a video Applet, or any subset of these
three if not all of the streams were recorded. The same Applets are used for live
transmission and replay of archived lectures, only the Applet parameters given
in the Web page differ. If the transmission is live, each client Applet opens
a TCP socket connections to the E-Chalk server and read the data from this
connection to display the current lecture data.1 For replay from an archive, an
additional Applet is opened. The control-panel Applet provides VCR operations
on the recording, see Figure 7.3. Timed slide shows can also be combined with
lecture recordings, see Section 6.13. Displaying them is handled by the slideshow Applet.
For live transmission, the client Applets read the lecture data through a
socket connection from the E-Chalk server program. Because Java Applets
can only connect to the server their class code is loaded from, the E-Chalk
server must run on the Web server, or the Web server must act as proxy for
E-Chalk’s server sockets. For an overview to the client-server connections for
live transmittions, see Figure 7.1.
When the lecture is replayed from archive, all data are loaded using the Web
server’s HTTP service. As described below, the board, video, and slideshower
Applets can synchronize their replay with the Audio stream. The reason for
adapting everything according to the audio stream is that interruptions in the
audio stream are perceived as quite disturbing compared to stalls in the video
or board replay. See Figure 7.2 for an overview.
While the standard setup is to access a lecture with a Java-enabled browser
or with the Java appletviewer by an HTTP address, the client Applets can
also be run from the local file system, for both live and archived lectures. Of
course, for the live session the E-Chalk server must then be running on the same
server as the client.
1 An
early implementation of E-Chalk also allowed a live connected shifted in time for late
connects. When remote viewers connected ten minutes after the start of the recording, they
had option to get the lecture recording presented as a replay, shifted ten minutes in time
compared to the live stream. Since this feature was never used by real users, it is no longer
supported in E-Chalk .
129
130
CHAPTER 7. CLIENT APPLETS
Figure 7.1: Communication between an E-Chalk server and a client for live
transmissions. Board resources include images and data of Applets added to
the board.
7.1
Client Control Panel and Masi Interface
To be able to synchronize the different replay Applets, the abstract Applet subclass de.echalk.applet.Masi (Media-Applet Synchronization Interface) was
defined and all the content displaying Applets inherit from this class. A Masi
Applet provides methods which report the capabilities for navigation in time
(like “can jump forward”, “can jump backward”, “can pause”) and the current
replay status (like “is paused” and the current offset in time). Also, it provides
methods for modifying the play status (like modifying the play offset or toggle
pause mode).
The control panel scans for all Masi Applets started in the same Web page
and allows the user to access any controls that are simultaneously provided by
all Masi instances.2 In the E-Chalk client Applets, all capabilities for navigation
in time are supported: pausing, setting forward and backward offsets, rewind,
and jumping to random offsets.3
The control panel displays the time reported by the Masi Applets (if the
Applets’ local times differ, the control panel uses the maximum time value)
with both a slider and a text display. Clicking on the time display toggles the
display modes of elapsed time, remaining time, and total time. The control
panel displays a warning text at the bottom and changes the mouse cursor to a
wait cursor whenever the Masi instances are stalled, for example when they do
not get their data fast enough on a forwarding action.
When a Masi instance reports permanent errors (by its method boolean
hasPermanentErrors()) or if it is no longer active (determined by the Applet
method boolean isActive()), it is removed by the control panel from the list
of controlled Applets. When no Applet remains to be controlled, the control
panel closes.
2 Except for navigation by chapters, which is defined in Masi but currently supported neither
by the control panel nor by the replay Applets.
3 A possible improvement would be a capability to play at higher speeds.
7.1. CLIENT CONTROL PANEL AND MASI INTERFACE
131
Figure 7.2: Overview of the client Applets for replay of recorded lectures.
The Applet parameters recognized by the client control panel are:
• seconds
This is a mandatory parameter, defining the length of the recording in
seconds as a decimal integer.
The information is given to the control panel as parameter instead of
reporting such a information with Masi method, as E-Chalk data streams
do not report their total length at the beginning of the data.4
• title
This is an optional parameter defining the lecture title to be displayed.
• initfile
The optional init file (with the given path relative to the control panels
code base) defines a skin for the control panel. The init file is a Java
property file with property entries defining the position and sizes of the
control panel’s control elements as well as the positions and colors of text
font (including a “shadow” color), given separately for the title text, the
time display, and for warning messages printed at the bottom. Also, an
image file which contains the control panel’s background image with inactive buttons, and the images of the control elements buttons for pressed
and for mouse-over look is contained. For the play/pause button, appearance for both play and pause modes are defined. It may also contain an
image for filling the slider track. See Figure 7.4 for example skin graphics.
• autoplay
This is an optional flag to determine if the Masi instances should start
immediately by the control panel when their initialization phase is finished.
Otherwise the control panel will set the replay to pause mode at start and
it must be started manually by the user. The parameter defaults to true.
4 In
fact, this is not possible with streaming formats.
132
CHAPTER 7. CLIENT APPLETS
Figure 7.3: A snapshot of the client control panel frame with mouse-over effect
for the play/pause button.
• x and y
These are optional x and y-coordinates as decimal integer for the topleft position of the control panels frame. By default, the position will be
determined by the users window manager.
7.2
7.2.1
Board Client
Event Handling
As described in Chapter 4, the board client uses the same classes as the board
server component, just without the authoring elements. It uses the DrawPanel
component5 to interpret the events. In addition to several classes the board
client shares with the server side board, the client board uses four classes.
First, the Applet class echalk.client.Client, which is the main class of
the client. It inherits from Masi (see above), realizing the interfaces for control
by the control panel, handles the Applet’s parameter-specific setup, and controls
the replay. An instance of the inner thread class Client.EventReaderThread
concurrently reads all the events: for live transmissions, that is done from a
server socket6 , for a recorded lecture, directly from the event file7 . The eventreading thread submits the threads to the echalk.client.EventScheduler,
which handles the timed delivery of events to the DrawPanel. For a recorded
lecture including an audio stream, a thread EventScheduler.AudioSyncThread
is started, adjusting the local board time at regular intervals (every five seconds)
to match the audio client’s time and thus preventing a slowly accumulating
synchronization offset.
7.2.2
VCR Operations
While the audio and video stream need only the stream data of the current
point of time t0 , the event-based nature of the board means the board needs to
examine all events in the interval [0, t0 ] to construct the board view for t0 . When
the board has to jump from a time offset t0 to an offset t0 + ∆t in the future,
5 See
Section 4.1.
Section 4.11.
7 See Section 4.10.
6 See
7.2. BOARD CLIENT
133
Figure 7.4: Two example skin graphics, left the default skin and right an OS X
Aqua–style one. Transparent image parts are shown in white.
the scheduler has to try to submit all missing events (events with timestamps in
[t0 , t0 + ∆t]) immediately. This causes the board to stall if the event reader has
not yet read the events up to t0 + ∆t. Fortunately, this is usually only the case
if a replay is forwarded a considerable amount of time at the very beginning of
replay, and even then only for a short time, because the board event data are
relatively small in size.
Because there is no general reverse mechanism for a board event, jumping
back to a offset of t0 − ∆t is realized as a total rewind (jumping to offset zero
by clearing the whole board) and then jumping forward to t0 − ∆t.
To speed up jumping to a new offset, the changes in the board content are
not shown immediately. Instead, the changes are applied to the offscreen buffer.
Intermediate changes are only shown by repaints during lengthy VCR operations
(when the adjustment takes more than one second to realize), and only in steps
of one second, giving the user some feedback that the board is still active. The
board also signals the user to be busy during the adjustment by changing the
mouse pointer to a wait pointer.
7.2.3
Scrolling
The server board can be scrolled with mouse drags by the drag handles 8 , while
other mouse-drag actions are used to draw on the board. The client board, which
the remote viewer cannot paint on, allows to do scrolling-type drags everywhere
on the board.9 To give a feedback to the user, the mouse cursor changes to
move pointer defined by the operating system once he or she starts to drag.
Horizontal drags are also possible for client boards with a horizontal extension
smaller than those of the server. This can happen when the client screen has a
smaller resolution or because the remote user resized the board.
For vertical scrolls, the client has two possible sources, the user drags or
the transmitted scrolls from the lecturer at the server board. By default, the
client combines the two, always using the last defined scroll offset, regardless of
it source. This implementation assumes the standard case of the remote viewer
looking at the board section the teacher uses for the given lecture portion, while
still allowing them to peek at older portions.
8 See
Section 2.4.
only exception are the areas of embedded Applets, because the Applets consume
those mouse drags themselves.
9 The
134
CHAPTER 7. CLIENT APPLETS
Figure 7.5: Board client with context menu.
A pop-up menu in the client allows the user to change the mode of handling scrolls. The behavior may be changed to handle only user drags or only
transmitted scrolls, see Figure 7.5.
7.2.4
Handling Applets
The Applets are managed basically in the same way as described in Section 4.9
apart from recording facilities, which are obviously not available at the client
side.
The local user can interact with the Applet regularly. While this can be
used as a feature for adding interactive elements to a lecture, this is a major
problem one wants a close reproduction of the live lecture, as the remote users
interactions will usually not fit together with the lecturer’s recorded Applet
interaction. See Section 4.9.1 for a discussion of the Applet replay problems.
For the Applet class to be loadable on the client side, they must located
in the board client Applets classpath. For replay from a repository, this can
be done by putting the Applet files into one Jar archive with the code for the
E-Chalk clients. For live transmissions, this is not possible, because the Jar
archive is loaded once when the remote user connects, and the Applets to be
used in the lecture are not yet stored by the server. In this case, the codebase
parameter should be used to load all the classes, both E-Chalk client Applets and
board-integrated Applets, from the applet directory. Therefore, the E-Chalk
code must then reside there, too.10
7.2.5
Board Parameters
There are no mandatory Applet parameters of the board client Applet, all are
optional. The parameters are:
• port
Giving this parameter marks a live transmission. The parameter is the
decimal port number to connect to on the live server. The server must
10 For the current implementation of the E-Chalk system, this is not automatically handled.
The template handling in Section 3.7 can be easily configured to handle the live case, but
bundling together the Applet classes in a Jar archive is not yet supported and has to be done
manually.
7.2. BOARD CLIENT
135
be the Web server the Applet is loaded from since Java’s security model
does not allow unsigned Applets to connect to other servers. If Web server
and E-Chalk server are not running on the same machine, the Web server
must be running a proxy to forward the E-Chalk live streams between
E-Chalk server and E-Chalk client Applet. Otherwise, live transmission
is not possible. Of course, this restriction also holds for live transmissions
without the board stream, for example if only the audio signal is streamed.
The port parameter has no default value, meaning that replay from
archive is assumed as a default. If the parameter is set, but a parse error
occurs, or if the port number is out of the valid range, the parameter is
set to 9996, the server’s default port number.
• delayoffset
This parameter is used to give a delay in milliseconds for displaying live
events; it is ignored if the board does not run in live mode. The delay is
introduced to compensate for the delay the audio client needs for buffering.
The default value is 12,700 ms, which is the live delay used by the old
WWR2 implementation of the audio client. See Section 7.3 for details.
• masiclient
The Applet name given to a Masi instance to synchronize with, usually
the audio client Applet.
If a name is given and if the board client can find a Masi-extending Applet
with the given name in its AppletContext11 , it starts a thread that ensures
synchronization with the named Applet as described in Section 7.2.1. The
parameter has no default, meaning that no audio stream is assumed to
exists if the parameter is not set.
• topleftx and toplefty
These are optional entries for explicitly positioning the client-board’s window on the screen by defining the values of the window’s top left corner.
If not given, these parameters default to zero.
• scrollbar
This is a flag causing a vertical scrollbar to be added to the board window.
This provides a standard GUI element for vertical scrolling in addition to
the drag feature. The scrollbar slider’s position and size give a visual
feedback of the board area’s position in the total board history. On the
other hand, because the scrollbar needs a certain amount of space, this
can make the vertical space available on the user screen too small for the
board.
If not set, this parameter defaults to true. In the standard HTML templates of the E-Chalk system, the flag is set to the same value as the
scrollbar flag in the server, giving the remote user a scrollbar exactly
when the lecturer used one.
11 See
Section 4.9 for details on java.applet.AppletContext.
136
CHAPTER 7. CLIENT APPLETS
• autostart
When this flag is set to false, the board client starts in pause mode and
waits to be externally triggered via with the Masi unpause method for
starting to play. If the control panel Applet is used, it expects the client
Applets to wait to be started (and therefore letting the control panel
synchronize the start time), if no control panel is present, the client will
have to start automatically or it will pause indeterminately.
The default value for this entry is true for live transmissions (when no
control panel is present) and false for archived replay (when the control
panel Applet is used for control).
• embedded
Setting this parameter to true causes the client board to use the Applet
area in the HTML page rather than opening its own frame. The default
value is false.
This parameter was introduced due to user requests. In a distance teaching project at Universität Regensburg, users wanted to combine video and
audio streams in Real format [79] with a timed display of Web pages (triggered with SMIL [W3C98, W3C01]). Some of the pages were to contain
short board recordings. With their remote viewer already operating both
a RealPlayer window and a Web browser, they wanted to avoid another
window for the user to operate.
• autoclose
A client is notified of the end of a live transmission by a terminate event,
see Section 4.10.2. By default, or when autoclose is set to false, it
opens a message dialog to notify the user. This is especially important
for transmissions without audio signal, as the remote viewer would have
difficulty in distinguishing between a transmission that has ended, one
that stalls, or one where the teacher simply pauses for a while. Note that
for replayed lectures this is usually not needed due to the presence of the
control panel Applet, showing the lecture’s position in time.
When the autoclose parameter is set to true for a live transmission, the
board frame closes when the lecture ends. For the default setting, this is
not very useful, as keeping the board open allows the student to browse
through the board drawing. In fact, this parameter was introduced for a
special setup where the board client is opened from the server side, see
partt on setup of FU data wall in Section 8.1.1.
• yoffset
This integer parameter causes the client to shift the vertical scroll-offset
by the yoffset value. The default value is zero. The parameter is only
used in a special setup where the board content is displayed with multiple
board Applets. See part on setup of FU data wall in Section 8.1.1 for the
usage example.
• server
In practice, this parameter is only used for debugging purposes. It gives
an IP address or host name to connect to in live mode. Note that an
7.2. BOARD CLIENT
137
Figure 7.6: Standard client messages for debugging purposes written to the Java
console of the browser.
Applet is usually only allowed to connect to the host its code is loaded
from. As a consequence, this parameter is only used when starting the
client from a local HTML file. For this the Java appletviewer and some
browsers allow to loosen the security restrictions to connect to the local
host.
When the Applet is loaded from a remote connection, the server location
of the Applet’s code-base entry is used instead. When the Applet is loaded
locally, the server parameter is used instead, or if it is not set, its default
value of 127.0.0.1 is used.12
• baseurl
This parameter is used as the root location for all board data to be loaded:
the events data file board/events, the image data files images/no.dat,
and the Applet HTML files applets/no.html. It is given as a relative
path to the code-base URL of the Applet and defaults to the code base.
Because of the security restrictions of Applets, it has to be the code base
itself or a subdirectory.
The parameter is used for debugging purposes only.
• debug
The board client writes certain status messages to the browser’s Java text
console. See Figure 7.6 for typical messages produced by the client control
panel and the three E-Chalk clients, board, audio, and video.
The boolean parameter debug activates additional messages for debugging
purposes similar to the server debugging mode described in Section 3.10.2.
The parameter’s default value is false.
12 The parameter was introduced for use on those Windows systems that do not recognize
the loop-back address 127.0.0.1. Note that Windows systems of the 2000/XP family can
handle it.
138
CHAPTER 7. CLIENT APPLETS
7.3
Audio Client
The audio client Applet can play both the older WWR2 and the new WWR3
audio format described in Section 5.1. A WWR2 input stream is decoded with
E-Chalk’s ADPCM to an 8-bit, 8-kHz µ-law mono audio stream, which can
directly be played by the Java audio system, irrespective of the underlying
Java version. With a WWR3 stream, the data decodes to a 16-bit, 16-kHz
linear mono audio stream. This can also be played directly within the browser,
provided is supports Java 1.3 or later. If only Java 1.2 or earlier is supported,
the client converts the data to 8-bit, 8-kHz µ-law to replay them. This means
that users with a more recent Java version can listen to the audio at a higher
quality than others. The recording data and the client used are the same for
both types of users.
To compensate for network jitter, the audio client uses a buffer. Filling the
buffer with data introduces a delay for live transmissions. For two-way transmissions, round-trip delay would be twice that. The WWR2 implementation
used a delay of 12,700 ms, while in the new WWR3 version, the buffer time was
reduced to 4,763 ms. The values are results of experiments to find a good tradeoff between interruption-free transmission and small delay. The smaller delay
in the newer version reflects improvements in the Internet’s quality of service
achieved in the last five years.13
7.3.1
VCR Operations
The audio-data stream consists of packets that contain audio data for a fixed
duration (4,763 ms). The storage size of the packets varies and is stored in the
packet’s header. To fast-forward WWR2 recordings, the client runs through
the packet’s headers until it skipped enough packets. Even worse, for jumping
backwards in time, the client has to read the audio data from the beginning
until it reaches the desired packet.
For WWR3 data, this method is used only as fallback. Nearly all Web servers
today support HTTP requests for random-access reads [FGM+ 97, FGM+ 99].
The WWR3 server stores both the encoded audio data and an index file, which
contains the sizes of the audio packets. With the index information, the audio
client can jump directly to the right packet, dramatically speeding up the operation. The old method is used only if the index file cannot be accessed or if the
Web server does not support byte-range requests.
7.3.2
Parameters
Parameters recognized by the audio client Applet include14 :
• archivemode
This parameter gives the location of the recorded audio data as a relative
URL. If the value ends with a slash, it is assumed to be a directory that
contains the encoded WWR3 audio file content.wwr and the packet index
13 The delay compares well to other streaming systems. For example, streaming with the
Real Presenter has a one-way delay of 30 s. Even satellite phones have a delay of about one
to two seconds [ZS02].
14 Parameters that are supported only for backwards compatibility are omitted.
7.3. AUDIO CLIENT
139
file index.wwr, see Section 7.3.1. Otherwise, the parameter is assumed to
be a WWR2 audio file (or a WWR3 audio file if wwr3mode is set to on,
see below). When this parameter is undefined, the client assumes a livestream connection. For historical reasons, the parameter ondemandmode
can be used instead of archivemode.
The default setup of the E-Chalk system sets the archivemode parameter
to audio/ for archived lectures. When the WWR2 format was still in use,
the parameter was set to lecture.wwr.
• port
The parameter is the decimal port number to connect to on the live server.
When not given, it defaults to port 9998. The parameter is ignored when
replaying from archive.
• loopmode
With the audio system originating from an Internet radio streaming system, the audio Applet terminates by default when reaching the end of the
audio stream, releasing all system resources. The audio client terminates
at the end of replay and cannot be played back. To avoid this, the parameter loopmode has to be set to on, being basically inverse in effect to the
board’s autoclose parameter.
• syncalpha
A problem when recording audio is that sound cards do not return the
audio samples at a precise enough rate for our synchronizing purposes.
Even for high-quality sound cards the actual duration of the audio sample
usually differs from the requested duration by a few seconds per hour of
recording. The audio client determines its time offset by counting the
audio samples, while the other streams use the system clock. With an
average sound card used for recording, the differences may add up to
about 30 seconds for a lecture of 90 minutes, and the offset may become
quite irritating at the end of a longer recording.15
To get decent synchronization between the board and audio streams, the
offset time computed by the audio stream is multiplied by a correction
factor α. This value is determined by the E-Chalk application at the
end of the recording as Tboard /Taudio where Tboard and Taudio are the
total times of the board and audio recordings. (This is done similarly for
recording audio and video without the board stream.) The syncalpha
parameter is set accordingly in the default templates, stored as a string
representation of a positive double value.
• wwr3mode
When set to on, the audio client assumes the input to be in WWR3 format,
even if the archivemode parameter is a non-directory file (not ending with
a slash), see above. The parameter must also be set in live streaming mode
(i. e. when the parameter archivemode is undefined) if WWR3 data are
streamed.
15 For live transmissions, this problem does not occur since the replay time is determined
by the receiving time.
140
CHAPTER 7. CLIENT APPLETS
Figure 7.7: A video of the instructor replayed in the video client Applet.
• server
This parameter is identical in function to the board Applet parameter of
the same name. It is used for debugging purposes only.
• errorurl and endurl
The parameter errorurl defines a URL to redirect the browser to if the
connection is down or too slow. In Internet radio, this was used to either
redirect to an alternative broadcaster or to change to an HTML page
with the audio client for a connection serving at a lower bandwidth. The
latter approach allows to have a set of streams with different bandwidth
where the client automatically selects the highest bandwidth the listener’s
connection can handle.
The parameter endurl was also only used for Internet radio. If set to a
URL, the browser changes to the given location when the client terminates
on reaching the end of the stream.
7.4
Video Client
As stated in Section 5.3 in the description of the video format, the E-Chalk
video is intended more to add a personal touch to recorded lectures than to
be a major source of information. As high-resolution video consumes lots of
bandwidth, the videos recorded with E-Chalk are normally of low resolution.
See Figure 7.7 for an example.
The buffering strategy of the video client the differs from the one in the audio
client, as many client systems may not have enough memory available for buffering video for several seconds. For video, a dynamic cache is implemented, that
increases and decreases with the amount of memory available. Fortunately, discontinuous image streams are not as disturbing as discontinuous audio streams.
Jumping forward and backwards in recorded video is by now handled as in
the WWR2 audio. The faster approach of VCR operations in WWR3 audio,
using the index file to jump to the proper offset in the video data file, is planned
as a future enhancement. Since video encoding uses only difference frames
(except for the very first frame), jumping in time generates artifacts in areas
which changed only in the skipped time. This can be avoided by storing full
frames (I-Frames) every few seconds in separate files, another feature planned
for the recent future. In combination with the index file, this allows the client
7.5. SLIDE SHOW
141
fast random access and to fully construct the video by loading the most recent
I-Frame. While the storage of the I-frames would increase the size of the stored
video notably, only a single I-frame per jump has to be loaded, keeping the low
bandwidth requirements for the remote user.
Parameters recognized by the video client Applet are:
• archivemode (or ondemandmode)
Similarly to the audio client parameter of the same name, this gives the
URL (relative to the code base) of the directory containing the encoded
video content.wwv. If the parameter is not set, the client works in livestreaming mode.
• delayoffset and masiclient
These parameters are identical to the board client parameters of the same
name, used for synchronization with the audio client, see Section 7.2.5.
• server, loopmode, and port
These parameters are identical in function to the parameters of the same
name for the audio client, see Section 7.3.2. The only difference is that
the default value for the live port is 9997.
7.5
Slide Show
The slideshower Applet allows timed display of Web pages and to combine
it with the other client Applets shown before. The slide show in Figure 7.8
combines a sequence of pages with the replay of a talk.
The implementation of the slide-show Applet does not support streaming
of slide display command. The slide events are loaded on startup before the
replay starts and thus live transmission is not supported. While the other client
Applets can be run with the Java appletviewer, the slide-show Applet needs
a browser environment, as the appletviewer cannot display Web pages.16
With no live server currently available for the slide-show Applet, this client
currently supports only archived replay. It causes the browser to load URLs at
given timestamps. The data for the slide show are a text file containing one
entry per line (irrespective of the platform-specific encoding standard different
line separators may adhere to). A command to display a document is
showurl url hh mm ss[ target]
where url is the URL of the document to be displayed, and hh, mm, ss are the
display time as hour, minute and second offset to replay start time, given as twodigit decimals. The optional field target specifies the frame to open the document
in either the name of the frame in the HTML or one of the symbolic targets
16 The java.applet.AppletContext method showDocument(URL, String) is used to show
the pages. According to the Java API documentation, browsers are free to ignore the calls,
see Java API [42]. In practice, however, all Java-capable browsers can be assumed to support
this method.
As a side note, these document to be shown need not be stored locally in contrast to the
images and Applets loaded by the board client. As the slide-show documents are loaded into
the browser and not into the Applet, the usual Applet security restrictions do not apply to
these resources.
142
CHAPTER 7. CLIENT APPLETS
Figure 7.8: A snapshot from [23], a slide show with audio and control panel
created by Schule des Sehens [86], an e-learning project on art. The different
lesson slides illustrate different details of the art work explained.
self the frame, that contains the slide-show Applet, parent, the Applet’s
parent frame, top, the top-level frame of the Applet’s window, and blank,
a new unnamed top-level window.17 If a named frame is used and a frame of
that name does not already exist, a new top-level window with the specified
name is created and the document is shown there. If the parameter is omitted,
the default target is used, initially set to the target name slideframe. The
showurl commands are executed in the order of their timestamp values. When
two commands use the same timestamp, they may be executed in any order.
The other type of entry is used to set the default target for following showurl
lines. Its syntax is
defaulttarget[ target]
where target is the new target. If it is omitted, the default target is set to the
frame with the name slideframe, creating it in a new top level window, if it
does not yet exist.
The data file for the slide show can be created either directly with a text
editor or, more comfortably, with the Exymen editor, see Section 6.13.
Jumping to a timestamp t0 is realized as displaying the last document to be
shown in the interval [0, t0 ].
The parameter recognized by the slide-show Applet are:
• slidefile
This mandatory parameter gives the (relative) URL of the slide-show command file to be used.
• delayoffset and masiclient
These parameters are identical to the board-client parameters of the same
name, used for synchronizing with the audio client, see Section 7.2.5.
17 See
[RLJ98] for target names.
Chapter 8
Experiences and Evaluation
8.1
Case Studies
Practical experiences with full-fledged E-Chalk lectures have been gathered at
the Computer Science department of Freie Universität Berlin since the summer
term of 2001. At Technische Universität Berlin, eight lecture halls and seminar
rooms of the departments of Mathematics and Physics have been equipped with
E-Chalk since the winter term of 2002/03. In the summer term of 2003, about
1,100 students were taught with E-Chalk at these two universities [FKR03], and
the numbers of students were similar in the following terms. About 800 installations of E-Chalk are in operation around the world (as of September 2004),
with 80 of them reckoned to be used regularly. The majority of E-Chalk installations is found in university teaching, but also in practical-training instruction
for technicians [55, 56] as well as in training scenarios at the Deutsche Bahn
(German Rail) and the Bundeswehr (German Army).
The Berlin Department of Education initiated an evaluation of whiteboards
using E-Chalk in Berlin elementary and secondary schools. Within the CidS!
(Computer in die Schulen!) [10] project, twelve schools have been equipped
with electronic boards since early 2003. One of these boards is shown in Figure
8.1. Feedback from personal contact indicated the highest levels of E-Chalk
use in elementary schools, where writing and drawing on boards was used more
frequently than in higher grades. However, the overall usage profile remained
comparably low, as many teachers were reluctant to familiarize themselves with
the technology. The evaluation report [Eul04] recommends training the teachers
with the whiteboards and providing libraries of digital material tailored for
school teaching, like the Lokando SCHOOL Themenbank [54].
The largest German museum of science and technology, the Deutsches Museum [18] in Munich, uses E-Chalk in a project where visitors are asked to
record a description of their favorite experiment from the Chemistry exhibition,
see Figure 8.1. To promote the use of audio in the recording, the visitor is
engaged in a conversation about the experiment by a museum employee sitting
vis-à-vis during the recording. Some configuration settings were introduced to
the E-Chalk board for this experiment to further reduce the tool dialog options. However, the Deutsches Museum team uses the standard setup, as it was
thought from their initial experiments that “everyone immediately understands
143
144
CHAPTER 8. EXPERIENCES AND EVALUATION
Figure 8.1: Left: English lesson with E-Chalk at a German school, the WilmaRudolph-Oberschule in Berlin. Center: A young visitor of the Chemistry department of the Deutsches Museum in Munich describing his favorite experiment
with E-Chalk. Right: The artist Kiddy Cidny streaming a live art performance
into the Web.
how to operate the software anyway”, whether the visitor is a young child or an
older person. The only feature reported not to be obvious to uninitiated users
are the drag handles. On the other hand, once demonstrated, the feedback on
the drag handles was always positive.
Pathologists at the Klinik am Eichert hospital in Göppingen, Germany, plan
to adopt E-Chalk combined with a video-conferencing system for ad-hoc communication about diagnostic findings with physicians in other places.
The system was even used in an art event. The Himmel5 art show [34]
organized a performance streamed live into the Web, see Figure 8.1.
8.1.1
Hardware Setup in the Lecture Room
When using the E-Chalk software in classroom teaching, one needs a pen-based
input device and a large display for the audience. Ideally, the display itself is
the writing surface, increasing the similarity to the chalkboard usage. This can
be realized by using digital whiteboards or rear-projection systems with pen
tracking. The whiteboard systems are basically wide, perpendicular mounted
digitizing tablets with a diagonal of up to 80 inches. The screen content is displayed by an LCD projector, see for example Figure 8.2. This front projection
has the disadvantage that the lecturer may cast a shadow on the board, interfering with his or her writing on the board. Rear-projection systems do not
know this problem and they are less susceptible to adverse light conditions, but
they are also less portable than whiteboards and much more expensive.
For both systems, the display area is large enough for a seminar room of
typical size, but not for a large auditorium. This can be solved by a second
LCD projection at a bigger scale. The Technische Universität Berlin applies
such a setup regularly, see Figure 8.2.
An alternative setup is to use a digitizer tablet or a Tablet PC as the input
device and combine this with a projection for the audience. Digitizing tablets are
comparatively cheap1 and easy to transport. Using a model with an integrated
display, the teacher does not have to turn away from the audience for writing.
For a fixed installation, the tablet can also be integrated into a lectern, see
Figure 8.3 for an example.
1 Digitizing
tablets without integrated displays are available for less than $50.
8.1. CASE STUDIES
145
Figure 8.2: Left: E-Chalk running on a digital whiteboard with front projection
(Numonics IPM). Right: Mathematics lecture at Technische Universität Berlin
using the same digital whiteboard model and an additional projection for the
audience.
Providing the writing surface this way can also be helpful in other scenarios.
A handicapped professor of Arabic Linguistics was delighted to be able to give a
chalkboard lecture while seated using a digitizer tablet for himself [12]. Before,
the wheel-chair-bound professor always had to have a student or assistant to do
the blackboard writing for him. Another example is a setup at a German high
school, where the computer room is too cramped for the regular classroom setup.
There is not enough room for a blackboard, and students’ desks provide just
enough space for the computer hardware, not leaving enough space for taking
notes. The teacher uses E-Chalk with a small digitizer tablet and projects the
board content onto the wall, see Figure 8.3. The E-Chalk PDF is printed out
at the end of the class so that students have access to a written copy of the
material covered in class.
For smaller seminars, one can use a setup with several digitizer tablets,
enabling students to interact with the board contents from their own seats. In
the case shown in Figure 8.4, the Geology lecturer uses a rear projector and the
students use small digitizer tablets to work on geographical maps.
FU Data Wall
At Freie Universität Berlin, a rear-projected data wall was built to provide a
spacious electronic board hardware [FKRT04], see Figure 8.4. The wall display
is composed of four screens controlled by a single PC with a multi-head graphics
card. The pen is a laser pointer, turned on by being pressed against the screen
surface. The laser light is tracked by cameras; a webcam is positioned behind
each display. The camera signals are fed into a second PC, which searches for the
laser pointer’s signal, computes a mouse position from it and sends the position
to the display-handling computer. A receiving program acts as a mouse driver,
setting the mouse position accordingly. For a detailed description see [Die03].
However, this solution only provides a kind of zero-button mouse. To add
more features to the pen, the driver has been enhanced to handle additional
signals sent via bluetooth, see [Reb04].
The extra space of the data wall are used with E-Chalk to show previously
146
CHAPTER 8. EXPERIENCES AND EVALUATION
Figure 8.3: Left: Digitizer tablet with integrated LCD tablet (Wacom Cintiq)
integrated into a lectern at the the Computer Science lecture hall at Freie Universität Berlin. Right: Digitizer tablet (Wacom Graphire) used at a German
high school, the Erich-Hoepner-Oberschule in Berlin.
developed parts of the board lecture, giving the classroom audience more context
information, see Figure 8.4. Only the rightmost quarter of the display is used
by the lecturer for drawings. Allowing contents to be added to the other three
screens would result in problems with replay on displays with regular resolution.
The three passive windows shown in addition to the default E-Chalk screen
are realized as E-Chalk clients replaying the live stream. An Applet parameter2
causes them to display the content shifted vertically by one to three screen
heights. When the user scrolls the board, the E-Chalk live server sends the
action to the three clients, and all offsets are adjusted accordingly. The setup
with the three special board Applets is defined in a custom HTML template
(see Section 3.7) for the live setup. An optional E-Chalk configuration entry
specifies native commands to be executed directly before the recording session
starts, used in this case to launch a browser opening the live HTML page and
starting the three clients.
8.1.2
Uses for Remote Access
It is also possible to create a recording without an audience and to publish it
solely for remote access, see for example Figure 8.5. This approach has been
chosen by users to produce revision material of the subject, all well as extra
content to be learned as a homework, and in at least one occasion to replace a
class where a date collision occurred for the instructor.
The E-Chalk software can also be used for synchronous remote access to the
lecture. Apart from experimental seminars shared between remote locations,
there was also a regular lecture taught at Freie Universität Berlin from a remote
location. The instructor was in one place, the audience in another. To extend
the communication capabilities, E-Chalk was used in combination with a videoconferencing system. Voice and video image were transmitted two-way by video
conferencing and at the same time the board content was sent to the audience
by the E-Chalk server, see Figure 8.5. Board and lecturer’s voice were recorded
as an E-Chalk lecture.
2 See
yoffset parameter described in Section 7.2.5.
8.1. CASE STUDIES
147
Figure 8.4: Left: Geology seminar at Freie Universität Berlin using a rear projector with laser-tracked pen (Hitachi StarBoard R-70X) and several tablets
(Wacom Graphires). Right: The data wall constructed at the Computer Science department of Freie Universität Berlin.
Except for such special situations, however, the demand for live transmissions is marginal. Most students who do not visit the lecture prefer to view the
recording at a later time, especially as the live transmission does not really give
them an extra benefit. To add extra value to the live transmission, a communication tool like a chat line may be added to the HTML pages3 , perhaps even
with a lecturing assistant joining the chat.
According to feedback from learners, the preferred use of E-Chalk recordings
is exam preparation. The material is also used by learners who did never visit
the recorded lecture itself. A student at Fachhochschule Trier, for example,
used recordings of lectures on Neural Networks from Freie Universität Berlin to
prepare for his final exam and afterwards contacted the E-Chalk team members,
sending a bottle of wine to thank them. Also, at least one Berlin student was
not able to visit this very Neural Networks lecture due to lectures collisions,
but instead relied purely on the recordings, and successfully took an exam for
the lecture. Not only university students use the materials. The E-Chalk team
have also got reports from high-school students using the opportunity to take a
look at university lectures with the help of E-Chalk.
8.1.3
Replay on Hand-held Devices
The replay of E-Chalk recordings is also possible on hand-held devices. Although
a Java Runtime Environment is often not pre-installed, Java 1.1 can be set up
on PDAs by installing the Jeode Java Virtual Machine for Microsoft Pocket
PC from Esmertec [24]. This is sufficient to run the E-Chalk replay. The
same holds true for those mobile phones running Windows CE Pocket PC, see
Figure 8.6. Other Java-capable mobiles, for example those that run Symbian
OS, normally support only the Java 2 Micro Edition (J2ME). Running E-Chalk
on such devices would require a reimplementation of the client as Java Midlet.
The main problem with running E-Chalk on a mobile or a pocket PC is
the small display. Lectures recorded with a resolution used by standard PC
displays will be hard to follow on a hand-held device, requiring the user to
scroll a lot to the actual center of activity. For use with small screens, smart
3 This
can be easily done by editing the E-Chalk HTML templates, see Section 3.7.
148
CHAPTER 8. EXPERIENCES AND EVALUATION
Figure 8.5: Left: Using a microphone and a digitizer tablet, lessons can be created at home. Right: A lecture on robotics transmitted from Stanford University to Freie Universität Berlin by combining E-Chalk with a video-conferencing
solution.
Figure 8.6: The E-Chalk client running on a mobile phone.
display technologies still have to be added to the E-Chalk client. For example,
the image could be scaled using a kind of fish-eye view and the board could
automatically center the current area of changes.
8.2
Evaluations
Two field studies [Sch03, FKR+ 04b] have been conducted on university courses
to evaluate the use of E-Chalk, its impact on teaching, and its acceptance under
real-life conditions. These studies were arranged by media psychologists from
Freie Universität (FU) Berlin and Technische Universität (TU) Berlin. The
emphasis in the examinations lay on the explorative description of key questions,
such as the acceptance of the software and possible effects on the students’
motivation for studying. The evaluated courses were held at FU and TU Berlin.
The results are summarized in the following sections.
8.3. STUDIES DURING SUMMER TERM 2003
lecture title
Neural Networks
Introduction to Numerics
Calculus II for Engineers
Linear Algebra for
Engineers
Numerics for Engineers
Introduction to Physics
for Engineers
sum
university
FU
TU
TU
TU
TU
TU
approx.
class size
80
40
300
300
149
questionnaires
start
end
of term of term sum
36
24
60
18
0
18
117
0 117
94
0
94
50
300
50
113
36
107
86
220
1070
428
167
595
Table 8.1: Questionnaires returned from lectures having been evaluated during
the summer term of 2003.
8.3
Studies During Summer Term 2003
Methodology
The main source of data for the evaluation [Sch03] were questionnaires filled
out during the lectures. See Table 8.1 for a detailed listing. The TU Berlin
lectures were held in the context of an e-learning project named Moses [64]. As
the students were also asked to take part in evaluations for Moses and for the
regular teaching evaluation by the department, their load of questionnaires was
quite high. To avoid irritations, it was decided to skip the survey at the end of
the term for three of the lectures.
595 questionnaires were evaluated and 52 students were identified to have
answered the questions twice, at the start and at the end of the term. Their
responses were examined for changes of attitude.
The lectures at TU Berlin were held at the departments of Mathematics
and Physics. In his Introduction to Physics for Engineers, the instructor used
an LCD digitizer tablet for pen input, and the board image was shown to the
audience using an LCD projector. In the other four TU lectures, a digital
whiteboard with front projection was used together with a second projection
for the audience. This setup, installed at TU Berlin in several lecture halls, is
shown in Figure 8.2. Live transmission of the lecture was not provided, but the
board recordings were made available for replay together with the PDF version
of the board image. Audio was not recorded due to audio recording hardware
not being installed in the lecture halls at that time.
The surveyed FU lecture was held at the Computer Science department.
Here, E-Chalk was not used in classroom teaching. Instead, the lecturer used the
system to record the content of lectures in advance. The recording of board and
audio stream and the PDF transcript were made available for revision purposes.
All lecture materials were put into a learning-management system4 , which gave
some statistics on the student’s access to the materials as an additional data
source.
4 The
LMS used was Blackboard [4].
150
CHAPTER 8. EXPERIENCES AND EVALUATION
data source
595 questionnaires
observed group
ca. 1100 students
893 short
questionnaires
6 interviews
Web accesses to
E-Chalk material
ca. 900 students
6 instructors
80 FU students
notes
start (April/May) and end (July)
of summer term 2003
coupled with exam, July 2003
July 2003
by log file analysis for April to
July 2003
Table 8.2: Data gathered by the first evaluation on E-Chalk [Sch03].
All six lectures had an exam at the end of the term. To evaluate E-Chalk’s
influence on exam results, the participants were asked about how much preparation they had done for the exam. In addition to the surveys on the students’
opinions, the six lecturers were interviewed by the evaluator and asked their
opinions on, and experiences with, E-Chalk. An overview of the survey data
gathered is given in Table 8.2.
Findings
In the TU Berlin courses, the printable PDF was preferred to replay of lectures
by most students. The low popularity of the replay hardly came as a surprise,
as no audio signal was recorded at TU Berlin. Students at FU Berlin used the
PDF and the replay on an equivalent level.
According to the statements on the amount of remote use, the remote accesses intensified (in Introduction to Numerics and Neural Networks) or remained at a constant level (all other courses) during the term. This result
is supported by access statistics from the Neural Networks lecture, see for example Figure 8.7. The rising intensity probably indicates students’ preparation
for upcoming exams.
However, no significant correlation between exam results and E-Chalk use
could be found. In all user categories almost the same grade has been achieved,
compare Figure 8.8. The report suggests further examination by forming two
groups with the same external conditions differing only in the use of E-Chalk.
Adopting E-Chalk in teaching did reveal neither positive nor negative effects
on the students’ motivation to prepare for the lecture. The quality of the software was judged positively by the students. Didactic quality of the courses was
perceived well compared to regular courses, see Figure 8.9.5 Students welcomed
the extra flexibility in learning, both for increased independence in time and in
location.
There is a small tendency (below statistic significance), that students reduce
the amount of note-taking compared to regular courses.
Lecturers’ skills regarding software handling improved noticeably during the
term (statistically highly significant, i. e. an error probability of less than 1 %).
According to the interviews, time needed by lecturers to get fully accustomed,
5 The original German names of didactic categories in the questionnaire were Anschaulichkeit, Verständlichkeit, Nachhaltigkeit, Konzentration, Wissenszuwachs, Interaktion,
and generell.
8.3. STUDIES DURING SUMMER TERM 2003
151
Figure 8.7: Number of E-Chalk replay accesses in the evaluated FU Berlin
course from June, 10th, until the day of the exam on July, 14th.
ranged between one and four lectures. [Sch03] judges this as an indication for
the easy handling of the software.
The questionnaires included requests for commentaries, for advantages of
E-Chalk, for disadvantages of the system, and for suggested improvements.
The most frequently-mentioned advantage was a clear, readable board image (mentioned 189 times), followed by comments on remote access (73 times),
revision material (62 times), enhanced visualization facilities with Applets and
images (36 times), and the elimination of need for copying the board content
(26 times). A few students also noted that the lecture was easier to follow with
the system (15 times).
The most common complaint was concerning the stability of the system (61
times). This impression, however, is explained by a hardware problem in the
PC running E-Chalk in the main TU lecture hall. The PC, used exclusively for
E-Chalk lectures, had a faulty memory chip, frequently causing the OS or the
E-Chalk applications to crash. Unfortunately, the cause of this problem was
not identified until late in the term. However, the several damaged E-Chalk
recordings led to the development of the lecture repair tool described in Section
6.6.
Also common were complaints about the visual quality of the board image
(58 times, mainly remarks on resolution) and the relative size of the board (51
times). A likely cause for these shortcomings is the displayed resolution being
too low, forcing the instructor to write bigger letters for improved readability.
While the digitizer whiteboard hardware is theoretically able to recognize the
pen location way beyond the accuracy of the human hand6 , the resolution is
limited by the screen resolution of the projector and the controlling computer’s
graphics card. In fact, it is not even desirable to use very high resolution
here, as this would make the replay on computers with lower resolutions very
inconvenient, unless extra mechanisms for small-screen rendering are added to
the client, as discussed in the context of small screens in Section 8.1.3.
6 The
Numonics IPM whiteboard used in the lectures at TU locates the pen by electromagnetic induction with wires embedded in the board at a density of 300 per inch. In practice, the
accuracy is not limited by the hardware but by the calibration of the mapping between physical location and projection image, and estimation errors introduced by the driver software
doing this mapping.
152
CHAPTER 8. EXPERIENCES AND EVALUATION
Figure 8.8: Exam results in correlation with the usage of E-Chalk materials,
where 1.0 is the best grade.
Another frequent complaint was the bad handwriting of the instructor (40
times) and the missing audio in the TU Berlin recordings (20 times). Low
handwriting quality is likely to be due to the low resolution mentioned above.
Suggestions for improvements included, among others, the application of
integrated handwriting recognition, an additional projection of the former board
content (similar to the approach taken with the FU data wall, see Section 8.1.1),
a pointer or marker tool (discussed as a future addition in Section 9), and
displaying the current time. The latter feature was added to the system shortly
after the study by showing the recorded time duration or the local time in the
title of the board frame. Which of the two options is used can be configured in
the setup.
Other requests concerned distribution of lecture recordings on CD-ROM and
archives for E-Chalk material to make recordings from former terms available.
The lecturers interviews showed that most board features were used rarely,
except for the basic writing features and including of images. Instructors preferred the eraser to the undo function. However, switching between pen and
eraser for minor corrections was cumbersome. In reaction to these findings,
the possibility to toggle between eraser and drawing tool by the right mouse
button (equivalent to the extra button on the pen of the Numonics whiteboard
used in most TU lectures) was added.7 All lecturers used a black board background. Their preferred writing color was green, as it offered a good contrast
both to the black background on the board and to the white background of the
PDF transcript. There were some complaints about several colors having bad
contrast in the PDF due to the background color change and about the PDF
page separation running through writing. This caused the introduction of the
outline feature for the PDF contents (see Section 6.1.3) and a page-separation
algorithm that considered the vertical distribution of the contents (described in
Section 6.1).
Another suggestion for improvement was a preview function for images, realized as a thumbnail option for bookmarks.8 Lecturers would have liked to
7 This feature is active in the default setup, but can be deactivated, as some users have
trouble when hitting the extra button by accident, especially for the smaller pens that come
with digitizer tablets and Tablet PCs.
8 For image file chooser dialogs, a preview function still has to be added.
8.3. STUDIES DURING SUMMER TERM 2003
153
Figure 8.9: Average scores on aspects of didactic qualities of E-Chalk courses.
have personalized settings, which have now been implemented, see Section 3.1.2.
A Mathematics lecturer requested integration with Maple, as his department
worked with Maple instead of Mathematica. Again, this request has been implemented, see Section 4.6.2.
When questioned about advantages and disadvantages of the system, most of
the instructors’ answers were similar to the most frequent students’ comments.
In addition, they judged as being positive that the teaching content of traditional
classes needs no restructuring when presented with the system, enabling them
to reuse their old materials. Some lecturers missed the small pauses introduced
in traditional chalk lectures by the action of wiping the board.
Additional disadvantages were observed in the hardware setup. At TU
Berlin, both mobile and fixed digital whiteboard installations were tested. These
tests showed mobility not to be desirable. Even slight movements, possibly unintentional, required the whiteboard to be recalibrated. Even with fixed whiteboards, the lecturers faced the problem that they needed some time before each
lecture for calibration, because the whiteboard projector was not fixed. Another problem with front projection at TU was that instructors were sometimes
looking into the projector light when turning to the audience. While these problems could for example have been eliminated by a ceiling-mounted projector,
the layout of the TU lecture halls did not allow for this solution. Some lecturers
reported trouble with their own shadow hiding the projection while they were
working on the board. The problem was increased by the low distance of the
projector to the board, resulting in a big shadow.
As a consequence of these problems, most TU courses switched to the setup
with an LCD tablet as pen input, see Section 8.4.
Summary
The initial evaluation confirmed E-Chalk to be a beneficial and usable system
for teaching. A number of minor improvements have been added in response to
the evaluation feedback. Fundamental assumptions on the system’s conception
were confirmed by the main conclusions [Sch03, FKST04] of the study:
• Overhead work to use the software for lecturing is limited to the start of
the term for a setup.
• The lecturer can easily integrate material from previous terms.
154
CHAPTER 8. EXPERIENCES AND EVALUATION
lecture
linear algebra for engineers
computer-oriented mathematics
numerics I for engineers
differential equations for engineers
sum
term
without
E-Chalk
2001/02
2001/02
2002/03
2002/03
questionnaires
without with
E-Chalk E-Chalk sum
170
222 392
90
66 156
39
22
61
132
56 188
431
366 797
Table 8.3: Courses and number of returned questionnaires evaluated in the study
comparing E-Chalk courses during the winter term of 2003/04 with non-E-Chalk
courses of previous winter terms.
• Traditional chalkboard skills directly translate into skills for good E-Chalk
lectures.
• In practice, the use of plain drawings and writing predominates. Advanced
features like the integrated computer algebra system or calling CGI scripts
are only rarely used.
• If audio were recorded with the lecture, students made use of both replay
and PDF printouts on an equal level.
8.4
Studies During Winter Term 2003/04
Three more evaluation studies were performed during winter term of 2003/04,
covering E-Chalk courses at Freie Universität Berlin and Technische Universität
Berlin. More results of these studies can be found in [FKR+ 04b] and [FKR+ 04a].
8.4.1
Comparative Studies
Two studies compared E-Chalk courses to traditional ones. In the first of these
studies, there were exercise courses on the same subject (“design and analysis
of algorithms”) and held in the same term at the FU Berlin Computer Science
department, but differing in the teaching technique. One course was taught
with E-Chalk, the other with a traditional blackboard. The E-Chalk recordings
included audio and were made available on the Web for remote access.
The students were given the standardized VBVOR [Die98] questionnaire to
get their opinions on the course’s quality. In each courses, 20 questionnaires
were returned.
The results [FKR+ 04b] of this study yield favorable findings on E-Chalk.
The statement “In my opinion, the topic of the course is very expedient in
the context of my study” received a higher agreement in the E-Chalk course
and the statement “Too much content was covered in the course” received less
agreement with E-Chalk. Asked how often they attended the classes, there was
also a tendency to reduced presence in the E-Chalk classes. This result, which
might be judged favorably or not, is very likely a consequence of the supplied
8.4. STUDIES DURING WINTER TERM 2003/04
course
title
type
lecture linear algebra
lecture linear algebra
lecture computer-oriented mathematics
exercise design & analysis of algorithms
exercise design & analysis of algorithms
exercise design & analysis of algorithms
seminar cartography
seminar cartography
seminar cartography
sum
instructor
A
B
C
D
E
F
G
G
G
155
university
TU
TU
TU
FU
FU
FU
FU
FU
FU
questionnaires
127
37
65
11
16
9
10
15
13
303
Table 8.4: Courses and number of returned questionnaires for the quantitative
winter term 2003/04 study.
E-Chalk materials making it easier to revise material of a class one has missed.9
The second comparative study is based on the data of the evaluations performed every term at the department of Mathematics at Technische Universität
Berlin for all of its courses. The study compared earlier data on four courses
taught without E-Chalk with data of the same subject taught by the same
instructors but with E-Chalk in the winter term of 2003/04. For the classes
without E-Chalk, data returned by 366 students were gathered, for the E-Chalk
lectures, 431 questionnaires were filled out. See Table 8.3 for a detailed breakdown of the numbers. The main statistically significant results on E-Chalk
lectures are [FKR+ 04b]:
• Students judged E-Chalk classes to contain more repetition of relevant
subject matter. The distribution of grades shifted away from too little
repetition towards too much repetition.
• The instructor receives worse rating for his or her speech intelligibility.
Note that this concerns the speech in class as no audio was recorded.
Maybe the lecturers were too much involved in handling the E-Chalk technology, distracted from turning to the students and speaking out clearly.
• Students in E-Chalk lectures consider instructors’ board writing to be less
well structured. This is most likely a consequence of the real screen being
smaller than on a traditional board. For a discussion of this problem, see
discussion of commentaries in the main findings part of Section 8.4.2.
• A lower attendance rate at classes is highly significant (with an error
probability of less than 1 %).
9 The original German statements were “Das Thema dieser Veranstaltung halte ich im
Rahmen meines Studiums für sehr sinnvoll” and “In der Veranstaltung wurde zu viel Stoff
behandelt”. The question on the number of class attendances was “An wie vielen Sitzungen
der Veranstaltung haben Sie nicht teilgenommen? ”
156
CHAPTER 8. EXPERIENCES AND EVALUATION
Figure 8.10: Results on the technical equipment of students questioned in the
winter term of 2003/04 qualitative study. Left: Internet-access types. Right:
preferred Web browsers.
8.4.2
Qualitative Study on E-Chalk Courses
The evaluation target was to further explore how and when extra offers by
E-Chalk were really used by students and to get their opinions on the system. Questions were posed about the computer equipment of users, their usage
pattern of E-Chalk materials, and the quality of the software, both in general
and in comparison with other teaching technologies. Only the main findings
of the evaluation are presented here. A more detailed listing can be found
in [FKR+ 04b].
Evaluated Courses
Nine courses using E-Chalk were evaluated at Freie Universität Berlin and Technische Universität Berlin in the winter term of 2003/04. A total of 303 questionnaires were returned by students. Table 8.4 shows details on the type of the
courses and the number of returned questionnaires.
At TU, the lectures were given in the auditorium shown in Figure 8.2. The
lecturer wrote on a digitizer tablet with built-in LCD screen. The screen was
projected for the audience to read. As the auditorium was still not set up
for audio recording in that term, only board stream recording and PDF script
generation were provided on the Web. The seminars and tutorial courses at FU
were held in a seminar room with a rear projector, see Figure 8.4. The exercise
courses recorded board and audio and made the replay available for Web access
together with the PDF transcripts. For the three cartography seminars, E-Chalk
was exclusively used for classroom teaching. No recordings were made available
for distance teaching. In class, a number of digitizer tables at the students’
desks were used to allow the students to work on the screen from their seats.
The instructor used this to promote interactivity in his seminar. Without any
E-Chalk materials being published for these seminars, all questions on remote
usage were omitted in their questionnaires.
None of the nine evaluated courses offered live transmission of the class.
Main Findings
About 44 % of the students reported using a high-speed Internet access. About
a third still used a modem connection, see Figure 8.10. This is a good indicator of the importance of having only low-bandwidth requirements imposed by
8.4. STUDIES DURING WINTER TERM 2003/04
157
Figure 8.11: Note-taking behavior reported by students for E-Chalk classes in
comparison with regular classes.
Figure 8.12: Time reported to be spent doing revision with E-Chalk materials
in courses where recordings were published on the Web. The 53.2 % bar for zero
minutes per week has been omitted.
E-Chalk. Note that these numbers derive from questioning mainly students of
Computer Science, Mathematics, and Engineering subjects. In faculties with
the average students being less computer inclined, high-bandwidth connections
can be assumed to be even less common.
A Windows operating system was used by the overall majority (89 %), followed by Linux and Mac OS X. The dominant Web browser was the MS Internet
Explorer (66 %), with Mozilla/Netscape ranking second (21 %).10 No correlation exists between E-Chalk usage and bandwidth, thus it can be assumed that
E-Chalk is equally usable with any type of connection.11
Asking students about the amount of note-taking in E-Chalk classes compared to regular classes yielded about 60 % of students taking at least as many
notes in E-Chalk classes as in conventional classes. See Figure 8.11 for the distribution of answers. Note that this tendency seems to be contrary to that of
the summer-term evaluation.
10 Note that these figures were collected before mid-2004, when media reported a notable
loss in browser market share of the – still dominant – Internet Explorer. See for example [33].
11 The same holds true for comparing Internet Explorer users with Mozilla/Netscape users.
For other browsers, the numbers of mentions were too low to get any statistically significant
results. As to the operating system, the numbers for non-Windows systems were also too low
for comparison purposes.
158
CHAPTER 8. EXPERIENCES AND EVALUATION
Figure 8.13: PDF was preferred over replay, especially at TU, where no audio
was recorded.
Figure 8.14: Students’ opinions on the system’s impact on the organization of
their study.
About half of the students (46.8 %) reported using the E-Chalk materials
regularly for revising the classes. The average time spent revising including the
“zero minutes users” was 19 minutes per week. Considering only those students
who actually use E-Chalk for revision, the average was 40 minutes, the median
30 minutes. However, these figures should not be taken to literally, as they
display a high degree of variance. See Figure 8.12 for details.
When asked for the type of E-Chalk material mainly used for revision, most
students preferred the PDF over the replay, especially TU students, see Figure
8.13. Just as in the evaluation of the previous term, replay has been expected
beforehand to be unpopular among TU students, because the recordings did not
include audio.
The students were asked to judge the impact of the system on their studies,
whether it helped in or complicated learning. The answers showed a clearly
significant tendency towards a positive impact. The most favorable results were
observed for FU seminars, where the system was used for interactive teaching,
see Figure 8.14.
These answers were investigated as to a correlation with the preferred use
of lecture materials for revision. Those students who did not use any E-Chalk
material at all noticed no significant impact. The number of replay-preferring
users was too low to yield a significant correlation, but PDF users and learners
using both types of material expressed a clearly positive judgment, see Figure
8.15.
8.4. STUDIES DURING WINTER TERM 2003/04
159
Figure 8.15: Average values and their 95 % confidence intervals for opinions on
simplification, evaluated separately by preferred type of revision material.
The evaluation also examined the students’ opinions on the quality of the
system. The answers on visual impression showed a slight tendency towards
a favorable opinion, with no significant differences between classroom teaching
and replay. The acoustic quality of the instructor’s talk was judged positively
in classroom teaching12 , and got worse ratings for the replay, see Figure 8.16.
This result was a major motivation to enhance the audio recording quality in
E-Chalk by the approaches described in Section 5.2.
Despite the shortcomings in audio quality, the overall quality of the system
was clearly seen as positive, both in classroom teaching and in replay. Using
E-Chalk in the evaluated course received above-average marks from 73 % of all
students. See Figure 8.17 for a detailed breakdown of the proportions.
To compare E-Chalk with other teaching techniques, the students were asked
to judge, in a fictional comparison, between E-Chalk-taught classes and classes
using other teaching technologies. The comparison was made on courses using
electronic slide presentations like MS PowerPoint, traditional chalkboard teaching, and overhead slides. E-Chalk was favored above all these three teaching
media, with PowerPoint coming closest and overhead slides ranging last, see
Figure 8.18.
Finally, the students were asked to give commentaries on three categories, on
the advantages of the E-Chalk system, on its disadvantages, and on suggestions
for improvements. The most often repeated advantages include praising remarks
on the appearance and organization of the board content (79 times), remarks on
revision opportunities (71 times), that is is no longer necessary to copy the board
content (33 times), the improved visualization by using images and/or Applets
(28 times), the possibility of remote access (22 times), and the learners having
more time and concentration to follow the lecture (20 times). Further remarks
made at least five times were that it is no longer necessary to wipe the board
(19 times) and an improved adaption of the instructors’ speed to the audience
(7 times). Among the facts mentioned more than once users remarked that one
can scroll back to previously written content, the spontaneous and interactive
development of the classes, and an increased motivation of the learners.
12 Note that teaching with E-Chalk might have an impact on teachers’ speech intelligibility.
For example, using a microphone might change the lecturer’s speaking style. See also the
results on speech intelligibility from the second comparative study in Section 8.4.1, where
detrimental effects were observed.
160
CHAPTER 8. EXPERIENCES AND EVALUATION
Figure 8.16: Opinions on visual (left) and acoustic (right) quality, both in classroom and replay. Replay quality was only evaluated in those courses where the
associated streams were published on the Web.
Figure 8.17: Left: Answers on the overall quality of the system. Right: Ratings
for using E-Chalk in the evaluated course.
As to the disadvantages, a low readability of the instructors’ handwriting was
by far the most common complaint made (121 times), followed by criticizing the
visual qualities of the board image (24 times), for example demanding a higher
screen resolution, problems already discussed in the findings part of Section
8.3. However, the complaints about handwriting readability increased a lot.
Presumably this is caused by the change of pen-input hardware at Technische
Universität Berlin. While the accuracy of the LCD tablets seems to be high
enough for the resolution, it is supposed harder to produce clear handwriting
on a small screen than on the whiteboard, where bigger movements are used.
Some students remarked the board drawings to be not clearly laid out (15 times).
This is likely to be caused by both the resolution problem and the smaller size
of the digitizers and rear projectors compared to a traditional chalkboard. The
problem of visible board space itself was also criticized (9 times). This is a
problem not to be solved easily with off-the-shelf display technology, as the
aspect ratio of the projection is determined by the computer-screen ratio, and
the height of the board is limited by the instructor’s ability to reach the upper
part of the board. With special hardware setups, one can provide more display
space in the classroom, as shown in Section 8.1.1. For remote access by standard
PCs, this introduces the need of mechanisms to fit more board content onto a
small screen, compare Section 8.1.3.
Other remarks given at least five times are no recording of audio (at TU,
mentioned 11 times), and the lecturing speed being slowed down (5 times).
As to improvement suggestions, a demand for a higher screen resolution
8.4. STUDIES DURING WINTER TERM 2003/04
161
Figure 8.18: Students’ opinions on teaching with E-Chalk compared to using
other types of lecturing tools: to traditional chalkboards, to PowerPoint, and
to overhead slides.
appeared again (14 times). Training for instructors on using E-Chalk was requested (9 times), and a few features have already been considered for future
work13 , like a marker tool (requested 2 times), a feature for using backgrounds
like lined and grid paper (4 times), and transmission of the cursor (4 times).
Handwriting recognition, which is already integrated for some purposes14 , and is
planned to completely replace the need of the keyboard for all E-Chalk controls
in the future, was the most common request (21 times).
Almost all additional commentaries were requests for features which were
already fully supported, but not used in the evaluated lecture, like changing
colors used (11 times, for example switching to a dark gray background), demands that instructors use or increase their usage of images, animations, and
Applets (8 times), recording of audio (4 times), adding a scrollbar to the board
(3 times), download possibilities of the recording (requested 2 times, was available in all TU lectures, and in some of the FU courses), a bigger drag point (2
times, already adjustable in the setup), and recording of video (1 time).
13 See
Chapter 9.
recognition is only integrated in the system so far for calculations, see Section
4.8, and in experimental usage for indexing purposes, see Section 6.8.
14 Handwriting
162
CHAPTER 8. EXPERIENCES AND EVALUATION
Chapter 9
Outlook
Much good work is lost for the lack of a little more.
Edward H. Harriman
The system has already been extensively evaluated in university settings and,
to a lesser extent, in K-12 schools. For other application scenarios, however, an
evaluation study has not been conducted yet. Also, the impact of the new audio
system on the perceived quality still has to be systematically validated.
As mentioned before, a number of possible future improvements have already been identified, like a more intelligent page-breaking algorithm in PDF
production and many other useful improvements, for example providing board
backgrounds with lines, grids, and logarithmic chart-paper-style patterns. Beyond minor features to be added, research is desirable on the following points.
Methods for Keyboard Input on the Board
The need for using keyboard in the board environment should be completely
eliminated. An obvious solution would be to integrate a general handwriting
recognition feature. However, reaching a satisfying level of recognition reliability
is difficult unless the user is required to learn a special alphabet, like Unistroke.
Integrating a software keyboard is not an adequate option since operation on
an E-Chalk board is still too awkward. Instead, using hierarchical pie menus1
may be a more viable option. See Section 1.4 for a description of employing pie
menus for key input.
Transmitting the Board Pointer
A feature sometimes requested by instructors and learners alike was a pointer
or semi-transparent marker tool for the board. Some instructors use the system’s mouse pointer for referencing. While visible in the classroom lecture,
the action is not stored for remote access. However, having to operate with a
mode for pointing would put an extra burden on the instructor. Very likely the
1 Pie menu variants implementing hierarchical organization, called marking menus, are
protected by patent [KF98]. They are often used in gesture-based interfaces. The menu is
only displayed for beginning users and kept invisible for expert users, who have already learned
the stroke movements for different options.
163
164
CHAPTER 9. OUTLOOK
teacher would often forget about the tool. The developers of Classroom Presenter reported, for example, that in practice none of their instructors found a
semi-transparent highlighter useful [AAS+ 04].
A better approach is to record the mouse pointer all the time. Displaying it
on the client side would fit into the philosophy of delivering the same information
to the learner in the classroom and to the remote user. It does not require the
lecturer to adapt his or her teaching to the technical requirements of the remote
viewer. Constantly capturing the mouse pointer position results in extra data
to be transmitted, but the data volume in question does not exceed the levels
reached for drawing events. As shown in the bandwidth analysis in Section
4.10.1, the actual data volume is negligible given the event rates delivered by
standard pointing devices.
Chalklet Support
The chalklet concept is a quite recent addition to the E-Chalk system and
therefore the API library for chalklet developers and the underlying chalklet
management are at an early stage of development.
In the future, chalklet code should be restricted using Java security mechanisms like the java.lang.SecurityManager. The execution of chalklets should
be secured by concepts similar to Java Applet execution is in browsers, running
them in a secure “sandbox”. This would protect the main E-Chalk application
against malignant chalklets, for example preventing chalklets from terminating
the whole application by calling System.exit(int). However, some restrictions
posed on Applets like prohibiting file access and very restricted network access
might turn out to be too restrictive for productive chalklet programming. This
will have to be examined in detail.
Changing the uncompressed ASCII board event format to a binary format
with differential encoding would allow to relax the limits of maximum event
rates on chalklets (and macros) without running the risk of exceeding bandwidth
limitations, see Section 4.10.1.
“Functional chalklets” may even be created so as to encompass existing
drawings on the board and then perform particular actions on these drawings
or even on the output of previously executed chalklets.2
To assist in chalklets development, the supporting API should be extended.
Methods are to be provided to conveniently create Stroke objects for basic
geometric shapes (boxes, circles, etc.) and for printing texts, perhaps even in a
handwritten style.3
Ideally, a recognition engine for strokes should become part of the API to
support complex interpretations of stroke input to chalklets. Geometric interpretation of freehand sketching is already an active research area, often in the
context of pen-active whiteboards with office-type applications. For example,
the SATIN [HL00] Java toolkit is a framework for pen-based applications which
processes both stroke objects and stroke gestures. Example applications built
on top of SATIN are DENIM [LNHL00] for building Web pages by sketching,
SketchySPICE [HL00] as a simple-circuit CAD tool and SILK [HLLM02] for
prototyping user interfaces by sketching.
2 This
3 See
feature was suggested by [Wat04].
handwriting synthesis description in Section 6.11.
165
At MIT, another framework for sketch recognition was developed [Sez01,
HD04], including a description language for drawings called LADDER [HD03].
Applications realized with the framework include Tahuti [HD02] for creating
UML diagrams by sketches and ASSIST [AD01], a sketch-based CAD system.
Another example of a stroke-based interface is Flatland [MIEL99, MIEL00],
described in Section 1.5.4.
Improvements to Replay
In addition to the standard VCR operations provided for replay, it would be
useful to provide a kind of spatial control for the board stream. A scaled-down
version of the final board content could well be provided. The learner should
then be able to jump to the time offset at which selected board content was
created. This would enable users to navigate in the lecture to a subject without
having to search along the time line.
Small-screen rendering techniques should be applied to enable replay on
platforms that offer only resolutions lower than the one used for the recorded
board, see Section 8.1.3. Possible approaches include automatic scrolling to currently changed content and fish-eye-view techniques. This would enable replay
on hand-held devices as well as recording with high-resolution hardware.
166
CHAPTER 9. OUTLOOK
Chapter 10
Conclusion
“Lectures,” said McCrimmon, “are our most flexible art form. Any
idea, however slight, can be expanded to fill fifty-five minutes; any
idea, however great, can be condensed to that time. And if no ideas
are available, there can always be discussion. Discussion is the vacuum that fills a vacuum. If no one comes to your lectures or seminars, you can have a workshop and get colleagues involved. They
have to come, and your reputation as an adequately popular teacher
is saved.”
John Kenneth Galbraith, A Tenured Professor
The system presented here offers the possibility of producing distance lectures as a by-product of classroom teaching. The approach avoids the huge
costs normally involved in courseware production. Instructors are not required
to adapt their traditional teaching style for the sake of producing distancelearning materials. However, for teachers who want to enrich their lessons with
multimedia elements, the system provides a range of options from plain images
to interactive animations.
The board is a new GUI metaphor. At the time being, the desktop is the
dominating user interface, a metaphor being designed for the small, personal
screen that is part of the usual work desk. Even pen-computing approaches,
which have become popular recently, are considered mainly for personal displays.
In a teaching situation, where a large display may be observed by a larger
audience, the board is the proper metaphor. This way, the relation between
teaching tool, teacher, and students is preserved, which has been proven to be
valuable for centuries. The audience can track the instructor’s developing the
subject on the board. The technical implementation of the teaching device is
formed by the pedagogical needs, instead of letting the device be purely driven
by the technical development.
The E-Chalk system has been widely used and it has been tested in a broad
range of real-life teaching. Both the anecdotic evidence and the systematic evaluation proves the system to be an added value in classroom teaching as well as
for a number of distance-teaching scenarios. The evaluation studies show it to
be easy to use, and that skills in traditional chalk lecturing transfer well into
teaching with E-Chalk. The studies give a solid base to the assumptions on
the advantage of the approach. A number of possible improvements has been
167
168
CHAPTER 10. CONCLUSION
identified, many of them have already been implemented in the system, some
of them are still under development. The most important need for enhancement was identified in the audio playback quality, which has been considerably
improved by a number of different techniques.
The distance lectures are not substituting classroom teaching but supporting
it. Students are helped to revise the materials with a living and active script.
The remote viewer does not have to be familiar with any technical details to
receive the lecture. Only a browser is needed and no special software has to be
installed. All substantial information in the form of audio and dynamic board
image can be received using low-bandwidth connections.
Bibliography
[AAS+ 04]
Richard Anderson, Ruth Anderson, Beth Simon, Steven A. Wolfman, Tammy VanDeGrift, and Ken Yasuhara. Experiences with a
tablet PC based lecture presentation system in computer science
courses. In Proceedings of the 35th SIGCSE technical symposium
on Computer science education, pages 56–60, Norfolk (VA), USA,
March 2004. ACM press.
[AAV+ 03]
Richard Anderson, Ruth Anderson, Tammy VanDeGrift,
Steven A. Wolfman, and Ken Yasuhara. Promoting interaction
in large classes with computer-mediated feedback. In Proceedings
of the Computer Support for Collaborative Learning (CSCL) 2003,
pages 119–123, Bergen, Norway, June 2003.
[Abo99]
Gregory D. Abowd. Classroom 2000: An experiment with the
instrumentation of a living educational environment. IBM Systems Journal, Special Issue on Pervasive Computing, 38(4):508–
530, October 1999.
[AD01]
Christine Alvarado and Randall Davis. Resolving ambiguities to
create a natural computer-based sketching environment. In Proceedings of the International Joint Conference on Artificial Intelligence (IJCAI), Seattle (WA), USA, August 2001.
[Ado03]
Adobe Systems Inc. PDF Reference, Version 1.5, fourth edition,
August 2003.
[aha93]
aha! Software corporation. aha! Inkwriter Handbook. Mountain
View (CA), USA, 1993.
[AHP+ 04a]
Richard Anderson, Crystal Hoyer, Craig Prince, Jonathan Su,
Fred Videon, and Steven A. Wolfman. Speech, ink and slides:
The interaction of content channels. In Proceedings of the Twelfth
ACM International Conference on Multimedia 2004, pages 796–
803, New York (NY), USA, October 2004. ACM press.
[AHP+ 04b] Richard Anderson, Crystal Hoyer, Craig Prince, Jonathan Su,
Fred Videon, and Steven A. Wolfman. A study of digital ink
in lecture presentation. In Proceedings of the conference on Human factors in computing systems (CHI), pages 567–574, Vienna,
Austria, April 2004. ACM press.
169
170
BIBLIOGRAPHY
[And04]
Richard Anderson. Beyond PowerPoint: Building a new classroom
presenter. Syllabus Magazine, pages 31–33, June 2004.
[App87]
Apple Computer Inc. Apple Human Interface Guidelines: The
Apple Desktop Interface. Addison-Wesley, 1987.
[App92]
Apple Computer Inc. MacIntosh Human Interface Guidelines.
Addison-Wesley, 1992.
[App93]
Apple Computer Inc., Cupertino (CA), USA. Newton, Apple MessagePad Handbook, 1993.
[App01a]
Apple Computer Inc. Inside Mac OS X: Aqua Human Interface
Guidelines, October 2001.
[App01b]
Apple Computer, Inc. Inside QuickTime: QuickTime File Format,
March 2001. Specification of the QuickTime file format.
[Baa88]
Bernard J. Baars. A Cognitive Theory of Consciousness. Cambridge University Press, Cambridge, UK, 1988.
[BAT99]
Jason A. Brotherton, Gregory D. Abowd, and Khai N. Truong.
Supporting capture and access interfaces for informal and opportunistic meetings. Technical Report GIT-GVU-99-06, GVU Center, Georgia Institute of Technology, January 1999.
[BBJ+ 98]
Michael J. Black, François Bérard, Allan D. Jepson, William Newman, Eric Saund, Gudrun Socher, and Michael Taylor. The digital
office: Overview. In Proceedings of the 1998 American Association
for Artificial Intelligence (AAAI) Spring Symposium on Intelligent
Environments, Palo Alto (CA), USA, March 1998.
[BBW04]
Dave Berque, Terri Bonebright, and Michael Whitesell. Using penbased computers across the computer science curriculum. In Proceedings of the thirty-fifth SIGCSE technical symposium on Computer science education, pages 61–65, Norfolk (VA), USA, March
2004. ACM Press. session on new technologies for classroom instruction.
[BCD+ 98]
Carsten Bormann, Linda S. Cline, Gim Deisher, Tom Gardos,
Christian Maciocco, Donald Newell, Jörg Ott, Gary Sullivan,
Stephan Wenger, and Chad Zhu. RFC 2429: RTP Payload Format for the 1998 Version of ITU-T Rec. H.263 Video (H.263+).
IETF/IESG, October 1998.
[BCP99]
Narcisse P. Bichot, Kyle R. Cave, and Harold Pashler. Visual
selection mediated by location: Feature-based selection of noncontiguous locations. Perception & Psychophysics, 61(3):403–423,
1999.
[BG96]
Dorothea Blostein and Ann Grbavec. Recognition of mathematical
notation. In P. S. P. Wang and H. Bunke, editors, Handbook on
Optical Character Recognition and Document Analysis, chapter 22.
World Scientific Publishing Company, Singapore, 1996.
BIBLIOGRAPHY
171
[BGL96]
Freimuth Bodendorf, Robert Grebner, and Christian Langenbach.
The virtual lecture theatre – practice and experience. In Proceedings of the second Russian-German Symposium, New Media
for Education and Training in Computer Science, pages 33–40,
Moscow, Russia, November 1996. Infix Verlag.
[Bia98]
Michael H. Bianchi. AutoAuditorium: A fully automatic, multicamera system to televise auditorium presentations. In Proceeding
of the Joint DARPA/NIST Smart Spaces Technology Workshop,
Gaithersburg (MD), USA, July 1998. NIST.
[BJJ01]
Dave Berque, David K. Johnson, and Larry Jovanovich. Teaching theory of computation using pen-based computers and an
electronic whiteboard. In Proceedings of the sixth annual conference on Innovation and technology in computer science education (ITiCSE), pages 169–172, Canterbury, UK, June 2001. ACM
press.
[BKT02]
Wayne Burleson, Stephen Kelley, and Santhosh Thampuran. A
new course in multimedia systems for non-technical majors. In
ASEE Annual Conference Proceedings, Montréal, Canada, June
2002. American Society for Engineering Education.
[BLFN96]
Tim Berners-Lee, Roy T. Fielding, and Henrik Frystyk
Nielsen. RFC 1945: Hypertext Transfer Protocol – HTTP/1.0.
IETF/IESG, May 1996.
[BO96]
Christian Bacher and Thomas Ottmann. Tools and services for
authoring on the fly. In Proceedings of the Conference on Educational Multimedia and Hypermedia (ED-Media), pages 7–12,
Boston (MA), USA, June 1996.
[Bol79]
Steven F. Boll. Supression of acoustic noise in speech by spectral
substraction. IEEE Transactions on Acoustics, Speech, and Signal
Processing, 28(2):113–120, April 1979.
[BP94]
Chris Buckalew and Alan Porter. The lecturer’s assistant. In
Proceedings of the twenty-fifth technical symposium on Computer
science education (SIGCSE), volume 26(1) of SIGCSE Bulletin,
pages 193–197, Phoenix (AR), USA, March 1994. ACM press.
[BPSM+ 04] Tim Bray, Jean Paoli, C. Michael Sperberg-McQueen, Eve Maler,
and François Yergeau. Extensible Markup Language (XML) 1.0.
W3C Recommendation, third edition, February 2004.
[Bre77]
Jack Bresenham. A linear algorithm for incremental digital display of circular arcs. Communications of the ACM, 20:100–106,
February 1977.
[Bro01]
Jason A. Brotherton. Enriching Everyday Experiences through
the Automated Capture and Access of Live Experiences. eClass:
Building, Observing and Understanding the Impact of Capture and
Access in an Educational Domain. PhD thesis, Georgia Tech,
College of Computer, December 2001.
172
BIBLIOGRAPHY
[Byr00]
Deborah Byrne. Make text more readable for older people. The
Backgrounder, Oregon State University Extension and Experiment
Station Communications, pages 1–2, November/December 2000.
[Cha70]
Shi-Kuo Chang. A method for the structural analysis of twodimensional mathematical expressions. Information Sciences,
2(3):253–272, 1970.
[CKRW99]
Patrick Chiu, Ashutosh Kapuskar, Sarah Reitmeier, and Lynn
Wilcox. NoteLook: taking notes in meetings with digital video
and ink. In Proceedings of the seventh ACM international conference on Multimedia (Part 1), pages 149–158. ACM Press, October/November 1999.
[Cla98]
Louise Clark. Introduction to Multimedia Conferencing and the
SHRIMP Tools, October 1998.
[Cla99]
Richard E. Clark. The cognitive sciences and human performance
technology. In Harold D. Stolovitch and Erica J. Keeps, editors, Handbook of Human Performance Technology: Improving
Individual and Organizational Performance Worldwide, chapter 5.
ISPI/Jossey-Bass/Pfeiffer, San Francisco (CA), USA, second edition, March 1999.
[CMMS03]
Tongbo Chen, Mingchao Ma, Christoph Meinel, and Volker
Schillings. A novel approach to e-learning content creation. In
Proceedings of the Second International Conference on Multimedia and Information & Communication Technologies in Education
(m-ICTE), pages 410–414, Badajoz, Spain, December 2003.
[Com82]
Commodore Business Machines. Commodore 64 User Manual,
1982.
[Com87]
CompuServe Inc. Graphics Interchange Format (tm), A standard
defining a mechanism for the storage and transmission of rasterbased graphics information, June 1987.
[Com90]
CompuServe Inc. Graphics Interchange Format (sm), Version 89a,
Programming Reference, July 1990.
[Cre97]
Tom Creed. PowerPoint no! Cyberspace, yes. The National Teaching & Learning Forum (NTFL), 6(4):1–4, 1997.
[CS91]
Robert Carr and Dan Shafer. The Power of PenPoint. AddisonWesley, Reading (MA), USA, February 1991.
[CY00]
Kam-Fai Chan and Dit-Yan Yeung. Mathematical expression
recognition: a survey. International Journal on Document Analysis and Recognition (IJDAR), 3(1):3–15, 2000.
[DC97]
Roger B. Dannenberg and Peter Capell. Are just-in-time lectures
effective at teaching? Technical report, Carnegie Mellon University, School of Computer Science, Pittsburgh (PA), USA, June
1997.
BIBLIOGRAPHY
173
[DC01]
Andrew Deitsch and David Czarnecki. Java Internationalization,
chapter 4, pages 67–75. O’Reilly, March 2001.
[Deu96]
L. Peter Deutsch. RFC 1951: DEFLATE Compressed Data Format Specification version 1.3. IETF/IESG, May 1996.
[DG96]
L. Peter Deutsch and Jean-Loup Gallier. RFC 1950: ZLIB Compressed Data Format Specification version 3.3. IETF/IESG, May
1996.
[Dic97]
Michael Dickreiter. Handbuch der Tonstudiotechnik, volume 1.
K.G. Saur, Munich, Germany, sixth edition, 1997.
[Die98]
Jörg M. Diehl. Fragebögen zur studentischen Evaluation von
Hochschulveranstaltungen. Justus-Liebig-Universität, department
of psychology, Giessen, Germany, 1998. Manual und Auswertungsprogramm zum VBVOR und VBREF, Lehrevaluation [Sp-6].
[Die03]
Michael Diener. Lichtpunkterkennung per Kamera an einer Rückprojektionswand: Ein Lichtgriffel für E-Chalk. Bachelor’s thesis,
Fachbereich Mathematik und Informatik, Freie Universität Berlin,
2003.
[DLC+ 99]
Richard C. Davis, James A. Landay, Victor Chen, Jonathan
Huang, Rebecca B. Lee, Frances C. Li, James Lin, Charles B.
Morrey, III, Ben Schleimer, Morgan N. Price, and Bill N. Schilit.
NotePals: lightweight note sharing by the group, for the group. In
Proceedings of the Conference on Human Factors in Computing
Systems (CHI), pages 338–345, Pittsburgh (PA), USA, May 1999.
ACM Press.
[DSA01]
Anind K. Dey, Daniel Salber, and Gregory D. Abowd. A conceptual framework and a toolkit for supporting the rapid prototyping of context-aware applications. Human-Computer Interaction
Journal, 16(2–4):97–166, 2001. Anchor article of special issue on
context-aware computing.
[EGE97]
Andreas Eckert, Werner Geyer, and Wolfgang Effelsberg. A distance learning system for higher education based on telecommunications and multimedia. In Proceedings of World Conference on
Educational Multimedia and Hypermedia (ED-MEDIA), Calgary,
Canada, June 1997.
[EILM00]
W. Keith Edwards, Takeo Igarashi, Anthony LaMarca, and Elizabeth D. Mynatt. A temporal model for multi-level undo and redo.
In Proceedings of the thirteenth annual ACM symposium on User
interface software and technology (UIST), pages 31–40, San Diego
(CA), USA, November 2000. ACM press.
[EPT+ 92]
Scott Elrod, Ken Pier, John Tang, Brent Welch, Richard Bruce,
Rich Gold, David Goldberg, Frank Halasz, William Janssen, David
Lee, Kim McCall, and Elin Pedersen. Liveboard: A large interactive display supporting group meetings, presentations and remote
174
BIBLIOGRAPHY
collaboration. In Proceedings of the conference on Human factors in computing systems (CHI), pages 599–607, Monterey (CA),
USA, May 1992. ACM press.
[Eri94]
Hans Eriksson. MBone: The multicast backbone. Communications of the ACM, 37(8):54–60, August 1994.
[Esp04]
Margarita Esponda Argüero. A New Algorithmic Framework for
the Classroom and for the Internet. PhD thesis, Freie Universität
Berlin, Institut für Informatik, August 2004.
[Eul04]
Stefanie Eule. Interaktive Whiteboards in Berliner Schulen –
Chancen und Probleme eines neuen Mediums. Magister’s thesis,
Fachbereich Erziehungswissenschaft und Psychologie, Freie Universität Berlin, June 2004.
[EW90]
David B. Elliott and David Whitaker. Decline in retinal function
with age. Investigative Ophthalmology Visual Science, 31(4):357,
1990.
[FGM+ 97]
Roy T. Fielding, Jim Gettys, Jeffrey C. Mogul, Henrik Frystyk
Nielsen, and Tim Berners-Lee. RFC 2068: Hypertext Transfer
Protocol – HTTP/1.1. IETF/IESG, January 1997.
[FGM+ 99]
Roy T. Fielding, Jim Gettys, Jeffrey C. Mogul, Henrik Frystyk
Nielsen, Larry Masinter, Paul J. Leach, and Tim Berners-Lee.
RFC 2616: Hypertext Transfer Protocol – HTTP/1.1 (update).
IETF/IESG, June 1999.
[Fit54]
Paul M. Fitts. The information capacity of the human motor
system in controlling the amplitude of movement. Journal of Experimental Psychology, 47(6):381–391, June 1954.
[FJHW00]
Armando Fox, Brad Johanson, Pat Hanrahan, and Terry Winograd. Integrating information appliances into an interactive
workspace. IEEE Computer Graphics & Applications, 20(3):54–
65, May/June 2000.
[FJK04a]
Gerald Friedland, Kristian Jantz, and Lars Knipping. Conserving
an ancient art of music: Making SID tunes editable. In Lecture
Notes in Computer Science, volume 2771, pages 290–296. Springer
Verlag, Heidelberg, Germany, May 2004.
[FJK04b]
Gerald Friedland, Kristian Jantz, and Lars Knipping. Towards
automatized studioless audio recording: A smart lecture recorder.
Technical Report B-04-14, Fachbereich Mathematik und Informatik, Freie Universität Berlin, September 2004.
[FKR02]
Gerald Friedland, Lars Knipping, and Raúl Rojas. E-chalk technical description. Technical Report B-02-11, Fachbereich Mathematik und Informatik, Freie Universität Berlin, May 2002.
BIBLIOGRAPHY
175
[FKR03]
Gerald Friedland, Lars Knipping, and Raúl Rojas. Mapping the
classroom into the web: Case studies from several institutions. In
András Szüks, Erwin Wagner, and Costas Tsolakidis, editors, The
Quality Dialogue: Integrating Cultures in Flexible, Distance and
eLearning, pages 480–485, Rhodes, Greece, June 2003. Twelfth
EDEN Annual Conference, European Distance Education Network.
[FKR+ 04a]
Gerald Friedland, Lars Knipping, Raúl Rojas, Joachim Schulte,
and Christian Zick. Die E-Chalk-Software: Einsatz und Evaluation in Präsenzunterrichts- und e-Learning-Szenarien. In Proceedings of the First Potsdamer Multimedia Conference, Potsdam,
Germany, October 2004.
[FKR+ 04b] Gerald Friedland, Lars Knipping, Raúl Rojas, Joachim Schulte,
and Christian Zick. Evaluationsergebnisse zum Einsatz des EKreide Systems im Wintersemester 2003/2004. Technical Report
B-04-06, Fachbereich Mathematik und Informatik, Freie Universität Berlin, June 2004.
[FKRT03]
Gerald Friedland, Lars Knipping, Raúl Rojas, and Ernesto Tapia.
Web based education as a result of AI supported classroom teaching. In Knowledge-Based Intelligent Information and Engineering
Systems: Seventh International Conference, KES 2003 Oxford,
UK, September 3-5, 2003 Proceedings, Part II, volume 2774 of Lecture Notes in Computer Sciences, pages 290–296. Springer Verlag,
September 2003.
[FKRT04]
Gerald Friedland, Lars Knipping, Raúl Rojas, and Ernesto Tapia.
Teaching with an intelligent electronic chalkboard. In Proceedings of ACM Multimedia (SIGMM 2004), Workshop on Effective
Telepresence, pages 16–23, New York (NY), USA, October 2004.
ACM press.
[FKST04]
Gerald Friedland, Lars Knipping, Joachim Schulte, and Ernesto
Tapia. E-Chalk: A lecture recording system using the chalkboard
metaphor. Interactive Technology and Smart Education (ITSE),
1(1):9–20, February 2004.
[FKT04]
Gerald Friedland, Lars Knipping, and Ernesto Tapia. Web based
lectures produced by AI supported classroom teaching. International Journal of Artificial Intelligence Tools (IJAIT), 13(2):367–
382, 2004.
[FL98]
Gerald Friedland and Tobias Lasser. World Wide Radio - Audio Live Übertragung durch das Internet. Technical report, Bundeswettbewerb Jugend forscht e.V., Hamburg, Germany, 1998.
[FP04]
Gerald Friedland and Karl Pauls. SOPA - self organizing processing and streaming architecture. Technical Report B-04-13, Institut
für Informatik, Freie Universität Berlin, August 2004.
176
BIBLIOGRAPHY
[Fri02a]
Gerald Friedland. Towards a generic cross platform media editor: An editing tool for e-chalk. Diploma’s thesis, Fachbereich
Mathematik und Informatik, Freie Universität Berlin, May 2002.
[Fri02b]
Gerald Friedland. Towards a generic cross platform media editor: An editing tool for e-chalk (abstract). In Proceedings of the
fourth Informatiktage 2002, Bad Schussenried. Gesellschaft für Informatik e.V., November 2002.
[Gat03]
Bill and Melinda Gates Foundation. Access for the vision impaired,
April 2003.
[GD96]
Mark D. Gross and Ellen Yi-Luen Do. Ambiguous intentions: a
paper-like interface for creative design. In Proceedings of the ninth
Annual Symposium on User Interface Software and Technology
(UIST), pages 183–192, Seattle (WA), USA, November 1996. ACM
press.
[Gei98]
Jörg Geißler. Shuffle, throw, or take it! working efficiently with
an interactive wall. In Clare-Marie Karat, Arnold Lund, Joëlle
Coutaz, and John Karat, editors, Proceedings of the Conference
on Human Factors in Computing Systems (CHI), pages 265–266,
Los Angeles (CA), USA, April 1998. ACM press.
[GHJV95]
Erich Gamma, Richard Helm, Ralph Johnson, and John Vlissides.
Design Patterns, Elements of Reusable Object-Oriented Software.
Addison-Wesley, 1995.
[GM93]
David Goldberg and Catherine McCartin. Touch typing with a
stylus. In Proceedings of the conference on Human factors in
computing systems (INTERCHI), pages 80–87, Amsterdam, The
Netherlands, April 1993. ACM press.
[GM96]
James Gosling and Henry McGilton. The Java Language Environment. Sun Microsystems, May 1996. White Paper.
[GMW01]
François Guimbretière, Andrew Martin, and Terry Winograd.
Measuring FlowMenu performance. Technical Report CS-TR2001-02, Stanford University, Department of Computer Science,
September 2001.
[Gol97]
David Goldberg. United States Patent No. 5,596,656: Unistrokes
for computerized interpretation of handwriting, 1997. Xerox Corporation, filed October 26, 1995. Ruled invalid due to prior art by
Judge Michael A. Telesca of the United States District Court for
the Western District of New York on May 21, 2004.
[GSW01]
François Guimbretière, Maureen Stone, and Terry Winograd.
Fluid interaction with high-resolution wall-size displays. In Proceedings of the fourteenth annual ACM symposium on User interface software and technology (UIST), pages 21–30, Orlando (FL),
USA, November 2001. ACM press.
BIBLIOGRAPHY
177
[Gui02]
François Guimbretière. Fluid Interactions for Wall-Size Displays.
PhD thesis, Stanford University, Department of Computer Science, January 2002.
[GW00]
François Guimbretière and Terry Winograd. FlowMenu: combining command, text, and data entry. In Proceedings of the thirteenth
annual ACM symposium on User interface software and technology
(UIST), pages 213–216, San Diego (CA), USA, November 2000.
ACM press.
[GWW00]
François Guimbretière, Terry Winograd, and Sha Xin Wei. The
geometer’s workbench: An experiment in interacting with a large,
high resolution display. Technical Report CS-TR-2000-05, Stanford University, Department of Computer Science, May 2000.
[Hay03]
Simon Haykin. Cocktail party phenomenon: What is it, and how
do we solve it? In European Summer School on ICA, Berlin,
Germany, June 2003.
[HC04a]
Richard S. Hall and Humberto Cervantes. Challenges in building service-oriented applications for OSGi. IEEE Communications
Magazine, 42(5):144–149, May 2004.
[HC04b]
Richard S. Hall and Humberto Cervantes. An OSGi implementation and experience report. In Proceedings of the First IEEE
Consumer Communications and Networking Conference (CCNC),
Las Vegas (NV), USA, January 2004.
[HD02]
Tracy Hammond and Randall Davis. Tahuti: A geometrical sketch
recognition system for uml class diagrams. In Tom Stahovich,
James Landay, and Randall Davis, editors, Papers from 2002
AAAI Spring Symposium on Sketch Understanding, pages 59–66,
Palo Alto (CA), USA, March 2002. AAAI Press. Technical Report
SS-02-08.
[HD03]
Tracy Hammond and Randall Davis. LADDER: A language to
describe drawing, display, and editing in sketch recognition. In
Proceedings of the Eighteenth International Joint Conference on
Artificial Intelligence (IJCAI), pages 461–467, Acapulco, Mexico,
August 2003. Morgan Kaufmann Publishers.
[HD04]
Tracy Hammond and Randall Davis. Automatically transforming symbolic shape descriptions for use in sketch recognition. In
Proceedings of the Nineteenth National Conference on Artificial
Intelligence (AAAI), pages 450–456, Pittsburgh (PA), USA, July
2004.
[Hen98]
Norman Hendrich. HADES: The Hamburg design system. In
EASA’98 (European Academic Software Award)/ Alt-C Conference: Lifelong Learning on a Connected Plane, Oxford, UK,
September 1998.
178
BIBLIOGRAPHY
[HK98]
Sowon Hahn and Arthur F. Kramer. Further evidence for the
division of attention among non-contiguous locations. Visual Cognition, 5(1-2):217–256, 1998.
[HKW02]
Wolfgang Hürst, Thorsten Kreuzer, and Marc Wiesenhütter. A
qualitative study towards using large vocabulary automatic speech
recognition to index recorded presentations for search and access
over the web. In Proceedings of the IADIS International Conference on WWW/Internet (ICWI), pages 135–143, Lisbon, Portugal, November 2002. IADIS.
[HL00]
Jason I. Hong and James A. Landay. SATIN: a toolkit for informal ink-based applications. In Proceedings of the thirteenth
annual ACM symposium on User interface software and technology (UIST), pages 63–72, San Diego (CA), USA, November 2000.
ACM press.
[HLLM02]
Jason I. Hong, James A. Landay, Chris Long, and Jennifer
Mankoff. Sketch recognizers from the end-user’s, the designer’s,
and the programmer’s perspective. In Randall Davis, James Landay, and Tom Stahovich, editors, Papers from 2002 AAAI Spring
Symposium (Sketch Understanding Workshop), number SS-02-08
in Technical Report, pages 73–77. AAAI press, Stanford (CA),
USA, March 2002.
[Hop91]
Don Hopkins. The design and implementation of pie menus. Dr.
Dobb’s Journal, 16(12):16–26, December 1991.
[Hür03]
Wolfgang Hürst. Indexing, searching, and skimming of multimedia documents containing recorded lectures and live presentations.
In Proceedings of the eleventh ACM International Conference on
Multimedia, pages 450–451, Berkeley (CA), USA, November 2003.
ACM press.
[IELM00]
Takeo Igarashi, W. Keith Edwards, Anthony LaMarca, and
Elizabeth D. Mynatt. An architecture for pen-based interaction
on electronic whiteboards. In Proceedings of the fifth international
working conference on Advanced Visual Interfaces, pages 68–75,
Palermo, Italy, May 2000. ACM press.
[IMEL99]
Takeo Igarashi, Elizabeth D. Mynatt, W. Keith Edwards, and
Anthony LaMarca. Demonstrating flatland user interfaces. In
CHI ’99 extended abstracts on Human factors in computing systems, pages 27–28, Pittsburgh (PA), USA, May 1999. ACM press.
Demonstration session: advances in graphical interaction.
[Int88]
International Telecommunication Union, Geneva, Switzerland.
ITU-T Recommendation G.711 - Pulse code modulation (PCM)
of voice frequencies, November 1988.
[Int90]
International Telecommunication Union, Geneva, Switzerland.
ITU-T Recommendation G.726 - Adaptive differential pulse code
modulation (ADPCM), December 1990.
BIBLIOGRAPHY
179
[ISO92]
ISO/IEC, JTC1/SC2/WG10. Digital Compression and Coding of
Continuous-Tone Still Images, January 1992. Draft International
Standard 10918-1.
[IU97]
Hiroshi Ishii and Brygg Ullmer. Tangible bits: towards seamless
interfaces between people, bits and atoms. In Steven Pemberton,
editor, Proceedings of the Conference on Human Factors in Computing Systems (CHI), pages 234–241, Atlanta (GA), USA, March
1997. ACM Press.
[Jes00]
Chris R. Jesshope. Using AudioGraph in on-line teaching. In Proceedings of the fourth International Conference on Open Learning,
Brisbane, Australia, December 2000.
[Jes01]
Chris R. Jesshope. Cost-effective multimedia in on-line teaching.
Educational Technology & Society, 4(3), 2001.
[Jes03]
Chris R. Jesshope. Towards the dynamic publication of multimedia presentations - a strategy for development. In Proceedings of
ALT-C 2003, Sheffield, UK, September 2003.
[JFK03]
Kristian Jantz, Gerald Friedland, and Lars Knipping. Conserving
an ancient art of music: Making SID tunes editable. In Computer Music Modeling and Retrieval 2003, pages 76–84, Montpellier, France, May 2003.
[JFR04]
Kristian Jantz, Gerald Friedland, and Raúl Rojas. Trennung von
Dozenten und Tafel in einem E-Kreide Video. Technical Report B04-07, Fachbereich Mathematik und Informatik, Freie Universität
Berlin, June 2004.
[Joh00]
Jeff Johnson. GUI Bloopers: Don’ts and Do’s for Software Developers and Web Designers. Morgan Kaufmann, San Diego (CA),
USA, April 2000.
[JRV+ 89]
Jeff Johnson, Teresa L. Roberts, William Verplank, David C.
Smith, Charles H. Irby, Marian Beard, and Kevin Mackey. The
Xerox Star: A retrospective. IEEE Computer, 22(9):11–26, 28–29,
September 1989.
[JSS98]
Chris R. Jesshope, Alex Shafarenko, and Horia Slusanschi. Lowbandwidth multimedia tools for web-based lecture publishing. IEE
Engineering Science and Educational Journal, 7(4):148–154, 1998.
[Kat02]
Bob Katz. Mastering Audio: The Art and the Science. Focal Press
(Elsevier), Oxford, UK, 2002.
[KF98]
Gordon Kurtenbach and George W. Fitzmaurice. United States
Patent No. 6,414,700: System for accessing a large number of menu
items using a zoned menu bar, 1998. Silicon Graphics Inc, filed
July 21, 1998.
180
BIBLIOGRAPHY
[Kra94]
Axel Kramer. Translucent patches – dissolving windows. In
Proceedings of the seventh Annual Symposium on User Interface
Software and Technology (UIST), pages 121–130, Marina del Rey
(CA), USA, November 1994. ACM press.
[Kru05]
Olga Krupina. Client-Server Architecture for a Neural Simulation
Tool. PhD thesis, Fachbereich Mathematik und Informatik, Freie
Universität Berlin, 2005. To appear.
[KSBM99]
S. Sathiya Keerthi, Shirish K. Shevade, Chiranjib Bhattacharyya,
and K. R. K. Murthy. Improvements to Platt’s SMO algorithm
for SVM classifier design. Technical Report CD-99-14, Control
Division, Department of Mechanical and Production Engeneering,
National University of Singapore, Singapore, 1999.
[LEW+ 02]
Marc Loy, Robert Eckstein, Dave Wood, James Elliot, and Brian
Cole. Java Swing. O’Reilly, second edition, November 2002.
[Liw04]
Marcus Liwicki. Erkennung und Simulation von logischen Schaltungen für E-Chalk. Diploma’s thesis, Fachbereich Mathematik
und Informatik, Freie Universität Berlin, March 2004.
[LNHL00]
James Lin, Mark W. Newman, Jason I. Hong, and James A. Landay. DENIM: finding a tighter fit between tools and practice for
web site design. In Proceedings of the Conference on Human Factors in Computing Systems (CHI), pages 510–517, The Hague,
The Netherlands, April 2000. ACM press.
[LRGC01]
Qiong Liu, Yong Rui, Anoop Gupta, and J. J. Cadiz. Automating
camera management for lecture room environments. In Proceedings of the conference on Human factors in computing systems
(CHI), pages 442–449, Seattle (WA), USA, March/April 2001.
ACM press.
[LRPS85]
Gordon E. Legge, Gary S. Rubin, Denis G. Pelli, and Mary M.
Schleske. Psychophysics of reading–ii. low vision. Vision Research,
25(2):253–266, 1985.
[LW97]
Hsi-Jian Lee and Jiumn-Shine Wang. Design of a mathematical expression understanding system. Pattern Recognition Letters,
18(3):289–298, 1997.
[MA98]
Jennifer Mankoff and Gregory D. Abowd. Cirrin: a word-level
unistroke keyboard for pen input. In Proceedings of the eleventh
annual ACM symposium on User interface software and technology (UIST), pages 213–214, San Francisco (CA), USA, November
1998. ACM press.
[Man99]
Klaus Manhart.
November 1999.
[Mat99]
Nicholas E. Matsakis. Recognition of handwritten mathematical
expressions. Master’s thesis, Massachusetts Institute of Technology, May 1999.
Hörfunk im Internet.
Funkschau, 25:42–44,
BIBLIOGRAPHY
[MCvM97]
181
Thomas P. Moran, Patrick Chiu, and William van Melle. Penbased interaction techniques for organizing material on an electronic whiteboard. In Proceedings of the tenth annual ACM symposium on User interface software and technology (UIST), pages
45–54, Banff, Canada, October 1997. ACM press.
[MCvMK95] Thomas P. Moran, Patrick Chiu, William van Melle, and Gordon
Kurtenbach. Implicit structure for pen-based systems within a
freeform interaction paradigm. In Proceedings of the conference
on Human factors in computing systems (CHI), pages 487–494,
Denver (CO), USA, May 1995. ACM press.
[MGH+ 97]
Michael B. Monagan, Keith O. Geddes, K. M. Heal, G. Labaln,
and Stefan M. Vorkoetter. Maple V Programming Guide: Release
5, May 1997.
[MHJ+ 95]
Scott Minneman, Steve Harrison, Bill Janssen, Gordon Kurtenbach, Thomas Moran, Ian Smith, and Bill van Melle. A confederation of tools for capturing and accessing collaborative activity. In
Proceedings of the third ACM international conference on Multimedia, pages 523–534, San Francisco (CA), USA, November 1995.
ACM press.
[MIEL99]
Elizabeth D. Mynatt, Take Igarashi, W. Keith Edwards, and Anthony LaMarca. Flatland: New dimensions in office whiteboards.
In Proceedings of the conference on Human Factors in Computing
Systems (CHI), pages 346–353, Pittsburgh (PA), USA, May 1999.
ACM press.
[MIEL00]
Elizabeth D. Mynatt, Take Igarashi, W. Keith Edwards, and Anthony LaMarca. Designing an augmented writing surface. IEEE
Computer Graphics and Applications, 20(4):55–61, July 2000.
[MN02]
David Mioduser and Ralf Nachmias. WWW in education. In
Heimo H. Adelsberger, Betty Collis, and Jan M. Pawlowski, editors, Handbook on Information Technologies for Education &
Training, chapter 2, pages 23–43. Springer-Verlag, Heidelberg,
Germany, 2002.
[MO02]
Rainer Müller and Thomas Ottmann. Electronic note-taking, systems, problems, and their use at universities. In Heimo H. Adelsberger, Betty Collis, and Jan M. Pawlowski, editors, Handbook
on Information Technologies for Education & Training, chapter 9,
pages 121–138. Springer-Verlag, Heidelberg, Germany, 2002.
[Mom91]
Momenta. Momenta: User’s Reference Manual, 1991.
[Mon86]
Andrew F. Monk. Mode errors: a user-centred analysis and some
preventative measures using keying contingent sound. International Journal of Man-Machine Studies, 24(4):313–327, 1986.
[MS99]
Sugata Mukhopadhyay and Brian Smith. Passive capture and
structuring of lectures. In Proceedings of the seventh ACM international conference on Multimedia (Part 1), pages 477–487, Orlando (FL), USA, October/November 1999. ACM Press.
182
BIBLIOGRAPHY
[MSCM03]
Mingchao Ma, Volker Schillings, Tongbo Chen, and Christoph
Meinel. T-Cube: A multimedia authoring system for elearning.
In Proceedings of E-Learn 2003, World Conference on E-Learning
in Corporate, Government, Healthcare, & Higher Education, pages
2289–2296, Phoenix (AZ), USA, November 2003. Association for
the Advancement of Computing in Education (AACE).
[MSG98]
Brad A. Myers, Herb Stiel, and Robert Gargiul. Collaboration using multiple PDAs connected to a PC. In Proceedings
of the ACM conference on Computer supported cooperative work
(CSCW), pages 285–294, Seattle (WA), USA, November 1998.
ACM press.
[MvM00]
Thomas P. Moran and William van Melle. Tivoli: Integrating
structured domain objects into a freeform whiteboard environment
(demonstration). In Proceedings of the Conference on Human Factors in Computing Systems (CHI), The Hague, The Netherlands,
April 2000. ACM press. Demonstrations (video): physical and
shared spaces.
[MvMC98a] Thomas P. Moran, William van Melle, and Patrick Chiu. Spatial
interpretation of domain objects integrated into a freeform electronic whiteboard. In Proceedings of the eleventh annual ACM
symposium on User interface software and technology (UIST),
pages 175–184, San Francisco (CA), USA, November 1998. ACM
press.
[MvMC98b] Thomas P. Moran, William van Melle, and Patrick Chiu. Tailorable domain objects as meeting tools for an electronic whiteboard. In Proceedings of the ACM conference on Computer supported cooperative work (CSCW), pages 295–304, Seattle (WA),
USA, November 1998. ACM press.
[MW83]
Victor S. Miller and Mark N. Wegman. United States Patent
No. 4,814,746: Data compression method, 1983. International
Business Machines Corporation, filed on June 1, 1983.
[Mye00]
Brad A. Myers. The pebbles project: using PCs and hand-held
computers together. In Proceedings of the Conference on Human
Factors in Computing Systems (CHI), pages 14–15, The Hague,
The Netherlands, April 2000. ACM press.
[Mye01]
Brad A. Myers. Using hand-held devices and PCs together. Communications of the ACM, 44(11), November 2001.
[Myn99]
Elizabeth D. Mynatt. The writing on the wall. In Proceedings
of the International Conference on Human-Computer Interaction
(INTERACT), pages 196–204, Edinburgh, UK, August/Septemer
1999. IOS Press.
[Nie99]
Jakob Nielsen. Designing Web Usability. New Rider Publishing,
Indianapolis (IN), USA, 1999.
BIBLIOGRAPHY
183
[Nor81]
Donald A. Norman. Categorization of action slips. Psychological
Review, 88(1):1–15, 1981.
[Nor88]
Donald A. Norman. The psychology of everyday things. Basic
Books, New York (NY), USA, 1988.
[Nor98]
Donald A. Norman. The Invisible Computer: Why Good Products
Can Fail, the Personal Computer Is So Complex, and Information
Appliances Are the Solution. MIT Press, Cambridge (MA), USA,
1998.
[OSG02]
OSGi, editor. OSGi Service Platform Release 2. IOS Press, Amsterdam, Netherlands, 2002.
[PCST00]
John C. Platt, Nello Christiani, and John Shawe-Taylor. Large
margin DAGs for multiclass classification. Advances in Neural
Information Processing Systems, 12:547–553, 2000.
[PE02]
Fernando Pereia and Touradj Ebrahimi, editors. The MPEG-4
Book. Multimedia series. Prentice Hall, Upper Saddle River (NJ),
USA, 2002.
[Per98]
Ken Perlin. Quikwriting: continuous stylus-based text entry. In
Proceedings of the eleventh annual ACM symposium on User interface software and technology (UIST), pages 215–216, San Francisco (CA), USA, November 1998. ACM press.
[PK99]
Jitendra Padhye and James F. Kurose. An empirical study of client
interactions with a continuous-media courseware server. IEEE
Internet Computing, 3(2):65–73, March 1999.
[PKPR02]
Konrad Polthier, Samy Khadem, Eike Preuß, and Ulrich Reitebuch. Publication of interactive visualizations with javaview.
In Jonathan Borwein, Maria H. Morales, Konrad Polthier, and
José F. Rodrigues, editors, Multimedia Tools for Communicating
Mathematics, chapter 15, pages 241–264. Springer-Verlag, Heidelberg, Germany, 2002.
[Pla99]
John C. Platt. Fast training of support vectore machines using
sequential minimal optimization. In Bernhard Schölkopf, Christopher J. C. Burges, and Alexander J. Smola, editors, Advances in
Kernel Methods - Support Vector Learning, pages 185–208. MIT
Press, Cambridge (MA), USA, 1999.
[PMMH93]
Elin Rønby Pedersen, Kim McCall, Thomas P. Moran, and
Frank G. Halasz. Tivoli: an electronic whiteboard for informal
workgroup meetings. In Proceedings of the conference on Human
factors in computing systems (INTERCHI), pages 391–398, Amsterdam, The Netherlands, April 1993. ACM press.
[Raf00]
Wolf-Ulrich Raffel. E-Kreide: Eine Java-Multimedia-Tafel für die
multimediale Lehre. Master’s thesis, Fachbereich Mathematik und
Informatik, Freie Universität Berlin, October 2000.
184
BIBLIOGRAPHY
[Ras00]
Jef Raskin. The Humane Interface: New Directions for Designing
Interactive Systems. Addison-Wesley, Boston (MA), USA, 2000.
[RB93]
Martin Riedmiller and Heinrich Braun. A direct adaptive method
for faster backpropagation learning: The RPROP algorithm.
In Proceedings of the IEEE International Conference on Neural Networks (ICNN), pages 586–591, San Francisco (CA), USA,
March/April 1993.
[Reb04]
Jörg Rebenstorf. Entwicklung eines Bluetooth-Stifts für E-Kreise:
“FU Bluetooth Pen”. Diploma’s thesis, Fachbereich Mathematik
und Informatik, Freie Universität Berlin, May 2004.
[Rek98]
Jun Rekimoto. A multiple device approach for supporting
whiteboard-based interactions. In Clare-Marie Karat, Arnold
Lund, Joëlle Coutaz, and John Karat, editors, Proceedings of
the Conference on Human Factors in Computing Systems (CHI),
pages 344–351, Los Angeles (CA), USA, April 1998. ACM press.
[RGK99]
Jürgen Richter-Gebert and Ulrich Kortenkamp. The Interactive
Geometry Software Cinderella. Springer-Verlag, Heidelberg, Germany, July 1999.
[RKFF01]
Raúl Rojas, Lars Knipping, Gerald Friedland, and Bernhard
Frötschl. Ende der Kreidezeit - Die Zukunft des Mathematikunterrichts. DMV Mitteilungen, 2:32–37, February 2001.
[RKRF00]
Raúl Rojas, Lars Knipping, Wolf-Ulrich Raffel, and Gerald Friedland. Elektronische Kreide: Eine Java-Multimedia-Tafel für den
Präsenz- und Fernunterricht. Technical Report B-00-17, Fachbereich Mathematik und Informatik, Freie Universität Berlin, October
2000.
[RKRF01a] Raúl Rojas, Lars Knipping, Wolf-Ulrich Raffel, and Gerald Friedland. Elektronische Kreide: Eine Java-Multimedia-Tafel für den
Präsenz- und Fernunterricht. Informatik: Forschung und Entwicklung, 16:159–168, September 2001.
[RKRF01b] Raúl Rojas, Lars Knipping, Wolf-Ulrich Raffel, and Gerald Friedland. Elektronische Kreide: Eine Java-Multimedia-Tafel für den
Präsenz- und Fernunterricht. In Tagungsband der Learntec, volume 2, pages 533–539, Karlsruhe, Germany, October 2001.
[RLJ98]
Dave Raggett, Arnaud Le Hors, and Ian Jacobs. RFC 1866: Hypertext Markup Language - 4.0. W3C Recommendation, April
1998.
[RSFWH98] Tristan Richardson, Quentin Stafford-Fraser, Kenneth R. Wood,
and Andy Hopper. Virtual network computing. IEEE Internet
Computing, 2(1):33–38, 1998.
[RSTG03]
Matt Ratto, Ryan Benjamin Shapiro, Tan Minh Truong, and
William G. Griswold. The ActiveClass project: Experiments in
BIBLIOGRAPHY
185
encouraging classroom participation. In Proceedings of the Computer Support for Collaborative Learning (CSCL) 2003, Bergen,
Norway, June 2003.
[SAHS04]
Beth Simon, Ruth Anderson, Crystal Hoyer, and Jonathan Su.
Preliminary experiences with a tablet PC based system to support
active learning in computer science courses. In Proceedings of the
ninth annual conference on innovation and technology in computer
science education (ITiCSE), Leeds, UK, June 2004.
[SAS01]
Lisa Stifelman, Barry Arons, and Chris Schmandt. The audio
notebook: paper and pen interaction with structured speech. In
Proceedings of the conference on Human factors in computing systems (CHI), pages 182–189, Seattle (WA), USA, March/April
2001. ACM Press.
[Sau98]
Eric Saund. Image mosaicing and a diagrammatic user interface
for an office whiteboard scanner. Technical report, Xerox Palo
Alto Research Center, 1998.
[Sch03]
Joachim Schulte. Evaluation des Einsatzes der Software E-Kreide
in der universitären Lehre. Magister’s thesis, Technische Universität Berlin, Institut für Sprache und Kommunikation, November
2003.
[Sez01]
Metin Sezgin. Feature point detection and curve approximation
for early processing of free-hand sketches. Master’s thesis, Massachusetts Institute of Technology, May 2001.
[SFR96]
Quentin Stafford-Fraser and Peter Robinson. BrightBoard: A
video-augmented environment. In Michael J. Tauber, Victoria
Bellotti, Robin Jeffries, Jock D. Mackinlay, and Jakob Nielsen, editors, Proceedings of the Conference on Human Factors and Computing Systems (CHI), pages 134–141, Vancouver, Canada, April
1996. ACM Press.
[SGH+ 94]
Norbert A. Streitz, Jörg Geißler, Torsten Holmer, Jörg M. Haake,
and Jeroen Hol. DOLPHIN: integrated meeting support across local and remote desktop environments and liveboards. In Proceedings of the ACM conference on Computer supported cooperative
work (CSCW), pages 345–358, Chapel Hill (NC), USA, October
1994. ACM Press.
[SGH98]
Norbert A. Streitz, Jörg Geißler, and Torsten Holmer. Roomware
for cooperative buildings: Integrated design of architectural spaces
and information spaces. In Norbert A. Streitz, Shin’ichi Konomi,
and Heinz Jürgen Burkhardt, editors, Cooperative Buildings - Integrating Information, Organization and Architecture. Proceedings
of CoBuild’98, volume 1370 of Lecture Notes in Computer Science,
pages 4–21. Springer Verlag, Darmstadt, Germany, 1998.
[SGH+ 99]
Norbert A. Streitz, Jörg Geißler, Torsten Holmer, Shin’ichi
Konomi, Christian Müller-Tomfelde, Wolfgang Reischl, Petra
186
BIBLIOGRAPHY
Rexroth, Peter Seitz, and Ralf Steinmetz. i-LAND: An interactive landscape for creativitiy and innovation. In Proceedings of
the Conference on Human Factors in Computing Systems (CHI),
pages 120–127, Pittsburgh (PA), USA, May 1999. ACM Press.
[Shi00]
Jack Shirazi. Java Performance Tuning. O’Reilly, September 2000.
[Shn98]
Ben Shneiderman. Designing the user interface: strategies for
effective human-computer interaction. Addison-Wesley, third edition, March 1998.
[SKB92]
Abigail J. Sellen, Gordon P. Kurtenbach, and William A. S. Buxton. The prevention of mode errors through sensory feedback.
Journal of Human Computer Interaction, 7(2):141–164, 1992.
[SM96]
Holger Schwenk and Maurice Milgram. Constraint tangent distance for on-line character recognition. In International Conference on Pattern Recognition, pages 515–519, August 1996.
[SRS+ 93]
Andrew Sears, Doreen Revis, Janet Swatski, Rob Crittenden, and
Ben Shneiderman. Investigating touchscreen typing: the effect
of keyboard size on typing speed. Behaviour and Information
Technology, 12(1):17–22, 1993.
[SSL+ 97]
Mia Stern, Jesse Steinberg, Hu Imm Lee, Jitendra Padhye, and
James F. Kurose. MANIC: Multimedia asynchronous networked
individualized courseware. In Proceedings of World Conference on
Educational Multimedia and Hypermedia (ED-MEDIA), Calgary,
Canada, June 1997.
[Sta81]
Richard M. Stallman. Emacs the extensible, customizable selfdocumenting display editor. In Proceedings of the ACM SIGPLAN
SIGOA symposium on Text manipulation, pages 147–156, Portland (OR), USA, 1981. ACM press.
[Ste04]
Henrik Steffien. Handschriftliche Erstellung und Ausführung von
Python-Skripten auf der E-Kreide Tafel. Bachelor’s thesis, Fachbereich Mathematik und Informatik, Freie Universität Berlin,
September 2004.
[Sti96]
Lisa Joy Stifelman. Augmenting real-world objects: A paper-based
audio notebook. In Michael J. Tauber, Victoria Bellotti, Robin Jeffries, Jock D. Mackinlay, and Jakob Nielsen, editors, Proceedings of
the Conference on Human Factors and Computing Systems (CHI),
pages 199–200, Vancouver, Canada, April 1996. ACM Press.
[Sti97]
Lisa Joy Stifelman. The Audio Notebook: Paper and Pen Interaction with Structured Speech. PhD thesis, School of Architecture and Planning, Massachusetts Institute of Technology, August
1997.
[STMTK01] Norbert A. Streitz, Peter Tandler, Christian Müller-Tomfelde, and
Shin’ichi Konomi. Roomware: Towards the next generation of
human-computer interaction based on an integrated design of real
BIBLIOGRAPHY
187
and virtual worlds. In John M. Carroll, editor, Human-Computer
Interaction in the New Millenium, ACM press, chapter 25, pages
553–578. Addison-Wesley, August 2001.
[Sun99]
Sun Microsystems Inc. Java Look and Feel Design Guidelines.
Java Series. Addison-Wesley, June 1999.
[Sun01]
Sun Microsystems Inc. Java Look and Feel Design Guidelines:
Advanced Topics. Java Series. Addison-Wesley, December 2001.
[SVPM01]
Agustı́n Schapira, Kimberly De Vries, and Cris Pedregal-Martin.
MANIC: An open-source system to create and deliver courses over
the internet. In Proceedings of the 2001 Symposium On Applications and the Internet, pages 21–26, San Diego (CA), USA, January 2001. IEEE Computer Society Press.
[TA99]
Khai N. Truong and Gregory D. Abowd. StuPad: Integrating
student notes with class lectures. In Proceedings of the Conference
on Human Factors in Computing Systems (CHI), volume 2, pages
208–209, Pittsburgh (PA), USA, May 1999. ACM press.
[TAB99]
Khai N. Truong, Gregory D. Abowd, and Jason A. Brotherton.
Personalizing the capture of public experiences. In Proceedings of
the twelfth annual ACM symposium on User interface software and
technology (UIST), pages 121–130, Asheville (NC), USA, November 1999. ACM press.
[Tap04]
Ernesto Tapia. Understanding Mathematics: A System for the
Recognition of On-Line Handwritten Mathematical Expressions.
PhD thesis, Fachbereich Mathematik und Informatik, Freie Universität Berlin, December 2004.
[Tes81]
Larry Tesler. The Smalltalk environment. BYTE, 6(8):90–147,
August 1981.
[The04a]
Florian Theimer.
Automatische Handschriftenerkennung in
E-Kreide Dokumenten. Technical Report B-04-05, Fachbereich
Mathematik und Informatik, Freie Universität Berlin, 2004.
[The04b]
Florian Theimer.
Automatische Handschriftenerkennung in
E-Kreide Dokumenten. Bachelor’s thesis, Fachbereich Mathematik
und Informatik, Freie Universität Berlin, April 2004.
[TR02]
Ernesto Tapia and Raúl Rojas. Recognition of handwritten digits
in the E-Chalk system using support vector machines. Technical
Report B-02-14, Fachbereich Mathematik und Informatik, Freie
Universität Berlin, 2002.
[TR03]
Ernesto Tapia and Raúl Rojas. Recognition of on-line handwritten
mathematical formulas in the E-Chalk system. In Proceedings of
the Seventh International Conference on Document Analysis and
Recognition (ICDAR), volume 2, pages 980–984, Edinburgh, UK,
August 2003. IEEE Computer Society.
188
BIBLIOGRAPHY
[TR04]
Ernesto Tapia and Raúl Rojas. Recognition of on-line handwritten mathematical expressions using a minimum spanning tree construction and symbol dominance. In Josep Lladós and Young-Bin
Kwon, editors, Graphics Recognition, Recent Advances and Perspectives, Fifth International Workshop, GREC 2003, Barcelona,
Catalonia, Spain 2003, Selected Papers, volume 3088 of Lecture
Notes in Computer Science, pages 327–338. Springer Verlag, 2004.
[Tsi99]
Dennis Tsichritzis. Reengineering the university. Communications
of the ACM, 42(6):93–100, 1999.
[Tuf03a]
Edward R. Tufte. The cognitive style of PowerPoint. Chesire
(CT), USA, May 2003.
[Tuf03b]
Edward R. Tufte. Power corrupts. PowerPoint corrupts absolutely.
Wired, pages 118–119, September 2003.
[Vap98]
Vladimir N. Vapnik. Statistical Learning Theory. John Wiley &
Sons, New York (NY), USA, 1998.
[VN94]
Dan Venolia and Forrest Neiberg. T-Cube: a fast, self-disclosing
pen-based alphabet. In Proceedings of the conference on Human
factors in computing systems (CHI), pages 265–270, Boston (MA),
USA, April 1994. ACM press.
[vRD03]
Guido van Rossum and Fred L. Drake, Jr. Python Language Reference Manual, Version 2.3. Network Theory Ltd, August 2003.
[W3C98]
W3C Recommendation. Synchronized Multimedia integration Language (SMIL) 1.0 Specification, June 1998.
[W3C01]
W3C Recommendation. Synchronized Multimedia integration Language (SMIL) 2.0 Specification, August 2001.
[Wat04]
Russel Watson. An interactive animation architecture for E-Chalk.
Bachelor’s thesis, Fachbereich Mathematik und Informatik, Freie
Universität Berlin, September 2004.
[WBM00]
David J. Ward, Alan F. Blackwell, and David J. C. MacKay.
Dasher – a data entry interface using continuous gestures and language models. In Proceedings of the thirteenth annual ACM symposium on User interface software and technology (UIST), pages
129–137, San Diego (CA), USA, November 2000. ACM Press.
[Wei93]
Mark Weiser. Some computer science issues in ubiquitous computing. Communications of the ACM, 36(7):75–84, July 1993.
Special issue on computer augmented environments: back to the
real world.
[Wel83]
Terry A. Welch. United States Patent No. 4,558,302: High speed
data compression and decompression apparatus and method, 1983.
Sperry Corporation, filed June 20, 1983.
[Wel84]
Terry A. Welch. A technique for high-performance data compression. IEEE Computer, pages 8–19, June 1984.
BIBLIOGRAPHY
189
[WGB99]
Mark Weiser, Rich Gold, and John Seely Brown. The origins of
ubiquitous computing research at PARC in the late 1980s. IBM
Systems Journal, 38(4):693–696, 1999.
[WHW94]
Steve Whittaker, Patrick Hyland, and Myrtle Wiley. FILOCHAT:
handwritten notes provide access to recorded conversations. In
Proceedings of the conference on Human factors in computing systems (CHI), pages 271–277. ACM press, Boston (MA), USA, April
1994.
[Win01a]
Terry Winograd. Architectures for context. Human-Computer Interaction Journal, 16(2–4):401–419, 2001. Special issue on contextaware computing.
[Win01b]
Terry Winograd. Interaction spaces for 21st century computing.
In John M. Carroll, editor, Human-Computer Interaction in the
New Millenium, ACM press, chapter 12, pages 259–275. AddisonWesley, August 2001.
[WJF02]
Terry Winograd, Brad Johanson, and Armando Fox. The interactive workspaces project: Experiences with ubiquitous computing
rooms. IEEE Pervasive Computing, 1(2):67–75, April/June 2002.
[Wol03]
Stephen Wolfram. The Mathematica Book. Wolfram Media, Inc.,
fifth edition, August 2003.
[Woo94]
David R Woolley. PLATO: The emergence of on-line community.
Computer-Mediated Communication Magazine, 1(3):5, July 1994.
[WP94]
Karon Weher and Alex Poon. Marquee: a tool for real-time video
logging. In Beth Adelson, Susan Dumais, and Judith S. Olson, editors, Proceedings of the Conference on Human Factors in Computing Systems (CHI), pages 58–64, Boston (MA), USA, April
1994.
[WRB92]
Catherine G. Wolf, James R. Rhyne, and Laura K. Briggs. Communication and information retrieval with a pen-based meeting
support tool. In Proceedings of the ACM conference on Computersupported cooperative work (CSCW), pages 322–329, Toronto,
Canada, November 1992. ACM press.
[WRZO91]
Catherine G. Wolf, James R. Rhyne, Lorna A. Zorman, and
Harold L. Ossher. We-met (window environment-meeting enhancement tools). In Proceedings of the conference on Human
factors in computing systems (CHI), pages 441–442, New Orleans
(LA), USA, April/May 1991. ACM press.
[WSS97a]
Lynn D. Wilcox, Bill N. Schilit, and Nitin Sawhney. Dynomite: a
dynamically organized ink and audio notebook. In Steven Pemberton, editor, Proceedings of the conference on Human factors
in computing systems (CHI), pages 186–193. ACM press, Atlanta
(GA), USA, March 1997.
190
BIBLIOGRAPHY
[WSS+ 97b]
Lynn D. Wilcox, William N. Schilit, Nitin Sawhney, Joseph W.
Sullivan, and Timothy W. Bickmore. United States Patent No.
5,970,455: System for capturing and retrieving audio data and
corresponding hand-written notes, 1997. Xerox Corporation, filed
on March 20, 1997.
[Yan83]
Robert J. Yannes. United States Patent No. 4,677,890: Sound
interface circuit, 1983. Commodore Business Machines Inc., filed
on February 27, 1983.
[ZBC02]
Richard Zanibbi, Dorothea Blostein, and James R. Cordy. Recognizing mathematical expressions using tree transformation.
IEEE Transactions on Pattern Analysis and Machine Intelligence,
24(11), November 2002.
[Zhu97]
Chad Zhu. RFC 2190: RTP Payload Format for H.263 Video
Streams. IETF/IESG, September 1997.
[ZL77]
Jacob Ziv and Abraham Lempel. A universal algorithm for sequential data compression. IEEE Transactions on Information
Theory, 23:337–342, May 1977.
[ZL78]
Jacob Ziv and Abraham Lempel. Compression of individual sequences via variable-rate coding. IEEE Transactions on Information Theory, pages 530–536, September 1978.
[ZS02]
Peter Ziewer and Helmut Seidl. Transparent teleteaching. In Andy
Williamson, Cathy Gunn, Alison Young, and Tony Clear, editors,
Winds of Changing in the Sea of Learning, Proceedings of the nineteenth Annual Conference of the Australian Society for Computers in Tertiary Education (ASCILITE), pages 749–758, Auckland,
New Zealand, December 2002. UNITEC Institute of Technology,
Auckland, New Zealand.
Web References
[1] AOF (Authoring On the Fly).
http://ad.informatik.uni-freiburg.de/aof/.
[2] AudioGraph Homepage.
http://carol.science.uva.nl/~jesshope/audiograph/
audiographhomepa.html.
[3] AutoAuditorium.
http://www.autoauditorium.com.
[4] BlackBoard.
http://www.blackboard.com.
[5] BMRC Lecture Browser, The Berkley Multimedia Research Center,
University of California.
http://bmrc.berkeley.edu/projects/lb/.
[6] Matthias Bollhöfer. Numerik I: Diskrete Fouriertransformation. E-Chalk
recording, summer term 2003.
http://www.moses.tu-berlin.de/Mathematik/Numerik1/SS_2003/
NMI/Echalk/num_bolle_2003-06-19/.
[7] Matthias Bollhöfer. Numerik I: Polynominterpolation. E-Chalk
recording, summer term 2003.
http://www.moses.tu-berlin.de/Mathematik/Numerik1/SS_2003/
NMI/Echalk/num_bolle_2003-06-18/.
[8] Camtasia.
http://www.techsmith.de/products/studio/.
[9] Centra Symposium.
http://www.centra.com/products/.
[10] CiDS! (“Computer in die Schulen!”).
http://www.cids.de.
[11] Cinderella: The Interactive Geometry Software Cinderella.
http://www.cinderella.de.
[12] Georg Classen. Elektronische Kreide als Hilfsmittel für behinderte
Dozenten, December 2003.
http://www.fu-berlin.de/service/behinderung/aktuell/
ekreide.html.
191
192
WEB REFERENCES
[13] Classroom Presenter.
http://www.cs.washington.edu/education/dl/presenter/.
[14] Classroom2000.
http://www.gatech.edu/fce/eclass/.
[15] ClickTeam Company: Multimedia Fusion.
http://www.clickteam.com/English/multimedia_fusion.htm.
[16] ConferenceXP.
http://www.conferencexp.net.
[17] Cornell Lecture Browser, Multimedia Research Group, University of
Cornell.
http://www.cs.cornell.edu/zeno/.
[18] Deutsches Museum.
http://www.deutsches-museum.de.
[19] DigiWB project - a GNU/Linux driver for Mimio, E-Beam, and
IntelliBoard.
http://mimio.spline.de.
[20] DyKnow (Dynamic Knowledge Transfer), LLC.
http://www.dyknow.com.
[21] eBeam Electronics for Imaging.
http://www.e-beam.com.
[22] E-Chalk.
http://www.echalk.de.
[23] Englische Kunst des 18. Jahrhunderts: William Hoghart, Teil 1 (Mirror).
Production by Werner Busch and Maximilian Benker.
http://kazan.inf.fu-berlin.de/echalk/lectures/arthist/.
[24] Esmertec AG.
http://www.esmertec.com.
[25] Exymen (EXtend Your Media Editor Now!).
http://www.exymen.org.
[26] Exymen at SourceForge.
http://exymen.sourceforge.net.
[27] FLUIDUM (FLexible User Interfaces for Distributed Ubiquitous
Machinery).
http://www.fluidum.org.
[28] Ghostscript.
http://www.ghostscript.com.
[29] GNOME Human Interface Guidelines 2.0.
http://developer.gnome.org/projects/gup/hig/.
WEB REFERENCES
193
[30] Evan Golub. The BIRD (Beacon-Identified Realtime Display)
Note-taking System.
http://www.cs.umd.edu/~egolub/AVIAN/BIRD/.
[31] GTCO whiteboards.
http://www.gtcocalcomp.com.
[32] Hades (Hamburg Design System).
http://tech-www.informatik.uni-hamburg.de/applet/hades/html/.
[33] Heise Online - Microsofts Internet Explorer verliert gegenüber
Mozilla/Firefox Anteile.
http://www.heise.de/newsticker/meldung/51152/.
[34] Himmel5, The Art Show.
http://www.himmel5.de.
[35] Hitachi Software.
http://www.hitachi-soft.com.
[36] iLectures.
http://ilectures.uwa.edu.au.
[37] imc (Information Multimedia Communication) Advanced Learning
Solutions.
http://www.im-c.de.
[38] Java Platform 1.1 API and Documentation.
http://java.sun.com/products/archive/jdk/1.1/.
[39] Java 1.4.2 API Documentation: Class java.text.MessageFormat.
http://java.sun.com/j2se/1.4.2/docs/api/java/text/
MessageFormat.html.
[40] Java 1.4.2 API Documentation: Class java.util.Properties.
http://java.sun.com/j2se/1.4.2/docs/api/java/util/
Properties.html.
[41] Java 1.4.2 API Documentation: Class java.util.ResourceBundle.
http://java.sun.com/j2se/1.4.2/docs/api/java/util/
ResourceBundle.html.
[42] Java API Documentation.
http://java.sun.com/reference/api/.
[43] Java Bug Database.
http://developer.java.sun.com/developer/bugParade/.
[44] Java Media Framework (JMF).
http://java.sun.com/products/java-media/jmf/.
[45] JavaView Homepage.
http://www.javaview.de.
[46] JLink for Mathematica, by Wolfram Research, Inc.
http://www.wolfram.com/solutions/mathlink/jlink/.
194
WEB REFERENCES
[47] Just-In-Time Lectures (JITL).
http://www.jitl.cs.cmu.edu.
[48] Jython, a pure Java Python implementation.
http://www.jython.org.
[49] KDE User Interface Guidelines.
http://developer.kde.org/documentation/design/ui/.
[50] Lecturnity.
http://www.lecturnity.com.
[51] Lemon Commodore 64 Museum.
http://www.lemon64.com/museum/.
[52] LEO Deutsch-Englisches Wörterbuch, PDA-optimierte Version.
http://pda.leo.org.
[53] Libungif – An uncompressed GIF library.
http://sourceforge.net/projects/libungif/.
[54] Lokando AG.
http://www.lokando.com.
[55] Lorenz-Kaim-Schule Kronach (Berufsschule). Unterrichtsbeispiel mit
E-Kreide.
http://www.bs-kronach.de/Unterrichtsbeispiele/gebr1/.
[56] Lorenz-Kaim-Schule Kronach, Rudolf Schirmer. Berufsausbildung
DBFH-Mechatroniker.
http://www.bs-kronach.de/DBFH-projekt.htm.
[57] Lynx.
http://lynx.browser.org.
[58] MacroMedia, Inc.: Authorware.
http://www.macromedia.com/software/authorware/.
[59] MacroMedia, Inc.: Director.
http://www.macromedia.com/software/director/.
[60] MANIC (Multimedia Asynchronous Networked Individualized
Courseware) by RIPPLES (Research in Presentation Production for
Learning Electronically).
http://manic.cs.umass.edu/research.html.
[61] Peter Marshall. AudioGraph Online Lecture on DC-Motors.
http://www.ee.surrey.ac.uk/Teaching/Courses/DCMotors/.
[62] Microsoft DirectX.
http://www.microsoft.com/directx/.
[63] Microsoft Tablet PC Developer Center.
http://msdn.microsoft.com/mobility/prodtechinfo/platforms/.
WEB REFERENCES
[64] MOSES: Mobile Service for Students.
http://www.moses.tu-berlin.de.
[65] MuPAD research group of Universität Paderborn.
http://www.mupad.de.
[66] MuPAD SciFace Software.
http://www.mupad.com.
[67] Netpbm.
http://netpbm.sourceforge.net.
[68] Microsoft Developer Network. Official Guidelines for User Interface
Developers and Designers.
http://msdn.microsoft.com/library/en-us/dnwue/html/
welcome.asp.
[69] Numonics, Inc.
http://www.numonics.com.
[70] OSCAR, Richard Hall’s Open Service Container Architecture.
http://oscar-osgi.sourcefourge.net.
[71] OSGi (Open Service Gateway Initiative).
http://www.osgi.org.
[72] PalmOne.
http://www.palmone.com.
[73] Panasonic Panaboard from Kintronics.
http://www.kintronics.com/panaboard.html.
[74] PhatWare Corp./Paragraph, Inc.
http://www.paragraph.com.
[75] PLATO (Programmed Logic for Automated Teaching Operations).
http://www.plato.com.
[76] PolyVision Visual Communications.
http://www.polyvision.com.
[77] Promethean Interactive Whiteboards.
http://www.promethean.co.uk.
[78] Python Programming Language.
http://www.python.org.
[79] RealNetworks, Inc.
http://www.realnetworks.com.
[80] Thomas Richter. Lineare Algebra für Ingenieure: Eigenwerte und
Eigenvektoren. E-Chalk recording, winter term 2003/04.
http://www.moses.tu-berlin.de/Mathematik/LineareAlgebra/
WS_2003_2004/L4/Echalk/linalg_richter_2004-01-27/.
195
196
WEB REFERENCES
[81] Raúl Rojas. Algorithmen und Programmierung I: Bubblesort. E-Chalk
recording, winter term 2001/02.
http://kazan.inf.fu-berlin.de/lectures/ALP1_WS01/bubblesort/.
[82] Raúl Rojas. Algorithmen und Programmierung I: Quicksort. E-Chalk
recording, winter term 2001/02.
http://kazan.inf.fu-berlin.de/lectures/ALP1_WS01/quicksort/.
[83] Raúl Rojas. Bildverarbeitung: Einführung zu Wavelets. E-Chalk
recording, summer term 2002.
http://kazan.inf.fu-berlin.de/echalklectures/SS02/BV/
wavelets/.
[84] Raúl Rojas. Bildverarbeitung: Farbdarstellung und Transformationen.
E-Chalk recording, summer term 2002.
http://kazan.inf.fu-berlin.de/echalklectures/SS02/BV/farbe/.
[85] Raúl Rojas. Rechnerstrukturen: Zweierkomplement. E-Chalk recording,
winter term 2000/01.
http://kazan.inf.fu-berlin.de/echalklectures/misc/rs_d/.
[86] Schule des Sehens.
http://www.schule-des-sehens.de.
[87] Ruedi Seiler. Lineare Algebra für Ingenieure: Eigenwerte und
Eigenvektoren. E-Chalk recording, winter term 2003/04.
http://www.moses.tu-berlin.de/Mathematik/LineareAlgebra/,
WS_2003_2004/L1/Echalk/linaseil_2004-01-26/.
[88] Smart Technologies, Inc.
http://www.smarttech.com.
[89] SumTotal Systems, Inc.: ToolBook Authoring Products.
http://www.sumtotalsystems.com/toolbook/.
[90] SWISHzone.com Pty Ltd.
http://www.swishzone.com.
[91] TeamBoard.
http://www.teamboard.com.
[92] TechSmith Corporation.
http://www.techsmith.de.
[93] Tegrity.
http://www.tegrity.com.
[94] Tele-TASK, Tele-Teaching Anywhere Solution Kit.
http://www.tele-task.de.
[95] TeleTeaching @ Universität Trier.
http://teleteaching.uni-trier.de.
WEB REFERENCES
197
[96] Christian Thomsen. Physik für Ingenieure: Optik. E-Chalk recording,
winter term 2003/04.
http://www.physik.tu-berlin.de/institute/IFFP/moses/ekreide/
physing_2004-01-28/.
[97] Christian Thomsen. Physik für Ingenieure: Thermodynamik 1. E-Chalk
recording, winter term 2003/04.
http://www.physik.tu-berlin.de/institute/IFFP/moses/ekreide/
physing_2004-02-04/.
[98] Fredi Troeltzsch. Analysis II: Oberflächenintegrale. E-Chalk recording,
summer term 2003.
http://www.moses.tu-berlin.de/Mathematik/Analysis2/SS_2003/
B1/Echalk/ana2_troeltz_2003-07-04/.
[99] Fredi Troeltzsch. Analysis II: Satz von Stokes. E-Chalk recording,
summer term 2003.
http://www.moses.tu-berlin.de/Mathematik/Analysis2/SS_2003/
B1/Echalk/ana2_troeltz_2003-07-11/.
[100] Unisys. LZW Patent Information.
http://www.unisys.com/about__unisys/lzw/.
[101] Video4Linux 2.
http://linux.bytesex.org/v4l2/.
[102] Virtual Ink Mimio.
http://www.mimio.com.
[103] Wacom, Inc.
http://www.wacom.com.
[104] Wacom’s LCD tablets.
http://www.wacom.com/lcdtablets/.
[105] Waterloo Maple, Inc.
http://www.maplesoft.com.
[106] Webcast Berkeley.
http://webcast.berkeley.edu.
[107] WebEx Training Center.
http://www.webex.com.
[108] Wolfram Research, Inc.
http://www.wolfram.com.
[109] WWR2 (World Wide Radio 2).
http://www.javaradio.de.
[110] Zero G InstallAnywhere.
http://www.zerog.com/goto/installanywhere.
198
WEB REFERENCES
[111] Erhard Zorn. Lineare Algebra für Ingenieure: Eigenwerte und
Eigenvektoren. E-Chalk recording, winter term 2003/04.
http://www.moses.tu-berlin.de/Mathematik/LineareAlgebra/
WS_2003_2004/L3/Echalk/linazorn_2004-01-27/.
Appendix
Zusammenfassung
Diese Arbeit beschreibt eine elektronische Kreidetafel für die Lehre. Das entwickelte Softwaresystem kann für den Präsenzunterricht ebenso wie für den Fernunterricht verwendet werden. Es ermöglicht, die Präsenzlehre durch multimediale Elemente zu bereichern, ohne dass die intuitive Bedienbarkeit der klassischen Kreidetafel verloren geht. Zugleich wird das Material für die Fernlehre
ohne Mehraufwand produziert, quasi als Nebenprodukt des Präsenzunterrichtes. Dazu wird die Entwicklung des Tafelbildes und der begleitende Ton des
Dozenten aufgezeichnet. Die Vorgehenweise vermeidet die üblicherweise enormen Kosten für die Produktion von E-Learning-Materialien. Daneben profitiert
der Ansatz von den bereits vorhandenen didaktischen Fähigkeiten der Lehrenden in der klassischen Unterrichtsform mit der Kreidetafel.
Die Fernlehrnenden können die Aufzeichnung in einem Java-fähigem Browser abspielen, ohne das hierzu die Installation von speziellen Programmen zum
Empfang nötig ist. Die Übertragung kann live empfangen werden oder zu einem
späteren Zeitpunkt abgespielt werden, etwa zum Zwecke der Nachbereitung.
Die Arbeit beschreibt Entwurfsprinzipien und Architektur des Systems ebenso wie die Erfahrungen aus dem praktischen Einsatz.
Lebenslauf
1990-1999
1993-1995
17.11.1998
29.04.1999
18.10.1999
1.5.-30.11.1999
Seit 1.12.1999
Studium der Mathematik und Informatik an der Freien Universität Berlin
Forschungstutor bei Prof. Dr. Helmut Alt im Bereich Punktmustererkennung zur Satellitensteuerung
Abgabe der Diplomarbeit Beschriftung von Linienzügen
Diplom Mathematik
Diplom Informatik
Wissenschaftlicher Berater des Sender Freies Berlin im EUProjekt Estima Ratio
Wissenschaftlicher Mitarbeiter in der Arbeitsgruppe Multimedia am Institut für Informatik der Freien Universität Berlin
199
200
APPENDIX
Selbstständigkeitserklärung zur Dissertation
Ich versichere hiermit, dass ich die Dissertation selbständig verfasst habe und
dass ich keine anderen als die in der Arbeit genannten Hilfsmittel benutzt habe.
Lars Knipping
Berlin, den 15.11.2004