1
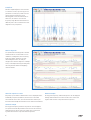
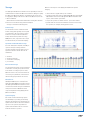
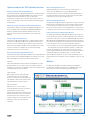
SKF @ptitude Observer
Condition monitoring software including fully
integrated machine diagnostics
SKF @ptitude Observer is a core platform in a family of reliability software applications that work
together as SKF @ptitude Monitoring Suite.
SKF @ptitude Observer is a
powerful software, for condition
monitoring of rotating machinery,
built on the latest .NET technology,
including fully integrated machine
diagnostics for correct assessment
of machines and processes. You get
expert advice without talking to the
expert.
Overview
Enterprise
resource
planning
Computerized
Maintenance
Management
System
SKF @ptitude
decision support
On-line
surveillance/
protection
Periodic
vibration/
process data
SKF @ptitude
monitoring suite
Successful condition monitoring is
based on powerful and userfriendly machine diagnostics
software for data management and
SKF @ptitude
SKF @ptitude
analysis. SKF @ptitude Observer is
Inspector
Analyst
SKF @ptitude
internationally recognized for its
Observer
operator interface and intelligent
Figure 1
diagnostics functions.
A handful of powerful Wizards
allow the user to build and maintain
Monitoring features
machine setups and other configurations
easily. The system’s excellent performance
enables the user to monitor several
Measurement data, as well as other relevant
hundreds of machines from a single
information is shown in user-friendly
location.
displays. Live data, updated every second*,
The SKF @ptitude Observer hierarchy
as well as long term history can easily be
tree enables unlimited number of levels and
displayed in many different formats. In the
shows the status of each node. The
multi-level process overview window, live
hierarchy tree enables excellent overview
data and alarm indications are shown in
and easy navigation. Using Work Spaces, it is descriptive control room display pictures for
possible to customize extractions of the
individual machines or groups of machines,
hierarchy. The number of work spaces is
easy for the operator to use.
unlimited.
The SKF @ptitude Observer software
* Depends on the measurement setup.
works together with SKF Multilog On-line
System IMx (all versions), SKF MasCon 48
(all versions) and SKF MasCon 16 (all
versions).
In the system overview, the status of each of the system hardware
components is shown (Figure 1), clearly displaying any system
component malfunction.
Historical data can be shown in powerful trends, where one or
more parameters can automatically be displayed and compared to
time, speed or process parameters (power, temperature, water level,
etc.). Trends can also be updated live every second*.
* Depends on the measurement setup.
Root cause analysis
Although some of the measurement devices
are equipped with automated advanced
diagnosis, the software contains a great
variety of tools for advanced root cause
analysis, for example:
Defect frequency display
Each machine part and the interaction
between parts are defined in the machine
information database. Based on this
information all machine defect frequencies
are dynamically calculated and can be easily
displayed in frequency spectra by the user.
In spectrum live mode, the defect
frequencies are continuously updated based
on the instant shaft speed.
Acceleration enveloping
Acceleration enveloping represents a major
advancement in early detection of bearing
faults which is superior to previous
techniques for bearing fault detection.
Topology
Topology diagram is a powerful tool that
illustrates frequency spectra vs. speed or
time by using color separation enabling easy
identification of variations in machine
behavior. This can be used with any
historical data or during run-up/coastdown.
2
Machine information database
Mechanical data for each machine monitored is stored in a machine
information database. Machine components are connected to each
other by dragging and dropping components such as shafts,
bearings, gear wheels and impellers, in order to build the machine.
For each component, relevant information such as bearing code,
number of gear teeth and number of vanes, is stored. Based on this
information and the actual shaft speeds, all defect frequencies are
dynamically calculated and advanced diagnostic rules are applied.
3D plot
A 3D plot illustrates frequency spectra vs.
speed, process data or time. The user can
freely zoom, rotate or elevate the plot in
order to view the diagram from any position.
The 3D plot can be used with any historical
data or during run-up/coast-down.
Orbits
Using signals from two perpendicularly
mounted transducers, the shaft orbital
movement can be displayed and analyzed.
Orbits can be performed using the raw
signal (true orbit), or using a filtered signal
(filtered orbit) at shaft speed or shaft speed
harmonics as well as at a user defined
frequency range.
3
Trend/bode
Vibration amplitude/phase can be trended
as a function of time, speed or any process
parameter recorded. It is possible to trend
discrete frequencies (fixed or speed
following) with a user selected number of
harmonics, as well as a user selected
frequency range. Measurement data from
different points can be overlaid in the same
diagram for easy comparison.
Machine diagnostic
The powerful machine diagnostics includes
standard rules for common faults such as
unbalance, misalignment, various bearing
faults, gear faults, cavitation, etc. User
defined diagnosis rules can easily be
designed. The machine diagnostics is always
active, constantly monitoring incoming data,
detecting machine faults and displaying
clear text alarms.
Historical comparison of data
Sideband analysis
Frequency spectra taken at different times can be displayed and be
individually compared. In addition, subtraction of a selectable
measurement can be done. The selected reference data may be
fixed and automatically matched with new or earlier measurements.
For any given frequency, sideband frequencies can be displayed
making sideband effects much more visible. This is often used
together with machine component defect frequencies.
Harmonic analysis
For any given frequency, harmonic frequencies can be displayed.
The system automatically calculates the best fit for the harmonics,
making harmonic effects much more visible. This is often used
together with machine component defect frequencies.
4
Multi-parameter analysis
Reports
The SKF @ptitude Observer provides a wealth of tools and features
for sophisticated multi-parameter analysis. For example, the
software supports oil quality monitoring displays, blade monitoring
displays, and more.
The SKF @ptitude Observer software has the capability to generate
many different reports. All diagrams, plots and images can be used
in various reports together with tabular data and notes. It is possible
to pre-configure and store different types of reports like:
Alarms and warnings
In SKF @ptitude Observer there are two types of alarms – primary
alarms (checked typically every second*) and secondary alarms
(checked at every event and at a time interval selected by the user).
For acceleration enveloping and vibration measurement points,
primary alarms perform at four different frequencies, fixed or speed
dependent, with a selectable number of harmonics, and one
frequency range. All measurement values can be exponentially
averaged. Alarm levels can be configured to follow speed and/or load
dynamically. Primary alarms can also be set to detect process
measurement points for both high and low alarms with two levels
each.
Secondary alarms are performed by
advanced machine diagnostics, with
sophisticated alarm conditions chosen from
an alarm condition library or created by the
operator. Secondary alarms make
prognostics three months ahead. If a
primary alarm is triggered, secondary alarm
diagnostics are automatically performed.
For vibration measurements, both
primary alarms and secondary alarms can
be calculated in acceleration, velocity or
displacement, regardless of sensor type.
All alarms are transferred to the SKF
@ptitude Observer Monitor and stored in
the database together with corresponding
measurement data. The SKF @ptitude
Observer Monitor computer can be
equipped with relay cards containing 16
relays each, fully programmable to show any
type of alarm. Additionally, alarm
information can also be distributed via
e-mail or SMS.
•
•
•
•
•
Last measurement report
Exception report
History report
Inspection report
Work notification report
Generated reports can also be stored in order to maintain a history
of reports.
All reports can be sent to screen, PDF file, Word document, RTF,
Open Office or Printer and also posted to Internet, intranet or
e-mailed.
Report templates allow quick and easy report configuration for
use and reuse.
* Depends on the measurement setup.
5
Storage
The SKF @ptitude Observer software has the capability to store the
evaluated data in a Microsoft SQL Server database. Using the royalty
free Microsoft SQL Server Express, the database size can be up to
four gigabytes. Using a full version of Microsoft SQL Server, the size
is almost unlimited.
All stored data is marked with identification stating date and time
for later use in troubleshooting and trend analysis.
Storage is made in the following form:
Trend storage
The trend data consists of different trend
buffers storing data typically once every 10
seconds. Data is also stored in the archive
buffer once every ten minutes. All trend
buffers and the archive buffer are using
FIFO (first-in, first-out). Data is also stored
in transient mode (see transient analysis).
Spectrum and Time Domain storage
At a user defined time interval, manually or
upon an event (see below), vibration
spectrum and time domain data is stored.
Spectrum and time domain data can be
enabled for:
•
•
•
•
vibration
vibration, harmonic
acceleration enveloping
process FFT
Event related storage
The measurement points can be configured
as members of event groups. An event can
be an alarm or a change in process data.
When an event occurs, based on data from
one of the group members, measurement
data from all group members are stored.
Client/Server
SKF @ptitude Observer is a client/server
application fully TCP/IP based, which means
that SKF @ptitude Observer Monitor can be
connected to Internet through a firewall and
easily accessed from a Windows-based
computer anywhere having SKF @ptitude
Observer installed.
System integrity
An on-line condition monitoring system
should always be operating. If something
happens that interrupts the monitoring, the
system must be able to detect the fault and
report it to the operator. If possible the
system itself should be able to correct the
fault and continue to operate.
6
Below is a description of the SKF @ptitude Observer system
integrity:
• checks all sensor signals and reports on failure
• a watchdog looks after both the SKF MultilogOn-line System IMx/
SKF MasCon units and the SKF @ptitude Observer Monitor and
reports, then restarts upon failure
• easy for the operator to disable a sensor upon sensor failure
• system faults are stored in the database and can be accessed by
the operator, for example, during system service
Optional modules for SKF @ptitude Observer
Advanced gating for SKF @ptitude Observer
The Advanced gating for SKF @ptitude Observer is a fully integrated
plug-in module to the SKF @ptitude Observer software. It checks
multiple measurement variables in order to allow when
measurement conditions are acceptable. This module checks the
range of each variable as well as the maximum variation during the
measurement.
Automatic database replication for SKF @ptitude Observer
The Automatic database replication for SKF @ptitude Observer is a
piece of software that is replicating the SKF @ptitude Observer
database regularly between different database servers. The
database servers can be located anywhere and connected by
Internet.
OPC for SKF @ptitude Observer
SKF @ptitude Observer can be connected to other systems or
devices through an OPC server using the OPC standard
communication protocol. Data transmission (data publication) of
trend data and alarm information, as well as data reception (data
subscription) of process data is fully supported.
GPS for SKF @ptitude Observer
The SKF @ptitude Observer GPS is a plug-in for storage of the unit’s
global position. This information is stored together with trend data
to be used in various analysis situations e.g. trains, dump trucks,
where the monitored object is moving and when it is of importance
to know the position of the vehicle at the time of the measurement.
Advanced balancing for SKF @ptitude Observer
The Transient module for SKF @ptitude Observer is a fully integrated
plug-in module to the SKF @ptitude Observer software. It is a great
help in analyzing a great variety of turbine related defects.
The Advanced balancing for SKF @ptitude Observer is a plug-in for
on-line applications in order to make a full dynamic rotor balancing
operation. The data input comes from SKF Multilog On-line System
IMx, SKF MasCon48, SKF MasCon16 and the balancing operation is
done step-by-step. Dynamic rotor balancing can be performed from
1 up to 15 planes in one session and if needed the number of
correction planes can be reduced using balancing plane elimination.
The data quality used by the balancing software is continuously
checked and displayed to the operator. It is easy to go back and
replace a bad measurement. The result from a balancing operation,
including the Influence coefficient matrix, is stored in the SKF
@ptitude Observer database. If a rotor needs rebalancing, stored
balancing data can be recalled in order to minimize the stops to only
one.
Polar plot
WebCon
The polar plot illustrates vibration phase and amplitude in a polar
diagram. Alarms are set as alarm circles for changes in phase or
amplitude. The polar plot can display live data, historical data or data
captured during run-up/coast-down.
The SKF @ptitude Observer database fully supports WebCon
providing data and alarm information to the WebCon web server
which can be accessed by any PC using Internet Explorer.
Profile for SKF @ptitude Observer
The Profile for SKF @ptitude Observer is a fully integrated plug-in
module to the SKF @ptitude Observer software. It measures the
profile of a rotor by using any type of vibration sensor and a tacho
signal. The tacho signal normally monitors its signal from the same
rotor but could also use signals from any shaft mechanically
connected to the rotor to be monitored.
Transient module for SKF @ptitude Observer
Shaft centerline
Using signals from two perpendicularly
mounted transducers, the shaft radial
position is shown. The shaft centerline plot
can display live data, historical data or data
captured during run-up/coast-down.
Transient analysis
Machine run-up or coast-down is
automatically detected and a user defined
measurement procedure starts.
Measurements are taken at defined speed
changes and all data is stored in a transient
buffer. The data can be viewed in a great
variety of displays such as 3D, spectra, time
waveform, bode, polar, orbit and shaft
centerline.
7
SKF @ptitude Observer features and capabilities
Alarms
• Alarm window
–– Quickly find and identify all points in alarm
within the hierarchy, process view or system
view
• Alarm detail
–– Provides a summary of type of alarm and
status
• Trend alarms
–– Trend alarms frequency can be fixed or
speed following with a selectable number of
harmonics
–– The trend alarm level can be speed or
process data dependent following a user
defined graph
–– Unlimited number of alarms can be
configured in the system
–– Alarms based on data from multiple
measurement points
–– Run-up/coast-down alarming using speed
dependent alarm levels
–– Vector alarms using circular alarm levels
–– Alarm hysteresis
–– Exponential filtering
–– Activation of user selectable on-line device
relay for each alarm level violation
–– Activation of user selectable SKF @ptitude
Observer Monitor device relay for each
alarm level violation
–– User defined vibration unit selection
(acceleration, velocity or displacement)
–– Data storage selection (maximum, minimum
or instant)
–– Alarm blocking (on/off)
–– Alarm groups
• Four overall alarm levels per measurement
point
–– Danger high, alert high, alert low, danger
low
–– Adaptive alarming whereas the trend alarm
level can be speed or process data
dependent following a user defined graph
–– Enhanced event log capabilities
• Machine diagnostics
–– Alarms based on rules created to detect a
particular machine fault
–– Standard rules as well as user defined rules
available
–– Clear text message on machine fault
8
• Active range
–– Speed range setting and/or process data
range setting
–– Setting for maximum allowed speed and/or
process data variation during measurement
–– Advanced data gating
Communication
• Automatic e-mail or SMS generation upon
alarm
• Data transfer with SKF Multilog IMx and SKF
MasCon. For other devices contact your local
SKF Representative.
• TCP/IP
• RS232 or USB
• OPC – subscription as well as publication
• Modbus
Machine parts
• Graphical tool for machine library creation
• Automatic defect frequency calculation
• Automatic calculation of all shaft speeds
• Seamless connection to machine diagnostics
• Standard library
• Machine template
Data display
All displays can be used in live mode for transient
as well as for steady-state analysis
• True orbit
• Filtered orbit
• Shaft centerline
• Polar (including circular alarm levels)
• Bode
• Profile
• Topology
• 3D plot
• Overall trend displays
• Process (Temperature, pressure, speed, etc.)
• Digital images
• Spectrum displays
• Single point, multiple point displays
• Triaxial point
• Time waveform
• Phase displays
• History plot
• Multi-channel display
• Process overview
–– Live update
–– Amplitude/phase
–– Speed
–– Links to other process views
–– Live bars
• Graph overlays
• Spectrum
–– Machine part defect frequency
–– Single, harmonic, sideband, peak, band
cursors
–– Running speed
–– Spectral band alarm
–– Overall alarms
–– DiagX
• Display tools
–– Notes with image attachment and priority
setting capability
–– Percent of alarm level setting
–– Auto scaling
–– Cursor micro-manipulation
–– Auto-linking of displays and active hierarchy
–– Linear or log scaling
–– Grid
–– Orders, frequency scaling
–– Amplitude threshold %
–– Waterfall slant angle setting in all directions
–– Date range setting
–– User selectable color settings
–– Waterfall spacing (time/date, speed or
process data)
–– Spectrum data post processing (integration/
differentiation)
–– Zero Padding
–– Inverse FFT
–– Baseline spectrum storage
–– Run-out compensation
–– User-individual display settings
Database
• Microsoft SQL Server 2000, 2005 and 2008
• ODBC, SQL, and TCP/IP protocol compliant
database opens the database content
• User friendly database management
–– Back-up scheduling
–– Database upgrade
SKF @ptitude Observer features and capabilities (continued)
• Full support in Local Area Network (LAN), Wide
Area Network (WAN), and Thin-client
(Terminal) environments
• Unlimited number of:
–– Hierarchies
–– Hierarchy levels
–– Work spaces
–– Collection points
–– Measurements
• Smart Data Storage
–– Data storage based on time, speed variation,
process data variation, alarm status and
trend variation
–– Capability of data reduction due to aging
• Database supports
–– XML data importing and exporting
–– Binary importing and exporting
–– Data export to Image file, Text, XML, HTML,
Microsoft Excel
• Database libraries
–– Bearing library
–– Machine template library
–– Multi-folder image library
General
• Multiple languages available
• Windows-based functionality
–– True multi-processing operating
environment allowing simultaneous
background and foreground processing
–– Complete right click functionality (drop down
menus)
–– Drag and drop
–– Cut/Copy/Paste
–– Complete integration of third party
applications
• User preferences allow customization
• Context sensitive help
• Complete user manual on installation CD-ROM
• Product Support Plans (PSP) available
Measurements
The following measurements can be entered
manually or automatically
• Acceleration
• Amps
• Displacement
• English or metric units
• Enveloped acceleration
• Flow (GPM, LPM)
• High Frequency Detection (HFD) and Digital
High Frequency Detection (DHFD)
• Inspection points (user definable)
• Multi-channel
• Operating hours
• Operating time (elapsed and cumulative)
• Peak, Peak-to-peak, True peak, True peak-topeak and RMS
• Pressure (PSI and bars)
• RPM
• SKF Acceleration Enveloping (gE)
• Speed
• Temperature (°C and °F)
• Triax
• User-specific units
• Velocity
• Volts (AC or DC)
• Torsion
• Time difference
• Simultaneous speed, process and digital
storage together with vibration, speed or
process measurement
• Derived point – user definable mathematical
formula to calculate a derived value from data
collected on multiple points across all type of
devices.
Transient analysis
• Run-up/coast-down measurements
• Run-up/coast-down measurement point
groups
• Vector, polar, shaft centerline, orbit, profile
• Adaptive alarming
• Run-out compensation
• Live data display update for multiple graphs
Reports
• Preserved reports – enables you to maintain a
history of reports
• Shared reports – allows you to share and preconfigure reports for selected users
• Send reports to screen, PDF file, Word
document, RTF, open Office or printer
• Report file can be posted to internet, intranet
or e-mailed
• Customizable report content
• Data plots, supplemental information, and
digital images can be included in reports
• Report types
–– Last measurement
–– Exception
–– Collection status
–– History
–– Inspection
–– Work notification
–– Blank (user defined)
• Report templates allow quick and easy report
configuration for use and reuse
Security
• Fully configurable user rights that allow you to
read, view and have full access
• Pre-configured user roles (analyst, super user,
operator)
• Password encryption for database login
Monitoring system supervision
• BIAS range setting and alarm upon failure
• Measurement range setting and alarm upon
failure
• SKF @ptitude Observer Monitor supervision
• On-line device supervision (automatic
hardware reset)
• System supervision alarm distribution using
e-mail and SMS
• On-line device and SKF @ptitude Observer
Monitor device restart upon failure
• Automatic remote firmware upgrade of all online devices (SKF MasCon, SKF Multilog On-line
System IMx)
• System event recording for all parameter
modifications including date/time and user
information
Templates and wizards
• Machine parts creation wizard
• Multiple point update wizard
• Statistical alarm wizards use historical data to
help refine machine diagnostic alarms
• Hierarchy template wizard allows for rapid
hierarchy creation and machine templates for
reuse
• Report template allows for the custom
configuration of reports and report templates
for reuse
• Machine expert wizard
9
Hardware requirements
Stand alone configuration
• Running SKF @ptitude Observer
• Running Microsoft SQL Server database management system
• Storing data
Configuration
Minimum requirements
Recommended requirements
Operating system
Windows 2000 with Service Pack 4, Windows XP Professional
Windows 2000 with Service Pack 4, Windows XP Professional
with Service Pack 2, Windows 2003 Server with Service Pack 1
with Service Pack 2, Windows 2003 Server with Service Pack 1
OR Windows Vista
OR Windows Vista
Processor (Note 1)
Pentium IV, 1.0 GHz
Pentium IV, 2.4 GHz or better
RAM
1.0 GB
2.0 GB or more
Disk space available for
1.2 GB
1.2 GB or more
DVD drive
One (1) required
One (1) required
Video display
800 x 600
1024 x 768 or larger
stand-alone computer (Note 2)
Network configuration – Server
• Running Microsoft SQL Server database management system
• Storing data
Configuration
Minimum requirements
Recommended requirements
Operating system
Windows 2003 Server with Service Pack 1,
Windows 2003 Server with Service Pack 1,
Windows 2000 with Service Pack 4 OR Windows Vista
Windows 2000 with Service Pack 4 OR Windows Vista
Processor (Note 1)
Pentium IV, 2.0 GHz
Pentium IV, 3.2 GHz or better
RAM
1.0 GB
2.0 GB or more
Disk space available (Note 2)
1.2 GB
1.2 GB or more
Microsoft SQL Server
SQL Server 2000, 2005 and 2008
SQL Server 2000, 2005 and 2008
Network configuration – Network Client
• Running SKF @ptitude Observer
• Running database client software
Configuration
Minimum requirements
Recommended requirements
Operating system
Windows 2000 with Service Pack 3+ OR Windows XP Professional Windows 2000 with Service Pack 3+ OR Windows XP Professional
with Service Pack 2
with Service Pack 2
Processor (Note 1)
Pentium IV, 1.0 GHz
Pentium IV, 2.4 GHz or better
RAM
1.0 GB
2.0 GB or more
Disk space available for
500 MB
1.0 GB or more
DVD drive
One (1) required
One (1) required
Video display
800 x 600
1024 x 768 or larger
Microsoft SQL Server
SQL Server 2000, 2005 and 2008
SQL Server 2000, 2005 and 2008
each network client (Note 2)
Note 1: These requirements apply to SKF @ptitude Observer complete with database management system. Other applications running simultaneously may degrade performance.
Note 2: These requirements ONLY apply to SKF @ptitude Observer complete with database management system. Additional storage disk space is required for data.
Notice: If running other versions of Microsoft SQL Server, or other database management system are expected to run in the same PC environment, please contact your local SKF
Representative to inquire about compatibility.
10
Ordering information
Product Support Plans (PSP)
SKF @ptitude Observer
A range of Product Support Plans are available to protect your
investment. Contact your local SKF Reliability Systems Sales
Representative for additional information.
• CMSW 7500-SC SKF @ptitude Observer, single client
• CMSW 7500-MCB SKF @ptitude Observer, multi client base, five
(5) clients
• CMSW 7500-BCX SKF @ptitude Observer, base client extension,
one (1) client
• CMSW 7500-AC SKF @ptitude Observer, additional client for
existing installation, one (1) client
• CMSW 7500-SIP SKF @ptitude Observer, site license privilege
• CMSW 7500-SC/MCB SKF @ptitude Observer, single client to
multi client base upgrade
Installation and training
Installation and training available through your local SKF Supplier or
Representative.
Modules for SKF @ptitude Observer
• CMSW 7501 Advanced gating for SKF @ptitude Observer
• CMSW 7503 Automatic database replication for SKF @ptitude
Observer
• CMSW 7601 Profile for SKF @ptitude Observer
• CMSW 7603 GPS for SKF @ptitude Observer
• CMSW 7605 Transient module for SKF @ptitude Observer
• CMSW 7606 OPC for SKF @ptitude Observer
• CMSW 7607 Advanced balancing for SKF @ptitude Observer
11
For additional information on SKF Reliability Systems products, contact:
SKF Reliability Systems
SKF Condition Monitoring Center – Luleå
Aurorum 30, S-977 75 • Luleå, Sweden
Telephone: +46 (0) 920 758 00 • FAX: +46 (0) 920 134 40
Web Site: www.skf.com/cm
® SKF, @ptitude, Multilog and MasCon are registered trademarks of the SKF Group
Microsoft, Windows, Excel, SQL Server and Internet Explorer are either registered trademarks or trademarks of Microsoft
Corporation in the United States and/or other countries.
All other trademarks are the property of their respective owners.
© SKF Group 2009
The contents of this publication are the copyright of the publisher and may not be reproduced (even extracts) unless prior written
permission is granted. Every care has been taken to ensure the accuracy of the information contained in this publication but no liability
can be accepted for any loss or damage whether direct, indirect or consequential arising out of the use of the information contained
herein. SKF reserves the right to alter any part of this publication without prior notice.
SKF Patents include: #US04768380 • #US05679900 • #US05845230 • #US05854553 • #US05992237 • #US06006164 •
#US06199422 • #US06202491 • #US06275781 • #US06489884 • #US06513386 • #US06633822 • #US6,789,025 •
#US6,792,360 • US 5,633,811 • US 5,870,699 • #WO_03_048714A1
Publication CM2369 EN • April 2009 • Printed on environmentally friendly paper.