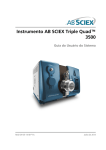
1
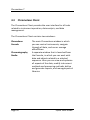
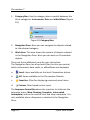
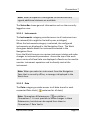
Quick Start Guide
Chromeleon 7.2
7229.0004 Revision 1.0
•
July 2013
Chromeleon 7
Table of Contents
1 Introduction ............................................................. 1
1.1
1.2
About this Document ......................................................... 1
Other Documentation ........................................................ 2
2 Using Chromeleon ................................................... 3
2.1
2.2
2.3
2.4
2.5
2.6
2.7
Overview........................................................................... 3
Starting Chromeleon .......................................................... 4
Getting your Instrument Started .......................................... 5
2.3.1 Making sure the Instrument Controller Service is
Running ................................................................. 5
2.3.2 Establishing a Connection ........................................ 6
2.3.3 Controlling and Monitoring the Instrument ............... 7
Creating a Sequence ........................................................... 9
2.4.1 Creating an Instrument Method ............................... 9
2.4.2 Creating a Processing Method .................................10
2.4.3 Creating a Report Template ....................................10
2.4.4 Creating a Sequence ..............................................10
Acquiring Data ..................................................................14
2.5.1 Starting an Analysis ................................................14
2.5.2 Monitoring an Ongoing Analysis ..............................16
Processing Data ................................................................17
2.6.1 Reviewing Data in the Chromatography Studio .........17
2.6.2 Working with Chromatograms ................................19
2.6.3 Detecting and Integrating Peaks ..............................20
2.6.4 Identifying Peaks ...................................................26
2.6.5 Calibration and Quantitation...................................30
Reviewing and Reporting Results ........................................34
2.7.1 Reviewing Results ..................................................34
2.7.2 Printing Results .....................................................35
Quick Start Guide
Page i
Chromeleon 7
2.8
MS in Chromeleon ............................................................37
2.8.1 MS Instrument Control ...........................................37
2.8.2 Acquiring Data with an MS......................................37
2.8.3 MS Data Visualization.............................................37
2.8.4 MS Data Processing (Processing Method) .................40
3 Appendix: Chromeleon Overview ......................... 47
3.1
3.2
3.3
Page ii
Introduction .....................................................................47
Instrument Controller Service ............................................49
Chromeleon Client ............................................................50
3.3.1 Chromeleon Console ..............................................51
3.3.2 Chromatography Studio .........................................57
Quick Start Guide
Chromeleon 7
Copyright
Copyright © 2013 Thermo Fisher Scientific
The information contained in this document is subject to change without
notice.
All rights reserved including those for photomechanical reproduction
and storage on electronic media. No part of this publication may be
copied or distributed, transmitted, transcribed, stored in a retrieval
system, or transmitted into any human or computer language, in any
form or by any means, electronic, mechanical, magnetic, manual, or
otherwise, or disclosed to third parties without the express written
permission of Thermo Fisher Scientific Inc.
Trademarks
Windows, Windows Vista, SQL Server 2008, SQL Server, and Microsoft
are registered trademarks of Microsoft Corporation.
All other trademarks are property of Thermo Fisher Scientific Inc. and its
subsidiaries.
Quick Start Guide
Page iii
Chromeleon 7
1
Introduction
1.1
About this Document
This Quick Start Guide provides a quick reference to help get you
started with Thermo Scientific™ Dionex™ Chromeleon™. It is
recommended that you review the Quick Start Guide thoroughly
before working with Chromeleon.
The Quick Start Guide has two parts:
Using Chromeleon
Appendix: Chromeleon
Overview
Guidance in starting a simple analysis,
processing the data, and reporting
the results.
An overview of the Chromeleon
interfaces and common features.
This Quick Start Guide is provided "as is". Every effort has been
made to supply complete and accurate information and all
technical specifications and programs have been developed with
the utmost care. However, Thermo Fisher Scientific assumes no
responsibility and cannot be held liable for any errors, omissions,
damage, or loss that might result from any use of this manual or
the information contained in it.
Quick Start Guide
Page 1
Chromeleon 7
1.2
Other Documentation
Chromeleon is provided with other documents that will help you
to learn more about the software. Their scope is described in the
Document Overview, which is delivered in printed form with the
Chromeleon installation media, but also available in electronic
form on the installation disk in the Documents folder. The
Chromeleon Online Help is available in electronic form in the
Online Help folder.
Page 2
Quick Start Guide
Chromeleon 7
2
Using Chromeleon
2.1
Overview
Every analysis using Chromeleon follows the same 6 basic steps:
1.
Start Chromeleon
2.
Start the instrument
3.
Create a sequence
4.
Acquire data
5.
Process data
6.
Review and report results
This Quick Start Guide provides enough information to perform
each of these 6 steps as part of a simple analysis. For more
advanced use of Chromeleon, including performing more
complex analyses, please refer to the Chromeleon Help.
Note: It is assumed that Chromeleon has been installed and at
least one instrument has been connected and configured. For
details on installation, and connecting and configuring
instruments, see the Installation Guide.
Quick Start Guide
Page 3
Chromeleon 7
2.2
Starting Chromeleon
To start the Chromeleon software:
•
Double-click the Chromeleon 7 icon on the desktop:
–OR–
•
Use the Windows® Start menu:
Select Start > All Programs > Chromeleon 7 > Chromeleon 7
The Chromeleon Console window opens. If user management is
active, you will be prompted to log on to the software. Enter the
credentials provided by your Chromeleon adminstrator to
proceed.
Page 4
Quick Start Guide
Chromeleon 7
2.3
Getting your Instrument Started
To control and monitor an instrument in Chromeleon you must:
•
Make sure the Instrument Controller Service is running.
•
Establish a connection.
2.3.1
Making sure the Instrument Controller Service is
Running
The Chromeleon Instrument Controller Service handles
instrument communications, control, and data acquisition. It
runs in the background as a Windows service on any PC to which
instruments are physically connected. Its status is represented by
an icon in the Notification Area of the Windows taskbar
(Figure 1).
Figure 1: Notification Area of Windows Taskbar for Windows XP
and Windows 7
Instrument Controller Service is stopped
Instrument Controller Service is running
Quick Start Guide
Page 5
Chromeleon 7
If the Instrument Controller Service is stopped, start it by
following these steps:
1.
Right-click the Chromeleon tray icon in the notification area
of the Windows taskbar.
2.
Click Start Chromeleon Instrument Controller.
Tip:If the Chromeleon tray icon is not visible on the taskbar,
click Start, point to Programs (or All Programs, depending on
the operating system), open the Chromeleon 7 folder and click
Services Manager.
Note: You can configure the Chromeleon Instrument
Controller Service to automatically start every time the
computer is switched on. See the Controlling Instruments and
Modules section of the Chromeleon Help for more
information.
2.3.2
Establishing a Connection
Before you can control an instrument, communication must be
established between the modules and the Chromeleon
Instrument Controller. This is referred to as Connecting the
Modules.
To connect the modules follow these steps:
1.
In the Console, choose the Instruments category and click
your instrument’s name in the Navigation Pane.
2.
Select the ePanel tab for the required module in the Work
Area (for example Pump).
Page 6
Quick Start Guide
Chromeleon 7
3.
On the ePanel, click Connect.
Note: The ePanel sets are generated automatically to support
modules from a specific instrument series (e.g., UltiMate
3000, ICS-5000). When combining modules from these
instruments, ePanels for some modules may not be displayed
automatically. See Managing ePanel Sets and ePanels in the
Chromeleon Help for details on manually adding ePanels to a
set.
2.3.3
Controlling and Monitoring the Instrument
Usually, samples are analyzed as part of a sequence using a
predefined set of instrument commands stored in an Instrument
Method. Sometimes (typically between sequence runs) it is
necessary to issue individual commands to the instrument
modules, such as for starting or stopping the flow, setting eluent
composition, switching on or off the detector lamp, or
monitoring the baseline.
To issue instrument commands follow these steps:
1.
In the Console, choose the Instruments category. Select the
instrument by clicking its name in the Navigation Pane.
2.
In the Work Area select the ePanel tab for the required
module.
3.
Use the controls on the ePanel to issue instrument
commands (for example setting the wavelength of a UV/VIS
detector or starting mobile phase flow on a pump).
When an analysis is running, you can monitor instrument
parameters and outputs, such as the detector signal output or
pump pressure, from the module’s ePanel. To monitor the
detector signals without starting a sequence, click Monitor
Quick Start Guide
Page 7
Chromeleon 7
Baseline on the toolbar above the ePanel set. Click the same
button again to stop monitoring the baseline. You can also save
the monitor baseline data. For details see Monitor the Baseline in
the Chromeleon Help.
Note: Most common commands are available from the
ePanels. If you need to execute a command that is not
available you can access all available instrument commands
from a dialog box that is accessible via the Command button
in the Instruments toolbar.
Tip:For certain instruments, Chromeleon provides procedures
for automatically starting or shutting down a chromatography
system, or setting it into standby mode. These procedures are
referred to as Smart Startup, Smart Shutdown, and Smart
Standby, respectively. For details of which instruments can be
controlled in this way and how to use this functionality see
Smart Startup, Smart Shutdown, and Smart Standby in the
Chromeleon Help.
Page 8
Quick Start Guide
Chromeleon 7
2.4
Creating a Sequence
A sequence determines how a group of injections should be
processed. The injection list is the primary element of the
sequence. The list groups injections in the order in which they
will be processed and includes injection variables (name, type,
etc.) that characterize each injection.
Sequences can be created in the Console or by using an
eWorkflow. eWorkflows are simple but powerful tools for
creating sequences based on pre-defined templates and rules.
For more information on creating and using eWorkflows see
Creating eWorkflows in the Chromeleon Help.
You create a sequence using the Sequence Wizard within the
Console. But first, the following files should be prepared:
•
Instrument Method
•
Processing Method
•
Report Template
2.4.1
Creating an Instrument Method
1.
In the Instruments category of the Console, select the
instrument from the Navigation Pane for which you want to
create the intsrument method.
2.
On the Create menu, click Instrument Method.
3.
Complete all wizard steps and click Finish.
The created instrument method opens in the
Chromatography Studio.
4.
Review the instrument method by selecting the module
views in the Navigation Pane. Edit settings, if required.
Quick Start Guide
Page 9
Chromeleon 7
5.
Save the instrument method using the Save icon
in the
Quick Access Toolbar and specify a location and object
name.
6.
Close the Chromatography Studio.
2.4.2
Creating a Processing Method
1.
In the Console, on the Create menu, click Processing Method.
2.
Select one of the predefined layouts and click Next.
3.
Enter a name, select a file location and optionally enter a
comment.
4.
Click Finish to save the processing method and close the
wizard.
The new processing method opens in the Chromatography
Studio.
2.4.3
Creating a Report Template
1.
In the Console, on the Create menu, click Report Template.
2.
Select one of the predefined templates and click Next.
3.
Select a file location and enter a file name.
4.
Click Finish to save the report template and close the wizard.
2.4.4
Creating a Sequence
To create a sequence using the Sequence Wizard within the
Console:
1.
In the Instruments category of the Console, select the
instrument from the Navigation Pane for which you want to
create the intsrument method.
Page 10
Quick Start Guide
Chromeleon 7
2.
In the Console, on the Create menu, click Sequence.
3.
Complete the injection configuration settings for the
injections:
Pattern for
Injection
Name:
Number of
Vials:
Injections
per Vial:
Start
Position:
Injection
Volume:
Rack View
(Figure 2):
Specify how injections will be named.
This is a free text field to which the codes #n
#p #i and #r can be added.
(Click the
button to the right of the
Pattern for Injection Name field to see
definitions for these codes)
Specify the total number of vials in the
analysis.
Specify the number of injections per vial in
the analysis.
Specify the sequence start position of the
sequence for the analysis. This specifies the
position of the first vial in the autosampler.
The wizard automatically increments for the
following vials.
Specify the injection volume.
If your autosampler supports the preview
function, the rack view provides a graphical
representation of the trays and racks that
are installed on the selected instrument. The
preview also allows you to conveniently
determine the position of the first sample in
the autosampler tray. Simply click a vial to
specify the required start position. The
information in the Start Position edit field is
automatically updated.
Quick Start Guide
Page 11
Chromeleon 7
Figure 2: Rack View
4.
Click Next.
Note: When you are creating a sequence using the wizard, you
can only add injections with type Unknown. After the
sequence has been created, you can modify the injection
types and positions.
5.
Select methods and reporting preferences: For each field use
the
button to navigate to and select the file you want
to use. When all fields are completed click Next.
6.
Enter a comment for the sequence (optional) and click
Finish.
7.
The Save dialog box opens.
8.
Specify where to save the sequence, enter a file name and
click Save.
Page 12
Quick Start Guide
Chromeleon 7
9.
If necessary, change the injection names, injection types,
injection positions, and other entries. For an overview of
injection types, refer to section 3.3.1.2.
The sequence is now visible in the Chromeleon Console’s
Navigation Pane.
Quick Start Guide
Page 13
Chromeleon 7
2.5
Acquiring Data
2.5.1
Starting an Analysis
After the sequence has been created and the instrument is
ready, you can start data acquisition.
2.5.1.1 Checking that the Instrument is Ready
1.
In the Console, choose the Instruments category. Select the
instrument by clicking its name in the Navigation Pane.
2.
In the Work Area select the ePanel tab for the required
module. To check the baseline, for example, select the
detector’s ePanel and click the Monitor Baseline button.
When you are satisfied that the instrument is ready for analysis,
start the sequence.
2.5.1.2 Starting the Sequence
1.
Select the Data category in the Console.
2.
In the Navigation Pane, select the sequence you want to run
by clicking on it.
The Sequence then opens in the Work Area.
3.
Do one of the following:
•
Click the down arrow on the Start button. Click Add to
Queue.
–OR–
•
Page 14
Click the
button on the Sequence Control Bar
above the injection list to add the sequence to the queue
and immediately start the queue.
Quick Start Guide
Chromeleon 7
The sequence is added to the queue. If the queue is empty, a
Ready Check is performed and the queue is started if there are
no errors. (Figure 3).
Figure 3: Running Sequence
Note: The Chromeleon Queue can be used to schedule
multiple sequences to run in succession. See Managing
Queues in the Chromeleon Help for information on using
Queues.
Tip:With Chromeleon, you can automatically start or shut
down a chromatography system, or set it into standby mode.
This is called Smart Startup, Smart Shutdown, and Smart
Standby. For details of the supported instruments and how to
use this funtionality, see Smart Startup, Smart Shutdown, and
Smart Standby in the Chromeleon Help.
Quick Start Guide
Page 15
Chromeleon 7
2.5.2
Monitoring an Ongoing Analysis
During analysis it is useful to monitor the detector signal and
other instrument parameters (such as pressure and
temperature).
To monitor an ongoing analysis:
1.
In the Console, choose the Instruments category and click
your instrument’s name in the Navigation Pane.
2.
Select the Home ePanel in the Work Area to monitor the
detector signal and audit trail.
Note: The settings of other modules can be monitored on
their respective ePanels.
Page 16
Quick Start Guide
Chromeleon 7
2.6
Processing Data
After chromatographic or mass spectrometry data has been
acquired, it can be processed. All processing steps are performed
in the Studio and saved in a processing method.
To open the Studio from the Console, double-click any object in a
sequence, or click the Studio
button.
Chromeleon has a variety of tools to simplify or speed up data
processing tasks, such as SmartPeaks, but only the most
common processing steps are described in this Quick Start Guide.
Note: When you make a change in the processing method, the
results for all injections in the sequence which use that
processing method are recalculated instantaneously. There is
no need to “reprocess” the sequence or manually update
results.
2.6.1
Reviewing Data in the Chromatography Studio
After data for all samples in a sequence has been acquired, it is
useful to review the chromatograms and peak data before
reporting the results. Often, peak detection, integration and
calibration settings need to be modified before results are
reported. See chapter 2.6.2 and onwards.
1.
In the Chromeleon Console, select the Data category.
2.
Open the first injection of the sequence in the
Chromatography Studio by double-clicking an injection in the
the Chromeleon Console’s Work Area.
The Chromatography Studio opens.
Quick Start Guide
Page 17
Chromeleon 7
3.
Open the Data Processing Category and in the Navigation
Pane select the injection you want to view.
The data for that injection is displayed in the Work Area,
using the default preset view.
Tip:There are several views in Chromeleon which can be
selected from the Presets group on the Data Processing Home
tab. You can also create new views and store these to be used
again. See Create New View Settings in the Chromeleon Help
for details on setting up custom views.
4.
You can navigate through the data by:
•
Using the buttons in the Navigation group of the Data
Processing Home tab.
•
Selecting injections, channels, or components in the
Navigation Pane.
–OR–
•
Page 18
Double-clicking a component or injection in the
Integration or Summary table in the Interactive Results
pane (Figure 4).
Quick Start Guide
Chromeleon 7
Figure 4: Selection in Interactive Results table
This section covers:
•
Working with Chromatograms
•
Detecting and Integrating Peaks
•
Identifying Peaks
•
Calibration and Quantitation
2.6.2
Working with Chromatograms
You can view the integrated chromatogram of the current
injection in the chromatogram plot (Figure 5).
If the evaluation of data is not what you want, you can, for
example, change the peak delimiters and the baseline directly in
the chromatogram. Of course, you can adapt the layout of the
chromatogram to your needs. It is also possible to overlay other
chromatograms for comparison. For details, refer to Working
with Chromatograms in the Chromeleon Help.
Quick Start Guide
Page 19
Chromeleon 7
Figure 5: Chromatogram Plot
Tip:You can overlay chromatograms from different injections
or channels by using the pins
in the Navigation Pane or by
selecting the channels in the Navigation Pane (to select two or
more channels, hold down CTRL or SHIFT, and then click the
channels).
2.6.3
Detecting and Integrating Peaks
For correct quantification or qualification of a chromatogram, all
peaks of interest must be detected and correctly integrated. To
achieve this you can either:
•
Create a new set of detection parameters.
–OR–
•
Modify an existing processing method
For the purposes of this guide it is assumed that the user will first
create a new set of detection parameters (using the Cobra
detection algorithm) and then modify these to improve the
integration and peak detection.
Page 20
Quick Start Guide
Chromeleon 7
Note: On the MS Detection tab page in the Processing
Method, you can select a peak detection algorithm
(Chromeleon 6, Cobra, Genesis, or ICIS) for your MS data. You
can apply the peak detection settings to the entire
chromatogram and/or you can define different peak detection
settings for individual extracted ion chromatograms. The
defined algorithm and settings apply to this extracted ion
chromatogram only. For all other data than MS data, the
detection algorithm can be set on the Detection tab page in
the Processing Method.
2.6.3.1 Creating a New Set of Cobra Detection Parameters
This section gives information on how to set up a new processing
method and use the Cobra™ Peak Detection Wizard to
determine the initial integration settings for a chromatogram.
For more information about creating processing methods, see
section 2.4.2.
1.
Open the sequence in the Chromatography Studio (by
double-clicking an injection in the Console) and open the
Data Processing category.
2.
Select the chromatogram by clicking somewhere in the
chromatogram plot area.
3.
Click the Processing tab and activate the Cobra™ Peak
Detection Wizard by selecting the Cobra Wizard
Detection Parameters group.
in the
The Cobra Wizard opens.
4.
Select the area of the chromatogram to be integrated.
If the section selected contains negative peaks (for example
solvent peaks), you can specify that these are ignored during
Quick Start Guide
Page 21
Chromeleon 7
Cobra Peak Detection by checking the Consider Void Peak
check box. Otherwise leave this check box cleared.
Click Next.
5.
Choose one of the following possibilities to define a range in
order to determine baseline noise:
•
Select the Use Auto Range option (default), which
calculates a suitable time range.
–OR–
•
Manually enter a baseline.
Click Next.
6.
Choose one of the following possibilities for smoothing
chromatographic data:
•
Select the Use Auto Smoothing Width option (default) for
automatically smoothing data.
–OR–
•
Select the narrowest peak in the chromatogram in order
to define the Cobra smoothing width used for peak
detection.
Click Next.
7.
Choose one of the following possibilities to define the peak
area threshold which determines the minimal peak area. Any
peaks whose area is below this threshold will be ignored
during detection or integration:
•
Select the Use Auto Minimum Area (default) option,
which automatically calculates a minimum area.
–OR–
Page 22
Quick Start Guide
Chromeleon 7
•
Select the smallest peak in the chromatogram that you
want to be detected (the minimum area will be set to 90%
of the area of the selected peak).
Click Next.
8.
Use the drop-down Channel menu to select the channel, and
the Injection Type field to specify which data the integration
settings will apply to.
Click Finish.
9.
Click the Chromeleon icon
and select Save > Save from
the menu to save the updated processing method.
The Cobra™ Peak Detection Wizard determines the best initial
integration settings for a chromatogram. For simple
chromatograms, where all peaks are well resolved, these settings
will be ideal. For complex chromatograms or where peaks are
only partially resolved, the addition of further detection
parameters may be required.
2.6.3.2 Modifying an existing Processing Method
2.6.3.2.1
Insert a New Detection Parameter
To insert a new detection parameter, follow these steps:
1.
Click in the chromatogram plot.
2.
Click the Processing tab.
3.
If not already shown, display the detection parameters in the
chromatogram, by clicking Detection Parameters
the Detection Parameters group.
4.
Click the arrow on the Insert
Quick Start Guide
in
button.
Page 23
Chromeleon 7
5.
Select the appropriate detection parameter from the list.
The most frequently needed parameters are listed here. If
you need other detection parameters, select Other
Parameter.
For a list and further details on all Chromeleon detection
parameters, see Detection Parameters (Overview) in the
Chromeleon Help.
6.
Move the cursor to the location in the chromatogram where
you want to insert this parameter and click.
The new detection parameter is placed in the chromatogram
and peak integration is automatically updated.
Detection parameters have a tag which shows details of the
parameter and a vertical dashed line which shows the exact point
of the detection parameter in the chromatogram.
2.6.3.2.2
Move, Modify and Delete Detection Parameters
1.
Click in the chromatogram plot.
2.
Click the Processing tab.
3.
If not already shown, display the detection parameters in the
chromatogram, by clicking Detection Parameters
Detection Parameters group.
4.
in the
In the Pointer / Zoom group, ensure that the
Automatic
tool is selected.
To Move a Detection Parameter:
•
Page 24
Drag the detection parameter to the required location
(you can drag a detection parameter by its tag or line).
Quick Start Guide
Chromeleon 7
To Edit the Value of a Detection Parameter:
•
Double-click the tag and select a new setting from the list.
To Change the Type of Detection Parameter:
•
Right-click on the detection parameter and select Edit
Detection Parameter.
The Edit Cobra Detection Parameter dialog box opens.
•
Select a new detection parameter type from the
Parameter Name field and set any parameter values
needed.
•
Click OK to save the change and close the Edit Cobra
Detection Parameter dialog box.
To Delete a Detection Parameter:
•
Right-click on the detection parameter and select Delete
Detection Parameters.
2.6.3.2.3
Integrate Unresolved Peaks
Partially resolved peaks can be difficult to integrate. The
SmartPeaks™ integration assistant helps you to integrate these
peaks:
1.
Click in the chromatogram plot.
2.
Click the Processing tab.
3.
On the Detection Parameters group, click SmartPeaks.
4.
Use the cursor to drag a rectangle in the chromatogram
around the area that contains the partially resolved peaks.
The SmartPeaks: Select Alternative dialog box opens
(Figure 6).
Quick Start Guide
Page 25
Chromeleon 7
Figure 6: SmartPeaks: Select Alternative dialog box
Tip: For more options you can click the Advanced tab in the
SmartPeaks: Select Alternative dialog box. For details of how
to use these settings see SmartPeaks: Select Alternative in the
Chromeleon Help.
5.
Select the preferred peak detection and click OK.
6.
The detection parameters in the processing method are now
updated and the new detection parameters are shown in the
chromatogram.
2.6.4
Identifying Peaks
After peaks have been detected and satisfactorily integrated,
they can be used for reporting or results calculations. When
reporting, it is useful to name components in a chromatogram.
When performing Calibration and Quantification, it is essential
that at least the calibration peaks in a chromatogram are named.
Page 26
Quick Start Guide
Chromeleon 7
The process of assigning a name to a component is called
identification. The names and expected retention times of
named components are stored in a Chromeleon component
table.
The following sections describe how to:
•
Create a component table.
•
Update the expected retention times and windows.
2.6.4.1 Creating a Component Table
There are three ways to create a component table:
•
Via the Component Table Wizard
•
Interactively in the chromatogram pane
•
Via the component table (processing method)
2.6.4.1.1
Via the Component Table Wizard
To create a component table by using the Component Table
Wizard:
1.
Click in the chromatogram plot.
2.
Click the Processing tab.
3.
If not already shown, display the peak windows in the
4.
chromatogram, by clicking Peak Windows (
Component Table group.
) in the
Click the Component Table Wizard button (
).
The Component Table Wizard dialog box opens.
The 5-page wizard guides you through the process of naming
components. On the first 4 pages you can specify whether to
Quick Start Guide
Page 27
Chromeleon 7
keep existing components (adding new components to the
existing ones), the time range over which to consider
components, and a minimum area below which components
are ignored. On the final page you can name all found
components, modify the retention time and peak window,
and add comments.
5.
Click Finish to save the component table updates and close
the Component Table Wizard.
The chromatogram view in the Chromatography Studio Work
Area is automatically updated to display the new component
windows.
2.6.4.1.2
Interactively in the Chromatogram Pane
To add a component from the chromatogram plot:
1.
Click in the chromatogram plot.
2.
Click the Processing tab.
3.
Activate the Peak Windows option and the Add Component
option in the Component Table group.
4.
Drag a rectangle around the peak you want to add to the
component table.
The peak is added to the component table with a generic
name (for example Component 1) and the peak window is
visible in the chromatogram plot.
5.
Double-click the peak window tag and enter the component
name.
Page 28
Quick Start Guide
Chromeleon 7
2.6.4.1.3
Via the Component Table (Processing Method)
To create a component table in the processing method:
1.
Click the Data Processing Home tab.
2.
In the Panes group, click Processing Method to display the
processing method.
Tip: You can maximize screen space by hiding the other panes
and view the processing method only. In the Panes group,
disable the panes that are not currently needed.
3.
In the processing method, select the Component Table tab.
4.
Click the Click here to add a new component link at the
bottom of the component table.
A Create new Component dialog box opens.
5.
Type the name of the component in the Name field and click
Create.
A new component is created and diplayed in the component
table.
6.
Update the component retention time and window in the
Ret. Time and/or Window columns of the component table.
Quick Start Guide
Page 29
Chromeleon 7
Tip: Over a period of time, peak retention times may drift
from their expected values. Because of this, it is sometimes
useful to set wide peak windows in the component table.
When peak retention time drift is too large for this method to
compensate, you can use the retention time of a previous
peak for peak identification. For details on correcting for
Retention Time drift see Identify Peaks in the Chromeleon
Help.
2.6.4.2 Modifying Retention Times and Windows
You can modify the retention time and width of the peak window
by modifying the properties in the component table or by
dragging the peak window on the chromatogram plot.
2.6.5
Calibration and Quantitation
In order to convert the area below a peak or the peak height into
absolute amount or concentration values, calibration is required
before the analysis. The calibration coefficients obtained during
calibration can then be used to calculate unknown amounts.
This section takes you through the steps required to perform a
simple external standard calibration (using a single component
standard at multiple concentrations). Chromeleon supports
various methods of calibration including internal standards and
standard addition. For information on using these methods of
calibration, see Calibration and Amount Calculation in the
Chromeleon Help.
To perform a simple calibration in Chromeleon you need to:
•
Specifiy which injections are Calibration Standards.
•
Create Calibration Levels and assign these to the Calibration
Standards.
Page 30
Quick Start Guide
Chromeleon 7
•
Enter the amount or concentration of the Calibration
Standards.
•
Review the calibration curve.
2.6.5.1 Specifying which Injections are Calibration Standards
Calibration standards are marked as such in the injection list:
1.
Click the Injection List Category in the Chromeleon
Chromatography Studio window.
2.
For each Calibration Standard injection, click in the Type
field and select Calibration Standard from the list of types.
2.6.5.2 Creating and Assigning Calibration Levels
1.
Click the Injection List Category in the Chromeleon
Chromatography Studio window.
2.
Click in the Level cell for the first calibration standard and
select Create new level. The value 01 is added. Assign this
level to all injections of this calibration standard.
3.
Repeat Step 2 for all calibration levels.
2.6.5.3 Entering Calibration Standard Amounts or
Concentrations
1.
Click the Data Processing Category in the Chromeleon
Chromatography Studio window.
2.
In the Panes group of the Data Processing Home tab, click
Processing Method.
3.
In the processing method, select the Component Table tab
(Figure 7).
Quick Start Guide
Page 31
Chromeleon 7
Figure 7: Component Table
4.
Enter the standard amount for each level of the calibration
component in the appropriate cell (Level “01”, Level “02”,
etc).
Calibration curves are updated automatically when you make
changes to calibration standards.
2.6.5.4 Viewing Calibration Curves
You can view the calibration curve(s) (Figure 8) in the Data
Processing Category of the Chromatography Studio:
1.
Click the Data Processing Category in the Chromeleon
Chromatography Studio window.
2.
Go to the Data Processing Home tab.
3.
Either:
•
Select a preset work area layout which contains a
calibration pane from the Presets group.
–OR–
•
Page 32
Select Calibration Plot in the Panes group (Figure 8).
Quick Start Guide
Chromeleon 7
Figure 8: A Calibration Curve
Tip: You can view the calibration curve for each component
of a multi-component standard by double-clicking the
component in the calibration table, selecting the peak in the
chromatogram, or by using the
buttons in
the Navigation group of the Data Processing Home tab.
Quick Start Guide
Page 33
Chromeleon 7
2.7
Reviewing and Reporting Results
After data has been acquired and calibration performed you can
review and report results.
You can create report templates (which output results and other
data) in any format and layout you require, or use one of
Chromeleon's default templates. This Quick Start Guide gives
information on using the default templates only; for information
on modifying report templates or creating new templates see
Designing Reports in the Chromeleon Help.
To review and report results, you must first associate a template
with the sequence. Once you have done this you can then:
•
Review the results.
•
Print results.
•
Export a report.
In Chromeleon you can create an electronic report which can
include worksheets comprising of chromatograms, tables, charts,
calibration curves, and other instrument or results values. These
electronic reports can be subjected to an Electronic Signature
process for approval. For more information on creating and using
electronic reports and the electronic signatures functionality see
Electronic Reports in the Chromeleon Help.
2.7.1
Reviewing Results
The results can be reviewed by clicking the appropriate tab at the
bottom of the Work Area of the report template.
You can navigate through the sequence by:
•
Using the Previous and Next buttons in the Navigation group
of the Home tab.
Page 34
Quick Start Guide
Chromeleon 7
•
Selecting the injection and/or channel you want to view in the
Navigation Pane.
2.7.2
Printing Results
When printing results, you can:
•
Print the currently selected injection only.
•
Print the entire sequence.
Both processes will be described in the following sections.
Tip: With the autorepeat area function, you can create a single
report template that will be suitable for a range of methods,
whether a method uses one data channel or several, or
analyzes only one compound or several. Chromeleon will
automatically report the relevant results. For details, refer to
Define Autorepeat Areas in the Chromeleon Help.
2.7.2.1 Printing Results for a Single Injection
To print the results for the currently selected injection:
1.
Select the Report Designer category from the
Chromatography Studio.
2.
In the Navigation Pane, select the injection you want to print
out.
3.
On the Studio Menu, select Print to open the Print dialog box.
4.
From the Print dialog box, select:
•
Apply to Current Injection.
•
The Printer you want to use.
Quick Start Guide
Page 35
Chromeleon 7
•
The Sheets to be printed for the current injection.
The results for the current injection are now printed.
2.7.2.2 Print Results for the Entire Sequence
To print results for the entire sequence, follow the steps for
“Printing Results for a Single Injection”, but in the Print dialog
box:
•
Select Apply to Current Sequence.
•
When selecting the Sheets to be printed you can click the
Down Arrow in the Condition column to apply print
conditions for the selected sheet.
Tip: To print several injections from a sequence, first select
the injection row or rows you want to print, right-click, and
then click Print.
Page 36
Quick Start Guide
Chromeleon 7
2.8
MS in Chromeleon
MS instrument control and data visualization / processing
support are provided starting in Chromeleon 7.2. Many of the
features that can be used for LC, IC and GC analysis can be used
for MS analysis. This section describes the features which are
unique to MS.
2.8.1
MS Instrument Control
Direct instrument control is governed by the MS driver and
external program provided with the MS hardware. Please refer to
the User Manual provided for your specific MS model for
instructions on how to use the external program.
2.8.1.1
Creating an MS Instrument Method
Please refer to the User Manual provided with your specific
hardware.
2.8.2
Acquiring Data with an MS
Data acquisition with an MS after an MS instrument method is
created is identical to data acquisition with non-MS instrument
configurations. Please refer to section 2.5 for more details.
2.8.3
MS Data Visualization
MS data visualization can be done with the spectral plot
independent or dependent of the chromatogram plot. The basic
functionality is described in this section.
Quick Start Guide
Page 37
Chromeleon 7
2.8.3.1
MS Plot
The MS Plot can be enabled by clicking the
button
in the Panes group of the Data Processing Home tab (Figure 9).
Figure 9: Mass Spectra Plot
To display spectra, the user is required to select one of the
following:
•
A peak from the chromatogram.
•
A component from the navigation pane.
–OR–
•
A data point using the Time Spectra Tool in the Peak Purity
group on the Layout tab page of the Data Processing
Category.
Plot Mode: MS data can be acquired in either profile (continuous)
or centroid (discrete) mode. Profile data can be algorithmically
converted to centroid format, but centroid to profile is not possible.
Select a mass spectra plot to display the Spectral Plot Tools ribbon.
Then click the Layout tab. To view data in centroid mode, click the
Page 38
Quick Start Guide
Chromeleon 7
Centroid radio button in the Plot Mode group, or Automatic in
order to view all data as it was originally acquired.
Overlays: In order to view supplemental spectra, click
or
in the Overlays group.
The Overlays group is equal to the Plot Mode on the Layout tab
page on the Spectral Plot Tools ribbon. Click Reference to view
additional options to select the desired reference spectrum.
Some of the overlay functions, for example the Background
overlay, require relevant settings to be defined in the processing
method.
Extracted Ion Chromatogram (XIC): When chromatographic MS
data is acquired, this is displayed as a Total Ion Chromatogram (TIC)
which is created by summing all mass peaks for each data point. In
order to increase specificity for a component and to reduce
background noise contribution, an XIC is created.
An XIC can be created in two manners:
•
Left-click a mass peak in the mass spectrum when the
cursor appears.
–OR–
•
Right-click a mass peak in the mass spectrum and select
Extract Ion Chromatogram… from the context menu. The
Extract MS Channel dialog box opens (Figure 10).
Quick Start Guide
Page 39
Chromeleon 7
Figure 10: Extract MS Channel dialog box
Both actions will result in a new chromatographic channel being
created from the selected mass-to-charge ratio or range.
2.8.4
MS Data Processing (Processing Method)
The basic principles behind MS data processing are similar to
data processing of non-MS data. The differences for MS will be
covered in this section. Please refer to section 2.6 for general
information on data processing.
In order to display MS data processing settings, click the
Processing Method tab of the Data Processing category and
select the All Settings layout in the Layouts group (Figure 11).
Figure 11: All Settings Selection in Layouts group
Page 40
Quick Start Guide
Chromeleon 7
2.8.4.1
MS Peak Detection Algorithms
In addition to COBRA and Chromeleon 6 algorithms, two new
algorithms are introduced – Genesis and ICIS.
•
Genesis: This algorithm is generally used for processing data
with noisy baseline such as MS full scan data. In some
instances, the algorithm may also be used with non-MS data
as well. These include, but are not limited to UV, CD, and ED
data.
•
ICIS: This algorithm is recommended when dealing with data
with very low noise or abstracted data such as that acquired
in SIM or SRM mode or extracted post-acquisition as XICs.
2.8.4.2
MS Detection Tab
On this tab page in the processing method, you can define
default MS detection settings or detection settings on a
component-by-component basis. In the Extracted Ion
Chromatogram dropdown, all components denoted with
are
using detection settings specific to that component. All other
components use default MS detection parameters.
When selecting the ICIS and Genesis algorithms for the first time,
all parameters come populated with recommended default
values.
2.8.4.3
Component Table – Advanced Tab
In order to process and quantitate components using XICs from
MS data, you are required to define a special channel for the
desired components.
In the Channel column of the component table, all components
being quantitated using an XIC must be set to MS Quantitation
via the dropdown (Figure 12 and Figure 13).
Quick Start Guide
Page 41
Chromeleon 7
Figure 12: MS Quantitation selection in Component Table
Figure 13: MS Quantitation channel
2.8.4.4
Component Table Properties – Extracted Ion
Chromatograms
1.
Select a component by highlighting en entire row in the
component table, click Show Properties to display the
Properties dialog box, then select Extracted Ion
Chromatograms in the properties navigation pane
(Figure 14).
2.
Click
to create a new Quantitation XIC.
If there are currently no XICs defined, the MS Quantitation
Page 42
Quick Start Guide
Chromeleon 7
Peak tab page is added. Otherwise, an MS Confirming Peak
tab page is created.
In order to assist you define additional detection
parameters, Chromeleon displays the mass spectrum at the
specified retention time. Note that no mass spectrum might
exist at the exact retention time. In this case, the MS
Quantitation Peak tab will show the nearest spectrum to the
defined retention time from the XIC.
Figure 14: Extracted Ion Chromatograms property page
3.
In the Type field, select the appropriate selection
Quick Start Guide
Page 43
Chromeleon 7
a.
TIC –Typically used for processing of acquisition of nonmultiplexed SIM or SRM experiments.
b.
Mass Range – Typically used for processing of Full Scan
experiments.
Note: If selecting TIC, skip steps 4 and 5.
4.
(Optional) If SRM data was acquired, type in the mass in the
Precursor Mass field. If a large number of acquisition filters
exists, this will assist you in limiting the selectable filters to
only those of interest (Figure 15).
Figure 15: Filtration of scan list by entering SRM precursor mass
5.
Type in a SIM / SRM product ion mass or mass range in the
XIC Mass(es) or Range(s) field. Similar to the Precursor Mass
field, this field will assist in limiting the selectable filters to
Page 44
Quick Start Guide
Chromeleon 7
only those of interest. In addition, this field will also define
which mass(es) are used to create the XIC.
6.
Select the appropriate filter from the Filter field dropdown.
Based on the combination of the Filter and XIC Mass(es) or
Range(s), an XIC for evaluation will be created in this UI
(Figure 16).
Figure 16: XIC displayed based on parameters
(Optional steps to set up Confirming XIC for component)
7.
Click
to create a new Confirming XIC.
8.
Repeat steps 3 through 6 to setup the XIC for a confirming
peak.
9.
Click on Enable underneath the Ratio header.
10. Set the expected Target Ratio % (peak area) relative to the
Quantitation peak.
11. Select Relative or Absolute tolerance for the Target Ratio
Window Type.
12. Set the tolerance Window %.
If the target ratio is set to 50 %, the Window to 10%, the
peak area ratios falling within the following windows will
result in a confirmed component:
Absolute: 40 – 60%
Quick Start Guide
Page 45
Chromeleon 7
Relative: 45 – 55%
13. Set the absolute tolerance in minutes for the confirming
peak in the Ion Coelution field.
After completion of these steps, combined with the steps
outlined in section 2.6, it will be possible to review and report
out on the resultant data. See the Extracted Ion Chromatograms
section of the Chromeleon Help for more information.
Page 46
Quick Start Guide
Chromeleon 7
3
Appendix: Chromeleon Overview
3.1
Introduction
Chromeleon is a Chromatography Data System that allows you to
control chromatography instruments and evaluate, process,
report, and backup data.
Chromeleon has several software components:
Instrument Controller Service: The Instrument Controller Service
handles communication with and data acquisition from the
connected instruments.
Client: The Chromeleon Client provides the user interface for all
tasks related to instrument operation, data analysis, and data
management.
Services Manager: Shows the status of the Chromeleon
Instrument Controller Service and provides a user interface to
control this service. The status of all other Chromeleon services is
also displayed.
Instrument Configuration Manager: Allows configuration of
instruments connected to the Instrument Controller PC.
Administration Console: Central access point for administrative
tasks, like:
•
License Manager: Provides tools for managing licenses for
Chromeleon stations and users.
•
Scheduler: Provides tools for scheduling data transfer.
Quick Start Guide
Page 47
Chromeleon 7
•
User Database: Provides tools for managing system policies,
users and roles, access privileges, and operational privileges.
•
Global Policies: Provides settings for global Chromeleon
policies.
•
Discovery: Central repository containing information about
the available instruments and Data Vaults.
•
Local Machine: Provides tools for managing local
Chromeleon 7 Data Vaults (Create, Mount and Dismount)
and Chromeleon 6 Datasources (Mount and Dismount), and
enables you to change the Chromeleon Domain Controller.
Page 48
Quick Start Guide
Chromeleon 7
3.2
Instrument Controller Service
The Chromeleon Instrument Controller Service handles all realtime instrument processes (communications, control, and data
acquisition). It runs in the background as a Windows service on
PCs to which instruments are physically connected. Its status is
represented by an icon
in the Notification Area of the
Windows Taskbar (Figure 17).
Figure 17: Notification Area of Windows Taskbar for Windows XP
and Windows 7
You can add, configure, or delete instruments and modules,
connect to instruments, and track changes made to instruments
from the Instrument Configuration Manager.
Quick Start Guide
Page 49
Chromeleon 7
3.3
Chromeleon Client
The Chromeleon Client provides the user interface for all tasks
related to instrument operation, data analysis, and data
management.
The Chromeleon Client contains two windows:
Chromeleon
Console:
Chromatography
Studio:
Page 50
The main Chromeleon window in which
you can control instruments, navigate
through all data, and use or manage
eWorkflows.
A separate window that is launched from
the Console, in which you can work with
data and objects related to a selected
sequence. Here you can view and optimize
all aspects of the data, modify instrument
methods and processing methods, define
and generate reports, and manage spectral
libraries.
Quick Start Guide
Chromeleon 7
3.3.1
Chromeleon Console
When you start Chromeleon 7, the Console is the first window to
appear. The Console window has three major parts (Figure 18).
Navigation Pane
Work Area
Sequence
Control Bar
Figure 18: Chromeleon Console
Category Bars
Quick Start Guide
Status Bar
Page 51
Chromeleon 7
1.
Category Bars: Use the category bars to switch between the
three categories: Instruments, Data and eWorkflows (Figure
19).
Figure 19: Category Bars
2.
Navigation Pane: Here you can navigate the objects related
to the selected category.
3.
Work Area: This area shows the content of objects selected
in the Navigation Pane. Here you can work on Chromeleon
objects.
There are three additional parts for user interaction:
The Navigation Pane has a top-level filter that lets you control
which instruments, data vaults, or eWorkflows are displayed:
a.
Local: Items available on the local Chromeleon station.
b.
All: Items available on the Chromeleon Domain.
c.
Favorites: Filter for displaying commonly used items.
d.
Custom: Filter based on text input.
The Sequence Control Bar above the injection list indicates the
sequence status (New, Running, Complete, Interrupted,
Incomplete) and can be used to start and stop a sequence. It is
only available when a Sequence is selected in the Navigation
Pane.
Page 52
Quick Start Guide
Chromeleon 7
Note: When a sequence is configured to be electronically
signed, additional statuses are available.
The Status Bar shows general information such as the currently
logged on user.
3.3.1.1 Instruments
The Instruments category provides access to all instruments on
the network (this might be limited by user privileges).
When the Instruments category is selected, the configured
instruments are displayed in the Navigation Pane . The Work
Area gives details about the instrument selected in the
Navigation Pane.
From the Work Area you can review instrument status and make
changes to instrument parameters. Across the top of the work
area a series of ePanel tabs are displayed. ePanels can be used to
monitor instrument operation and to directly control the
instrument.
Note: When you select an instrument from the Navigation
Pane that is currently offline, a message is displayed in the
Work Area.
3.3.1.2 Data
The Data category provides access to all data stored in each
connected Data Vault (
container for all data).
Note: Chromeleon 6 Datasources
are visible in
Chromeleon 7. It is not possible to make changes in these
Datasources, but data can be copied from them to
Chromeleon 7 Data Vaults.
Quick Start Guide
Page 53
Chromeleon 7
Data can be accessed and organized from the Navigation Pane.
The Work Area shows the content of the selected object and
allows you to edit the object.
A Data Vault can contain the following objects:
•
Folder: A container for objects. Use folders to organize
data in a Data Vault.
•
Sequence: A collection of injections that belong together.
A typical sequence contains an instrument and processing
method, a report template, and a view settings file.
•
Instrument Method: A collection of timed commands for
an instrument to perform during a chromatographic analysis.
•
Processing Method: A collection of parameters (including
parameters for peak detection and calibration) which are
used when evaluating chromatograms.
•
Report Template: A file which defines how data is
displayed, printed, or exported. A report template can also
contain calculations. When applied to a sequence (to view,
print, or export the results) the outcome is referred to as a
report.
•
Electronic Report: An electronic version of the results of a
sequence.
•
View Settings: The definition of how data is presented on the
screen.
•
UV Spectral Library: A collection of spectra used for peak
identification.
•
Page 54
Query: A Data Vault search.
Quick Start Guide
Chromeleon 7
•
Instrument Audit Trails: A log of instrument events such as
system settings, executed commands, and error messages.
A sequence is a collection of injections that are analyzed and
processed together in series. Each injection is represented by a
row in the sequence (replicate injections are represented with
multiple rows). Injections can have one of the following Injection
Types:
•
Unknown: A sample for which the quantity, presence, or
absence of components is to be determined during the
analysis.
•
Calibration Standard: A sample with known
concentration(s) of component(s). Calibration Standards are
used in the construction of calibration curves.
•
Check Standard: A sample with known component
concentration(s). Check Standards are used to verify a
calibration.
•
Blank: An injection used to characterize the background
signal (baseline), and/or to ensure that unwanted
components are not detected. Blank “injections” can be
made without an actual injection taking place.
•
Matrix: The sample matrix. The peak areas in the Matrix
can be subtracted from the corresponding peak areas in all
the other injections in the sequence.
•
Unspiked: An Unknown sample to be analyzed with the
Standard Addition method.
Quick Start Guide
Page 55
Chromeleon 7
•
Spiked: An Unknown sample to be analyzed with the
Standard Addition method, with known amounts of
components added.
3.3.1.3 eWorkflows
eWorkflows are electronic procedures for automating laboratory
processes related to a chromatographic analysis.
An eWorkflow contains a set of templates (such as instrument
methods, processing methods, report templates, view settings,
and/or spectral libraries) and a set of rules. The rules define, for
example, the sequence layout (such as the maximum number of
Unknown injections allowed between Calibration Standards), and
the list of instruments in the network that are suitable for the
analysis. When you start an eWorkflow, it will create a sequence
with predefined associated files and a well-defined structure.
The list of available eWorkflows is visible in the Navigation Pane.
An overview of the instruments (including their status) that can
be used with the selected eWorkflow is displayed in the Work
Area. From here you can launch an eWorkflow and will be guided
in creating an appropriate sequence.
Page 56
Quick Start Guide
Chromeleon 7
3.3.2
Chromatography Studio
In the Chromatography Studio you can edit all objects related to
the selected sequence:
•
Injection List
•
Instrument Methods
•
Processing Methods
•
View Settings
•
Report Templates
•
Electronic Reports
•
Spectral Libraries
When you open a sequence from the Console, the
Chromatography Studio (Figure 20) is opened.
Note: When you open an object outside the context of a
sequence, only the corresponding category of the Studio is
available.
Quick Start Guide
Page 57
Chromeleon 7
Studio Menu
Ribbon
Navigation Pane
Work Area
Figure 20: Chromatography Studio
Category
Bars
The Chromatography Studio is structured similarly to the
Chromeleon Console, and consists of the following major parts:
•
Category Bars (Figure 21): These switch the display between
the six categories: Injection List, Instrument Method, Data
Processing, Report Designer, Electronic Report and UV
Spectral Library.
Page 58
Quick Start Guide
Chromeleon 7
Figure 21: Category Bars
•
Navigation Pane: An area in which you can navigate through
the objects available in the selected category.
•
Work Area: The content changes according to the selected
category.
There are two additional parts for user interaction:
• Ribbon: The menu tool for main commands in the Studio.
Commands are organized in groups, which are collected
together under tabs. To reduce clutter, some tabs are only
shown when needed.
•
Studio Menu: To access the Studio Menu, click the
Chromeleon icon
in the top left corner of the
Chromatography Studio window. From this menu you can
access general tasks, such as printing, exporting, and saving.
3.3.2.1 Injection List
When the Injection List category is selected, you can edit, print,
and export the injection list.
The Navigation Pane gives an overview of all files used in the
sequence. The Work Area displays further details about each
Quick Start Guide
Page 59
Chromeleon 7
injection, such as the type of sample (for example Calibration
Standard) and the injection status.
Note: You can also edit the injection list directly in the
Console. If a sequence is open in both the Console and the
Studio, changes made in either window are automatically
made in the other, so that copies of the sequence stay
synchronized.
3.3.2.2 Instrument Method
When the Instrument Method category is selected, you can edit
instrument methods.
The Navigation Pane lists the instrument methods in the
sequence and provides an overview of the instrument’s modules.
The Work Area lets you edit the instrument method.
3.3.2.3 Data Processing
When the Data Processing category is selected, you can view
chromatography and mass spectrometry results, edit the
processing method, and manually integrate chromatograms.
The Navigation Pane gives an overview of all injections, channels,
processing methods, and view settings used in the sequence.
Chromatographic results are shown in the Work Area.
You can customize the panes displayed (such as Chromatogram,
Interactive Results, Calibration Plot, and Processing Method) on
the Ribbon by selecting or hiding each pane in the Panes group of
the Data Processing Home tab (Figure 21).
Page 60
Quick Start Guide
Chromeleon 7
Figure 22: Pane Selection in Ribbon
Tip: The Presets group (left of the Panes group in the Data
Processing Home tab) offers typical combinations of panes.
3.3.2.4 Report Designer
In the Report Designer category, you can view reports and edit
report templates.
The Navigation Pane shows a list of all channels, injections, and
report templates available in the sequence. In the Work Area you
can view and modify the report.
3.3.2.5 Electronic Report
In the Electronic Report category, you can create and manage
electronic reports. This is an electronically captured snapshot of
the results.
The Navigation Pane shows a list of all injections and sheets
available in the electronic report and the electronic report itself.
The Work Area shows the electronic report, or, when no
electronic report is available, the option to create one.
Quick Start Guide
Page 61
Chromeleon 7
3.3.2.6 UV Spectral Library
The UV Spectral Library view of the Chromatography Studio
provides tools for managing and comparing spectra extracted
from 3D Field data.
3.3.2.7 Menus
Chromeleon 7 Studio commands are accessible via the Ribbon or
Studio Menu. To access the Studio Menu, click the Chromeleon
icon
Page 62
.
Quick Start Guide
Chromeleon 7
Index
Acquiring Data
14, 37
Administration Console
47
Blank
55
Calibration
30
Calibration Curves
32
Calibration Levels
31
Calibration Standard
31, 55
Category Bars
52, 58
Check Standard
55
Chromatogram
19
Client
47, 50
Cobra
21, 23
Component Table 27, 29, 42, 43
Confirming Peak
46
Connect
6
Console
4, 50, 51
Data Processing
17, 60
Data Vault
53, 54
Data Vault Manager
48
Detection Parameters
21
Discovery Service
48
Electronic Report
54, 61
eWorkflows
50, 56
Extracted Ion Chromatogram 39
Genesis
41
ICIS
41
Identifying Peaks
26
Injection List
59
Injection Types
55
Instrument
5, 53
Instrument Configuration
Manager
47
Instrument Controller
Service
47, 49
Instrument Method
9, 54, 60
Integration
20
Interactive Results
18
Ion Coelution
46
License Manager
47
Mass Range
44
Mass Spectrometry
37
Quick Start Guide
Matrix
55
Module
6
Monitor
7, 16
MS Channel
39, 42
MS Data Visualization
37
MS Instrument Control
37
MS Instrument Method
37
MS Plot
38
Navigation Pane
13, 52, 59
Overlays
39
Peak Detection
20, 41
Plot Mode
38
Precursor Mass
44
Print
35, 36
Processing Method 10, 29, 40, 54
Quantitation
30, 42
Query
54
Queue
14
Rack View
11
Report
10, 34, 35, 54, 61
Report Designer
58
Retention Time
30
Reviewing Data
17, 34
Ribbon
59
Scheduler
47
Sequence
9, 10, 36, 54
Services Manager
47
SmartPeaks
25
Spectral Library
54, 62
Spiked
56
Start
4
Studio
17, 50, 57
Studio Menu
59, 62
Target Ratio
46
TIC
44
Unknown Injection
55
Unresolved Peaks
25
Unspiked
55
User Manager
48
Work Area
52, 59
XIC
39, 45, 46
Page 63
www.thermoscientific.com
Australia +61 3 9757 4486
Austria +43 1 333 50 34 0
Belgium +32 53 73 42 41
Brazil +55 11 3731 5140
China +852 2428 3282
Denmark +45 70 23 62 60
France +33 1 60 92 48 00
Germany +49 6126 991 0
India +91 22 2764 2735
Italy +39 02 51 62 1267
Japan +81 6 6885 1213
Korea +82 2 3420 8600
Netherlands +31 76 579 55 55
Singapore +65 6289 1190
Sweden +46 8 473 3380
Switzerland +41 62 205 9966
Taiwan +886 2 8751 6655
UK/Ireland +44 1442 233555
USA and Canada +847 295 7500