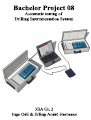
1
Automatic testing of Drilling Instrumentation system
SØR-TRØNDELAG UNIVERSITY COLLEGE
Faculty of Technology
Programme of Electrical and Computer Engineering
7004 TRONDHEIM
Bachelor project
Project title:
Automatic testing of Drilling Instrumentation system
Website:
www.hekta.org/~hpea0802
Date:
08.05.2008
Prosjekttittel (Norwegian):
Automatisk testing av Drilling Instrumenterings system
Pages/appendix:
62 / 9
Group: HPEA0802
Teaching supervisor
Group participants:
Erling Andrè Hornenes
Inge Osli
Dag Aune
[email protected]
73 55 95 83
Programme/branch of study:
Programme of Electrical and Computer Engineering
Bachelor study in automation
Project number:
08/02
Employer:
National Oilwell Varco Ltd.
Contact (employer)
Pål Jacob Nessjøen
[email protected]
51 21 75 23
Available
Available with agreement from employer
Report released after
Inge Osli & Erling André Hornenes
I|P a g e
X
Automatic testing of Drilling Instrumentation system
II | P a g e
Inge Osli & Erling André Hornenes
Automatic testing of Drilling Instrumentation system
PREFACE
During the spring of 2008 the class of 3EA at HiST has completed their bachelor project. This
project report is a result of this, and is a documentation of the bachelor project “Automatic testing
of Drilling Instrumentation system” written by group 2.
The project group’s assignment was delivered by an external employer, National Oilwell Varco in
Stavanger. Most of the work was done at their subdivision in Trondheim where the project group
disposed two workspaces in Fjordgata 82. Working with an external employer made the project
both challenging and interesting. It has been a useful experience and a motivating factor for the
group.
Experience from previous projects during the last three years, have made us capable of
completing a project of this size in a satisfying way. The acquired knowledge from the last years
have come to good use and been to invaluable help for the group. The challenge in this project
has primarily been to work with a real employer located partly at a geographical distance, and get
the complete overview of the project size.
The teaching supervisor for this project at HiST has been Dag Aune. Contact person at National
Oilwell Varco has been Pål Jacob Nessjøen and Anne Brit Ornæs. Unfortunately Anne Brit
started in a new job 1st of April. The project group will like to thank Hans Ronny Kjempekjenn
for providing us with this project and for providing us with support when needed.
This report was written in a way that an engineer without automation background with ease will
understand the content, and is meant to function as a user manual and to be helpful during further
development. The report is meant to be read in its entirety, but each chapter can be read
independently. The main chapters contain discussion about different possibilities, and an
overview of the chosen solution. Further details will be found in the enclosed appendix.
The collaboration within the group has functioned flawless throughout the project, and both
members are collectively responsible for the result.
Trondheim, May 9, 2008
_________________________
Inge Osli
Email: [email protected]
Phone: 958 29 321
Inge Osli & Erling André Hornenes
____________________________
Erling Andrè Hornenes
Email: [email protected]
Phone: 979 88 891
III | P a g e
Automatic testing of Drilling Instrumentation system
IV | P a g e
Inge Osli & Erling André Hornenes
Automatic testing of Drilling Instrumentation system
TABLE OF CONTENTS
Preface ....................................................................................................................................... III
Table of Contents......................................................................................................................................... V
Summary ....................................................................................................................................................... 1
1 Introduction ............................................................................................................................................... 3
1.1 Background ....................................................................................................................... 3
1.2 Assignment ....................................................................................................................... 4
1.3 Problem ............................................................................................................................ 4
1.4 Goals................................................................................................................................. 5
2 Methods ..................................................................................................................................................... 6
2.1 Previous knowledge .......................................................................................................... 6
2.2 Literature and resource persons ......................................................................................... 6
2.3 Project managing............................................................................................................... 6
2.4 Development process ........................................................................................................ 7
3 Work package 1: Investigate different methods for testing instrumentation systems .................... 8
3.1 Introduction....................................................................................................................... 8
3.2 Testing I/O in general ........................................................................................................ 8
3.3 How the test is preformed at NOV today? ........................................................................ 10
3.4 Data Acquisition ............................................................................................................. 11
3.5 How similar companies perform their tests. ..................................................................... 12
3.6 Test Procedure Design..................................................................................................... 14
4 Work package 2: Evaluate which methods that are the most suitable for an efficient complete
test of the Sdi. ....................................................................................................................................... 17
4.1 Introduction..................................................................................................................... 17
4.2 Method............................................................................................................................ 17
5 Work package 3: Draw up different suggestions for various technical solutions ......................... 18
5.1 Introduction..................................................................................................................... 18
5.2 Hardware ........................................................................................................................ 19
5.3 Operating systems ........................................................................................................... 25
5.4 Software.......................................................................................................................... 26
Inge Osli & Erling André Hornenes
V|P a g e
Automatic testing of Drilling Instrumentation system
6 Work package 4: Evaluate the solutions from work package 3 ....................................................... 29
6.1 Introduction..................................................................................................................... 29
6.2 Hardware solution ........................................................................................................... 29
6.3 Hardware ........................................................................................................................ 30
6.4 Software.......................................................................................................................... 30
6.5 Overview of the physical system ..................................................................................... 31
7 Work package 5: Implementation of a system for the chosen solution. ......................................... 32
7.1 Installing hardware and software ..................................................................................... 32
7.2 Test communication and function .................................................................................... 33
7.2.2 Make a simple test program .......................................................................................... 33
7.3 First program – Keppel Fels B289 ................................................................................... 34
7.4 Universal program........................................................................................................... 39
7.5 Installation of equipment in aluminium suitcases ............................................................. 44
7.6 Test of the system at nov in stavanger.............................................................................. 45
7.7 Suggested improvements ................................................................................................. 46
7.8 Changes that are necessary before using the system ......................................................... 47
8 Work package 6: Administrative ......................................................................................................... 48
8.1 Two weeks meeting......................................................................................................... 48
8.2 Hour log .......................................................................................................................... 48
8.3 Templates........................................................................................................................ 48
8.4 Quality verification ......................................................................................................... 49
8.5 Literature ........................................................................................................................ 49
Evaluations ................................................................................................................................................. 50
Evaluation of the effect goal .................................................................................................. 50
Evaluation of the result goals ................................................................................................ 50
Time use and progress ........................................................................................................... 51
Budget ......................................................................................................................................................... 52
Conclusion .................................................................................................................................................. 53
Reference list .............................................................................................................................................. 54
Definitions .................................................................................................................................................. 55
Appendix..................................................................................................................................................... 56
VI | P a g e
Inge Osli & Erling André Hornenes
Automatic testing of Drilling Instrumentation system
SUMMARY
National Oilwell Varco is a company that specializes in delivering equipment for oil rigs
around the world. Their subdivision in Stavanger produces the Driller Cabins, the Control
Unit (Cyberbase) and the Control System. A part of the Control System is called SDI
(Smart Drilling Instrumentation), and is basically a system that receives and sends signals
through a PLC. Before the system is delivered to the customer it is thoroughly tested. The
way this is done today, is by connecting a loop calibrator to all the sensor input terminals,
to see if the signals are correctly presented in the SDI software. This is relatively time
consuming and makes it hard to test signals that are dependent simultaneously. The
assignment for the project group was to investigate which possibilities there were to make
this test procedure more efficient, how the corresponding companies carried out their
tests and finally find and implement an adequate solution.
After thorough investigation the project group decided together whit NOV to start
building a test system based upon two National Instruments FieldPoints and a laptop.
This was the most cost efficient and best suited solution for the SDI. Together with
software developed in National Instruments LabVIEW, the project group has made a
fully functional system that fulfils the demands given in the assignment. All the hardware
is mounted in two aluminium suitcases to make it easier to move and make it suitable for
demanding environments. Communication between the two FieldPoints and the laptop is
done by Ethernet which gives the system a long range and makes it unaffected by normal
noise.
Each suitcase is equipped with four measuring cables to connect to the sensor input
terminals. The cables are then connected to the suitcase through quick release couplings.
The system was tested with success and the project group is very pleased with the
product.
Inge Osli & Erling André Hornenes
1|P a g e
Automatic testing of Drilling Instrumentation system
2|P a g e
Inge Osli & Erling André Hornenes
Automatic testing of Drilling Instrumentation system
1 INTRODUCTION
These elements are also presented in the pre-project
1.1 BACKGROUND
The project was written in cooperation with National Oilwell Varco, which is an
international leading company in sales, design, fabrication and commissioning of systems
and products for the oil and gas industry.
One of their products is the Smart Drilling Instrumentation (Sdi), which is the product
this project will cover. Sdi is a control system for the drilling process based on state of
the art technology within both computer and software. It is founded on the accumulated
experience on instrumentation and monitoring at National Oilwell Varco Rig System &
Control.
Figure 1.1 shows a typical topology for the Sdi. The overall topology may very when Sdi
is part of a larger control system but the main components in the Sdi will be the same.
Fig 1.1 – Sdi Topology
Inge Osli & Erling André Hornenes
3|P a g e
Automatic testing of Drilling Instrumentation system
1.2 ASSIGNMENT
Our task was to research and propose different solution, evaluate these, and eventually try
to make a test system to test the Sdi as thoroughly as possible
The assignment consisted of several parts:
1. Investigate different methods for testing instrumentation systems.
2. Evaluate which methods that is most suitable for a solution with expansion
possibilities for the test of the Sdi.
3. Draw up different suggestions for various technical solutions.
4. Evaluate the solutions with reference to:
• Efficiency
• Cost
• Complexity and time consumed in implementation
• Scaling
• Flexibility
5. Implementation of a system for the chosen solution.
1.3 PROBLEM
National Oilwell Varco Ltd. wanted to develop a system to test their products Smart
Drilling Instrumentation. The company works continuously to enhance their products,
and that is why this project was initiated. To generate this system, it was necessary to
research the different solutions that exist in the marked today, evaluate these, and then
generate a proposal for a technical solutions based on these evaluations. If the proposal
was approved, a pilot system would be developed.
Today the testing is done manually with a loop calibrator. Each input/output is given a
chosen current, usually 0-20 mA, and then compared with the reading from the system
screen. This is time consuming, when it’s required to test each input/output with several
different values. The amount of inputs/outputs can be quite vast in many cases. In
addition, it’s difficult to test signals that depend on each other, since it’s required to use
more than one calibrator. It’s also often necessary to be more than one person during the
test.
4|P a g e
Inge Osli & Erling André Hornenes
Automatic testing of Drilling Instrumentation system
1.4 GOALS
The project contained of two main aspects, a technical part and a project managing part.
The goal was that during the project, the participants would achieve greater insight in the
area of Sdi and practical project managing.
1.4.1 EFFECT GOAL
“The effect goal will contain getting a better understanding of the Sdi system, and getting
to use the achieved knowledge from the previous years of the bachelor study, while
acquiring new knowledge.”
1.4.2 RESULT GOALS
Throughout the project, the group had the following performance goals:
•
•
•
•
•
•
•
Approved pre-project within 08.02.2008.
Investigate different methods for testing instrumentation systems within
13.02.2008.
Evaluate which methods that are the most suitable for an efficient test of the Sdi
within 15.02.2008.
Draw up different suggestions for various technical solutions within 04.03.2008
Evaluate the technical solutions within 06.03.2008.
Implementation of a system for the chosen solution within 02.05.2008.
Deliver a professional bachelor project, which will allow NOV to continue
developing the system after need within 09.05.2008.
Inge Osli & Erling André Hornenes
5|P a g e
Automatic testing of Drilling Instrumentation system
2 METHODS
2.1 PREVIOUS KNOWLEDGE
During the last three years at HiST the project group has been working with several
projects, but never in a project of this size. The experience from former projects has come
to good use and helped the group accomplishing a good project management.
Revenant knowledge from previous studies:
Basic LabVIEW programming
Project managing
Web design
Measuring theory
2.2 LITERATURE AND RESOURCE PERSONS
During the pre-project and the start of the bachelor project literature from the school
library came to good use. Books about measuring theory in addition to the internet were
very helpful getting the project started.
When it came to programming, books and notes for the LabVIEW course were frequently
used. The internet also turned out to be very useful, especially the National Instruments
forum on their website.
On the hardware side, resource persons both at National Oilwell Varco and National
Instruments were of great help.
Fore more information on this subject, please look at the Reference list.
2.3 PROJECT MANAGING
The first weeks of the project period was dedicated to the pre-project and research. This
resulted in defined goals and a framework for the project. As the group came closer to the
program development, plans for the development process were made.
6|P a g e
Inge Osli & Erling André Hornenes
Automatic testing of Drilling Instrumentation system
Every second week the project group made a report which documented the work done in
the period, work progress, deviation and the plans for the next two weeks. Every report
was presented in a meeting in order to inform the employer and the teaching supervisor.
These meetings were the arena for making decisions and getting feedback, and informing
the involved parts about the progress.
2.4 DEVELOPMENT PROCESS
As it was important to ensure the success of the project, the strategy was to focus on
making a basic working program, and continue to improve this through the project
period. The project group also focused on doing a thorough work in the early phases to
ensure that the foundation of the project was solid. By doing this the group saved much
time in preventing mistakes and troubleshooting.
Inge Osli & Erling André Hornenes
7|P a g e
Automatic testing of Drilling Instrumentation system
3 WORK PACKAGE 1: INVESTIGATE DIFFERENT METHODS FOR
TESTING INSTRUMENTATION SYSTEMS
“ I often say that when you can measure what you are speaking about, and express it in
numbers, you know something about it, but when you cannot express it in numbers, your
knowledge is of a meagre and unsatisfactory kind; it may be the beginning of knowledge,
but you have scarcely, in your thoughts, advanced to the stage of Science, whatever the
matter may be. ”
- Sir William Thompson, Lord Kelvin (1827-1907)
3.1 INTRODUCTION
Increased device complexity, shorter development cycles, and decreased budgets provide
an opportunity for companies to re-evaluate their current test strategies and look for areas
to increase efficiency and reduce cost. When designing new and improved test systems it
is important to incorporate strategies that increase system flexibility, deliver higher
measurement and throughput performance, lower test system cost, and expand longevity.
One way to do this is by replacing the old loop calibrator and implement a more
advanced solution that reduces the need of personnel and that is less time consuming. A
modular software-defined automated test system often overcomes the shortfalls of past
solutions based on stand-alone instrumentation. With such systems, one can reveal more
errors in an earlier stage, and present a more professional test procedure to the customer.
3.2 TESTING I/O IN GENERAL
When testing inputs it is common to use either a voltage or a current signal. This signal
can be generated by everything from an easy-to-use loop calibrator, which is very
common; to much more advanced systems like PLCs, similar controllers with I/O
modules, or similar products.
When testing outputs it is the opposite process, the outputs are measured with a
multimeter, to check if the values are corresponding with the given value in the process’
GUI.
8|P a g e
Inge Osli & Erling André Hornenes
Automatic testing of Drilling Instrumentation system
Current signals usually spans from 4 mA to 20 mA, where 4 mA is represented as 0%,
and 20 mA as 100%. When testing manually, a loop calibrator will give out the values
that are required to test the system sufficient. Often, these values are 4, 8, 12, 16 and 20
mA. Sometimes it’s also required to “send” 0 mA to check if the system reads it as a
signal loop failure.
Voltage signals can range from 0-10VDC, depending on what kind of transducers that are
used. It’s the same principles as used with current signals.
Instead of using loop calibrators and multimeters, it is possible to arrange much more
advanced test procedures. For example, it is possible to use tools such as I/O modules and
data acquisition tools, with programmable software on a personal computer. Then it’s
possible to build an advanced, user friendly test program. Instead of applying a current to
each terminal block, one can connect to several blocks simultaneously, and test many
different signals at the same time. This is easier for the user, and makes the debugging
more thorough. It is also possible to test signals that depend on each other. The only
problem is that the system has to be built, and often customized for each test.
Inge Osli & Erling André Hornenes
9|P a g e
Automatic testing of Drilling Instrumentation system
3.3 HOW THE TEST IS PREFORMED AT NOV TODAY?
The present test procedure is mainly based on the use of a loop calibrator. The calibrator
is connected to the first socket in the terminal block. Then the current is altered in steps
of 25%, from 4-20mA. For each step the signal is verified by confirming that the main
display shows the right values. When the loop calibrator is removed and the current
becomes 0mA the system will interpret this as a line fault and give out an error message.
If the response from the system is ok, the loop calibrator is moved to the next socket and
the procedure starts over again.
If there is need for testing two signals simultaneously a second loop instrument has to be
used. If it is necessary to test more then two dependent signals simultaneously, the values
are hard coded into the PLC.
Display
PLC
CEAG rack
Terminal block
Loop calibrator
Fig 3.3.1 – Loop Test
10 | P a g e
Inge Osli & Erling André Hornenes
Automatic testing of Drilling Instrumentation system
3.4 DATA ACQUISITION
The data acquisition or display section of a measurement system includes the equipment
that connects to the output of the signal conditioning equipment and processes that signal
into a form that the system operator can use. The equipment can be as simple as a digital
meter or as complex as a computer-based acquisition system. Which type is chosen
depends on such factors as the number of signals to be accessed, how fast the data is
changing, whether the data needs to be stored, and whether the data needs to be processed
further.
A measurement system may contain several different types of displays depending on the
operator’s needs. For a given test, the operator may need to monitor the pressure,
temperature, and flow of a fluid on a test rig. At the same time, the operator may need to
store vibration measurements and perform online analysis of the vibration data. The
monitoring could be done using digital indicators or a data acquisition system, while the
vibration measurements could be carried out using a separate vibration analysis data
acquisition system.
Computer-controlled data acquisition systems have become the most popular form of
equipment for interfacing with transducers or signal conditioners and then storing,
manipulating, and displaying the test data.
With DAQ software, such as LabVIEW, it is possible to use I/O modules to simulate
transducers and sensors, so the system can be tested without having the transducers and
sensor physically present. This is an advantage, as you can thoroughly test offshore
installations onshore and discover more errors in an early phase.
Inge Osli & Erling André Hornenes
11 | P a g e
Automatic testing of Drilling Instrumentation system
3.5 HOW SIMILAR COMPANIES PERFORM THEIR TESTS.
3.5.1 GENERAL
After contacting several people that have participated in testing procedures for companies
that can be compared to NOV like ABB, Hitec Products Drilling, Siemens, Systek,
Marine Cybernetics, the general impression is that the common testing procedure is to
use a loop calibrator for simple IO testing. In other words the same procedure that NOV
uses today. Some of these companies have also developed more complicated systems to
use in more advanced testing.
3.5.2 HITEC PRODUCTS DRILLING
Hitec Products Drilling AS supplies products and services to the drilling and well
industry worldwide. Their control system requires a lot of testing, both on I/O,
communication, and the user interface. To resolve this, they have different solutions.
To test the I/O system, they have discarded the traditional method of testing, which
includes testing each I/O one by one. Instead they use a computer with an I/O module to
generate the required values, enabling them to test multiple I/O’s simultaneously, and
easily change the values when needed. It is also possible to use different type of signals,
from standard constant signal to pulse signals. This solution makes the testing procedure
more thorough.
They also use simulations of different situations, to se how the user interface respond to
the changes in the simulated process. This is also used to train driller crew. The system is
connected to their Siemens PLC, and is all attached to a bench, where they can connect to
the I/O module through Ethernet or use other types of communication.
This is how Hitec described their system, and since they are a competitive corporation it
is understandable that they don’t want to describe their technical solutions more detailed.
Still this gives a relative good picture of what is possible to achieve with modern
equipment available.
12 | P a g e
Inge Osli & Erling André Hornenes
Automatic testing of Drilling Instrumentation system
3.5.3 SIEMENS
After some research the project group came over a solution used by Siemens in Germany.
Before delivering an automatic steam turbine controller to their customers, they test the
turbine regulator hardware and software.
This is done with a solution based upon National Instruments LabVIEW and PXI Express
Instrumentation. PXI is the open, PC-based platform for test, measurement, and control.
For FAT execution, they close the turbine controller automatic control loops using a
simulated, controlled system. They developed a real-time turbine simulator, which is
attached to the turbine controllers I/O signals. The simulator computes the appropriate
process variables from the turbine controller, adjusting signals as feedback. With this
model, Siemens can test the different operation modes, including the turbine starting
within a specified revolution rate, the turbine operating under load or pressure control,
load decreases under idle operation, load removal and turbine shutdown.
In addition to the actual functional test, the turbine simulator can aid in parameter tuning
and optimization in the field prior to operation. Siemens also delivers a simple turbine
controller model so the customers can operate the turbine simulator when a test turbine is
unavailable.
3.5.4 MARINE CYBERNETICS
Marine Cybernetics improves safety and profitability for our customers through
independent testing of mission-critical control systems on ships and offshore
installations. This is done using Hardware-In-the-Loop (HIL) testing based on our
unique and patented CyberSea Simulator Technology. Our customers will benefit from:
• Safer ships and rigs with less incidents due to software errors
• Extensive testing early in the design and engineering process
• More efficient sea trials
• Less use for potentially destructive testing
• Reduced downtime during operations
• Reduced overall cost
Marine Cybernetics is a company that specialises in the field of testing instrumentation
system in shipping and offshore.
Their system is based on simulations of the process, which allows them to test the whole
system as realistic as possible, increasing the chances to detect errors. The system is
based upon an I/O module, with computer software to simulate the processes. When
Inge Osli & Erling André Hornenes
13 | P a g e
Automatic testing of Drilling Instrumentation system
testing, all of the parts in the system are tested, from simple signal processing, to program
functionality.
This system is customized for each customer, although a lot of the situations are quite
similar, allowing them to reuse much of the former programs.
3.5.5 LOCKHEED MARTIN SPACE SYSTEMS COMPANY
Lockheed Martin uses NI LabVIEW simulation interface toolkit for flight simulation
model development. This is a very high tech solution that uses MathWorks to simulate a
realistic environment. They have built a prototype integrated avionics unit (IAU) and a
hardware-in-the-loop (HIL) simulator to test the light detection and ranging (LIDAR)
control software functionality.
One drawback with such heavy mathematic simulations is that it is very time-consuming
to make, and the system can be extremely complex. This solution might be a bit
exaggerated compared to the needs of NOV, but it shows the potential in building a more
complex system.
3.6 TEST PROCEDURE DESIGN
To make a complete and thorough test system demands a great deal of planning. With a
good test description in an early phase, could mean decreased costs and work hours.
It is always less expensive to spend time and money on a thorough preparation than to
repeat a test because one or more items were not considered when the test was planned.
Such preparations should entail gaining input from all sections of the group involved in
the project. This can include design engineering, management, quality assurance, test rig
designers, test measurement professionals, and the test operators. [1]
3.6.1 TEST OBJECTIVE
The test objective is a written statement that completely describes the purpose of the test.
It should include background information about why the test is being carried out, the
range of the test conditions that will be covered, and the format of the expected test
results. It should also define any national or international standards that have to be met
as well as any quality assurance requirements. Any relevant regulatory requirements
should also be defined in the test objective. [1]
14 | P a g e
Inge Osli & Erling André Hornenes
Automatic testing of Drilling Instrumentation system
3.6.2 REQUIRED MEASUREMENTS
A description of the required measurements should be a natural byproduct of the
preparation of the test objective. This description should include the measurement range
of each test parameter. An initial description is typically prepared by the design
engineering staff. It should then be reviewed by the test measurement professionals and
the test rig operators. These people have the knowledge to determine if such
measurements are possible and an idea of their approximate cost. They should also be
able to describe any additional measurements that may have to be taken to support the
basic required measurements. The test schedule requirements can have an impact on
which measurements should be made. The delivery time for some test instrumentation can
be several weeks or months, especially if some customization is required. [1]
3.6.3 ACCURACY REQUIREMENTS
Defining the accuracy requirements for each measurement is one of the most difficult
tasks to resolve in the development of the test procedure. It is also one of the most
important tasks because it will determine the test’s success and have a larger impact on
its costs. If you underestimate the accuracy requirements then the test result may not
support your conclusions about the test’s objective. If you overestimate the accuracy
requirements then the cost of instrumentation will be excessive. [1]
Inge Osli & Erling André Hornenes
15 | P a g e
Automatic testing of Drilling Instrumentation system
3.6.4 TEST DATA FORMAT
The form in which the test measurement data is to be acquired, displayed and stored in
must be decided upon and documented when the test procedures are developed. A simple
test could be conducted in which a few transducers are displayed on digital indicators.
When the test operator simply notes readings at appropriate times the form of data
acquisition and storage is manual. [1]
3.6.5 TEST DATA ANALYSIS
Test data analysis can be carried out in real time as the test is occurring or after the test
sequence is completed (post-test). It is also possible to combine the real-time and posttest analysis methods so that some combined analysis is done while the test is occurring
and other analysis is carried out on the stored data after the test.
The factors that can influence the analysis method selected include:
• Duration of the test
• Availability of online analysis equipment
• Need to vary test parameters as results become available
• Need to carry out multiple types of analysis on the same data
• Requirement that analysis be done by people other than the test operators.
The ideal situation is to store all raw test data that is acquired during the test. This will
allow unlimited post-test analysis and makes it possible to correct any errors that are
discovered as part of this analysis. [1]
16 | P a g e
Inge Osli & Erling André Hornenes
Automatic testing of Drilling Instrumentation system
4 WORK PACKAGE 2: EVALUATE WHICH METHODS THAT ARE
THE MOST SUITABLE FOR AN EFFICIENT COMPLETE TEST OF
THE SDI.
4.1 INTRODUCTION
Work package 1 presented different methods for testing instrumentation systems. After
investigating the methods, the project group and NOV evaluated which method that is
suitable for testing the Sdi system. When deciding which method to use, factors like
costs, efficiency, mobility and diversity, where important for the decision.
4.2 METHOD
The method that was agreed upon was to use either PLC or similar controllers with I/O
modules, through Ethernet or USB to a laptop, with programmable software that can both
send out simple signals and simulate more advanced signal types. With this method it’s
possible to test multiple terminal blocks at once, and simulate different situations if
needed. This will make the test procedure easier, more well-arranged, as well as
presenting a graphical overview to the customer.
Fig 2.2.1 – Method principle
Inge Osli & Erling André Hornenes
17 | P a g e
Automatic testing of Drilling Instrumentation system
5 WORK PACKAGE 3: DRAW UP DIFFERENT SUGGESTIONS FOR
VARIOUS TECHNICAL SOLUTIONS
5.1 INTRODUCTION
Based on the results from the former work packages, the project group will present
several technical solutions for this project. The different solutions will be discussed with
NOV in work package four, and one of the solutions will be chosen for further
implementation.
The project group wants to install the chosen solution in suitcases to make it easy to
transport and to protect the equipment. A principle sketch is shown in fig 5.1.1. The
principle is the same for all solutions.
Fig 5.1.1 – Principle sketch
18 | P a g e
Inge Osli & Erling André Hornenes
Automatic testing of Drilling Instrumentation system
5.2 HARDWARE
5.2.1 ALTERNATIVE SOLUTION 1: SIEMENS SIMATIC S7
This solution is based upon PLC’s from Siemens. The PLC’s that are used is the Simatic
S7, which is a module based solution.
Fig 5.2.1 – PLC with modules
Technology CPUs S7-315T-2DP
The technology CPUs combine
• SIMATIC CPU 315-2 DP / 317-2 DP with
•
PLCopen-compatible motion control
functions.
The technology CPUs are compactly built with highspeed distributed I/Os (4 digital inputs, 8 digital
outputs) and two PROFIBUS DP interfaces:
Fig 5.2.2 – PLC CPU
Modules
The S7-300 technology CPUs 315T-2 DP provides the
full functionality of the powerful standard CPUs with
integrated technology functions.
•
•
•
Digital output 8DO, DC 24V, 2A; isolated
Analog output 4 AO, isolated
Analog output 8 AO; 11/12 bit; isolated
Fig 5.2.3 – I/O module
The Siemens Simatic S7 is the same PLC that NOV uses in their systems. Using a PLC
will allow the system to run without a computer, but in this case it’s necessary to present
the data in a graphical user interface, so one will need an additional computer anyway.
Inge Osli & Erling André Hornenes
19 | P a g e
Automatic testing of Drilling Instrumentation system
Table 1 – Pros and cons PLC
Advantages
Disadvantages
- Highly programmable
- Known system to NOV
- Easy for NOV to develop further
- Expensive
- Unknown to the project group
- Requires an OPC licence
See appendix E for complete list of components and prices
5.2.2 ALTERNATIVE SOLUTION 2: COMPACTDAQ FROM NATIONAL
INSTRUMENTS
Fig 5.2.4 - NI CompactDAQ Chassis - NI cDAQ-9172
NI CompactDAQ Chassis - NI cDAQ-9172
•
•
•
•
•
•
More than 5 MS/s streaming acquisition per chassis
Included AC power supply, USB cable, and strain relief kit
True plug-and-play installation and configuration
Rugged A380 metal construction
Available mounting kits for enclosures, DIN-rail, and desktop development
Hi-Speed USB connectivity to PC
NI 9265
4-Ch, 100 kS/s, 16-Bit, 0 to 20 mA, Analog Output Module
•
•
•
Fig 5.2.5 – NI 9265
Analog I/O module
20 | P a g e
•
•
•
0 to 20 mA output range, 16-bit resolution
Open-loop detection with interrupt, 0.0 mA power-on
Hot-swappable operation
4 analog outputs, 100 kS/s, simultaneously updated
-40 to 70 °C operating range
NIST-traceable calibration
Inge Osli & Erling André Hornenes
Automatic testing of Drilling Instrumentation system
NI 9474
8-Channel 5 to 30 V, 1 µs, Sourcing Digital Output Module
•
•
•
•
Fig 5.2.6 – NI 474
•
8-channel, 1 µs high-speed digital output
5 to 30 V, sourcing digital output
-40 to 70 °C operating range
Extreme industrial certifications/ratings
Hot-swappable operation
Digital I/O module
This solution is one of the two solution presented from National Instrument.
The CompactDAQ is a much faster system than the Compact FieldPoint, with a higher
resolution. It is easy to use, and can be used with LabVIEW, which is a program the
project group already knows quite well.
The CompactDAQ is depending on a computer to run the program. It also has no ability
to set start-up and com-error values. This system communicates by USB, which means
that the cable between the system and the switch cannot exceed 5 meters, making it
difficult to test cabinets in different locations. USB cables over 5 meters can’t guarantee
that the signals to the recipient will be translated correct. To overcome this problem it
would be necessary to use several USB signal amplifiers. Also, the 0-20mA analog
modules are limited to 4 output channels.
Table 2 – Pros and cons DAQ
Advantages
Disadvantages
- Faster than Compact FieldPoint
- Higher resolution
- Easy to use
- Compatible with LabVIEW
- Built-in power supply
- No start-up and com-error values
- Communicates through USB
- Com cable cannot exceed 5 meter
- Only 4 analog outputs on each module
See appendix E for complete list of components and prices
Inge Osli & Erling André Hornenes
21 | P a g e
Automatic testing of Drilling Instrumentation system
5.2.3 ALTERNATIVE SOLUTION 3: COMPACT FIELDPOINT
Fig 5.2.7 – Compact FieldPoint with I/O modules
NI cFP-1804
Ethernet/Serial Interface for Compact FieldPoint
•
•
•
•
•
Access through industry-standard communication protocols such as Modbus and OPC
FieldPoint software for drag-and-drop I/O access to distributed systems
Rugged hardware for industrial environments – 50 g shock, 5 g vibration,
-40 to 70 °C
Up to 4 Compact FieldPoint modules per distributed Ethernet/serial network interface
Easy read and write from networked host PCs using NI LabVIEW or any OPC client
This is the second solution provided by National Instruments. The National Instruments
cFP-1804 network interface module connects up to four Compact FieldPoint I/O modules
to a high-speed Ethernet network. This allows the user to operate the complete solution
through a computer running for instance LabVIEW. In addition to managing
communications between a host PC and the I/O modules, the cFP-1804 also provides
diagnostic and autoconfiguration features to simplify installation, use, and maintenance.
Perform IP address assignment and module configuration using Measurement &
Automation Explorer, a menu-driven Windows-based configuration utility designed for
ease of use. It is also possible to set a startup and lost communication value, which
ensures a greater control over the systems during critical states.
The Compact FieldPoint is not produced with an internal power supply. This means that
it is necessary to purchase an external power supply. The FieldPoint is also much slower
compared to e.g. Compact DAQ. But with an analog speed up to 200Hz and a digital
speed up to 20 kHz this is more than enough for this project.
22 | P a g e
Inge Osli & Erling André Hornenes
Automatic testing of Drilling Instrumentation system
Digital I/O module for cFieldPoint
•
HotPnP (plug and play) operation
-40 to 70 °C operating range
Voltages from 5 to 30 VDC
LED on/off state indicator, per channel
Up to 2 A per channel, 9 A squared per module
•
•
•
•
Fig 5.2.8 – Digital I/O module for Compact FieldPoint
The National Instruments cFP-DO-400 module features eight sourcing digital output
channels. Each channel is compatible with voltages from 5 to 30 VDC and can source up
to 2 A per channel with a maximum of 9 A squared per module. (The sum of the squares
of the output currents from all eight channels must be no greater than 9.) Each channel
has an LED to indicate the channel on/off state. The module features 2300 V transient
isolation between the output channels and the backplane. To make installation and setup
easier the NI cFP-DO-400 features HotPnP (plug and play) operation and is automatically
detected and identified by the configuration software.
Analog I/O module for cFieldPoint
•
•
•
•
•
•
HotPnP (plug and play) operation
Open-circuit detection
12-bit resolution
Eight 4 to 20 mA or 0 to 20 mA current outputs
-40 to 70 °C operating range
Short-circuit protection
Fig 5.2.9 – Analog I/O module for Compact FieldPoint
The National Instruments cFP-AO-200 is an 8-channel analog output module for 4 to 20
mA and 0 to 20 mA current loops. The module includes open-circuit detection for wiring
and sensor troubleshooting and short- circuit protection for wiring errors. To make
Inge Osli & Erling André Hornenes
23 | P a g e
Automatic testing of Drilling Instrumentation system
installation and setup easier the NI cFP-AO-200 features HotPnP (plug and play)
operation so it is automatically detected and identified by the configuration software.
Software development is also simplified because with autoscaling, you can write to the
module in engineering units instead of having to convert the current levels to binary
numbers. The module comes with a NIST-traceable calibration certificate to ensure
accurate and reliable analog control.
Integrated Connector Block for wiring to cFieldPoint
•
Mounts to backplane between I/O modules
•
Easy wiring with color-coded terminals for voltage and
common connections
•
Built-in strain relief and slots for wire ties
•
One cFP-CB-1 is required for each Compact FieldPoint I/O
module
Fig 5.2.10 – Integarted Connector Block for wiring to Compact FieldPoint I/O
You can easily wire signals to the inputs and outputs of any Compact FieldPoint module
using the cFP-CB-1. The cFP-CB-1 mounts onto the backplane and provides a convenient
way to connect sensors and actuators. The connector block comes with two strain-relief
bars - one for individual wires and one for thicker cables. The cFP-CB-1 has slots for
wire ties to further secure cables, and features color-coded terminals to make wiring
easier. It has a thermistor for cold-junction compensation when used with thermocouples.
24 | P a g e
Inge Osli & Erling André Hornenes
Automatic testing of Drilling Instrumentation system
Power supply
•
PS-2 -- 24 VDC, 19 W (100-240 VAC input)
Fig 5.2.11 – DC Power Supplies for Compact FieldPoint.
The PS-2 is a DIN-rail-mountable 24 VDC power supply that provides 0.8 A of current
and is rated for operation from -25C to 60C. The PS-2 is recommended for industrial
installations. One power supply can power an entire bank of Compact FiledPoint I/O
modules.
Table 3 – Pros and cons Fieldpoint
Advantages
- Ethernet communication
- Campatible with LabView
- 8 analog outputs on each module
- Easy to use
Disadvantages
- Slower then CompactDAQ
- Lower resolution then CompactDAQ
- Should be mounted (vulnerable)
- Needs external power supply
See appendix E for complete list of components and prices
5.3 OPERATING SYSTEMS
5.3.1 LINUX
Linux is a Unix-like computer operating system. Linux is one of the most prominent
examples of free software and open source development: typically all underlying source
code can be freely modified, used, and redistributed by anyone. Predominantly known for
its use in servers, Linux is supported by corporations such as Dell, Hewlett-Packard,
IBM, Novell, Oracle Corporation, Red Hat, and Sun Microsystems. It is used as an
operating system for a wide variety of computer hardware, including desktop computers,
supercomputers and embedded devices such as mobile phones, routers, and stage lighting
systems. The main reason for choosing this solution would be that it is free to use and
there is no need for an expensive license. Linux is also less demanding to the recourses
than other operating systems.
Inge Osli & Erling André Hornenes
25 | P a g e
Automatic testing of Drilling Instrumentation system
The disadvantage of Linux is that it is very complex to set up and difficult to implement
with external hardware. The competence in the project group when it comes to Linux is
not as good as for instance windows.
5.3.2 WINDOWS
Windows is the leading operating system today. This is a system that is familiar to most
people and don’t need å thorough introduction. Windows is very user-friendly, and
because it is widely used it is easy to find information about it. Windows is also easy to
set up and implement with external hardware.
The biggest disadvantage about windows is that it requires a licence to use. It is also a bit
more demanding on computer recourses than for instance Linux.
5.4 SOFTWARE
5.4.1 LABVIEW
LabVIEW (short for Laboratory Virtual Instrumentation Engineering Workbench) is a
platform and development environment for a visual programming language from
National Instruments. The graphical language is named "G". LabVIEW is commonly
used for data acquisition, instrument control, and industrial automation on a variety of
platforms including Microsoft Windows, various flavors of UNIX, Linux, and Mac OS.
The latest version of LabVIEW is version 8.5, released in August of 2007. LabVIEW is
very easy to use and gives the developers the ability to concentrate on the functionality of
the program rather than getting the different parts in the system to cooperate. The project
group has good experience working with LabVIEW form earlier projects.
26 | P a g e
Inge Osli & Erling André Hornenes
Automatic testing of Drilling Instrumentation system
5.4.2 LABWINDOWS
LabWindows/CVI (CVI is short for C for Virtual Instrumentation) is an event-driven,
ANSI C programming environment developed by National Instruments. The current
version of LabWindows/CVI (commonly referred to as CVI) is 8.5. LabWindows uses
the same libraries and data acquisition modules as the more famous National Instrument
product LabVIEW and is thus highly compatible with it, LabVIEW being targeted more
at electronics technicians and CVI more towards programmers. The project group has
also used this program in earlier projects with good results.
The disadvantage with LabWindows is that is much more complex than e.g. LabVIEW,
and will take more time to set up.
5.4.3 INTOUCH
InTouch software is an open and extensible HMI with cutting-edge graphical capabilities
providing incredible power and flexibility for application design. InTouch software offers
connectivity to the broadest range of automation devices in the industry.
Already established as the world’s favorite HMI, InTouch software is used in over onethird of the world’s plants, in virtually every country and industry. It is easy to use and
wery powerful, especially when it comes to controlling PLC’s. This is also program that
the project group has used before.
InTouch don’t offer a good support towards National Instruments products. It also
requires the use of an OPC server to communicate with external hardware.
5.4.4 AIM 2000
AIM is a program made by “Kongsberg gruppen”. AIM process automation system aim
to provide reliable solutions for optimal production and operation of the controlled
process. It provides powerful tools for engineering the optimum solution required by
process control systems and operational training on a dynamic simulator.
The project group has never used this program, and it is probably more suitable for bigger
control systems.
Inge Osli & Erling André Hornenes
27 | P a g e
Automatic testing of Drilling Instrumentation system
5.4.5 SIMATIC WINCC
SIMATIC WinCC is a HMI software developed by Siemens to easily set up user friendly
programs for running their products e.g. the S7. It is cost friendly and very flexible.
The project group has no experience working with this program.
28 | P a g e
Inge Osli & Erling André Hornenes
Automatic testing of Drilling Instrumentation system
6 WORK PACKAGE 4: EVALUATE THE SOLUTIONS FROM WORK
PACKAGE 3
6.1 INTRODUCTION
In this work package the project group and NOV decided which solution from work
package 3 that was implemented in this project.
The hardware solutions were evaluated with reference to:
• Efficiency
• Cost
• Complexity and time consummation in implementation
• Scaling
• Flexibility
The software solutions were evaluated with reference to:
• Easy-to-use interface
• Compatibility
• Former experience within the project group
6.2 HARDWARE SOLUTION
The solution that was selected was the solution from National Instruments, using
Compact FieldPoint. This solution was agreed upon because:
•
•
•
•
•
It’s easy to install.
The system is relatively inexpensive.
It is easy to set up in LabVIEW which the project group is familiar with.
If expansion is needed, it doesn’t take a lot of time to refit the program.
National Instruments has good support, both online and through customer service.
Inge Osli & Erling André Hornenes
29 | P a g e
Automatic testing of Drilling Instrumentation system
6.3 HARDWARE
To build two Compact FieldPoint systems, it was ordered:
2 Ethernet/Serial Interface for Compact FieldPoint
6 Analog I/O modules for cFieldPoint
2 Digital I/O modules for cFieldPoint
8 Integrated Connector Blocks for wiring to cFieldPoint
2 Power Supplies
In addition two power supplies for the digital modules was purchased
Each Compact FieldPoint system has 24 analog outputs and 8 digital outputs.
The power-supplies for the analog modules deliver 24 V
The power-supplies for the digital modules deliver 1.5-12V. These are set to 7.5 V when
simulating the proximity switches.
6.4 SOFTWARE
6.4.1 OPERATING SYSTEM (OS)
The operating system that will be used on the computers is Microsoft Windows XP. It
could be possible to use Linux also, both windows is better known, and usually has better
compatibility. Also the project group doesn’t have that much experience with Linux.
6.4.2 PROGRAMMING SOFTWARE
It was decided to use National Instruments LabVIEW to make the system program. The
program is easy to understand, has a lot of integrated functions, and is known to the
project group. The language is graphical, so it can be easier to get an overview of the
program.
30 | P a g e
Inge Osli & Erling André Hornenes
Automatic testing of Drilling Instrumentation system
6.5 OVERVIEW OF THE PHYSICAL SYSTEM
Fig 6.5.1 – Principle sketch
Inge Osli & Erling André Hornenes
31 | P a g e
Automatic testing of Drilling Instrumentation system
7 WORK PACKAGE 5: IMPLEMENTATION OF A SYSTEM FOR THE
CHOSEN SOLUTION.
After choosing a solution in work package 4, the system was implemented into the final
product. The result of work package 5 is a complete system to test the Sdi signals.
Because of the size and complexity of this package, the project group found it necessary
to split it up into several smaller pieces. This made it easier for both participants to cooperate and work towards one complete program. To maintain a solid working
environment when programming it is important that everyone involved has clear
guidelines and are working to achieve the same goals. This resulted in the following subpackages:
Installing hardware and software
Test communication and function
Create a test program for Keppel Fels B289
Create an universal test program
Install equipment in aluminium suitcases
Testing the system at NOV in Stavanger
Suggested improvements
Changes that are necessary before using the system
7.1 INSTALLING HARDWARE AND SOFTWARE
7.1.1 ASSEMBLE THE HARDWARE
This part of the package was done very swiftly and didn’t cause any complications at all.
NI’s hardware was very user friendly and easy to put together. The picture shows how
one of the FieldPoints after it was assembled and connected to the power supply and the
network.
Fig 7.1.1– The Fieldpoint assembled.
32 | P a g e
Inge Osli & Erling André Hornenes
Automatic testing of Drilling Instrumentation system
7.1.2 INSTALL SOFTWARE
The project group was given access to one of the schools copy of National Instruments
LabVIEW 8.2. The development program and the real time components were installed to
two desktops and one laptop at NOVs office in Fjordgata 82. This is a student licensed
copy, and will be removed after the project.
7.2 TEST COMMUNICATION AND FUNCTION
7.2.1 COMMUNICATION BETWEEN SOFTWARE AND HARDWARE
As the project group was promised by the sales division at NI, the communication
between the software and hardware went without a problem. By using NIs Measurement
and Automation program, which generates a setup file for the FieldPoint’s in LabVIEW,
this part of the package went along very smoothly.
7.2.2 MAKE A SIMPLE TEST PROGRAM
For testing the analog and digital modules on the FieldPoint, the FieldPoint came with a
set of example programs. This meant that it was not necessary to make the test programs
from scratch, just modifying the example programs.
Fig 7.2.1 – Analog output testing program.
Inge Osli & Erling André Hornenes
33 | P a g e
Automatic testing of Drilling Instrumentation system
Fig 7.2.2 – Digital output testing program.
7.3 FIRST PROGRAM – KEPPEL FELS B289
The project group first made a program for a specific project, the Keppel Fels B289. This
is a rather small project, with a few signals to simulate. If the program worked as
expected, a universal program would be created that could be used with any project. This
program was not fully completed, because the project group found it more important to
start creating a universal program.
34 | P a g e
Inge Osli & Erling André Hornenes
Automatic testing of Drilling Instrumentation system
7.3.1 SIGNAL MENU
Fig 7.3.1 – The choose signal menu – Keppel Fels B289
The first window that appears when program is launched is the signal menu. In this
program, the signals are locked to this specific project, the Keppel Fels B289. The user
can choose which of the signals to simulate. In the universal program, this menu are
much more dynamic, so that it can be used with any project.
Inge Osli & Erling André Hornenes
35 | P a g e
Automatic testing of Drilling Instrumentation system
7.3.2 SETUP RIO/DAU MENU
Fig 7.3.2 – The Setup RIO/DAU menu.
In the setup RIO and setup DAU menu, the FieldPoint channels are set up. The different
signals are assigned to the channels, and it is possible to choose which terminals each
channel should be connected to, and export this wiring diagram to a spreadsheet file.
Then it is easy to connect to the system using this diagram. When all the signals are
assigned, the simulation is ready to run.
36 | P a g e
Inge Osli & Erling André Hornenes
Automatic testing of Drilling Instrumentation system
7.3.3 RUN TEST MENU
Fig 7.3.3 – The Run test menu – pit simulation
In the Run test menu, the different signals are simulated. In this program, only a few
selected signals are represented, since the program isn’t complete. In this menu it is
possible to simulate different signals, either manually or automatic. It’s also possible to
simulate a line fault (0 mA).
Fig 7.3.4 – Overview of simulation graphics
Inge Osli & Erling André Hornenes
37 | P a g e
Automatic testing of Drilling Instrumentation system
7.3.4 COMMUNICATION
Fig 7.3.5 – The communication menu
In the communication menu, the communication to the FieldPoint is monitored. In this
program, only one FieldPoint is represented. Instead of finalizing this program, the
project group decided to move on to the universal program. If an error appears in this
window, it’s possible to get an explanation by clicking on the error code.
38 | P a g e
Inge Osli & Erling André Hornenes
Automatic testing of Drilling Instrumentation system
7.4 UNIVERSAL PROGRAM
After creating a successful test program for Keppel Fels B289, a universal program was
created. In this program most of the signals that could be necessary to simulate in any
project are included. It is also possible to import the signals from the NOV HED
database, instead of the user setting them up manually.
7.4.1 SIGNAL MENU
Choose signals
Fig 7.4.1 – The choose signals menu
When the program is launched, the signal menu is presented. The user can insert name for
the different signals, and activate them. An easier way is to use the import button to
import the signals from a csv-file exported from HED. When this option is used, all the
names, active signals and ranges are set automatically.
Inge Osli & Erling André Hornenes
39 | P a g e
Automatic testing of Drilling Instrumentation system
Density and Temp
Fig 7.4.2 – The density and temp menu
When density and temp is to be simulated, a second menu is necessary. When simulating
density, it is really a pressure sensor that is simulated. Then the density is calculated with
the pressure value and the pit volume value. Therefore, in this menu, the user can select
which pit the volume is received from.
It is also possible to assign a pit to the temp simulation, but this option is just to get an
overview over which pit temp that is represented.
40 | P a g e
Inge Osli & Erling André Hornenes
Automatic testing of Drilling Instrumentation system
7.4.2 SETUP RIO/DAU MENU
Fig. 7.4.3 – The RIO setup menu
In the setup RIO and setup DAU menu, the FieldPoint channels are set up. The different
signals are assigned to the channels, and it is possible to choose which terminals each
channel should be connected to, and export this wiring diagram to a spreadsheet file.
Then it is easy to connect to the system using this diagram. When all the signals are
assigned, the simulation is ready to start.
Inge Osli & Erling André Hornenes
41 | P a g e
Automatic testing of Drilling Instrumentation system
7.4.3 RUN TEST MENU
Fig 7.4.4 – The Run test menu – pit simulation
In the Run test menu, it’s possible to simulate the signals that are selected. The items that
are not selected are greyed out and disabled. It is possible to choose a value manually or
an automatic incremental value. It is also possible to simulate a line fault (0 mA).
Fig 7.4.5 – Overview of simulation graphics
42 | P a g e
Inge Osli & Erling André Hornenes
Automatic testing of Drilling Instrumentation system
7.4.4 COMMUNICATION
’
Fig 7.4.6 – The communication menu
In the communication menu, the communication to both FieldPoint’s is monitored. If an
error appears, it’s possible to click on the error code to get an explanation. It is also
possible to change the control rate. This is not recommended to exceed 100 ms, because
of the digital signal simulation which runs at 125ms intervals.
Inge Osli & Erling André Hornenes
43 | P a g e
Automatic testing of Drilling Instrumentation system
7.5 INSTALLATION OF EQUIPMENT IN ALUMINIUM SUITCASES
To protect the system and make it easier to use, the two FieldPoint’s were mounted in
separate suitcases. All the FieldPoint channels are connected to outlets at the side of the
suitcase. For each module there is a cable with a plug that can be connected to these
outlets with quick release couplings. This makes it faster and easier to connect the system
to the project that’s going to be tested.
To install the equipment, the project group used the workshop in the NOV Stavanger
office during the final test visitation.
Fig 7.5.1 – Connecting the FieldPoint connector modules
Fig 7.5.2 – The suitcase with the FieldPoint mounted
44 | P a g e
Inge Osli & Erling André Hornenes
Automatic testing of Drilling Instrumentation system
7.6 TEST OF THE SYSTEM AT NOV IN STAVANGER
Installing the equipment consumed more time then expected, and the testing was delayed.
On Wednesday 23rd of April, 1200 Pm, the group was ready for testing. Unfortunately
the rig wasn’t available at this time. At 1430 Pm the test started. It was necessary to
reschedule the flight back to Trondheim, and continue the test on the 1st of May.
7.6.1 KEPPEL FELS B289
In the Keppel Fels project it is a total of 25 signals to simulate. 10 analog signals were
connected to the DAU system, 12 analog and 3 digital signals to the RIO system.
Connecting the terminal blocks took 15 minutes.
Setting up the software also took 15 minutes, so the total time used to set up the system
adds up to 30 minutes. How long it takes to simulate the signals is depending on the user.
It is possible to complete the signal testing in less than 30 minutes.
When testing on the Keppel Fels project, the Sdi software wasn’t responding. Since there
was a lack of personal at the time when the project group were testing, the testing was
moved to another rig project, the Noble Jim Day.
7.6.2 NOBLE JIM DAY
With one day behind and a tight schedule, the project group only got to test one analog
signal and one digital signal. The Sdi software detected both signals. When testing the
analog signal, the Standpipe pressure was tested. With 4 mA the value shifted between 0
and -3, witch equals an offset to 0.05 percent.
The digital signal was simulating a mud pump, and at 60 spm the actual spm in the SDI
software shifted between 54 and 64. This is because it’s not a real-time simulation, and
there were limited resources on the test laptop. For values below 60 spm the software
followed correctly.
With more time available, a complete test procedure could be completed, and the test data
documented. Unfortunately the time ran out, and this had to be skipped. The system has
Inge Osli & Erling André Hornenes
45 | P a g e
Automatic testing of Drilling Instrumentation system
been tested with a multimeter, to check if the selected channels are responding, and
correct values are sent out. See appendix H – Internal FieldPoint test procedure.
7.7 SUGGESTED IMPROVEMENTS
7.7.1 REMOTE CONTROL
It is possible to set up the program to be controlled remotely, so that anyone can run the
test program regardless of geographic location. A lot of the software testing at NOV is
done remotely, and it could be an advantage to have the same possibility with the test
program. Then they could connect the FieldPoint system in Stavanger, and it could be
controlled from anywhere.
7.7.2 AUTO REPORTING
Another feature that could be interesting to add, is an automatic report system, where you
can document that the components that are tested worked as expected. Then, when
completing the test, you can print a report documenting that everything is working
properly.
7.7.3 AUTOMATIC SETUP OF RIO AND DAU
If it is possible to get the terminal block setup for the project from HED, it would be time
saving to create an automatic setup of the channels on the FieldPoint. This will allow the
user to export a complete wiring diagram, without having to set it up first. With today’s
situation, it is not possible to get this data from HED.
7.7.4 PILLAR TERMINAL
To connect the system easily, it is possible to change the terminal blocks, to get the
possibility to connect the channels without having to use the screw terminal.
7.7.5 DUAL SENSOR SIMULATION
On several project, there are two sets of sensors that needs to be simulated for each
component. Therefore it would be smart to create the option to chose two sensors to
simulate. For example pit 1 sensor A & B.
46 | P a g e
Inge Osli & Erling André Hornenes
Automatic testing of Drilling Instrumentation system
7.8 CHANGES THAT ARE NECESSARY BEFORE USING THE SYSTEM
7.8.1 STATIC IP ADDRESS
In order to avoid having to set up communication for each project, it is necessary to set an
static IP address for the FieldPoint’s. This has to be coordinated with the IT department at
NOV in Stavanger.
7.8.2 CLOSED NETWORK
Another way to set a static IP address, and avoid conflicts with other computers or
components, is to use the test system on a closed network. This way the system will not
have anything to do with the NOV network. With this solution, it will not be possible to
remote control the system though.
Inge Osli & Erling André Hornenes
47 | P a g e
Automatic testing of Drilling Instrumentation system
8 WORK PACKAGE 6: ADMINISTRATIVE
The last work package the project group decided to establish incorporated all the
administrative tasks. The main purpose for this package was to ensure that the progress of
the project went according to the plan. This was done by arranging frequently meetings
with the teaching supervisor, the employer and the project group. The project group also
kept an hour log which was continuously compared to the estimated hours and the
expected progress.
8.1 TWO WEEKS MEETING
Approximately every two weeks the teaching supervisor, the employer and the project
group met to present and discuss the progress of the project. In advance the project group
sent out a notice of meeting and a two week report. The two week report included what
the group had done the last period, time consumption of hours and potential deviations.
During every meeting a referent from the project group made a report. The minutes of
meeting were sent to the participants within a short time after the meeting. At the end of
each meeting the participants agreed upon when the next meeting should take place.
8.2 HOUR LOG
At the start of the project the group made a document in Microsoft Excel to keep track of
the hour consumption and work progress. Each group member could fill inn the hours
used at the end of the day and the excel document automatically compared it to the
estimated hours and generated an s-curve diagram. The excel file also included contact
info of all the involved persons, a notepad for ideas and a log of all conversations the
project group have made during the project.
Se Appendix G – Time consumption.
8.3 TEMPLATES
During the project the group has based all their documents on the templates provided by
HiST.
48 | P a g e
Inge Osli & Erling André Hornenes
Automatic testing of Drilling Instrumentation system
8.4 QUALITY VERIFICATION
The project group consisted of two members which have made the quality verification
very easy. During the project each group member has controlled the work of the other
member continuously. This have prevented faults and saved the group from using a lot of
time on troubleshooting.
8.5 LITERATURE
To handle this project it was necessary for the project group to acquire a lot of new
knowledge. The schools library was frequently used in the first four work packages.
When the programming in work package 5 started, the books and notes from the
LabVIEW course from the autumn semester came in handy. Parallel to books, internet
has also been an invaluable supplement.
For more details about the used literature see the Literature list.
Inge Osli & Erling André Hornenes
49 | P a g e
Automatic testing of Drilling Instrumentation system
EVALUATIONS
Throughout the project period the cooperation has been very good, and both members
were committed to an open discussion. There was no need for strict organization as both
participants showed responsibility and initiative. The size of the group has also been
perfect for the assignment.
Using English for all documentation and reports turned out to be a challenge, but in the
same time it was very educational. Both members feel that they have gained more
experience with writing in English.
EVALUATION OF THE EFFECT GOAL
The process goals were described in the pre-project report, and were what the group
expected to gain from the process of working with the project.
-
The effect goal will contain getting a better understanding of the Sdi system, and
getting to use the achieved knowledge from the previous years of the bachelor
study, while acquiring new knowledge.
The group feels that this goal has been fulfilled. Both members know much more about
the Sdi system today than when they started. Knowledge from previous years has been
used, and a lot of new knowledge has been achieved.
EVALUATION OF THE RESULT GOALS
•
Approved pre-project within 08.02.2008.
This part has been achieved according to plan.
•
Investigate different methods for testing instrumentation systems within
13.02.2008.
This part has been achieved according to plan. The results can be found in work
package 1.
•
Evaluate which methods that are the most suitable for an efficient test of the Sdi
within 15.02.2008.
This part has been achieved according to plan. The results can be found in work
package 2.
50 | P a g e
Inge Osli & Erling André Hornenes
Automatic testing of Drilling Instrumentation system
•
Draw up different suggestions for various technical solutions within 04.03.2008
This part has been achieved according to plan. The results can be found in work
package 3.
•
Evaluate the technical solutions within 06.03.2008.
This part has been achieved according to plan. The results can be found in work
package 4
•
Implementation of a system for the chosen solution within 02.05.2008.
This part has been achieved according to plan. The results can be found in work
package 5. The hardware and the software have been tested and are ready to be
delivered to the employer.
•
Deliver a professional bachelor project, which will allow NOV to continue
developing the system after need within 09.05.2008.
This part has been achieved according to plan. The project was delivered on time,
and the group members look forward to the evaluation and feedback.
TIME USE AND PROGRESS
Strict project managing and concrete deadlines made in the pre-project and in the Gantt
diagram, have ensured that the progress of the project have gone according to plan. The
group realized that the estimated time consumption in the start was too high, and this led
to a deviation in the hour log. But the remaining hours came to good use later on as the
programming and documentation started. At the project end the actual hour consumption
was slightly higher then the estimated 900 hours. No substantial deviations besides the
hour deviation have accrued during the project period.
Inge Osli & Erling André Hornenes
51 | P a g e
Automatic testing of Drilling Instrumentation system
BUDGET
In the pre-project there was no budget, since a part of the main project was to find a
suitable solution for the Sdi test system it was impossible to estimate what the costs
would be. After a solution was agreed upon, the equipment was bought and the invoice
had been approved by NOV, the project group could make a budget over the expenses.
Table 4 – Complete expenses
Description
Purchases National Instrument
Purchases Clas Ohlson
Purchases Biltema
Purchases Elfa
Airplane tickets
Total
52 | P a g e
Amount - NOK
46240,596,140,5000,19698,71674,-
Inge Osli & Erling André Hornenes
Automatic testing of Drilling Instrumentation system
CONCLUSION
The project has been very interesting and educational. The project group has experienced
a continuous learning progression throughout the whole process. Different challenges
have appeared in each phase of the project, and these have been solved in a satisfying
matter.
The project group met with the employer, National Oilwell Varco, as early as before
Christmas, to get some insight regarding the task. This made the project planning easier,
and throughout the whole project the progress went according to the plan. This has meant
that the project group could work steadily without any unpleasant surprises.
When the project is completed, all the goals presented in the pre-project are met. A
complete test product is developed, and is ready to be put to use. Good communication
with the employer has eased the progress, and the final product meets the specifications
required.
This bachelor project was a great way to complete the bachelor degree, and the project
group has used knowledge previously acquired, ass well as getting new knowledge,
especially when it comes to National Instruments LabVIEW. Overall, this has been a
positive experience, and a very nice closure of a long education.
Inge Osli & Erling André Hornenes
53 | P a g e
Automatic testing of Drilling Instrumentation system
REFERENCE LIST
References, litterature
[1]
Cheatle, Keith R. (2006)
Fundamentals of test measurement instrumentation
Research Triangle Park
2
Jeffrey Travis & Jim Kring (2007)
LabVIEW for Everyone
Third edition
Prentice Hall
Other references
3
4
5
6
Sigve Sandvik, Teknologi sjef / Technical Manager, Hitec Products Drilling
Tor A. Johansen, Operation, Marine Cybernetics
Siemens AS, Division Automation & Drives
National Instrument, Sales division
54 | P a g e
Inge Osli & Erling André Hornenes
Automatic testing of Drilling Instrumentation system
DEFINITIONS
NOV
Sdi
I/O
PLC
DAQ
FAT
NI
LabVIEW
DAU
RIO
HED
National Oilwell Varco Ltd
Smart Drilling Instrumentation
Input/Output
Programmable Logic Controller
Data Acquisition
Factory Acceptance Test
National Instruments
Laboratory Virtual Instrument Engineering Workbench
Graphical programming environment
Data Acquisition Unit
Remote I/O
NOV’s database for all projects.
Inge Osli & Erling André Hornenes
55 | P a g e
Automatic testing of Drilling Instrumentation system
APPENDIX
A
B
C
D
E
F
G
H
I
CD contents
Documentation – Keppel Fels B289 Test program
Documentation – Universal Test program
NI FieldPoint Operation Instructions
Purchase suggestions
User manual – Universal Test program
Time consumption
Internal Fieldpoint test procedure
Internal wiring diagram
56 | P a g e
Inge Osli & Erling André Hornenes