1
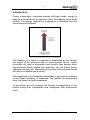
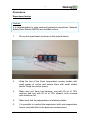
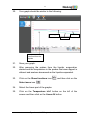
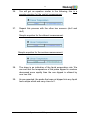
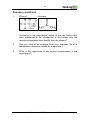
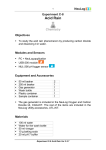
1 Experiment C-17 Evaporation Objectives To study the changes in temperature caused by the evaporation of two liquids. To relate the temperature difference due to evaporation, to the strength of intermolecular attraction and molecular weight. Modules and Sensors PC + NeuLog application USB-200 module Three NUL-203 Temperature logger sensors (It is also possible to conduct the experiment with one NUL-203 Temperature logger sensor.) Equipment and Accessories 50 ml beaker Cotton pad 2 3 The items above are included in the NeuLog Utility accessories, UTL-KIT. Materials Small rubber band 20 ml of 70% ethanol (C2H5OH) 20 ml of 70% acetone ((CH3)2CO) 15 cm of aluminum foil 3 1 1 1 Experiment C-17 Evaporation Ver 3.2.7 2 Introduction During evaporation, molecules acquire sufficient kinetic energy to pass from the liquid into the gaseous state, this happens at the liquid surface. The energy required for evaporation is absorbed from the surrounding environment. The tendency of a liquid to evaporate is determined by two factors: the weight of the molecule and its intermolecular forces. Lighter molecules will tend to evaporate more quickly than heavier ones. Intermolecular forces include ionic attraction, van der Waals forces, hydrogen bonding, etc. Molecules with weaker intermolecular forces will tend to evaporate more quickly. The magnitude of the temperature decrease is generally an indicator of the liquid's tendency to evaporate. The greater the temperature drop, the faster the liquid evaporates. In this activity we will measure the change in temperature of two liquids during their evaporation and investigate their evaporation rates. Experiment C-17 Evaporation Ver 3.2.7 3 Procedure Experiment setup Caution: It is recommended to wear personal protective equipment. Material Safety Data Sheets (MSDS) are available online. 1. Set up the experiment as shown in the picture below. 2. Wrap the tips of the three temperature sensor probes with small pieces of cotton and secure them with small rubber bands. Wrap the cotton evenly. 3. Make sure you have two beakers, one with 20 ml of 70% acetone and one with 20 ml of 70% ethanol, both covered with aluminum foil. 4. Make sure that the temperature is relatively stable. 5. It is possible to conduct the experiment with one temperature sensor and add data to the previous measurement. Experiment C-17 Evaporation Ver 3.2.7 4 Sensor setup 6. Connect the USB-200 module to the PC. 7. Check that the three temperature sensors connected to the USB-200 module in a chain. are Note: The following application functions are explained in short. It is recommended to practice the NeuLog application functions (as described in the user manual) beforehand. 8. Run the NeuLog application and check that the sensors are identified. Experiment C-17 Evaporation Ver 3.2.7 5 ID numbers setup: In order to use three sensors of the same kind, they should have different ID numbers. Connect one of the sensors and check that it is identified. Click on the NeuLog Tools icon . Click on the "Set sensor's ID" button and change the number in the box to '2'. The Search function will run automatically and you will see that the sensor's module box now shows '2'. ID number Disconnect the sensor with ID number 2 and connect the next sensor in order to change its ID. Proceed as you did for the first sensor. Repeat this procedure for any other sensor of the same kind you want to connect in a chain. Once your sensors (in this case three temperature sensors) have different ID numbers, you can connect them in a chain. Experiment C-17 Evaporation Ver 3.2.7 6 Settings 1. Click on the On-line Experiment icon main icon bar. in the NeuLog 9. 10. Click on the Experiment setup icon and set the: Experiment duration to 3 minutes Sampling rate to 10 per second Testing and measurements 11. Make one hole in each aluminum foil so that the cotton covered probes can be inserted into the beakers. 12. The sensor with ID number 1 is for control, leave its probe on the table. 13. Carefully insert the ID number 2 sensor's probe in the ethanol so that the beaker does not tip over. 14. Insert the ID number 3 sensor's probe in the acetone filled beaker. 15. Leave the sensors in the liquids for about ten seconds. Experiment C-17 Evaporation Ver 3.2.7 7 16. Click on the Run Experiment icon measurement. to start the 17. After 10 seconds, remove the sensors simultaneously from the liquids. 18. Put the three probes on the table with their tips coming out and hold them in this way until the measurement is complete. 19. In order to focus on the desired range, click on the Zoom icon , locate the mouse cursor at a point above the graph and press its left button; keep it pressed and create a rectangle that includes the whole graph. Experiment C-17 Evaporation Ver 3.2.7 8 20. Your graph should be similar to the following: Ethanol Not dipped Acetone The probes were removed from the liquids 21. Save your graph. 22. After removing the probes from the liquids, evaporation started and the temperature in the probes that were dipped in ethanol and acetone decreased as the liquids evaporated. 23. Click on the Show functions icon Select zone icon and then click on the . 24. Select the linear part of the graphs. 25. Click on the Temperature id=1 button on the left of the screen and then click on the Linear fit button. Experiment C-17 Evaporation Ver 3.2.7 9 26. You will get an equation similar to the following, this is a sample equation for the control measurement: 27. Repeat this process with the other two sensors (id=2 and id=3) Sample equation for the ethanol measurement: Sample equation for the acetone measurement: 28. The slope is an indication of the liquid evaporation rate. We can see that the temperature of the probe dipped in acetone decreased more rapidly than the one dipped in ethanol by over two fold. 29. As we expected, the probe that was not dipped into any liquid had a slope which was very close to 0. Experiment C-17 Evaporation Ver 3.2.7 10 Summary questions 1. Ethanol: Acetone: Hydrogen bonding ability 46 g/mol 58 g/mol According to the data above, which of the two factors that were mentioned in the introduction is the reason why the acetone evaporated more rapidly than the ethanol? 2. Can you think of an example from your everyday life of a temperature decrease caused by evaporation? 3. What is the importance of the control measurement in the experiment? Experiment C-17 Evaporation Ver 3.2.7