1
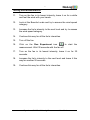
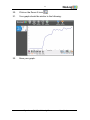
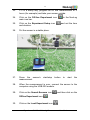
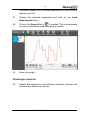
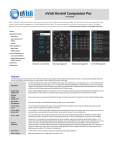
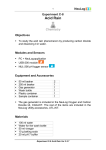
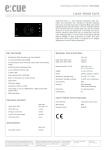
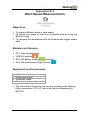
1 Experiment E-4 Wind Speed Measurements Objectives To explore different levels of wind speed. To assess the speed of natural or simulated wind by using the Beaufort scale. To compare the assessment with the Anemometer logger sensor data. Modules and Sensors PC + NeuLog application USB-200 module BAT-200 Battery module (optional) NUL-242 Anemometer logger sensor Equipment and Accessories Utility stand Right angle clamp Extension clamp Fan The items above (except for the fan) are included in the NeuLog Utility accessories, UTL-KIT and in the NeuLog Mechanics kit, MEC-KIT. Experiment E-4 Wind Velocity Measurements Ver 3.0.4 2 Introduction Wind is the movement of air at any velocity, especially a natural movement along the ground. It is caused by differences in air pressure within our atmosphere. Air under high pressure moves toward areas of low pressure. The greater the difference in pressure, the faster the air flows. The direction of the wind is expressed as the direction from which it is blowing. For example, easterly winds blow from east to west. Sea breezes occur when inland areas heat up on sunny afternoons. That warms the air, causing it to rise. Cooler air rushes in from the ocean to take its place creating wind. Land breezes come at night, when the inland temperature value is low and the ocean is warmer than the land. In this situation, cooler air from the land moves towards the sea. Similar forces produce global wind patterns such as trade winds. Wind speed relates to observed conditions at sea or on land. The Beaufort scale includes descriptions of these conditions and divides wind speeds into twelve different categories from less than 1 mph or 1.6 Km/hour (no apparent wind) to more than 74 mph or 119 Km/hour (hurricane). The following Beaufort Scale for wind speed was taken from the University of North Carolina's website: http://www.unc.edu/~rowlett/units/scales/beaufort.html Speed Force Name knots km/hr mph Conditions at Sea Conditions on Land 0 <1 <2 <1 Calm Sea like a mirror. Smoke rises vertically. 1 1-3 1-5 1-4 Light air Ripples only. Smoke drifts and leaves rustle. 2 4-6 6-11 5-7 Light breeze Small wavelets (0.2 m). Crests have a glassy appearance. Wind felt on face. 3 7-10 12-19 Gentle breeze Large wavelets (0.6 m), crests begin to break. Flags extended, leaves move. 4 11-16 20-29 1218 Moderate breeze Small waves (1 m), some whitecaps. Dust and small branches move. 5 17-21 30-39 1924 Fresh breeze Moderate waves (1.8 m), many whitecaps. Small trees begin to sway. 6 22-27 40-50 2531 Strong breeze Large waves (3 m), probably some spray. Large branches move, wires whistle, umbrellas are difficult to control. 7 28-33 51-61 3238 Near gale Mounting sea (4 m) with foam blown in streaks downwind. Whole trees in motion, inconvenience in walking. 811 Experiment E-4 Wind Velocity Measurements Ver 3.0.4 3 8 34-40 62-74 3946 Gale Moderately high waves (5.5 m), crests break into spindrift. Difficult to walk against wind. Twigs and small branches blown off trees. 9 41-47 76-87 4754 Strong gale High waves (7 m), dense foam, visibility affected. Minor structural damage may occur (shingles blown off roofs). 10 48-55 88-102 5563 Storm Very high waves (9 m), heavy sea roll, visibility impaired. Surface generally white. Trees uprooted, structural damage likely. 11 56-63 103118 6473 Violent storm Exceptionally high waves (11 m), visibility poor. Widespread damage to structures. 12 64+ 119+ 74+ Hurricane Severe structural damage to 14 m waves, air filled with foam and buildings, wide spread spray, visibility bad. devastation. How can we measure wind speed? An anemometer is an instrument with three or four small hemispheres set so they can catch the wind and revolve about a vertical rod. The revolutions are recorded and wind speed is calculated (in kilometers/hour or miles/hour). In this experiment, you will use a fan as a source of wind and simulate different situations, from light breeze to moderate breeze. You will assess the wind speed category by using the Beaufort scale and then compare this assessment with data obtained through an Anemometer logger sensor. During a windy day, you could do an off-line measurement for a couple of minutes or hours and see the wind velocity changes during this period of time. Experiment E-4 Wind Velocity Measurements Ver 3.0.4 4 Procedure Experiment setup 1. Set up the experiment as shown in the picture below. 2. Place the fan on the table and the anemometer in front of it at a distance of approximately 30 cm. Experiment E-4 Wind Velocity Measurements Ver 3.0.4 5 Sensor setup 3. Connect the USB-200 module 4. Check that the anemometer sensor USB-200 module. to the PC. is connected to the Note: The following software functions are explained in short. It is recommended to practice the NeuLog application functions (as described in the user manual) beforehand. 5. Run the NeuLog application and check that the anemometer sensor is identified. Settings 6. Click on the On-line Experiment icon main icon bar. 7. Click on the Sensor's Module box. 8. Click on the Range button. in the NeuLog Experiment E-4 Wind Velocity Measurements Ver 3.0.4 6 9. Select the km/h button or the mph button to change the sensor's mode (depends on your country). The sample experiments will be conducted in mph mode. 10. Click on the Experiment Setup icon and set the: Experiment duration to 2 minutes Sampling rate to 10 per second Experiment E-4 Wind Velocity Measurements Ver 3.0.4 7 Testing and measurements 11. Turn on the fan in its lowest intensity; leave it on for a while and feel the wind with your hands. 12. Look at the Beaufort scale and try to assess the wind speed category. 13. Increase the fan's intensity to the next level and try to assess the wind speed category. 14. Continue this way for all the fan's intensities. 15. Turn off the fan. 16. Click on the Run Experiment icon to start the measurement. Wait 30 seconds with the fan off. 17. Turn on the fan in its lowest intensity; leave it on for 30 seconds. 18. Increase the fan's intensity to the next level and leave it this way for another 30 seconds. 19. Continue this way for all the fan's intensities. Experiment E-4 Wind Velocity Measurements Ver 3.0.4 8 20. Click on the Zoom fit icon . 21. Your graph should be similar to the following: 22. Save your graph. Experiment E-4 Wind Velocity Measurements Ver 3.0.4 9 23. If it is a windy day, program an off line measurement of 2 hours (for example) and take your sensor outside. 24. Click on the Off-line Experiment icon main icon bar. 25. Click on the Experiment Setup icon and duration. 26. Put the sensor in a stable place. 27. Press the sensor’s measurement. 28. When the measurement is over, connect the sensor to the computer using the USB-200 module. 29. Click on the Search Sensors icon Offline Experiment icon 30. start/stop in the NeuLog and set the time button to the and then click on the . Click on the Load Experiment icon start . Experiment E-4 Wind Velocity Measurements Ver 3.0.4 10 The menu shows a list of stored experiments in the sensor's memory (up to 5). 31. Choose the required experiment and click on the Load Experiments button. 32. Click on the Zoom fit icon if needed. This is an example of a short experiment conducted during a storm: 33. Save your graph. Challenge research 34. Repeat the experiment with different distances between the anemometer sensor and the fan. Experiment E-4 Wind Velocity Measurements Ver 3.0.4 11 Summary questions 1. What wind speeds did you get when using the fan? What wind speed did you get when measuring outdoors? 2. Which Beaufort Scale categories are compatible with your results? 3. Were you able to assess the wind speed using this scale? Experiment E-4 Wind Velocity Measurements Ver 3.0.4