1
User Manual
PowerMonitor 5000 Unit
Catalog Numbers 1426-M5, 1426-M6, 1426-M8
Important User Information
Read this document and the documents listed in the additional resources section about installation, configuration, and
operation of this equipment before you install, configure, operate, or maintain this product. Users are required to
familiarize themselves with installation and wiring instructions in addition to requirements of all applicable codes, laws,
and standards.
Activities including installation, adjustments, putting into service, use, assembly, disassembly, and maintenance are required
to be carried out by suitably trained personnel in accordance with applicable code of practice.
If this equipment is used in a manner not specified by the manufacturer, the protection provided by the equipment may be
impaired.
In no event will Rockwell Automation, Inc. be responsible or liable for indirect or consequential damages resulting from the
use or application of this equipment.
The examples and diagrams in this manual are included solely for illustrative purposes. Because of the many variables and
requirements associated with any particular installation, Rockwell Automation, Inc. cannot assume responsibility or
liability for actual use based on the examples and diagrams.
No patent liability is assumed by Rockwell Automation, Inc. with respect to use of information, circuits, equipment, or
software described in this manual.
Reproduction of the contents of this manual, in whole or in part, without written permission of Rockwell Automation,
Inc., is prohibited.
Throughout this manual, when necessary, we use notes to make you aware of safety considerations.
WARNING: Identifies information about practices or circumstances that can cause an explosion in a hazardous environment,
which may lead to personal injury or death, property damage, or economic loss.
ATTENTION: Identifies information about practices or circumstances that can lead to personal injury or death, property
damage, or economic loss. Attentions help you identify a hazard, avoid a hazard, and recognize the consequence.
IMPORTANT
Identifies information that is critical for successful application and understanding of the product.
Labels may also be on or inside the equipment to provide specific precautions.
SHOCK HAZARD: Labels may be on or inside the equipment, for example, a drive or motor, to alert people that dangerous
voltage may be present.
BURN HAZARD: Labels may be on or inside the equipment, for example, a drive or motor, to alert people that surfaces may
reach dangerous temperatures.
ARC FLASH HAZARD: Labels may be on or inside the equipment, for example, a motor control center, to alert people to
potential Arc Flash. Arc Flash will cause severe injury or death. Wear proper Personal Protective Equipment (PPE). Follow ALL
Regulatory requirements for safe work practices and for Personal Protective Equipment (PPE).
Allen-Bradley, Rockwell Software, Rockwell Automation, PowerMonitor, FactoryTalk, ControlLogix, SLC, RSLogix, RSLinx, RSNetWorx, PLC-5, Logix5000, CompactLogix, Studio 5000, and ControlFLASH are
trademarks of Rockwell Automation, Inc.
Trademarks not belonging to Rockwell Automation are property of their respective companies.
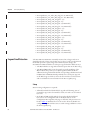
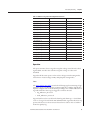
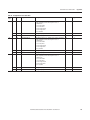
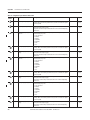
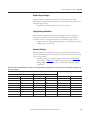
Summary of Changes
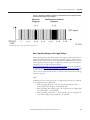
This manual contains new and updated information. Changes throughout this
revision are marked by change bars, as shown to the right of this paragraph.
New and Updated
Information
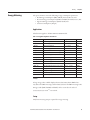
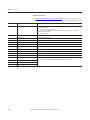
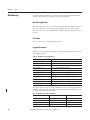
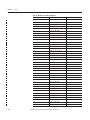
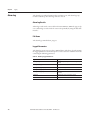
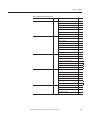
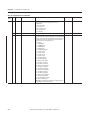
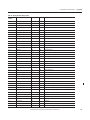
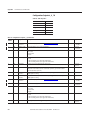
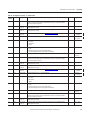
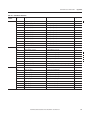
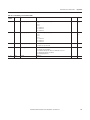
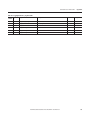
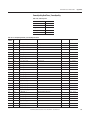
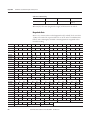
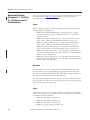
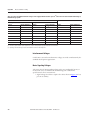
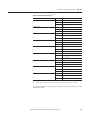
This table contains the changes made to this revision.
Topic
Page
Added M8 model information and functionality.
Throughout
Updated references to FactoryTalk EnergyMetrix sofware user manual.
Throughout
Added wiring diagrams for single-phase wiring.
28, 31
Updated the amount of time results are available after the command is received.
59
Added information to the Harmonic Analysis section.
82…88
Updated the Sag and Swell section.
88…90
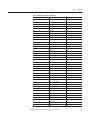
Updated the list of logs in the logging overview table.
96
Updated the list of logs in the selected log table.
100
Added information for which EN 50160 record to be returned.
101
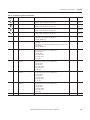
Updated the Min/Max Log Parameter Attributes table with new parameters.
120
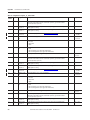
Updated the Alarm Codes and Descriptions table.
137
Updated the Power Quality Event Codes table.
144
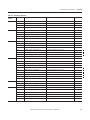
Added information to show the differences in the Snapshot log for the M6 and M8 models.
150
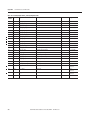
Added information on forced operation of outputs.
154
Added information about setpoint and logic gate status bit.
166
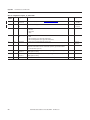
Updated data tables to include M8 model funcationality.
Appendix A
Updated the Power Quality technical specification table to include M8 model functionality.
397
Added table for EN 61000-4-30 Class Designations.
398
Added Appendix E, IEEE 519 Pass/Fail and TDD
415
Added Appendix F, IEEE 1159 Power Quality Event Classification
419
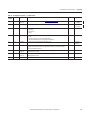
Added Appendix G, EN 50160 Conformance Tracking
429
Added Appendix H, EN 61000-4-30 Metering and Aggregation
439
Rockwell Automation Publication 1426-UM001G-EN-P - November 2014
3
Summary of Changes
Notes:
4
Rockwell Automation Publication 1426-UM001G-EN-P - November 2014
Table of Contents
Preface
About this Manual . . . . . . . . . . . . . . . . . . . . . . . . . . . . . . . . . . . . . . . . . . . . . . . . . 9
Intended Audience . . . . . . . . . . . . . . . . . . . . . . . . . . . . . . . . . . . . . . . . . . . . . . . . . 9
Catalog Number Explanation . . . . . . . . . . . . . . . . . . . . . . . . . . . . . . . . . . . . . . . 9
Additional Resources . . . . . . . . . . . . . . . . . . . . . . . . . . . . . . . . . . . . . . . . . . . . . 10
Chapter 1
PowerMonitor 5000 Unit Overview
Safety . . . . . . . . . . . . . . . . . . . . . . . . . . . . . . . . . . . . . . . . . . . . . . . . . . . . . . . . . . .
Product Description. . . . . . . . . . . . . . . . . . . . . . . . . . . . . . . . . . . . . . . . . . . . . .
PowerMonitor 5000 Unit Features and Functions . . . . . . . . . . . . . . . . . .
Before You Begin . . . . . . . . . . . . . . . . . . . . . . . . . . . . . . . . . . . . . . . . . . . . . . . .
Product Disposal. . . . . . . . . . . . . . . . . . . . . . . . . . . . . . . . . . . . . . . . . . . . . . . . .
11
11
12
16
16
Chapter 2
Install the PowerMonitor 5000 Unit
Mounting Considerations . . . . . . . . . . . . . . . . . . . . . . . . . . . . . . . . . . . . . . . . 17
Wire the PowerMonitor 5000 Unit. . . . . . . . . . . . . . . . . . . . . . . . . . . . . . . . 20
Connect Communication . . . . . . . . . . . . . . . . . . . . . . . . . . . . . . . . . . . . . . . . 33
Chapter 3
Setup and Commands
Setup Using the Web Interface . . . . . . . . . . . . . . . . . . . . . . . . . . . . . . . . . . . .
Commands . . . . . . . . . . . . . . . . . . . . . . . . . . . . . . . . . . . . . . . . . . . . . . . . . . . . . .
Setup Using Optional Software . . . . . . . . . . . . . . . . . . . . . . . . . . . . . . . . . . .
Setup Using Communication . . . . . . . . . . . . . . . . . . . . . . . . . . . . . . . . . . . . .
43
52
53
53
Chapter 4
Metering
Basic Metering . . . . . . . . . . . . . . . . . . . . . . . . . . . . . . . . . . . . . . . . . . . . . . . . . . .
Wiring Diagnostics. . . . . . . . . . . . . . . . . . . . . . . . . . . . . . . . . . . . . . . . . . . . . . .
Wiring Correction . . . . . . . . . . . . . . . . . . . . . . . . . . . . . . . . . . . . . . . . . . . . . . .
Metering Overview. . . . . . . . . . . . . . . . . . . . . . . . . . . . . . . . . . . . . . . . . . . . . . .
Energy Metering . . . . . . . . . . . . . . . . . . . . . . . . . . . . . . . . . . . . . . . . . . . . . . . . .
Demand Metering . . . . . . . . . . . . . . . . . . . . . . . . . . . . . . . . . . . . . . . . . . . . . . .
Power Metering. . . . . . . . . . . . . . . . . . . . . . . . . . . . . . . . . . . . . . . . . . . . . . . . . .
Voltage, Current, Frequency Metering . . . . . . . . . . . . . . . . . . . . . . . . . . . . .
Configuration Lock . . . . . . . . . . . . . . . . . . . . . . . . . . . . . . . . . . . . . . . . . . . . . .
55
57
61
64
65
66
72
74
76
Chapter 5
Power Quality Monitoring
Harmonic Analysis . . . . . . . . . . . . . . . . . . . . . . . . . . . . . . . . . . . . . . . . . . . . . . . 82
Sag and Swell Detection . . . . . . . . . . . . . . . . . . . . . . . . . . . . . . . . . . . . . . . . . . 88
Waveform Recording (M6 and M8 model) . . . . . . . . . . . . . . . . . . . . . . . . . 90
Rockwell Automation Publication 1426-UM001G-EN-P - November 2014
5
Table of Contents
Chapter 6
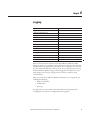
Logging
Logging Overview . . . . . . . . . . . . . . . . . . . . . . . . . . . . . . . . . . . . . . . . . . . . . . . . 96
Waveform Log (M6 and M8 model) . . . . . . . . . . . . . . . . . . . . . . . . . . . . . . 102
Energy Log. . . . . . . . . . . . . . . . . . . . . . . . . . . . . . . . . . . . . . . . . . . . . . . . . . . . . . 106
Data Log . . . . . . . . . . . . . . . . . . . . . . . . . . . . . . . . . . . . . . . . . . . . . . . . . . . . . . . 110
Min/Max Log. . . . . . . . . . . . . . . . . . . . . . . . . . . . . . . . . . . . . . . . . . . . . . . . . . . 120
Load Factor Log. . . . . . . . . . . . . . . . . . . . . . . . . . . . . . . . . . . . . . . . . . . . . . . . . 126
Time-of-use (TOU) Log . . . . . . . . . . . . . . . . . . . . . . . . . . . . . . . . . . . . . . . . . 128
Event Log. . . . . . . . . . . . . . . . . . . . . . . . . . . . . . . . . . . . . . . . . . . . . . . . . . . . . . . 130
Setpoint Log . . . . . . . . . . . . . . . . . . . . . . . . . . . . . . . . . . . . . . . . . . . . . . . . . . . . 134
Alarm Log . . . . . . . . . . . . . . . . . . . . . . . . . . . . . . . . . . . . . . . . . . . . . . . . . . . . . . 136
Power Quality Log (M6 and M8 model). . . . . . . . . . . . . . . . . . . . . . . . . . . 142
Trigger Data Log (M6 and M8 model) . . . . . . . . . . . . . . . . . . . . . . . . . . . . 147
Snapshot Log . . . . . . . . . . . . . . . . . . . . . . . . . . . . . . . . . . . . . . . . . . . . . . . . . . . 150
EN 50160 Weekly and Yearly Logs . . . . . . . . . . . . . . . . . . . . . . . . . . . . . . . 152
Chapter 7
Logic Functions
Relay and KYZ Outputs . . . . . . . . . . . . . . . . . . . . . . . . . . . . . . . . . . . . . . . . . 153
Status Inputs . . . . . . . . . . . . . . . . . . . . . . . . . . . . . . . . . . . . . . . . . . . . . . . . . . . . 157
Setpoints . . . . . . . . . . . . . . . . . . . . . . . . . . . . . . . . . . . . . . . . . . . . . . . . . . . . . . . 159
Chapter 8
Other Functions
Security. . . . . . . . . . . . . . . . . . . . . . . . . . . . . . . . . . . . . . . . . . . . . . . . . . . . . . . . .
Date and Time Functions . . . . . . . . . . . . . . . . . . . . . . . . . . . . . . . . . . . . . . . .
Network Time Synchronization . . . . . . . . . . . . . . . . . . . . . . . . . . . . . . . . . .
System Error Response. . . . . . . . . . . . . . . . . . . . . . . . . . . . . . . . . . . . . . . . . . .
Miscellaneous Commands . . . . . . . . . . . . . . . . . . . . . . . . . . . . . . . . . . . . . . .
177
179
181
184
186
Chapter 9
Communication
6
Native Ethernet Communication . . . . . . . . . . . . . . . . . . . . . . . . . . . . . . . . .
Optional DeviceNet Communication. . . . . . . . . . . . . . . . . . . . . . . . . . . . .
Optional ControlNet Communication . . . . . . . . . . . . . . . . . . . . . . . . . . .
Electronic Data Sheet (EDS) . . . . . . . . . . . . . . . . . . . . . . . . . . . . . . . . . . . . .
PowerMonitor 5000 Unit Memory Organization . . . . . . . . . . . . . . . . . .
Communication Command Summary . . . . . . . . . . . . . . . . . . . . . . . . . . . .
EtherNet/IP Object Model . . . . . . . . . . . . . . . . . . . . . . . . . . . . . . . . . . . . . .
DeviceNet and ControlNet Object Model. . . . . . . . . . . . . . . . . . . . . . . . .
Explicit Messaging. . . . . . . . . . . . . . . . . . . . . . . . . . . . . . . . . . . . . . . . . . . . . . .
Examples: Explicit Message Setup . . . . . . . . . . . . . . . . . . . . . . . . . . . . . . . . .
SCADA Applications. . . . . . . . . . . . . . . . . . . . . . . . . . . . . . . . . . . . . . . . . . . .
Controller Applications: Class 1 Connection . . . . . . . . . . . . . . . . . . . . . .
CIP Energy Object . . . . . . . . . . . . . . . . . . . . . . . . . . . . . . . . . . . . . . . . . . . . . .
Rockwell Automation Publication 1426-UM001G-EN-P - November 2014
187
188
189
190
190
192
193
194
194
195
202
208
222
Table of Contents
Chapter 10
Maintenance
Update the PowerMonitor 5000 Unit Firmware. . . . . . . . . . . . . . . . . . . 227
Upgrading the PowerMonitor 5000 Model and Communication . . . 229
Use the ControlFLASH Utility to Update Firmware . . . . . . . . . . . . . . 229
Appendix A
PowerMonitor 5000 Unit Data Tables Summary of Data Tables. . . . . . . . . . . . . . . . . . . . . . . . . . . . . . . . . . . . . . . . . 231
Data Tables. . . . . . . . . . . . . . . . . . . . . . . . . . . . . . . . . . . . . . . . . . . . . . . . . . . . . 234
Information Tables. . . . . . . . . . . . . . . . . . . . . . . . . . . . . . . . . . . . . . . . . . . . . . 395
Appendix B
Technical Specifications
Certifications . . . . . . . . . . . . . . . . . . . . . . . . . . . . . . . . . . . . . . . . . . . . . . . . . . . 400
Appendix C
PowerMonitor 5000 Display Module
Application Summary
Introduction. . . . . . . . . . . . . . . . . . . . . . . . . . . . . . . . . . . . . . . . . . . . . . . . . . . . 403
Terminal Setup . . . . . . . . . . . . . . . . . . . . . . . . . . . . . . . . . . . . . . . . . . . . . . . . . 403
Appendix D
PowerMonitor 5000 Waveform
Capture and Compression
Compression Algorithm . . . . . . . . . . . . . . . . . . . . . . . . . . . . . . . . . . . . . . . . . 411
Appendix E
IEEE 519 Pass/Fail and TDD
IEEE 519 Pass/Fail Capability (M6 and M8 models) . . . . . . . . . . . . . . . 415
IEEE 519 Pass/Fail Results. . . . . . . . . . . . . . . . . . . . . . . . . . . . . . . . . . . . . . . 416
IEEE 519 Short Term and Long Term Harmonic Results . . . . . . . . . . 417
Appendix F
IEEE 1159 Power Quality Event
Classification
Power Quality Event Classification per IEEE 1159-2009 . . . . . . . . . . .
Transients (Category 1.1.3, 1.2.1)(M8 model) . . . . . . . . . . . . . . . . . . . . .
Short Duration RMS Variations (Category 2.0 - Sags, Swells, and
Interruptions) (M6 and M8 model) . . . . . . . . . . . . . . . . . . . . . . . . . . . . . .
Long Duration RMS Variations (Category 3.0 - Undervoltage,
Overvoltage, Sustained Interruptions) (M6 and M8 model) . . . . . . . .
Voltage and Current Imbalance (Category 4.0) . . . . . . . . . . . . . . . . . . . .
Waveform Distortion (Categories 5.1 - DC Offset,
5.2 - Harmonics, and 5.3 - Interharmonics). . . . . . . . . . . . . . . . . . . . . . . .
Flicker (Voltage Fluctuations, Category 6.0). . . . . . . . . . . . . . . . . . . . . . .
Power Frequency Variations (Category 7.0) . . . . . . . . . . . . . . . . . . . . . . .
Rockwell Automation Publication 1426-UM001G-EN-P - November 2014
419
420
421
422
423
424
425
426
7
Table of Contents
Appendix G
EN 50160 Conformance Tracking
Introduction . . . . . . . . . . . . . . . . . . . . . . . . . . . . . . . . . . . . . . . . . . . . . . . . . . . .
Setup . . . . . . . . . . . . . . . . . . . . . . . . . . . . . . . . . . . . . . . . . . . . . . . . . . . . . . . . . . .
Operation . . . . . . . . . . . . . . . . . . . . . . . . . . . . . . . . . . . . . . . . . . . . . . . . . . . . . .
Results . . . . . . . . . . . . . . . . . . . . . . . . . . . . . . . . . . . . . . . . . . . . . . . . . . . . . . . . .
429
429
430
434
Appendix H
EN 61000-4-30 Metering and
Aggregation
Introduction . . . . . . . . . . . . . . . . . . . . . . . . . . . . . . . . . . . . . . . . . . . . . . . . . . . . 439
Power Quality Parameters. . . . . . . . . . . . . . . . . . . . . . . . . . . . . . . . . . . . . . . . 440
Glossary
. . . . . . . . . . . . . . . . . . . . . . . . . . . . . . . . . . . . . . . . . . . . . . . . . . . . . . . . . . . . . . . . 449
Index
. . . . . . . . . . . . . . . . . . . . . . . . . . . . . . . . . . . . . . . . . . . . . . . . . . . . . . . . . . . . . . . . 457
8
Rockwell Automation Publication 1426-UM001G-EN-P - November 2014
Preface
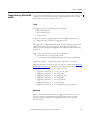
About this Manual
This manual contains detailed information on the topics in this list:
• Mounting and wiring of the unit.
• Wiring to native and optional communication port.
• Set-up and use of the display module.
• Information on metering functionality and measurements.
• Use of the display module for configuration, monitoring, and commands.
• Discussion of communication options, functionality, configuration, and
operation.
• Setpoint configuration and operation.
• Discrete I/O configuration and operation.
• Data logging including Waveform Log, Event Log, Min/Max Log, Power
Quality Log, and Load Factor Log.
• Advanced features including Power Quality and Harmonic Analysis.
• Powermonitor 5000 data tables.
Intended Audience
This manual is intended for qualified personnel. You need a basic understanding
of electric power and energy theory and terminology, and alternating-current
(AC) metering principles.
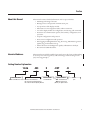
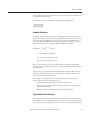
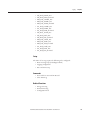
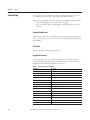
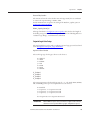
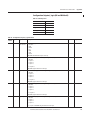
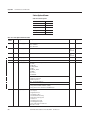
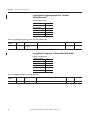
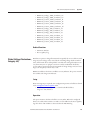
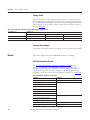
Catalog Number Explanation
1426
-M5
E
Model
Bulletin Number
Native Comms
1426 - PowerMonitor™ 5000 M5 - Base Power Monitor
E - EtherNet/IP
M6 - Basic Power Quality Monitor
M8 - Advanced Power Quality Monitor
-CNT
-B
Optional Comms
-CNT - ControlNet Port
-DNT - DeviceNet Port
[Blank] - No Optional Port
Rockwell Automation Publication 1426-UM001G-EN-P - November 2014
Series
A, B
9
Preface
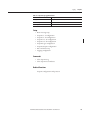
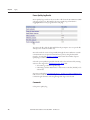
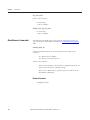
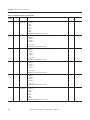
Additional Resources
These documents contain additional information concerning related products
from Rockwell Automation.
Resource
Description
PowerMonitor 5000 USB Driver Installation and
Configuration, publication 1426-IN001
Provides instructions for installing and configuring the
USB driver.
FactoryTalk EnergyMetrix User Manual, publication
FTEM-UM002.
Provides information on using FactoryTalk EnergyMetrix
software.
PanelView Component HMI Terminals User Manual,
publication 2711C-UM001
Provides instructions for setup and operation of the
PanelView Component terminal.
PanelView Plus Terminal User Manual,
publication 2711P-UM001
Provides instructions for setup and operation of the
PanelView Plus terminal.
Industrial Automation Wiring and Grounding Guidelines,
publication 1770-4.1
Provides general guidelines for installing a Rockwell
Automation® industrial system.
Product Certifications website, http://www.ab.com
Provides declarations of conformity, certificates, and
other certification details.
You can view or download publications at
http:/www.rockwellautomation.com/literature/. To order paper copies of
technical documentation, contact your local Allen-Bradley distributor or
Rockwell Automation sales representative.
10
Rockwell Automation Publication 1426-UM001G-EN-P - November 2014
Chapter
1
PowerMonitor 5000 Unit Overview
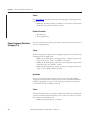
Safety
ATTENTION: Only qualified personnel, following accepted safety procedures,
can install, wire, and service the PowerMonitor 5000 unit and its associated
components. Before beginning any work, disconnect all sources of power and
verify that they are de-energized and locked out. Failure to follow these
instructions can result in personal injury or death, property damage, or
economic loss.
ATTENTION: Never open a current transformer (CT) secondary circuit with
primary current applied. Wiring between the CTs and the PowerMonitor 5000
unit must include a shorting terminal block in the CT secondary circuit. Shorting
the secondary with primary current present allows other connections to be
removed if needed. An open CT secondary with primary current applied
produces a hazardous voltage, which can lead to personal injury, death,
property damage, or economic loss.
IMPORTANT
Product Description
The PowerMonitor 5000 unit is not designed for nor intended for use as a
circuit protective device. Do not use this equipment in place of a motor
overload relay or circuit protective relay.
The PowerMonitor 5000 unit is the next generation of high-end electric
metering products from Rockwell Automation. This new family of meters
provides advanced technology, new functionality, faster response, and superior
accuracy. The M5 model is the base version and provides an extensive range of
metering functionality. The M6 model expands the metering capabilities of the
M5 with basic power quality monitoring functionality, including harmonics up
to the 63rd, waveforms and logging, and classification of power quality events.
The M8 model adds advanced power quality monitoring functions, including
flicker caused by voltage fluctuations, sub-cycle transient capture, harmonics up
to the 127th order, and interharmonic groups up to the 50th order. The
PowerMonitor 5000 unit communicates power and energy parameters to
controllers, HMI software, and applications such as FactoryTalk® EnergyMetrix
software over the Ethernet network or other optional networks.
Rockwell Automation Publication 1426-UM001G-EN-P - November 2014
11
Chapter 1
PowerMonitor 5000 Unit Overview
The PowerMonitor 5000 unit works with controllers or software applications to
address key customer applications including the following:
• Load profiling – logging power parameters such as real power, apparent
power and demand, for analysis of power usage by loads over time
• Cost allocation – reporting actual energy cost by department or process to
integrate energy information into management decisions
• Billing and sub-billing – charging users of energy the actual usage cost
rather than allocating by square footage or other arbitrary methods
• Power system monitoring and control – display and control power flow
and energy utilization
• Demand management – monitoring power usage and controlling loads to
reduce demand costs
• Demand response – controlling and monitoring usage in response to an
energy provider’s instruction to reduce demand
• Power quality - monitoring, measuring, recording, and logging power
system irregularities that can result in malfunctions or damage to
equipment
PowerMonitor 5000 Unit
Features and Functions
The PowerMonitor 5000 unit connects to your three-phase or split-phase AC
power system directly or through instrument transformers (PTs and CTs). It
converts instantaneous voltage and current values to digital values, and uses the
resulting digital values in calculations of parameters such as voltage, current,
power, and energy.
Features
The PowerMonitor 5000 unit includes a number of hardware features that are
common to all models.
12
Rockwell Automation Publication 1426-UM001G-EN-P - November 2014
PowerMonitor 5000 Unit Overview
Chapter 1
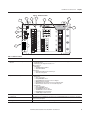
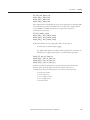
Figure 1 - Hardware Features
6
8
7
Module
status
Network
status
USB
Device
Config Lock
4
USB
Host
3
11
10
9
5
Virtual Wiring
Correction
Power
PowerMonitor 5000
---- S1
Y
K
Rx O
Rx com
Internal
24 VDC
Sn
Z
Rx C
12
I1
V1
√IP
1
---- S3
---- S com
ACT
EtherNet
S2
LNK
S4
Scom
V2
I2
S com
---- K
Y
NS
---- Z
R1 O
L1
V3
---- R1 com
1
2
2
3
4
DeviceNet
5
R1 C
---- R2 O
R2 com
I3
L2
GND
VN
---- R2 C
R3 O
---- R3 com
24V
R3 C
VG
I4
DS
com
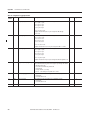
Table 1 - Hardware Features
Feature
Description
1. Ethernet port – standard RJ45 jack with status
indicators
Ethernet port hardware is included on all models. These protocols and functions are supported:
• EtherNet/IP network
• HTML web page for configuration and data access
Ethernet indicators
• LNK indicator
– Solid GREEN: IP link established
– Off: No link established
• ACT indicator
– Flashing YELLOW: Data present on Ethernet port
– Off: No data activity present
2. Optional communication port
DeviceNet and ControlNet networks
• Module Status
– OFF: No control power
– Flashing GREEN/RED: Self-test
– Flashing GREEN: Power monitor has not been configured
– GREEN: Power monitor is running
– Flashing RED: Power monitor has detected a recoverable minor fault
– RED: Power monitor has detected a non-recoverable major fault
• Network Status
– OFF: No control power
– Flashing GREEN/RED: Self-test
– Flashing GREEN: No CIP connection
– Solid GREEN: CIP connection established
– Flashing RED: CIP connection timed out
– Solid RED: Duplicate address detected
3. USB host port
USB standard A receptacle. Not used in this model.
4. USB device port
The USB device port is a USB Mini-B receptacle that accepts standard USB Mini-B plugs, for connection to a host device,
such as a notebook computer.
5. Configuration Lock switch
When enabled, this switch prevents changes in configuration that can affect revenue accuracy.
Rockwell Automation Publication 1426-UM001G-EN-P - November 2014
13
Chapter 1
PowerMonitor 5000 Unit Overview
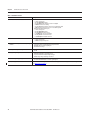
Table 1 - Hardware Features
Feature
Description
6. Device and Network status indicators
• Device status
– OFF: No control power
– Flashing GREEN/RED: Self-test
– Flashing GREEN: Power monitor has not been configured
– GREEN: Power monitor is running
– Flashing RED: Power monitor has detected a recoverable minor fault
– RED: Power monitor has detected a non-recoverable major fault
• Network status (Native Ethernet port)
– OFF: No control power
– Flashing GREEN/RED: Self-test
– Flashing GREEN: No CIP connection
– Solid GREEN: CIP connection established
– Flashing RED: CIP connection timed out
– Solid RED: Duplicate IP address detected
7. Power
• Power status
– OFF: No control power
– GREEN: Control power is present
8. Status input, KYZ output, and control relay wiring
terminals
•
•
•
•
9. Control power and ground wiring terminals
• 120…240V AC, 50/60 Hz or 120…240V DC
• 24V DC
10.Voltage sensing wiring terminals
•
•
•
•
11.Current sensing wiring openings
• Nominal input current 5 A
• Use current transformers (CTs) to connect to power system
12.Virtual wiring correction indicator
Indicates that a virtual wiring correction command has been applied to resolve wiring errors without rewiring.
See Wiring Correction on page 61.
14
Four internally-powered (24V DC) status inputs
Status input 2 can be used for demand period synchronization
KYZ DPDT solid-state relay for signaling use
Three DPDT control relays
Direct connect to up to 690V AC 3-phase line to line
Maximum nominal line to ground voltage 690
Use potential transformers (PTs) for higher voltages
Neutral voltage and ground voltage connections
Rockwell Automation Publication 1426-UM001G-EN-P - November 2014
PowerMonitor 5000 Unit Overview
Chapter 1
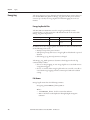
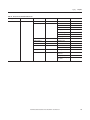
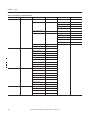
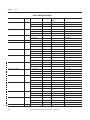
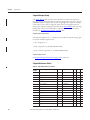
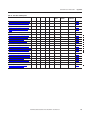
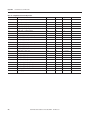
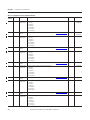
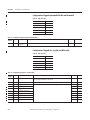
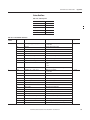
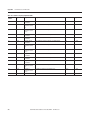
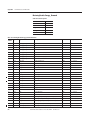
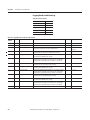
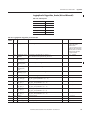
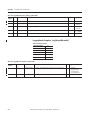
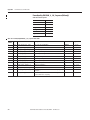
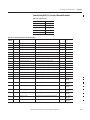
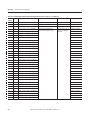
Functionality
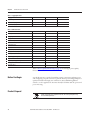
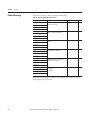
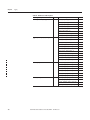
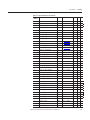
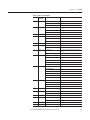
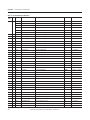
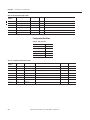
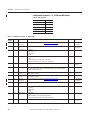
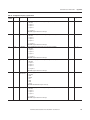
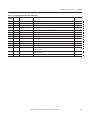
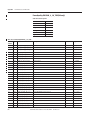
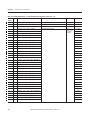
Table 2 - PowerMonitor 5000 Unit Functions
Measured Parameters
1426-M5
1426-M6
1426-M8
Voltage, L-L and L-N
•
•
•
Current, per phase and total
•
•
•
Frequency, last cycle and average
•
•
•
Voltage unbalance
•
•
•
Current unbalance
•
•
•
Real power, kW
•
•
•
Symmetrical Component Analysis
•
•
•
Reactive power, kVAR
•
•
•
Apparent power, kVA
•
•
•
True power factor, per phase and total
•
•
•
Displacement power factor, per phase and total
•
•
•
Reactive energy, kVARh
•
•
•
Real energy, kWh
•
•
•
Apparent energy, kVAh
•
•
•
Real power demand, kW
•
•
•
Reactive power demand, kVAR
•
•
•
Apparent power demand, kVA
•
•
•
Projected kW demand
•
•
•
Projected kVAR demand
•
•
•
Projected kVA demand
•
•
•
Demand power factor
•
•
•
Crest factor, V-V, V-N, and I, per phase
•
•
•
EN 61000-4-30 10/12 cycle metering
•
\
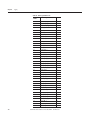
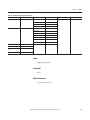
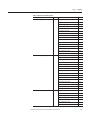
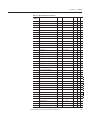
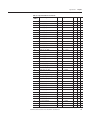
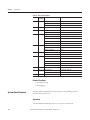
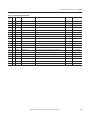
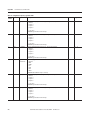
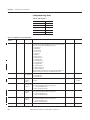
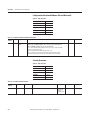
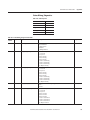
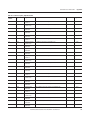
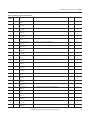
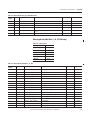
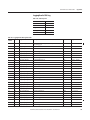
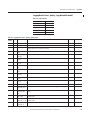
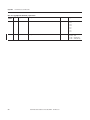
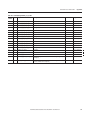
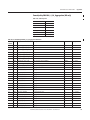
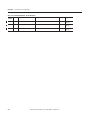
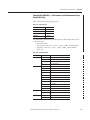
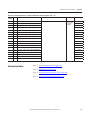
Table 3 - Logging Functions
Logging Function
1426-M5
1426-M6
1428-M8
Energy log
•
•
•
Data log
•
•
•
Min/max log
•
•
•
Load factor log
•
•
•
Time of use log
•
•
•
Event log
•
•
•
Setpoint log
•
•
•
Alarm log
•
•
•
Power Quality log
•
•
Waveform log
•
•
Trigger Data log
•
•
Rockwell Automation Publication 1426-UM001G-EN-P - November 2014
15
Chapter 1
PowerMonitor 5000 Unit Overview
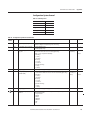
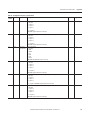
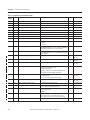
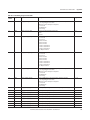
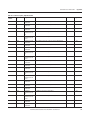
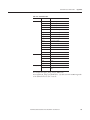
Table 3 - Logging Functions
Logging Function
1426-M5
Snapshot log
1426-M6
1428-M8
•
•
EN 50160 weekly log
•
EN 50160 yearly log
•
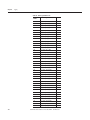
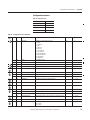
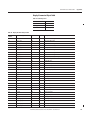
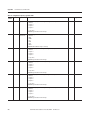
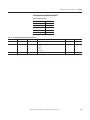
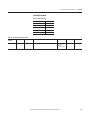
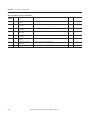
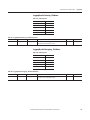
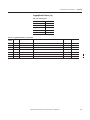
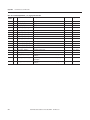
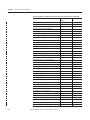
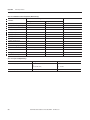
Table 4 - Other Functions
Function
1426-M5
1426-M6
1426-M8
Security
•
•
•
Wiring diagnostics
•
•
•
Wiring correction
•
•
•
Network time synchronization
•
•
•
Network demand synchronization
•
•
•
Configuration lock
•
•
•
IEEE 1588 Precision Time Protocol
•
•
•
•
•
Waveform synchronization broadcast (WSB)
Relay (3) and KYZ (1) outputs
•
•
•
Status inputs (4)
•
•
•
Setpoint programming
•
•
•
Sag and swell detection
•
Logical setpoint programming
•
•
•
•
Web page
•
•
•
CIP energy object
•
•
•
Refer to Power Quality Monitoring on page 79 for a listing of power quality
functions.
Before You Begin
Use this document as a guide for installing, wiring, connecting, applying power,
and configuring your power monitor to provide electric power, energy, and power
quality information through your web browser, FactoryTalk EnergyMetrix
software, or other applications. You must already be familiar with AC power and
power metering.
Product Disposal
At the end of its life, this equipment must be collected separately from any
unsorted municipal waste.
16
Rockwell Automation Publication 1426-UM001G-EN-P - November 2014
Chapter
2
Install the PowerMonitor 5000 Unit
Only qualified personnel can install, wire, service, and maintain this equipment.
Refer to and follow the safety guidelines and pay attention to all warnings and
notices in these instructions.
ATTENTION: Electrostatic discharge can damage integrated circuits or
semiconductors. Follow these guidelines when you handle the module:
• Touch a grounded object to discharge static potential.
• Wear an approved wrist strap grounding device.
• Do not open the module or attempt to service internal components.
• Use a static safe work station, if available.
• Keep the module in its static shield bag when not in use.
Mounting Considerations
Mount the PowerMonitor 5000 unit in a suitable protective enclosure. Select an
enclosure that protects the unit from atmospheric contaminants, such as oil,
water, moisture, dust, corrosive vapors, and other harmful airborne substances.
Make sure the enclosure protects against personal contact with energized circuits.
The ambient temperature within the enclosure must remain within the limits
listed in Appendix B, Technical Specifications. Select an enclosure that provides
adequate clearance for ventilation and wiring for the power monitor and other
equipment to be installed within the enclosure.
See PowerMonitor 5000 Unit Dimensions on page 18 for dimensions and
spacing guidelines for the power monitor.
When installed within a substation or switchgear lineup, we recommend that the
power monitor be mounted within a low-voltage cubicle, isolated from medium
and high-voltage circuits. Be sure that the mounting panel is properly connected
to a low-impedance earth ground.
Mount the enclosure in a position that allows full access to the unit. Install the
unit with the ventilation slots in the bottom and top of the unit unobstructed to
assure adequate free convection cooling of its internal electronic components.
Rockwell Automation Publication 1426-UM001G-EN-P - November 2014
17
Chapter 2
Install the PowerMonitor 5000 Unit
IMPORTANT
Use caution not to block the ventilation slots of the power monitor. All wiring,
wire ways, enclosure components, and other obstructions must be a minimum
of 50 mm (2.0 in.) from the top and bottom of the unit to provide ventilation
and electrical isolation. Units can be mounted side-by-side.
Note that access to the USB device port is required for initial configuration of
the power monitor and can be required for eventual administration and
maintenance. Consider safe and convenient access to the power monitor front
panel when planning the installation location.
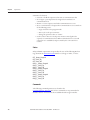
PowerMonitor 5000 Unit Dimensions
185
7 . 29
132
5 . 23
25
1 . 00
Mounting Hole Tolerance:
±0.4 mm (0.016 in.)
Dimensions are in mm/in.
Depth: 178/7.0
Module
status
Network
status
USB
Device
Config Lock
USB
Host
Virtual Wiring
Correction
Power
PowerMonitor 5000
---- S1
Y
K
Rx O
Rx com
Internal
24 VDC
Sn
I1
Z
Rx C
V1
EtherNet/IP
S2
LNK
ACT
---- S3
S4
Scom
---- S com
V2
132 124 118
5 . 20 4 . 88 4 . 65
---- K
Y
C O M M U N IC A T IO N P O R T
---- Z
R1 O
L1
V3
---- R1 com
R1 C
---- R2 O
R2 com
I3
L2
GND
VN
---- R2 C
R3 O
---- R3 com
24V
R3 C
com
3 .3
0 . 13
18
I2
S com
Rockwell Automation Publication 1426-UM001G-EN-P - November 2014
VG
I4
Install the PowerMonitor 5000 Unit
Chapter 2
Mounting Orientation Options
We recommend that you mount the power monitor to a vertical panel with the
ventilation slots at the top and bottom. You can also mount the unit on a
horizontal surface, however, the maximum ambient operating temperature in this
orientation is 60 °C (140 °F). Do not mount the unit with the ventilation slots at
the side. Refer to the figure below.
Panel Mounting
Follow these steps for panel mounting a PowerMonitor 5000 unit.
1. Use the power monitor as a template and mark pilot holes on your panel.
2. Drill pilot holes for M4 or #8 screws.
ATTENTION: During mounting of all devices, make sure that all debris (such as
metal chips or wire strands) is kept from falling into the power monitor. Debris
that falls into the module could cause damage when the device is energized.
3. Use M4 or #8 screws to mount the power monitor to your panel and
tighten to 1.16 N•m (10 lb•in).
4. Ground the power monitor on a ground bus with a low-impedance earth
ground connection.
5. Connect the ground bus to a functional earth ground on the panel.
IMPORTANT
The upper mounting slots are equipped with protective conductor terminals,
that must make metal-to-metal contact with the grounded mounting panel.
Rockwell Automation Publication 1426-UM001G-EN-P - November 2014
19
Chapter 2
Install the PowerMonitor 5000 Unit
Wire the PowerMonitor 5000
Unit
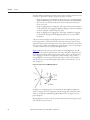
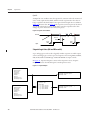
The PowerMonitor 5000 unit is equipped with screw terminals with pressure
plates and finger protection for the control power, I/O wiring, and voltage
connections. The I/O wiring block is removable.
Current sensing conductors are routed through openings in the power monitor
housing.
Figure 2 - Terminal Block Layout
V1
---- S1
S2
---- S3
S4
---- S com
V2
S com
---- K
Y
---- Z
L1
R1 O
---- R1 com
V3
L2
R1 C
---- R2 O
GND
R2 com
VN
---- R2 C
R3 O
24V
---- R3 com
R3 C
com
VG
Wire Requirements
Wiring Category
Control Power
Input/Output (I/O)
Wire Type
Wire Size Range
Wires per Terminal
Recommended Torque
Cu - 75 °C (167 °F)
0.25…2.5 mm2 (22…14 AWG)
2 max
1.27 N•m (11.24 lb•in)
0.5…0.8 mm2 (20…18 AWG)
0.68 N•m (6 lb•in)
2 (18…14 AWG)
Voltage Sensing
0.75…2.5 mm
Current Sensing
4 mm2 max (12 AWG max)
1.50 N•m (13.3 lb•in)
1 max
N/A
Grounding
This product is intended to be mounted to a well-grounded mounting surface,
such as a metal panel. The upper mounting slots are equipped with protective
conductor terminals, which must make metal-to-metal contact with the
mounting panel. In solid-state systems, grounding helps limit the effects of noise
due to electromagnetic interference (EMI).
Connect a 2.5 mm2 (14 AWG) wire from the GND terminal of the
PowerMonitor 5000 unit to the ground bus or other low-impedance earth
ground prior to connecting the control power or any other connections.
20
Rockwell Automation Publication 1426-UM001G-EN-P - November 2014
Install the PowerMonitor 5000 Unit
Chapter 2
You must ground voltage and current sensing circuits to limit the maximum
voltage to ground for safety. Ground CT secondary circuits at either the CT or
the shorting terminal block. All grounds must be made to a common ground bus
or terminal.
Refer to the Industrial Automation Wiring and Grounding Guidelines,
publication 1770-4.1, for additional information.
Wiring Accessory Kit
The power monitor accessory kit simplifies the installation of a
PowerMonitor 5000 unit by making all the required installation accessories
available in one catalog number, 1400-PM-ACC. The accessory kit includes
three10 A fuses and blocks for protecting voltage sensing wiring, a 1 A fuse and
block for control wiring protection, and an 8-pole shorting terminal block for
CT wiring. Please contact your local Allen-Bradley distributor or Rockwell
Automation sales representative for more information.
Voltage and Current Sensing Connections
The PowerMonitor 5000 unit is capable of monitoring a variety of three-phase,
single-phase, and split-phase circuits. The voltage sensing connections, current
sensing wiring, and metering mode need to be selected to match the
configuration of the circuit being monitored.
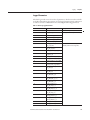
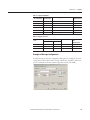
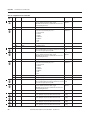
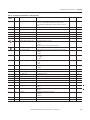
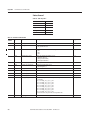
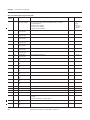
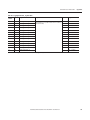
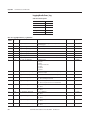
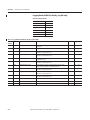
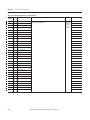
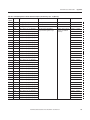
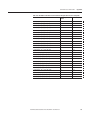
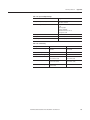
Table 5 provides a key to selecting the proper wiring diagrams and metering
modes.
Table 5 - Selecting Wiring Diagrams and Metering Modes
Circuit Type
Line - Line Voltage
No. of CTs
No. of PTs
Voltage Sensing
Current Sensing
Metering_Mode
3-phase, 4-wire Wye
≤690 V
3
-
Diagram V1
Diagram I3
Wye
Diagram I2
Delta 2 CT
Diagram I3
Delta 3 CT
Open Delta 2 CT
> 690 V
3
Diagram V3
3-phase, 3-wire
grounded Wye
≤690 V
-
Diagram V2
> 690 V
3
Diagram V5
3-phase, 4-wire
impedance grounded
Wye
≤690 V
-
Diagram V1
> 690 V
3 L-N
Diagram V3
3 L-N, 1 N-G
Diagram V4
-
Diagram V2
3-phase, 3-wire Delta
or ungrounded Wye
≤690 V
2
3
2(2)
Diagram V6
Diagram I2
Diagram I3
Open Delta 3 CT
Diagram I1
Split-phase
> 690 V
2
≤690 V
2/1
-
Diagram V7
> 690 V
2/1
2/1
Diagram V8
3
Split-phase
Rockwell Automation Publication 1426-UM001G-EN-P - November 2014
21
Chapter 2
Install the PowerMonitor 5000 Unit
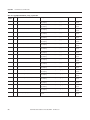
Table 5 - Selecting Wiring Diagrams and Metering Modes
Circuit Type
Line - Line Voltage
No. of CTs
No. of PTs
Voltage Sensing
Current Sensing
Metering_Mode
3-phase, 3-wire Delta,
Grounded B Phase(1)
≤690 V
2
-
Diagram V9
Diagram I2
Delta Grd B Ph 2 CT
3
-
Diagram I3
Delta Grd B Ph 3 CT
3-phase, 4-wire highleg(1) (wildcat)
≤690 V
3
-
Diagram V10
Diagram I3
Delta High Leg
Single phase
≤690 V
1
-
Diagram V11
Diagram I4
Single phase
> 690 V
1
1
Diagram V12
-
-
-
-
-
Demo
For demo use
(1) Delta Grounded B Phase and Delta High-Leg are not supported above 690 V L-L. Use the 3-phase, 3-wire Delta circuit type.
(2) 2 PTs used in open-delta configuration.
Voltage Sensing
Circuits rated up to 690V AC line-to-line can be connected directly. Higher
voltages require potential transformers (PTs), also known as voltage transformers
(VTs), to step the voltage down.
Wiring must conform to all applicable codes and standards. In particular, suitable
overcurrent protection must be provided by the user, with current and
interrupting ratings selected to protect the wiring.
Pay particular attention to correct phasing and polarity of voltage connections.
The diagrams use the ‘dot’ convention to indicate transformer polarity. The dot
indicates the H1 and X1 terminals on the high side and low side of the
transformer respectively.
When wiring a PowerMonitor 5000 unit to existing PTs and metering devices,
the voltage sensing terminals of the PowerMonitor 5000 unit must be connected
in parallel with the voltage sensing terminals of the existing metering devices.
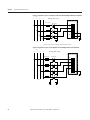
The following wiring diagrams indicate typical voltage sensing connections to
various types of power systems.
22
Rockwell Automation Publication 1426-UM001G-EN-P - November 2014
Install the PowerMonitor 5000 Unit
Chapter 2
Figure 3 - Diagram V1 - 3-phase, 4-wire Wye, (690V AC line-to-line maximum)
Line
L1
L2
L3
N
Metering_Mode = Wye
PowerMonitor 5000
Fuses (by user)
V1
V2
V3
(1)
VN
VG
Load
(1) Fuse in neutral connection is required for impedance grounded systems.
Ground
Figure 4 - Diagram V2 - 3-phase, 3-wire Grounded Wye, or 3-phase, 3-wire Delta (690V AC line-toline maximum)
Line
L1
L2
L3
Metering_Mode = Wye,
Delta 2 CT or Delta 3 CT,
as applicable
PowerMonitor 5000
Fuses (by user)
V1
V2
V3
VN
VG
Load
Rockwell Automation Publication 1426-UM001G-EN-P - November 2014
Ground
23
Chapter 2
Install the PowerMonitor 5000 Unit
Figure 5 - Diagram V3 - 3-phase, 4-wire Wye or Impedance Grounded Wye with PTs (no neutral PT)
Line
L1
L2
L3
Metering_Mode = Wye
N
PowerMonitor 5000
Fuses (by user)
PTs (by user)
V1
V2
V3
VN
VG
(1)
Ground
Load
Ground
(1) Fuse in neutral connection is required for impedance grounded systems.
Figure 6 - Diagram V4 - 3-phase, 4-wire Impedance Grounded Wye with Line and Neutral PTs
Line
L1
L2
L3
Metering_Mode = Wye
N
PowerMonitor 5000
Fuses (by user)
PTs (by user)
V1
V2
V3
VN
VG
Ground
Load
Ground
24
Ground
Rockwell Automation Publication 1426-UM001G-EN-P - November 2014
Install the PowerMonitor 5000 Unit
Chapter 2
Figure 7 - Diagram V5 -3-phase, 3-wire Grounded Wye with PTs
Line
L1
L2
L3
Metering_Mode = Wye
Fuses (by user)
PowerMonitor 5000
PTs (by user)
V1
V2
V3
VN
VG
Ground
Load
Ground
Ground
Figure 8 - Diagram V6 - 3-phase, 3-wire Open Delta with Two PTs
Line
L1
L2
L3
Metering_Mode = Open Delta 2 CT
or Open Delta 3 CT, as applicable
Fuses (by user)
PowerMonitor 5000
PTs (by user)
V1
V2
V3
VN
VG
Ground
Ground
Load
Rockwell Automation Publication 1426-UM001G-EN-P - November 2014
25
Chapter 2
Install the PowerMonitor 5000 Unit
Figure 9 - Diagram V7 - Split-phase (690V AC line-to-line maximum)
Line
L1
L2
L3
N
Metering_Mode = Split-phase
PowerMonitor 5000
Fuses (by user)
V1
V2
V3
VN
VG
Load
Ground
Figure 10 - Diagram V8 - Split-phase with PTs
Line
L1
L2
N
Metering_Mode = Split-phase
PowerMonitor 5000
Fuses (by user) PTs (by user)
V1
V2
V3
VN
VG
Ground
Ground
Load
26
Rockwell Automation Publication 1426-UM001G-EN-P - November 2014
Install the PowerMonitor 5000 Unit
Chapter 2
Figure 11 - Diagram V9 - 3-phase, 3-wire Grounded B-phase (690V AC line-to-line maximum)
Metering_Mode = Delta Grd B Ph 2 CT
Line
or Delta Grd B Ph 3 CT, as applicable
L1
L2
L3
PowerMonitor 5000
Fuses (by user)
V1
Distribution
Ground
(1)
V2
V3
VN
VG
Load
Ground
(1) You can also connect V2 to L2. In this case, omit the connection from V2 to VN.
Figure 12 - Diagram V10 - 3-phase, 4-wire High-leg Delta (690V AC line-to-line maximum)
High-leg
Transformer
(by user)
B
N
A
C
Metering_Mode = Delta High-leg
PowerMonitor 5000
L1
L2
L3
N
Fuses (by user)
V1
V2
V3
VN
VG
Load
Ground
Rockwell Automation Publication 1426-UM001G-EN-P - November 2014
27
Chapter 2
Install the PowerMonitor 5000 Unit
Figure 13 - Diagram V11 - Single-phase (690V AC line-to-line maximum)
Line
L1
L2
Voltage Mode = Single-phase
PowerMonitor 5000
Fuses (by user)
V1
V2
V3
VN
VG
Load
Ground
Figure 14 - Diagram V12 - Single-phase with PTs
Line
L1
L2
Voltage Mode = Single-phase
PowerMonitor 5000
Fuses (by user) PTs (by user)
V1
V2
V3
VN
VG
Ground
Load
28
Rockwell Automation Publication 1426-UM001G-EN-P - November 2014
Install the PowerMonitor 5000 Unit
Chapter 2
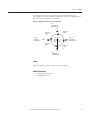
Current Sensing
Route the CT secondary wiring through the openings in the
PowerMonitor 5000 unit as shown.
I1
I2
I3
I4
X1
X2
To shorting terminal block
and current transformer (CT).
Use a shorting terminal block (included in the 1400-PM-ACC accessory kit),
test block, or shorting switch (by user) for CT wiring to permit safely servicing
connected equipment such as the PowerMonitor 5000 unit without deenergizing the power system.
Use 2.5 mm2 (14 AWG) or 3.3 mm2 (12 AWG) (maximum) wiring between the
PowerMonitor 5000 unit and the shorting block. Use 2.5 mm2 (14 AWG) or
larger wire between the shorting block and the CTs, depending on the length of
the circuit. Longer circuits require larger wire so that the wiring burden does not
exceed the CT burden rating and reduce system accuracy. Note that the diameter
of the current sensing wiring openings is 7 mm (0.27 in.).
IMPORTANT
Ring lugs are recommended for making CT secondary connections. Standard
ring lugs do not pass through the current sensing openings of the
PowerMonitor 5000 unit. We recommend that the installer pass the wire from
the shorting terminal block through the current sensing opening before
crimping on ring lugs.
When wiring a PowerMonitor 5000 unit to existing CTs and metering devices,
current sensing circuits of the PowerMonitor 5000 unit must be wired in series
with the CT secondary and current sensing circuits of the existing metering
devices.
Do not install overcurrent protection or non-shorting disconnecting means in
CT secondary wiring. Connect the current sensing circuit to a low-impedance
earth ground at only one point.
Rockwell Automation Publication 1426-UM001G-EN-P - November 2014
29
Chapter 2
Install the PowerMonitor 5000 Unit
Pay particular attention to the correct phasing and polarity of current sensing
connections. The diagrams use the ‘dot’ convention to indicate transformer
polarity. The dot indicates the H1 and X1 terminals on the primary and
secondary of the CT respectively. Phasing of the CTs must correspond to the
phasing of the voltage sensing connections.
The following wiring diagrams indicate typical current sensing connections to
various types of power systems.
Figure 15 - Diagram I1 - Split-phase, 2 CTs
Line
L2
L1
N
(if used)
Metering_Mode = Split-phase
Shorting Terminal
Block (by user)
PowerMonitor 5000
CTs (by user)
CT1
I1
X1
CT2
I2
X1
I3
X1
CTN
(if used)
I4
X1
Load
Ground
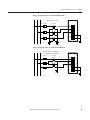
Figure 16 - Diagram I2 - 3-phase, 3-wire, 2 CTs
Line
Metering_Mode = Delta 2 CT, Open Delta 2 CT,
L1
L2 L3
or Delta Grd B Ph 2 CT, as applicable
Shorting Terminal
Block (by user)
PowerMonitor 5000
CTs (by user)
CT1
I1
X1
I2
X1
CT3
I3
X1
2 CTs Can Be Used Only
On 3-wire Systems
I4
X1
Load
30
Ground
Rockwell Automation Publication 1426-UM001G-EN-P - November 2014
Install the PowerMonitor 5000 Unit
Chapter 2
Figure 17 - Diagram I3 - 3-phase, 3- or 4-wire, 3 CTs
Metering_Mode = Wye, Delta 3 CT, Open Delta 3 CT,
Delta Grd B Ph 3 CT, or Delta High-leg, as applicable
Line
L1
L2
N
L3 (if used)
Shorting Terminal
Block (by user)
PowerMonitor 5000
CTs (by user)
CT1
I1
X1
CT2
I2
X1
CT3
I3
X1
CT4
(if
used)
Load
I4
X1
Ground
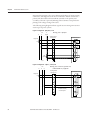
Figure 18 - Diagram I4 - Single phase, 1 CT
L1
Line
L2
Voltage Mode = Single-phase
Shorting Terminal
Block (by user)
PowerMonitor 5000
CT (by user)
CT1
I1
X1
Load
Ground
Rockwell Automation Publication 1426-UM001G-EN-P - November 2014
31
Chapter 2
Install the PowerMonitor 5000 Unit
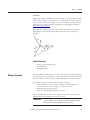
Status Inputs
Up to four dry (non-powered) contacts can be connected to the
PowerMonitor 5000 unit status inputs. The status input derives 24V DC power
from its internal power supply.
Connect status inputs by using shielded, twisted-pair cable with the shield
connected to the ground bus or other low-impedance earth ground at the contact
end only. The diagram indicates typical status input wiring.
Figure 19 - Status Inputs
PowerMonitor 5000
Contact 1
S1
Contact 2
S2
S3
S4
Ground
Scom
Contact 3
Scom
Contact 4
Ground
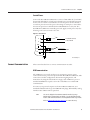
KYZ and Relay Outputs
The KYZ solid-state relay output can be connected to an external pulse
accumulator or controller. Relay outputs can be used for control of loads,
switching of circuit breakers, signaling, and other applications. Wetting voltage
must be provided by the external device or circuit. The KYZ output is designed
for low-current switching. The diagram indicates typical KYZ and relay output
wiring.
Figure 20 - KYZ and Relay Outputs
Z
(N.C.)
K
(COM)
Y
(N.O.)
IN 1
(+ )
PowerMonitor 5000
(equivalent circuit)
(N.C.)
Rn C
Wetting Power
Supply
Max 240V AC/DC
(by user)
COM
Pulse Accumulator
or Controller
(by user)
Rn com
(COM)
(N.O.)
Rn O
T1
(+ )
PowerMonitor 5000
(typical for R1, R2, and R3)
32
(-)
(-)
Wetting Power
Supply
Max 240V AC/DC
(by user)
Rockwell Automation Publication 1426-UM001G-EN-P - November 2014
T2
Controlled Load
(by user)
Install the PowerMonitor 5000 Unit
Chapter 2
Control Power
Connect the PowerMonitor 5000 unit to a source of 120/240V AC (or 24V DC,
shown with dashed lines) control power through a user-provided disconnecting
means, such as a switch or circuit breaker close to the power monitor. Provide
overcurrent protection sized to protect the wiring, for example, a 5 A rated fuse.
Overcurrent protection is included in the 1400-PM-ACC accessory kit. The
PowerMonitor 5000 unit is internally protected. Apply control power only after
all wiring connections are made to the unit.
Figure 21 - Control Power
*
*
L1
120/240V AC 50/60 Hz,
or 120/ 240V DC
L2
GND
*
*
24V
24V DC
com
Ground
Connect Communication
* Provided by user.
This section describes how to connect communication networks.
USB Communication
The USB Device port can be used to set-up a temporary, point-to-point
connection between a personal computer and the PowerMonitor 5000 unit. This
connection is used for configuration, data monitoring, diagnostics, and
maintenance by using the unit's built-in web pages. The USB Device port is a
standard USB Mini-B receptacle. You need to install drivers to enable USB
communication.
To connect your personal computer to the PowerMonitor 5000 unit, use a
standard USB cable with a Type-A and Mini-B male plugs, Allen-Bradley catalog
number 2711C-CBL-UU02 or equivalent.
TIP
You can also display the PowerMonitor 5000 web interface by using a
PanelView Plus 6 terminal with a 2711P-RP9_ logic module with extended
features. USB communication drivers are already installed in the logic module.
Refer to Configure the Connection on page 36 to continue the setup.
Rockwell Automation Publication 1426-UM001G-EN-P - November 2014
33
Chapter 2
Install the PowerMonitor 5000 Unit
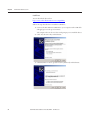
Install Drivers
You can download drivers from
http://www.rockwellautomation.com/compatibility.
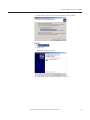
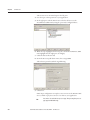
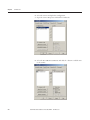
Follow the steps listed below to install the USB driver.
1. Connect the PowerMonitor 5000 unit to your computer with a USB cable
and apply power to the power monitor.
The computer detects the new device and prompts you to install the driver.
2. Click ‘Yes, this time only’ and click Next.
3. Click Install from a list or specific location (Advanced) and click Next.
34
Rockwell Automation Publication 1426-UM001G-EN-P - November 2014
Install the PowerMonitor 5000 Unit
Chapter 2
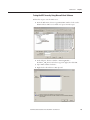
4. Click Browse and select the folder containing the driver .inf file.
5. Click Next.
Wait while the driver installs.
6. Click Finish when the driver installation is complete.
Rockwell Automation Publication 1426-UM001G-EN-P - November 2014
35
Chapter 2
Install the PowerMonitor 5000 Unit
Configure the Connection
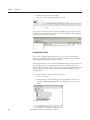
Follow these steps to configure the connection.
1. From the Windows desktop, choose Start > Settings > Network
Connections.
A new Local Area Connection with a Device Name ‘Remote NDIS based
Device’ was added when you installed the driver.
2. Right-click the connection name and choose Properties.
TIP
36
Setting up a PanelView 6 terminal in Windows CE follows a similar process.
Please refer to the Rockwell Automation Knowledgebase answer ID 115608 or
455067 if you need further details.
Rockwell Automation Publication 1426-UM001G-EN-P - November 2014
Install the PowerMonitor 5000 Unit
Chapter 2
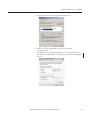
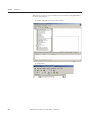
3. Select Internet Protocol (TCP/IP) and click Properties.
4. Click Use the following IP address and type in the address
192.168.169.100.
The default subnet mask 255.255.255.0 is correct. The IP address of the
PowerMonitor 5000 USB port is 192.168.169.3 and cannot be changed by
the user.
Rockwell Automation Publication 1426-UM001G-EN-P - November 2014
37
Chapter 2
Install the PowerMonitor 5000 Unit
Browse the PowerMonitor 5000 Web Page by Using the USB Connection
Open the Internet Explorer browser on the computer and browse to the url
http://192.168.169.3.
The PowerMonitor 5000 web page displays in your browser.
By default the security setting of the power monitor's webpage is disabled.
38
Rockwell Automation Publication 1426-UM001G-EN-P - November 2014
Install the PowerMonitor 5000 Unit
Chapter 2
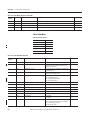
Native Ethernet Communication
The PowerMonitor 5000 unit connects easily to industry-standard Ethernet hubs
and switches by using standard CAT-5 UTP (unshielded twisted-pair) cables
with RJ45 connectors. The table below shows the cable and connector pin
assignments.
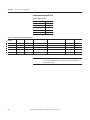
Table 6 - Cable and Connector Pin Assignments
Terminal
Signal
Function
1
TX+
TX+
2
TX-
TX-
3
RX+
RX+
RX-
RX-
4
5
6
7
8
Typical Ethernet connections are shown in the diagram below.
Figure 22 - Typical Ethernet Connections
Ethernet Switch
Uplink to LAN
PowerMonitor 5000 Unit
Module
status
Network
status
USB
Device
Config Lock
USB
Host
Virtual Wiring
Correction
Power
PowerMonitor 5000
---- S1
Y
K
Rx O
Rx com
Module
status
Network
status
USB
Device
Config Lock
I1
Z
Rx C
PowerMonitor 5000 Unit
USB
Host
V1
S4
Sn
LNK
---- S3
---- S com
ACT
Scom
V2
I2
S com
---- K
S4
L1
V3
---- R1 com
R1 C
---- R2 O
R2 com
I3
L2
GND
VN
---- R2 C
R3 O
---- R3 com
Rx O
Rx com
Internal
24 VDC
Sn
I1
Z
Rx C
V1
Scom
V2
I2
S com
Y
---- Z
R1 O
K
---- K
Y
---- Z
24V
R3 C
com
VG
I4
Rockwell Automation Publication 1426-UM001G-EN-P - November 2014
C O M M U N IC A T IO N P O R T
C O M M U N IC A T IO N P O R T
---- S1
Y
S2
Internal
24 VDC
√IP
---- S com
ACT
PowerMonitor 5000
EtherNet
√IP
---- S3
EtherNet
S2
LNK
Virtual Wiring
Correction
Power
R1 O
L1
V3
---- R1 com
R1 C
---- R2 O
R2 com
I3
L2
GND
VN
---- R2 C
R3 O
---- R3 com
24V
R3 C
com
VG
I4
39
Chapter 2
Install the PowerMonitor 5000 Unit
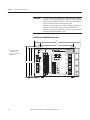
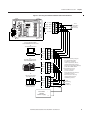
Optional DeviceNet Network Communication
An optional DeviceNet port can be factory-installed in PowerMonitor 5000
units with a catalog number ending in -DNT, and can also be purchased from
Rockwell Automation and installed by the user.
ATTENTION: Power must be removed from the power monitor before inserting
or removing an optional communication card. Inserting or removing an
optional communication card under power can damage the card or the power
monitor.
For information on installing the optional communication card, see the
PowerMonitor 5000 Optional Communication Modules Installation
Instructions, publication 1426-IN002.
For detailed DeviceNet system installation information, including cable lengths,
the placement of terminating resistors, power supplies, and other media
components, refer to the DeviceNet Cable System Planning and Installation
Manual, publication DNET-UM072.
Install suitable terminating resistors at the ends of the DeviceNet cable.
IMPORTANT
You must install and wire a suitable 24V DC power supply to the V+ and Vconductors in the DeviceNet cable. The power monitor consumes less than
50 mA from the DeviceNet 24V DC supply.
Configuration options for optional DeviceNet communication include the node
address (MAC ID) and data rate. Defaults are node 63 and 125 Kbps.
Table 7 - DeviceNet Terminal Block Wiring Connections
Terminal
Signal
Function
Color
5
VDC+ (V+)
Power Supply
Red
4
CAN_H
Signal High
White
3
SHIELD
Shield
Uninsulated
2
CAN_L
Signal Low
Blue
1
COM (V-)
Common
Black
IMPORTANT
40
Terminal numbers are listed as they appear on the connector.
Rockwell Automation Publication 1426-UM001G-EN-P - November 2014
Install the PowerMonitor 5000 Unit
Chapter 2
Figure 23 - Connecting a PowerMonitor 5000 Unit to Other DeviceNet Devices
USB
Host
Virtual Wiring
Correction
Power
PowerMonitor 5000
Y
---- S1
K
Rx com
Rx C
Internal
24VDC
Sn
Scom
V+ - Red
I1
Z
Rx O
V1
CAN_H - White
EtherNet √IP
S2
LNK
ACT
---- S3
S4
---- S com
SHLD - Bare
I2
V2
S com
---- K
NS
Y
---- Z
R1 O
L1
CAN_L - Blue
V3
---- R1 com
DeviceNet
5
4
3
2
1
I3
L2
R1 C
---- R2 O
R2 com
GND
V- - Black
5 4 3 2 1
Module
status
Network
status
USB
Device
Config Lock
121 Ω
Terminating
Resistor
(See Note 2)
VN
---- R2 C
R3 O
---- R3 com
24V
R3 C
VG
I4
DS
com
Personal Computer With
1784-PCDPCMCIA Interface Card
Or
1770-KFD Interface Box
V+
CAN_H
SHLD
CAN_L
Or
ControlLogix® Controller
With 1756-DNB Scanner
V1) Example network protrayed.
For detailed DeviceNet
installations, including
cable requirements, refer to
the DeviceNet Cable System
Planning and Installation Manual,
publication DNET-UM072.
2) Terminating resistors
must be connected
to each end of the
DeviceNet network. Omit the
terminating resistors
if the devices are already
equipped with internal
terminating resistors.
V+
CAN_H
SHLD
CAN_L
VOr
SLC™ Controller With
1747-SDN Scanner
V+
CAN_H
121
Terminating
Resistor
(see Note 2)
SHLD
CAN_L
Or Other DeviceNet
Scanner Devices
V-
DeviceNet
24V DC
Power Supply
+
Rockwell Automation Publication 1426-UM001G-EN-P - November 2014
41
Chapter 2
Install the PowerMonitor 5000 Unit
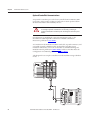
Optional ControlNet Communications
An optional ControlNet port can be factory-installed in PowerMonitor 5000
units with a catalog number ending in -CNT, and can also be purchased from
Rockwell Automation and installed by the user.
ATTENTION: Power must be removed from the power monitor before inserting
or removing an optional communication card. Inserting or removing an
optional communication card under power can damage the card or the power
monitor.
For information on installing the optional communication card, see the
PowerMonitor 5000 Optional Communication Modules Installation
Instructions, publication 1426-IN002.
A ControlNet media installation includes trunk cable, taps and terminators, and
can include optional redundant media. For detailed ControlNet system
installation information, refer to the ControlNet Coax Media Planning and
Installation Guide, publication CNET-IN002, and the ControlNet Network
Configuration User Manual, publication CNET-UM001.
This diagram shows a simple ControlNet network installation using redundant
media.
Config Lock
Module
status
Network
status
USB
Device
USB
Host
Virtual Wiring
Correction
Power
PowerMonitor 5000
---- S1
Y
K
Rx O
Rx com
Internal
24 VDC
Sn
I1
Z
Rx C
V1
ACT
√IP
LNK
---- S3
EtherNet
S2
---- S com
S4
Scom
V2
I2
S com
---- K
B
Y
---- Z
MS
ControlNet
R1 O
L1
R1 C
---- R2 O
R2 com
R3 O
com
A
VN
24V
R3 C
Rockwell Automation Publication 1426-UM001G-EN-P - November 2014
I3
L2
GND
---- R2 C
---- R3 com
42
V3
---- R1 com
VG
I4
Chapter
3
Setup and Commands
Although the PowerMonitor 5000 unit ships from the factory with default
settings, you need to configure it for your particular requirements. The
PowerMonitor 5000 unit provides a built-in Web interface for monitoring,
configuration, and commands through its native Ethernet communication port
and its USB device port. You perform initial configuration by using the power
monitor's built-in USB Web interface. Once initial setup is complete, you can
continue configuring the PowerMonitor 5000 unit by using its USB or network
Web interface, by using optional software, or by communicating with the power
monitor's data table.
This section describes how to use the USB and Ethernet Web interface for setup.
You can find information on configuring various functions of the
PowerMonitor 5000 unit in the following chapters:
• Chapter 4, Metering.
• Chapter 5 Power Quality Monitoring
• Chapter 6 Logging
• Chapter 7 Logic Functions
• Chapter 8 Other Functions
If you are using optional software, such as FactoryTalk EnergyMetrix software,
please refer to publication
FTEM-UM002, for information. If you are using data communication for setup,
refer to the Communication on page 187 for information.
Setup Using the Web
Interface
For initial setup, connect a personal computer to the PowerMonitor 5000 unit by
using a USB cable. Refer to USB Communication on page 33.
Initial setup is usually performed by using the USB Web interface and initial
security setup can be performed only by using the USB Web interface.
Rockwell Automation Publication 1426-UM001G-EN-P - November 2014
43
Chapter 3
Setup and Commands
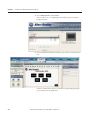
Open the Internet Explorer browser and browse to http://192.168.169.3. The
PowerMonitor 5000 home page displays in your browser as shown below. The
home page displays general information about the PowerMonitor 5000 unit. You
can navigate by clicking folders and pages from the tree on the left.
Initial setup by using the USB Web interface includes at least the following
configuration steps:
• Basic Metering - this aligns the power monitor metering functionality with
the properties of the circuit to which it connects
• Wiring Diagnostics and Wiring Correction (if needed) - this assesses the
wiring of the unit and makes corrections without changing the wiring
• Native Ethernet Network Communication - this permits access to the unit
for data monitoring and setup through an Ethernet network
• Optional Communication - this permits access to the unit for data
monitoring and setup through an optional communication card
• Date and Time - this sets the unit's internal clock so that time stamps in
logged data are correct
• Security (if desired) - enabling and configuring security guards against
unauthorized changes to the power monitor configuration
Once initial setup has been completed, including configuration of the Ethernet
IP address, you can also access the Web interface from a computer connected
through a network to the PowerMonitor 5000 unit’s native Ethernet port. Open
the Internet Explorer browser and browse to the IP address of the unit.
44
Rockwell Automation Publication 1426-UM001G-EN-P - November 2014
Setup and Commands
Chapter 3
Obtaining Access to the Configuration Pages
The PowerMonitor 5000 unit initially has security disabled by default. If your
power monitor's security is disabled, you can continue setting up the unit without
logging in.
If Security is Enabled
If security is enabled, the web page header displays ‘Logged in as:’ and a Log in
link.
If security is enabled, you need to log in as an administrator to configure setup
parameters. If not logged in as an administrator, you can view, but not change,
configuration parameters. If you need to log in, click the Log in link.
The USB connection has a special administrator account. Follow these steps to
log in with this account.
1. Type in the user name usbadmin.
2. Type in the password usbadmin.
3. Click Log In.
A dialog box reports the result.
To log in from the network Web interface, select a previously configured
administrator account user name and password. The PowerMonitor 5000 unit
does not permit logging in with the USB administrator login from the network.
You remain logged in until you log out or until 30 minutes have passed since
configuration changes have been applied.
Rockwell Automation Publication 1426-UM001G-EN-P - November 2014
45
Chapter 3
Setup and Commands
How to Set Up the PowerMonitor 5000 Unit
From any power monitor web page, click the Configuration folder. A list of
available configuration pages is displayed in the tree. The steps for entering,
editing, and applying configuration parameters are similar for each configuration
page. The configuration parameters and their properties are described in the
following chapters:
• Chapter 4, Metering.
• Chapter 5 Power Quality Monitoring
• Chapter 6 Logging
• Chapter 7 Logic Functions
• Chapter 8 Other Functions
The configuration pages contain text boxes for entering parameter values, pulldown menus for selecting enumerated parameter values, and an Apply Changes
button for committing changes to the power monitor. The power monitor
checks that parameter values are within their valid range before applying them. A
dialog box appears to report the success or reason for failure of an attempt to
apply new parameters.
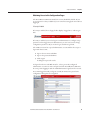
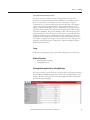
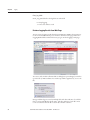
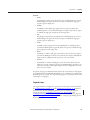
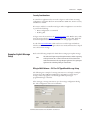
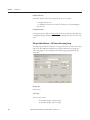
Basic Metering Setup
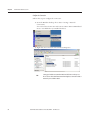
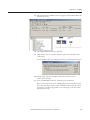
Follow these steps to configure the basic metering parameters.
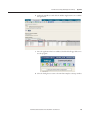
1. Click the Metering_Basic page under the open Configuration folder.
This page displays the existing basic metering configuration of the power
monitor, including the metering mode, PT (VT) and CT ratios, nominal
voltage and frequency, and demand.
You can select other configuration pages by clicking the desired page in the
tree, or by clicking the corresponding tab in the page.
2. To change the basic metering setup, enter the desired values into the text
boxes, scroll down, and click Apply Changes.
A dialog box appears to report the result of the setup change.
46
Rockwell Automation Publication 1426-UM001G-EN-P - November 2014
Setup and Commands
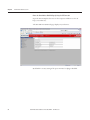
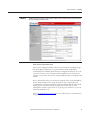
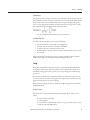
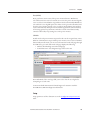
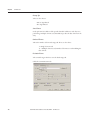
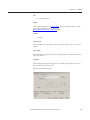
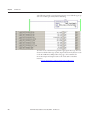
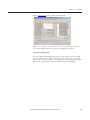
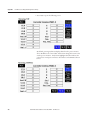
EXAMPLE
Chapter 3
This Metering_Basic page illustrates the setup for a 480V, 3-phase system with 1000:5 current transformer
(CT) ratios on all phases and the neutral.
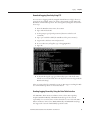
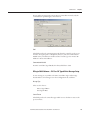
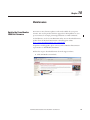
Native Ethernet Communication Setup
Choose the Configuration folder and choose the CommunicationsNative page.
The PowerMonitor 5000 unit is set up by default to obtain an IP address
automatically from a DHCP (Dynamic Host Configuration Protocol) server. If
your power monitor is on a network served by a DHCP server, and the power
monitor is connected to the network, it has probably already been assigned an IP
address.
We recommend that each power monitor be assigned a static, or fixed, IP address,
because DHCP addresses can change from time to time, resulting in loss of
communication with client applications. Obtain a fixed IP address, subnet mask,
default gateway, and other network setup parameters from your network
administrator. Another option can be to set up the power monitor as a reserved
client in the DHCP server.
Refer to Communication on page 187 for more information on communication
setup parameters.
Rockwell Automation Publication 1426-UM001G-EN-P - November 2014
47
Chapter 3
Setup and Commands
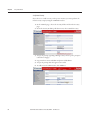
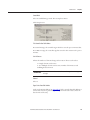
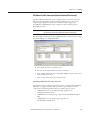
EXAMPLE
This example explains how to change from a DHCP-assigned to a static IP address.
The initial network configuration is shown below. The IP address assigned is 192.168.200.8. The network
administrator has provided a range of static IP addresses in the same subnet, beginning with
192.168.200.100. In this case, the default gateway and DNS servers remain the same for static or DHCPobtained addresses (verify if this is true in your case with your network administrator).
To change to the new address, from the IP_Address_Obtain pull-down menu choose Static, type in the new
IP address, and click Apply Changes.
IMPORTANT
48
You can change the network configuration from the USB or network web
pages. If you change the IP address from the network Web interface, you need
to browse to the new IP address to re-establish communication.
Rockwell Automation Publication 1426-UM001G-EN-P - November 2014
Setup and Commands
Chapter 3
Optional DeviceNet Communication Setup
Choose the Configuration folder and choose the OptionalComm page, which
lets you set the address and communication rate to operate in your system. The
range for DeviceNet_Address is 0…63 (default). The selections for
DeviceNet_Baudrate are the following:
• 0 = 125 Kbps (default)
• 1 = 250 Kbps
• 2 = 500 Kbps
• 3 = Autobaud
Refer to Optional DeviceNet Communication on page 188 for more
information on optional DeviceNet communication parameters.
IMPORTANT
You can also set up or change the DeviceNet port parameters by using
RSNetWorx for DeviceNet software or similar utilities.
Optional ControlNet Communication Setup
Choose the Configuration folder and then choose the OptionalComm page. The
ControlNet address is the only configurable parameter. The default is 255.
Set Up Date and Time
Follow these steps to set the date and time.
1. Choose the Configuration folder and choose the DateTime page.
2. Enter the year, month, day, hour, and minute into the corresponding input
fields and click Apply Changes.
If your power monitor is set up for time synchronization with either a
SNTP or IEEE 1588 PTP server, the time is already set.
Rockwell Automation Publication 1426-UM001G-EN-P - November 2014
49
Chapter 3
Setup and Commands
Set Up Initial Security
If you choose to enable security on the power monitor, you must perform the
initial security setup by using the USB Web interface.
1. In the USB web page, choose the Security folder and then the Security
page.
2. From the Security Defaults pull-down menu, choose Enable Security.
3. Accept the prompt regarding enabling security and accept the prompt to
reload the web pages.
4. Log in with user name usbadmin and password usbadmin.
5. Accept the prompt that the login was successful.
6. To add a network administrator, click AddNew.
50
Rockwell Automation Publication 1426-UM001G-EN-P - November 2014
Setup and Commands
Chapter 3
7. Enter a username and password for a network administrator.
The username and password can be any string up to 32 characters in
length. This example sets a username of admin with a password of admin.
Make a note of the new network administrator login for future use and
keep it in a secure location.
Now that the network administrator user has been created, you can continue
setting up the PowerMonitor 5000 unit by using the USB web page or by
connecting through the native EtherNet/IP port and using the network Web
interface. This includes the ability to configure additional users, administrators,
and application security accounts. Only one administrator class user can be
logged in at a time. Be sure to log out when finished editing the unit
configuration.
To utilize security with optional communication, set up an application class
account by using the USB or Ethernet web page. Security cannot be configured
by using optional communications. DeviceNet communication uses application
class security, which requires a client application to write the username and
password by using explicit messaging before writing configuration and
commands or reading logged data.
Test Security
To test the network administrator login, follow these steps.
1. Browse to the network address of the PowerMonitor 5000 unit.
2. Click Log in from the page header and enter the user name and password
just created and click Log In.
Rockwell Automation Publication 1426-UM001G-EN-P - November 2014
51
Chapter 3
Setup and Commands
Note that only the USB Web interface can be used to enable, disable, or reset
security. If security accounts are lost or forgotten, you need to connect to the
USB Web interface and log in with the usbadmin account to create new network
security accounts.
Setting Up Remaining Functions of the PowerMonitor 5000 Unit
The remaining functions are set up in the same way as the examples discussed in
this section. This manual lists configuration parameters and options for basic
metering, communication, and other functions and features of the
PowerMonitor 5000 unit in these chapters:
• Metering on page 55
• Power Quality Monitoring on page 79
• Logging on page 95
• Logic Functions on page 153
• Other Functions on page 177
Commands
Commands let you instruct the power monitor to take various pre-defined
actions. Two specialized classes of commands are the following:
• Controller interface command, which allows a controller to provide a
demand end-of-interval signal. The use of this command is described in
Demand Metering on page 66
• Wiring corrections commands, which allow you to correct wiring errors
virtually. Wiring corrections commands are described in Wiring
Correction on page 61
A third, more general class of commands, is comprised of system register
commands. These commands can clear or set energy and status counters, force
outputs, clear logs, reset the unit, and restore defaults. They can be initiated by
using the web page, optional software, or communication. If security is enabled, a
logged-in Administrator class user can initiate commands by using the web page;
or a logged-in Application class user can initiate commands by using optional
software or communication.
The Command.System_Registers data table is the command interface. The value
written into Command Word One or Command Word Two identifies the
command to be executed. The commands in Command Word One are disabled
if Configuration Lock is active. Some commands require additional values to be
written to specified elements of the Command.System_Registers data table. For
example, a value of 18, Clear Setpoint Logic Gate Accumulators, uses the value of
Command.System_Register data table element 3 to determine which logic gate
accumulator to clear. The power monitor ignores data table element values that
are not associated with a command. The power monitor rejects any attempt to
select commands from both Command Word One and Two at the same time.
Chapters 4…8 provide additional detail on commands associated with power
monitor functions.
52
Rockwell Automation Publication 1426-UM001G-EN-P - November 2014
Setup and Commands
Chapter 3
Setup Using Optional
Software
FactoryTalk EnergyMetrix software, with the RT option, provides a
configuration interface for the PowerMonitor 5000 unit, including the ability to
upload, edit, download, and back up the unit configuration on a server. Please
refer to the FactoryTalk EnergyMetrix User Manual, publication
FTEM-UM002, or online help topics for information on configuring the
PowerMonitor 5000 unit by using FactoryTalk EnergyMetrix software. Contact
your local Rockwell Automation sales office or Allen-Bradley distributor, or visit
http://www.software.rockwell.com for more information on available software
packages.
Setup Using Communication
Refer to Communication on page 187 for detailed information on unit setup by
using communication with a programmable controller or custom software
application.
Rockwell Automation Publication 1426-UM001G-EN-P - November 2014
53
Chapter 3
Setup and Commands
Notes:
54
Rockwell Automation Publication 1426-UM001G-EN-P - November 2014
Chapter
4
Metering
Topic
Page
Basic Metering
55
Wiring Diagnostics
57
Wiring Correction
61
Metering Overview
64
Energy Metering
65
Demand Metering
66
Power Metering
72
Voltage, Current, Frequency Metering
74
Configuration Lock
76
This section describes the functions of the PowerMonitor 5000 unit. Most
functions require you to configure set-up parameters to align the unit with your
installation and your application requirements. The set-up parameters are listed
by name and described in this section. You can view set-up parameters by using
the PowerMonitor 5000 web page, and when logged in to an Admin account,
make changes to the setup. Set-up parameters are also accessible by using
communication.
Please refer to the Data Tables for additional information on setup parameters
including the following:
• Range of valid values
• Default values
• Data type
Set-up parameters can be found in data tables with names beginning with
‘Configuration’, for instance Configuration.Metering_Basic.
Basic Metering
The PowerMonitor 5000 unit calculates metering results based on the values of a
number of set-up parameters. These basic metering parameters are listed in the
table that follows. The basic metering setup is necessary to obtain accurate,
properly scaled metering results.
This applies to all models of the PowerMonitor 5000 unit.
Rockwell Automation Publication 1426-UM001G-EN-P - November 2014
55
Chapter 4
Metering
Set-up Parameters
The following set-up parameters specify the configuration of the voltage and
current sensing circuit, how the metered values are scaled, nominal values, update
rate, and averaging. These parameters are found in the power monitor's
Configuration > Metering_Basic web page.
Metering_Mode
Metering_Mode must match the external electrical system and how it is wired to
the PowerMonitor voltage and current input terminals. Refer to the wiring
diagrams in Chapter 2. The following are the selections for the Metering_Mode:
0 = Demo
1 = Split-phase
2 = Wye (default)
3 = Delta, 2 CT
4 = Delta, 3 CT
5 = Open Delta, 2 CT
6 = Open Delta, 3 CT
7 = Delta, Grounded B Phase, 2 CT
8 = Delta, Grounded B Phase, 3 CT
9 = Delta, High Leg
10 = Single Phase
V1_V2_V3_PT_Primary
V1_V2_V3_PT_Secondary
VN_PT_Primary
VN_PT_Secondary
These parameters define the transformation ratios of the potential (voltage)
transformers (PTs or VTs) used to connect the power monitor to the measured
power circuit. When the power monitor is directly connected to the measured
circuit (up to 690V L-L), you can specify any 1:1 ratio.
I1_I2_I3_CT_Primary
I1_I2_I3_CT_Secondary
I4_CT_Primary
These parameters define the transformation ratios of the current transformers
(CTs) used to connect the power monitor to the measured power circuit. The
secondary value is permitted to be only 5 A.
Nominal_System_LL_Voltage
Nominal_System_Frequency
These parameters specify the nominal system (line-to-line) voltage and
frequency. The power monitor uses these values to optimize metering accuracy,
and the M6 and M8 models use these values to set thresholds for detection of
power quality events.
56
Rockwell Automation Publication 1426-UM001G-EN-P - November 2014
Metering
Chapter 4
Realtime_Update_Rate
This parameter specifies the averaging used and the update rate of metering
results to the data tables and setpoint calculations. You can select from the
following:
0 = Single cycle averaged over 8 cycles
1 = Single cycle averaged over 4 cycles
2 = 1 cycle with no averaging
Related Functions
•
•
•
•
•
•
•
Wiring Diagnostics
Voltage and Current Metering
Power Metering
Energy Metering
Demand Metering
Configuration Lock
Data Logging
Power Quality monitoring
The PowerMonitor 5000 unit provides a means for you to verify proper power
monitor connections and diagnose wiring errors. To meter power and energy
correctly, voltage and current inputs must be connected to the power circuit with
the correct phase rotation and polarity. Indications of wiring errors include the
following:
• Indication of negative real power (kW) on a load, or indication of positive
power on a generator
• Power factor outside the range of 45% lagging to 80% leading
• Very different power and/or power factor values on different phases
Wiring diagnostics operate on command in any wiring mode, and require a level
of measured current at least 5% of the nominal metering scale, or 250 mA of CT
secondary current. For example, a power monitor with 600:5 CT ratios
configured for I1, I2, and I3 requires 30 amps of load current for wiring
diagnostics to operate.
Rockwell Automation Publication 1426-UM001G-EN-P - November 2014
57
Chapter 4
Metering
The PowerMonitor 5000 unit calculates phase angles of voltage and current, and
checks these against three distinct ranges of system power factor:
• Range 1: lagging 97% to leading 89%. This range is for very high lagging or
significantly leading power factors. Examples of loads in this range include
data centers, over-excited synchronous motors, and circuits with power
factor correction.
• Range 2: lagging 85% to leading 98%. This range includes most industrial
circuits that range from lagging to slightly leading power factors, including
circuits feeding AC variable-frequency drives.
• Range 3: lagging 52% to lagging 95%. This range exhibits lower lagging
power factors. Examples include lightly-loaded motor circuits and DC
SCR drives.
The power monitor displays wiring diagnostic status results for all three power
factor ranges when a command is issued. You decide which power factor range
applies based upon your knowledge of the circuit and its load characteristics. You
can expect more reliable wiring diagnostic results when the circuit is operating in
a normal condition, that is, not especially lightly loaded.
Figure 24 illustrates the part power factor plays in wiring diagnostics. The PF
ranges show the I1 phase angle limits for each range. The phasor diagram shows
the fundamental voltage and currents in a three-phase, 4-wire system operating
with a lagging power factor of roughly 85%. In this example, ranges 2 and 3
wiring diagnostic can return good results, but range 1 can incorrectly indicate
that all currents are inverted and displaced by a phase, as shown by the –I1, -I2
and –I3 phasors.
Figure 24 - Power Factors and Wiring Diagnostics
In addition to wiring diagnostics on command, the PowerMonitor 5000 unit
updates voltage and current magnitude and phase angle data continually. These
values are used by FactoryTalk EnergyMetrix RT software to display a system
phasor diagram.
Wiring diagnostic results can also be used for automatic virtual wiring correction,
as described in the next section.
58
Rockwell Automation Publication 1426-UM001G-EN-P - November 2014
Metering
Chapter 4
Applications
This applies to all models.
Setup
Only basic metering setup is required.
Command
Command Word 2
Set this command word value to 11 (decimal) or make selection in web page to
initiate wiring diagnostics.
Wiring Diagnostic Results
The PowerMonitor 5000 unit returns the following wiring diagnostic results for
all three power factor ranges. Results are available for about 30 minutes after the
command is received.
Command_Status
These are the values:
0 = Command Active
1 = Input Level Low
2 = Disabled
3 = Waiting Command
RangeN_Voltage_Input_Missing
RangeN_Current_Input_Missing
These are the values for these parameters:
-1 = Test not run
0 = Test passed
1 = Phase 1 missing
2 = Phase 2 missing
3 = Phase 3 missing
12 = Phase 1 and 2 missing
13 = Phase 1 and 3 missing
23 = Phase 2 and 3 missing
123 = All phases missing
Rockwell Automation Publication 1426-UM001G-EN-P - November 2014
59
Chapter 4
Metering
Range1_L97_C89_Status
Range2_L85_C98_Status
Range3_L52_L95_Status
0 = pass
1 = fail
RangeN_Voltage_Input_Inverted
RangeN_Current_Input_Inverted
These are the values:
-1 = Test not run
0 = Test passed
1 = Phase 1 inverted
2 = Phase 2 inverted
3 = Phase 3 inverted
12 = Phase 1 and 2 inverted
13 = Phase 1 and 3 inverted
23 = Phase 2 and 3 inverted
123 = All phases inverted
Voltage_Rotation
Current_Rotation
These are the values:
123…321 designating phase and rotation. Example: 213 = Phase 2 then
phase 1 then phase 3
-1 = Test not run
4 = Invalid Rotation
5 = Out of range
Phasor Magnitudes and Angles
The PowerMonitor 5000 unit updates these values continually.
Voltage_Phase_1_Angle (always zero)
Voltage_Phase_1_Magnitude
Voltage_Phase_2_Angle
Voltage_Phase_2_Magnitude
Voltage_Phase_3_Angle
Voltage_Phase_3_Magnitude
Current_Phase_1_Angle
Current_Phase_1_Magnitude
Current_Phase_2_Angle
Current_Phase_2_Magnitude
Current_Phase_3_Angle
Current_Phase_3_Magnitude
60
Rockwell Automation Publication 1426-UM001G-EN-P - November 2014
Metering
Chapter 4
Semantics
Magnitudes are the scaled RMS value of the voltage or current. In Wye and splitphase modes, voltages are reported as line-to-neutral. In Delta modes, voltage is
reported as line-to-line. Phase angles are referenced to Phase 1 Voltage, which is
defined as zero, consistent with the 4-quadrant metering diagram included in
Power Metering on page 72.
Note that current angles in Delta modes include a 30° offset due to the phase
angle difference between Wye and Delta modes as shown in the following
diagram.
Related Functions
• Voltage and Current Metering
• Power Metering
• Energy Metering
Wiring Correction
The PowerMonitor 5000 unit can correct for wiring errors by logically mapping
physical voltage and current inputs to voltage and current metering channels. You
determine if and when this occurs by issuing a Wiring Corrections Command.
The wiring corrections command offers a number of options:
• Automatically correct the wiring according to the wiring diagnostics
results for the power factor range 1, 2, or 3 that you select.
• Manually apply wiring correction.
• Remove previously-applied wiring corrections.
The ‘Virtual Wiring Correction’ status indicator next to the voltage terminal
blocks indicates when wiring corrections are in effect.
IMPORTANT
Only one wiring correction command can be applied (one command can
correct for multiple errors). If a change is needed, first remove the previous
wiring correction, and then apply the new wiring correction.
Rockwell Automation Publication 1426-UM001G-EN-P - November 2014
61
Chapter 4
Metering
Applications
This applies to all models.
Setup
Only basic metering setup is required.
Command
The Command.Wiring_Corrections table comprises the following parameters.
Wiring_Correction_Commands
Wiring_Correction_Commands determines the type of wiring correction to be
performed when the command executes. These are the selections:
0 = No command
1 = Correct wiring automatically by using Power Factor Range 1 results
2 = Correct wiring automatically by using Power Factor Range 2 results
3 = Correct wiring automatically by using Power Factor Range 3 results
4 = Correct wiring by using manual input mapping parameters
5 = Remove all wiring corrections.
Input_V1_Mapping
Input_V2_Mapping
Input_V3_Mapping
Input_I1_Mapping
Input_I2_Mapping
Input_I3_Mapping
This collection of parameters determines the mapping of physical voltage inputs
to logical voltage channels and physical current inputs to logical current channels.
The following are the permitted values:
1 = Map the physical input to logical channel 1
2 = Map the physical input to logical channel 2
3 = Map the physical input to logical channel 3
-1 = Map the physical input to logical channel 1 and invert its polarity
-2 = Map the physical input to logical channel 2 and invert its polarity
-3 = Map the physical input to logical channel 3 and invert its polarity
62
Rockwell Automation Publication 1426-UM001G-EN-P - November 2014
Metering
Chapter 4
For example, an Input_I1_Mapping value of -1 inverts the polarity of the
secondary connection to the CT on phase 1. The values of these parameters are
ignored if automatic wiring correction is selected in the command. If manual
input mapping is selected, all mapping parameters are required and the
combination is checked for validity (mapping of two physical inputs to the same
metering channel is not permitted).
Status
The Status.Wiring_Corrections table mirrors the parameters of the most recent
wiring correction command. In addition, the following parameters report the
status of the most recent command.
Last_Cmd_Rejection_Status
These are the values:
0 = No rejection
1 = Rejected; see rejection information
Rejection_Information
These are the values:
0 = No information
1 = Selected range is incomplete
2 = Command is already active. Please use command 5 (remove all wiring
corrections) to start over
3 = Two like inputs wired to one terminal
4 = Invalid Input parameter
Related Functions
•
•
•
•
Voltage and Current Metering
Power Metering
Energy Metering
Configuration Lock
Rockwell Automation Publication 1426-UM001G-EN-P - November 2014
63
Chapter 4
Metering
Metering Overview
The PowerMonitor 5000 unit performs calculations on scaled, digital voltage,
and current values. Signals connected to the voltage and current inputs are
sampled and their instantaneous values are converted to digital values in an
analog-to-digital (A/D) converter section. These values are scaled according to
configured PT Primary, PT Secondary, CT Primary, and CT Secondary
parameters, and evaluated according to the configured Wiring Mode parameter.
All metering results can be viewed by using the Web interface,
FactoryTalk EnergyMetrix software, version 2.0, or standard CIP
communication.
Summary of Measurements
• Current: Average Current, Positive/Negative/Zero Sequence, Percent
Unbalance
• Voltage: Line-Line, Line-Neutral, Average, Positive/Negative/Zero
Sequence, Percent Unbalance
• Frequency, Average Frequency
• Power: Real (W), Reactive (VARs), Apparent (VA), Total
• Power Factor: True (Full Bandwidth), Displacement (Fundamental ),
Lead, Lag, Demand
• Real Energy Consumption (kWh, GWH), Forward, Reverse, Net
• Reactive Energy Consumption (kVARh, GVARh) Forward, Reverse, Net
• Apparent Energy Consumption (kVAh, GVAh) Net
• Current Consumption (Amp-h)
• Demand and Projected Demand (kA, kW, kVAR, kVA)
• IEEE Percent Total Harmonic Distortion
• IEC Percent Total Harmonic Distortion
• Crest Factor
• K-Factor
• Phase Rotation (ABC, ACB)
• Time of Use
Metering Accuracy Class
ANSI C12.20 -2010 (clause 8) Class 0.2 and
EN 62053-22 - 2003 (clause 5.5.4) Class 0.2
64
Rockwell Automation Publication 1426-UM001G-EN-P - November 2014
Metering
Energy Metering
Chapter 4
The power monitor meters the following energy consumption parameters:
• Real Energy Consumption (kWh, GWH), Forward, Reverse, Net
• Reactive Energy Consumption (kVARh, GVARh) Forward, Reverse, Net
• Apparent Energy Consumption (kVAh, GVAh) Net
• Current Consumption (Amp-h)
Applications
This function applies to all PowerMonitor 5000 models.
Table 8 - Energy Metering Metered Parameters
Parameter
Description
Range
Units
GWh_Fwd
Total real energy consumed
0…9,999,999
GWh
kWh_Fwd
Total real energy consumed
0.000…999,999
kWh
GWh_Rev
Total real energy produced
0…9,999,999
GWh
kWh_Rev
Total real energy produced
0.000…999,999
kWh
GWh_Net
The sum of forward and reverse real energy
± 0…9,999,999
GWh
kWh_Net
The sum of forward and reverse real energy
± 0.000…999,999
kWh
GVARh_Fwd
Total reactive energy consumed
0…9,999,999
GVARh
kVARh_Fwd
Total reactive energy consumed
0.000…999,999
kVARh
GVARh_Rev
Total reactive energy produced
0…9,999,999
GVARh
kVARh_Rev
Total reactive energy produced
0.000…999,999
kVARh
GVARh_Net
Total sum of forward and reverse reactive energy
±0…9,999,999
GVARh
kVARh_Net
Total sum of forward and reverse reactive energy
±0.000…999,999
kVARh
GVAh
Total apparent energy consumed
0…9,999,999
GVAh
kVAh
Total apparent energy consumed
0.000…999,999
kVAh
GAh
Accumulated amp-hours consumed
0…9,999,999
GAh
kAh
Accumulated amp-hours consumed
0.000…999,999
kAh
Example
A large energy value could be displayed as 123,456,789,234.567 kWh where
123,456 is the GWh metering result and 789,234.567 is the kWh metering result.
Energy results (kWh, kVARh, and kVAh) roll over to 0 after the value of
9,999,999,999,999 or 1013-1 is reached.
Setup
Only basic metering setup is required for energy metering.
Rockwell Automation Publication 1426-UM001G-EN-P - November 2014
65
Chapter 4
Metering
Commands
The following commands are supported by the power monitor:
• Set GWh/kWh register
• Set GVARh/kVARh register
• Set GVAh/kVAh register
• Set GAh/kAh register
• Clear all energy registers
Related Functions
• KYZ output
• Energy log
• Configuration lock
Demand Metering
Demand is an electric power term that expresses the average energy usage over a
predefined period. Your electrical energy provider specifies how demand is
determined in the rate tariff or schedule that is used to calculate your electric bill.
The power monitor can be configured to align with how your electric-energy
provider measures demand by using a fixed demand period or a sliding time
window. The demand period can be configured to be timed internally,
synchronized to an external demand end-of-interval contact connected to the S2
status input, or synchronized by using communication. The PowerMonitor 5000
unit, by default, calculates demand on a fixed 15-minute demand period, which is
synchronized to the power monitor internal clock.
Table 9 - Demand Metering Metered Parameters
Parameter
Description
Range
Units
kW_Demand
The average total real power during the
last demand period.
± 0.000…9,999,999
kW
kVAR_Demand
The average total reactive power during
the last demand period.
±0.000…9,999,999
kVAR
kVA_Demand
The average total apparent power during
the last demand period.
0.000…9,999,999
kVA
Demand_PF
The average PF during the last demand
period.
-100.0…100.0
PF
Demand_Amperes
The average demand for amperes during
the last demand period.
0.000…9,999,999
A
Projected_kW_Demand
The projected total real power for the
current demand period.
± 0.000…9,999,999
kW
Projected_kVAR_Demand
The projected total reactive power for the
current demand period.
±0.000…9,999,999
kVAR
Projected_kVA_Demand
The projected total apparent power for the
current demand period.
0.000…9,999,999
kVA
Projected_Ampere_Demand
The projected average amperes for the
current demand period.
0.000…9,999,999
A
66
Rockwell Automation Publication 1426-UM001G-EN-P - November 2014
Metering
Chapter 4
Projected demand calculates an instantaneous or linear projection of demand at
the end of a demand interval.
Demand power factor is calculated by using the following formula.
kWDemand-------------------------------kVADemand
Demand Calculation
Demand is equal to the average power level during a predefined time interval.
This interval continuously repeats and is typically 15 minutes but can be between
5 and 30 minutes in length. The power monitor computes demand levels for
watts, VA, amps, and VARs, and provides two different methods for projecting
demand. The formula for real power (kW) demand is shown below.
1
(t + T)
Demand = --- × ³
P ( t ) dt
T t
T = Demand interval duration
T = Time at beginning of interval
P(t) = Power as a function of time
If your electric utility provides a pulse that indicates the end of each demand
interval, the power monitor can be set up to determine its demand interval from
the utility pulse.
Some electric service providers use the sliding window method. This method
breaks the demand interval into many sub-intervals and updates the demand
value at the end of each sub-interval.
For example, a 15 minute interval can be divided into 15 one-minute subintervals. Each minute, the following occurs:
• The demand for the sub-interval is calculated and stored.
• The average value of the most recent fifteen sub-intervals is computed to
obtain a demand value.
• Sub-interval values older than fifteen minutes are discarded.
Projected Demand Calculation
Projected demand calculates an instantaneous (default) or first-order projection
of demand at the end of a demand interval. Select the best projection method for
your system by comparing the projected values from each method with the actual
Rockwell Automation Publication 1426-UM001G-EN-P - November 2014
67
Chapter 4
Metering
demand at the end of the interval. The methods of projecting demand are
described below.
68
Rockwell Automation Publication 1426-UM001G-EN-P - November 2014
Metering
Chapter 4
Instantaneous
The power monitor computes instantaneous demand by substituting the elapsed
interval duration for the total interval duration (T) in the demand equation. It is
therefore identical to the standard computation except it integrates the power
only over the elapsed interval duration and calculates the average value over the
elapsed duration. The modified equation thus becomes:
(t2 - t1) = Elapsed interval duration and is less than T
First Order Projection
The first order demand projection does the following:
• Uses the instantaneous demand as a starting point
• Computes the trend of the instantaneous demand
• Computes the time remaining in the interval
• Performs a first order projection of what the final demand is at the end of
the interval
This method can be useful where your system has a significant base load with
additional loads that are switched in and out during the interval.
Setup
Basic Metering and Date and Time setup are required. If the default demand
configuration (15-minute fixed interval based on internal clock) satisfies your
demand metering requirements, you do not need to change any demand setup
parameters.
If you want to customize the demand calculation to match that of your electric
service provider, or to satisfy other application requirements, then there are two
groups of setup parameters you can change.
Basic demand set-up parameters are found in the Metering_Basic tab under the
Configuration tab.
Demand_Source
Selects the source of the demand end-of-interval (EOI) signal. These are the
values:
0 = Internal Timer (default)
1 = Status Input 2
2 = Controller Command (Unit must be set up as a demand sync master)
3 = Ethernet Demand Broadcast
Rockwell Automation Publication 1426-UM001G-EN-P - November 2014
69
Chapter 4
Metering
These are the semantics:
• If Demand_Broadcast_Mode_Select is set to master, then a Demand
Source value of 0…2 selects the EOI source that is used to trigger the
demand-sync master broadcast.
• If Demand_Broadcast_Mode_Select is set to slave, then a Demand Source
value of 0…3 selects the EOI source.
Demand_Period_Length (Minutes)
Specifies the desired period for demand calculations. These are the values:
0 = See semantics
1…99 = Length of time of each demand period in minutes
These are the semantics:
• When set to 0 there is no projected demand calculations.
• If the internal timer is selected, a setting of 0 turns the demand function
off.
Number_Demand_Periods
Specifies the number of demand periods to average for demand measurement.
These are the values:
1 = Used for fixed demand period
2…15 = Used for sliding window demand period
Forced_Demand_Sync_Delay
When configured for an external demand source, this parameter defines how
long the unit waits for the expected control input (for example, EOI pulse or
network demand broadcast), before it starts a new demand period. If this occurs
an entry is made in the Event Log. These are the values:
0 = Wait forever
1…900 = Wait this many seconds before starting a new demand period
Network demand synchronization is available on units connected to an Ethernet
network. Network-demand synchronization parameters are found in the
Communications_Native tab under Configuration tab.
70
Rockwell Automation Publication 1426-UM001G-EN-P - November 2014
Metering
Chapter 4
Demand_Broadcast_Mode_Select
Demand Ethernet broadcast selection. These are the values:
0 = Slave (default)
1 = Master
IMPORTANT
There must be only one master per demand network.
Demand_Broadcast_Port
The common port for demand broadcast messages. These are the values:
300 (default)…400
Commands
Controller command (EOI signal)
Related Functions
• Status inputs
• Time of use log
• Configuration lock
Rockwell Automation Publication 1426-UM001G-EN-P - November 2014
71
Chapter 4
Metering
Power Metering
This function applies to all PowerMonitor 5000 models.
Table 10 - Power Metering Metered Parameters
Parameter
Description
Range
Units
L1_kW
Power of individual phase or sum of phases;
signed to show direction
-9.999E15…9.999E15
kW
Reactive power of individual phase or sum of
all phases; signed to show direction
-9.999E15…9.999E15
kVAR
Apparent power of individual phase or sum of
all phases
0…9.999E15
kVA
The ratio between power and apparent power
for individual phase or all phases
0.00…100.00
%
The cosine of the phase angle between the
fundamental voltage and current for an
individual phase or all phases
0.00…100.00
%
Lead or lag indicator for power factor
1 = leading
-1 = lagging
-1…1
-
L2_kW
L3_kW
Total_kW
L1_kVAR
L2_kVAR
L3_kVAR
Total_kVAR
L1_kVA
L2_kVA
L3_kVA
Total_kVA
L1_True_PF_%
L2_True_PF_%
L3_True_PF_%
Avg_True_PF
L1_Disp_PF
L2_Disp_PF
L3_Disp_PF
Avg_Disp_PF
L1_PF_Lead_Lag_Indicator
L2_PF_Lead_Lag_Indicator
L3_PF_Lead_Lag_Indicator
Total_PF_Lead_Lag_Indicator
Only total three-phase power results are provided when Direct Delta or Open
Delta wiring modes are selected.
72
Rockwell Automation Publication 1426-UM001G-EN-P - November 2014
Metering
Chapter 4
The Magnitude and Direction of Power Quantities chart indicates the
relationship between the magnitude and direction of the power quantities and
the numeric signs used by the power monitor.
Figure 25 - Magnitude and Direction of Power Quantities
Pf = 0
+kVAR (Import)
kVARHR-F (Forward)
ª
(Power Factor
Lagging)
(-)
(Power Factor
Leading)
(+)
Pf = 100%
-kW (Export)
kWH-R (Reverse)
II
I
Pf = 100%
ª+kW (Import)
ª
III
kWH-F (Forward)
IV
(Power Factor
Lagging)
(-)
(Power Factor
Leading)
(+)
ª
Pf = 0
-kVAR (Export)
kVARHR-R (Reverse)
Setup
Only basic metering setup is required for power metering.
Related Functions
• Metering result averaging
• Configuration lock
Rockwell Automation Publication 1426-UM001G-EN-P - November 2014
73
Chapter 4
Metering
Voltage, Current, Frequency
Metering
This function applies to all PowerMonitor 5000 models.
Table 11 - Voltage, Current, and Frequency Metering Metered Parameters
Parameter
Description
Range
Units
V1_N_Volts
RMS line to neutral voltage of individual phase or average
of V1, V2, V3
0…9.999E15
V
VN_G_Volts
RMS ground to neutral voltage
0…9.999E15
V
V1_V2_Volts
RMS line to line voltage of individual phase or average of
V1_V2, V2_V3 and V3_V1
0…9.999E15
V
RMS line current of individual phase or average of I1, I2 and
I3 amps.
0…9.999E15
A
I4_Amps
RMS current of phase 4, also known as the neutral or zerosequence current
0…9.999E15
A
Frequency_Hz
The frequency of the voltage
40.00…70.00
Hz
Avg_Frequency_Hz
Average Frequency over 6 cycles
40.00…70.00
Hz
Voltage Rotation
Voltage rotation has the following designations:
0 = Not metering
123 = ABC rotation
132 = ACB rotation
4 = No rotation
0…132
Pos_Seq_Volts
Positive Sequence Voltage
0…9.999E15
V
Neg_Seq_Volts
Negative Sequence Voltage
0…9.999E15
V
Zero_Seq_Volts
Zero Sequence Voltage
0…9.999E15
V
Pos_Seq_Amps
Positive Sequence Amps
0…9.999E15
A
Neg_Seq_Amps
Negative Sequence Amps
0…9.999E15
A
Zero_Seq_Amps
Zero Sequence Amps
0…9.999E15
A
Voltage_Unbalance_%
Voltage percent unbalance
0.00…100.00
%
Current_Unbalance_%
Current percent unbalance
0.00…100.00
%
V2_N_Volts
V3_N_Volts
Avg_V_N_Volts
V2_V3_Volts
V3_V1_Volts
Avg_VL_VL_Volts
I1_Amps
I2_Amps
I3_Amps
Avg_Amps
Line-to-neutral voltage results are provided in Wye, split-phase and high-leg
Delta metering modes. Line-to-neutral voltage results are not provided in Delta
(other than high-leg Delta) and Open Delta metering modes.
Voltage and current unbalance are calculated by using the following formula.
Negative
Sequence--------------------------------------------× 100
Positive Sequence
74
Rockwell Automation Publication 1426-UM001G-EN-P - November 2014
Metering
Chapter 4
Symmetrical Component Analysis Results
The power monitor calculates sequence voltages and currents for use in
symmetrical component analysis, which transforms a set of unbalanced threephase vectors into three sets of balanced vectors. The positive sequence
components are a set of vectors that rotate the same direction as the original
power vectors, and represent that portion of the applied voltage or current
capable of doing work. Negative sequence components rotate opposite to the
original vectors, and represent the portion of the applied power that results in
losses due to unbalance. The percent unbalance value is the ratio between the
negative and positive current sequence in a three-phase system and is the most
accurate measurement of current unbalance because it takes into account the
magnitude of the individual currents and the relative phase displacement. The
zero sequence component is a single vector that does not rotate, and represents
ground or neutral current (I4) or voltage. The component analysis results are
included in the table above.
Setup
Only basic metering input setup is required for voltage and current metering.
Related Functions
• Metering result averaging
• Configuration lock
Viewing Metering Results by Using Web Page
You can view voltage, current, frequency, energy, and power metering results from
the PowerMonitor 5000 web page. Browse to the network address of the power
monitor. From the home page, choose the MeteringResults folder and then the
desired metering results page.
Rockwell Automation Publication 1426-UM001G-EN-P - November 2014
75
Chapter 4
Metering
You can use the Web interface to view power quality results, power monitor
status and statistics, and configuration. CalibrationData links to a printable
calibration certificate for the power monitor. Configuration lets you review the
configuration parameters, and, if logged in as an administrator, change them.
While logged in as an administrator, you can also issue commands to the power
monitor from the Command link.
Viewing Metering Results with a Door Mounted Display
The PowerMonitor 5000 Display Module (catalog number 1426-DM, purchased
separately) can be applied as a panel display for one, two, or three PowerMonitor
5000 units.
Appendix C provides further information on setting up and using a Display
Module for a PowerMonitor 5000 unit.
Configuration Lock
Unauthorized changes to the PowerMonitor 5000 unit setup are prevented when
the configuration lock switch is placed in the lock position.
Applications
This applies to all models.
Operation
The following setup parameters and commands are locked when the
configuration lock is applied.
Configuration.Metering_Basic
All parameters.
Configuration.SystemGeneral
• KYZ and Relay Outputs setup
• Status inputs scale
Configuration.CommunicationsNative
• Network demand setup
76
Rockwell Automation Publication 1426-UM001G-EN-P - November 2014
Metering
Chapter 4
Command.System_Registers
•
•
•
•
•
•
Command Word One, which includes the following commands:
Set kWh, kVARh, kVAh, kAh, all energy registers
Set status input count
Force relay or KYZ output on, off, or clear force
Restore factory defaults
Reset power monitor
Setup
No setup is needed.
Rockwell Automation Publication 1426-UM001G-EN-P - November 2014
77
Chapter 4
Metering
Notes:
78
Rockwell Automation Publication 1426-UM001G-EN-P - November 2014
Chapter
5
Power Quality Monitoring
a
Topic
Page
Harmonic Analysis
82
Sag and Swell Detection
88
Waveform Recording (M6 and M8 model)
90
This section describes the basic Power Quality functions of the PowerMonitor
5000 unit. Most functions require you to configure set-up parameters to align the
unit with your installation and your application requirements. The set-up
parameters are listed by name and described in this section. You can view set-up
parameters by using the PowerMonitor 5000 web page, and when logged in to an
Admin account, make changes to the setup. Set-up parameters are also accessible
by using communication.
Please refer to the Data Tables for additional information on setup parameters
including the following:
• Range of valid values
• Default values
• Data type
Set-up parameters can be found in data tables with names beginning with
‘Configuration’, for instance Configuration.Metering_Basic.
Rockwell Automation Publication 1426-UM001G-EN-P - November 2014
79
Chapter 5
Power Quality Monitoring
The term ‘power quality’ is associated with electromagnetic irregularities in
voltage and current in a power circuit that can interfere with or cause failures of
electronic equipment. The purpose of these functions is to assist users to
determine and correct the causes of poor power quality, resulting in more reliable
operation and reduced cost.
A number of national and international standards have been developed that
define and classify power quality events and issues, and provide guidelines for
detecting and reporting these events and issues. The design of the power quality
functions in the PowerMonitor 5000 unit has been aligned with these standards.
Please refer to the followiing Appendices for further information:
• Appendix E - IEEE 519
• Appendix F - IEEE 1159
• Appendix G - EN 50160
• Appendix H - EN 61000-4-30
Power quality functions are classified into three broad categories:
• Measurement and reporting the value of power circuit attributes that
comprise power quality
• Classification of power quality events according to applicable standards
and annunciation of such events
• Recording power quality events and their metadata for statistical and
diagnostic purposes
The PowerMonitor 5000 unit provides a range of power quality monitoring
functions. The basic M5 model detects sags and swells, and measures THD, crest
factor, and K-factor. The M6 model builds upon the M5 functionality, adding
IEEE 519 THD/TDD pass/fail reporting, user configurable voltage sag/swell
settings, power quality logging, waveform recording, harmonic analysis, and
synchronized event recording among multiple power monitors. The M8 model is
an advanced power quality meter that expands upon the M6 with sub-cycle
transient detection and capture, flicker monitoring, expanded harmonic analysis,
EN 61000-4-30 metering and EN50160 conformance tracking.
FactoryTalk EnergyMetrix software and its RealTime (RT) option provide
comprehensive, web-based software tools for presenting the power quality
monitoring data produced by the PowerMonitor 5000.
Table 12 compares the power quality capabilities of the PowerMonitor 5000
models.
Table 12 - Power Quality Capabilities
Power Quality Attributes
1426-M5
1426-M6
1426-M8
Per phase
Average / Total
IEEE Voltage THD %
•
•
•
•
•
IEEE Current THD %
•
•
•
•
•
IEC Voltage THD %
•
•
•
•
•
IEC Current THD %
•
•
•
•
•
Crest Factor, Voltage and Current
•
•
•
•
80
Rockwell Automation Publication 1426-UM001G-EN-P - November 2014
Power Quality Monitoring
Chapter 5
Table 12 - Power Quality Capabilities
Power Quality Attributes
1426-M5
1426-M6
1426-M8
Per phase
K-factor, Current
•
•
•
•
•
•
•
•
•
•
•
•
•
•
•
•
•
•
•
•
•
•
•
Classification of Power Quality Events Per IEEE 1159
•
•
•
•
IEEE 1159 imbalance and frequency variation
•
•
•
IEEE 1159 DC offset and THD rolling average, V and I
•
•
•
IEEE 1159 TID rolling average, V and I
•
•
IEEE 1159 Flicker Pst, V
•
Harmonic voltages DC … 63rd, magnitude and angle
Harmonic voltages 64th … 127th, magnitude and angle
Harmonic currents DC … 63rd,, magnitude and angle
•
Harmonic currents 64th … 127th,, magnitude and angle
Harmonic kW, kVAR, kVA, DC … 63rd
Harmonic kW, kVAR, kVA, 64th … 127th
Sag and swell detection
•
IEEE 519 pass/fail and TDD % (2nd through 40th)
•
•
IEEE 519 short and long term harmonic %, Ch1, 2, 3
•
•
Waveform recording
•
•
Network synchronized waveform recording
•
•
Power quality logging
•
•
•
Average / Total
•
•
•
EN61000-4-30 10/12 cycle harmonic subgroups V-N, V-V, I, DC-50th
•
•
EN61000-4-30 10/12 cycle interharmonic subgroups V-N, V-V, I, DC50th
•
•
EN61000-4-30 3 second harmonic subgroups V-N, V-V, DC-50th
•
•
EN61000-4-30 3 second interharmonic subgroups V-N, V-V, DC-50th
•
•
EN61000-4-30 10 minute harmonic subgroups V-N, V-V, DC-50th
•
•
EN61000-4-30 10 minute interharmonic subgroups V-N, V-V, DC50th
•
•
EN61000-4-30 2 hour harmonic subgroups V-N, V-V, DC-50th
•
•
EN61000-4-30 2 hour interharmonic subgroups V-N, V-V, DC-50th
•
•
EN61000-4-30 interharmonic mag 5 Hz bins, V-N, V-V, I, DC-50th
•
•
EN61000-4-30 interharmonic angle 5 Hz bins, V-N, V-V, I, DC-50th
•
•
EN61000-4-30 power frequency variation
•
EN61000-4-30 supply voltage measurement
•
•
EN61000-4-30 flicker measurement
•
•
EN61000-4-30 voltage dips and swells
•
•
EN61000-4-30 voltage interruptions
•
•
EN61000-4-30 data flagging
•
•
EN61000-4-30 supply voltage inbalance
•
•
EN61000-4-30 time aggregation
•
EN61000-4-30 Mains signaling voltage on the supply voltage
•
EN61000-4-30 rapid voltage changes
•
Rockwell Automation Publication 1426-UM001G-EN-P - November 2014
•
•
•
•
•
•
81
Chapter 5
Power Quality Monitoring
Harmonic Analysis
The PowerMonitor 5000 provides harmonic data to help you understand this
important element of power quality in your facility. When calculating harmonic
analysis results, the M5 and M6 models utilize DC to the 63rd harmonics, and
the M8 model utilizes DC to 127th. Individual harmonic results are not
provided in the M5 model.
For additional harmonic analysis, including interharmonics, see EN 50160
Conformance Tracking on page 429.
Setup
Only basic metering setup is required.
Operation
This section describes the methods for measuring harmonics.
IEEE and IEC Total Harmonic Distortion
These total harmonic distortion calculation methods provide a summary
indication of the amount of distortion due to harmonics present in a system.
The standard IEEE definition of harmonic distortion is ‘Total Harmonic
Distortion (THD)’ and is computed for each voltage (V1, V2, V3, VN) and
current (I1, I2, I3, I4) channel as follows:
Where:
∞
( H )2
Σ
n
n = 2
THD = -----------------------H
1
• Hn = magnitude of the nth harmonic
• H1 = magnitude of fundamental
The standard IEC definition of harmonic distortion is the Distortion Index
(DIN) and is computed for each channel as follows:
∞
Where:
DIN =
Σ
( H )2
n
Σ
( H )2
n
n = 2
-------------------∞
n = 1
• Hn = magnitude of the nth harmonic
• DIN is equivalent to IEC THD
Crest Factor
Crest factor is another measure of the amount of distortion present in a
waveform. It can also be used to express the dynamic range of a measurement
device. Crest Factor is the ratio of the peak to the RMS.
Crest Factor = Peak Value ⁄ RMS Value
A pure sinusoid Crest Factor equals 2 .
82
Rockwell Automation Publication 1426-UM001G-EN-P - November 2014
Power Quality Monitoring
Chapter 5
K-factor
K-factor measures additional heating in a power transformer due to harmonics in
the power signal. These harmonics cause additional heating due to increased core
losses that occur at higher frequencies.
The increased losses are related to the square of the harmonic frequency.
Therefore, a slight harmonic content can significantly increase the heat rise in a
power transformer. The additional harmonic heating can cause a transformer to
exceed designed temperature limits even though the RMS current is less than the
transformer rating. The K-factor is used as justification to oversize a power
transformer to allow extra margin for harmonic losses or to select an appropriate
K-factor rated transformer. A K-factor rated transformer is the preferred choice
because it has known performance in the presence of harmonics.
The formula for K-factor is as follows:
∞
2 2 Where:
Σ § H • n ·¹
n = 1© n
K-Factor = ---------------------------------------∞
2
Σ ( Hn )
n = 1
• Hn = magnitude of the nth harmonic
Harmonic Analysis Results
The power monitor returns results for IEEE and IEC THD, crest factor and Kfactor in the PowerQuality.RealTime_PowerQuality tab.
Table 13 - Harmonic Analysis Results
Tag Name
Units
Range
V1_Crest_Factor
0…9.999E15
V2_Crest_Factor
0…9.999E15
V3_Crest_Factor
0…9.999E15
V1_V2_Crest_Factor
0…9.999E15
V2_V3_Crest_Factor
0…9.999E15
V3_V1_Crest_Factor
0…9.999E15
I1_Crest_Factor
0…9.999E15
I2_Crest_Factor
0…9.999E15
I3_Crest_Factor
0…9.999E15
I4_Crest_Factor
0 …9.999E15
V1_IEEE_THD_%
%
0.00…100.00
V2_IEEE_THD_%
%
0.00…100.00
V3_IEEE_THD_%
%
0.00…100.00
VN_G_IEEE_THD_%
%
0.00 …100.00
Avg_IEEE_THD_V_%
%
0.00…100.00
V1_V2_IEEE_THD_%
%
0.00…100.00
V2_V3_IEEE_THD_%
%
0.00…100.00
Rockwell Automation Publication 1426-UM001G-EN-P - November 2014
83
Chapter 5
Power Quality Monitoring
Table 13 - Harmonic Analysis Results
Tag Name
Units
Range
V3_V1_IEEE_THD_%
%
0.00 …100.00
Avg_IEEE_THD_V_V_%
%
0.00…100.00
I1_IEEE_THD_%
%
0.00…100.00
I2_IEEE_THD_%
%
0.00…100.00
I3_IEEE_THD_%
%
0.00…100.00
I4_IEEE_THD_%
%
0.00…100.00
Avg_IEEE_THD_I_%
%
0.00…100.00
V1_IEC_THD_%
%
0.00…100.00
V2_IEC_THD_%
%
0.00…100.00
V3_IEC_THD_%
%
0.00…100.00
VN_G_IEC_THD_%
%
0.00…100.00
Avg_IEC_THD_V_%
%
0.00…100.00
V1_V2_IEC_THD_%
%
0.00…100.00
V2_V3_IEC_THD_%
%
0.00…100.00
V3_V1_IEC_THD_%
%
0.00…100.00
Avg_IEC_THD_V_V_%
%
0.00…100.00
I1_IEC_THD_%
%
0.00…100.00
I2_IEC_THD_%
%
0.00…100.00
I3_IEC_THD_%
%
0.00…100.00
I4_IEC_THD_%
%
0.00…100.00
Avg_IEC_THD_I_%
%
0.00…100.00
I1_K_Factor
1.00…25000.00
I2_K_Factor
1.00…25000.00
I3_K_Factor
1.00…25000.00
Harmonic Magnitude and Angle
The power monitor calculates the RMS magnitude and angle of each individual
harmonic. Results are calculated for harmonics DC to 63 (DC to 127th for the
M8 model) for all voltage and current channels. Each magnitude is expressed in
rms volts or rms amps. DC offset is always zero for current channels. Only
directly-connected voltage channels return non-zero DC offset values.
Angles are expressed in degrees, with zero degrees corresponding to the time
stamp of the metering results.
Harmonic Power
The power monitor calculates the magnitudes of real, reactive, and apparent
power of each individual harmonic. Results are calculated for harmonics DC to
63 (127 for the M8 model). L1, L2, L3, and total power values are returned for
Wye and split-phase wiring modes. Delta wiring modes return only total power
values. Each magnitude is expressed in kW, kVARs, or kVA.
84
Rockwell Automation Publication 1426-UM001G-EN-P - November 2014
Power Quality Monitoring
Chapter 5
Individual Harmonics Results
Individual harmonic results are returned in an array of data tables. You can view
any harmonic results table by selecting it from the PowerQuality >
Harmonics_Results tab in the PowerMonitor 5000 web page. The available
harmonic results data tables are listed below.
• PowerQuality.Total_kW_H1_RMS (DC…31)
• PowerQuality.Total_kW_H2_RMS (32…63)
• PowerQuality.Total_kW_H3_RMS (64…95, M8 model)
• PowerQuality.Total_kW_H4_RMS (96…127, M8 model)
• PowerQuality.Total_kVAR_H1_RMS (DC…31)
• PowerQuality.Total_kVAR_H2_RMS (32…63)
• PowerQuality.Total_kVAR_H3_RMS (64…95, M8 model)
• PowerQuality.Total_kVAR_H4_RMS (96…127, M8 model)
• PowerQuality.Total_kVA_H1_RMS (DC…31)
• PowerQuality.Total_kVA_H2_RMS (32…63)
• PowerQuality.Total_kVA_H3_RMS (64…95, M8 model)
• PowerQuality.Total_kVA_H4_RMS (96…127, M8 model)
• PowerQuality.V1_N_Volts_H1_RMS (DC…31)
• PowerQuality.V1_N_Volts_H2_RMS (32…63)
• PowerQuality.V1_N_Volts_H3_RMS (64…95, M8 model)
• PowerQuality.V1_N_Volts_H4_RMS (96…127, M8 model)
• PowerQuality.V2_N_Volts_H1_RMS (DC…31)
• PowerQuality.V2_N_Volts_H2_RMS (32…63)
• PowerQuality.V2_N_Volts_H3_RMS (64…95, M8 model)
• PowerQuality.V2_N_Volts_H4_RMS (96…127, M8 model)
• PowerQuality.V3_N_Volts_H1_RMS (DC…31)
• PowerQuality.V3_N_Volts_H2_RMS (32…63)
• PowerQuality.V3_N_Volts_H3_RMS (64…95, M8 model)
• PowerQuality.V3_N_Volts_H4_RMS (96…127, M8 model)
• PowerQuality.VN_G_Volts_H1_RMS (DC…31)
• PowerQuality.VN_G_Volts_H2_RMS (32…63)
• PowerQuality.VN_G_Volts_H3_RMS (64…95, M8 model)
• PowerQuality.VN_G_Volts_H4_RMS (96…127, M8 model)
• PowerQuality.V1_V2_Volts_H1_RMS (DC…31)
• PowerQuality.V1_V2_Volts_H2_RMS (32…63)
• PowerQuality.V1_V2_Volts_H3_RMS (64…95, M8 model)
• PowerQuality.V1_V2_Volts_H4_RMS (96…127, M8 model)
• PowerQuality.V2_V3_Volts_H1_RMS (DC…31)
• PowerQuality.V2_V3_Volts_H2_RMS (32…63)
• PowerQuality.V2_V3_Volts_H3_RMS (64…95, M8 model)
• PowerQuality.V2_V3_Volts_H4_RMS (96…127, M8 model)
Rockwell Automation Publication 1426-UM001G-EN-P - November 2014
85
Chapter 5
Power Quality Monitoring
•
•
•
•
•
•
•
•
•
•
•
•
•
•
•
•
•
•
•
•
•
•
•
•
•
•
•
•
•
•
•
•
•
•
•
•
•
•
•
•
•
86
PowerQuality.V3_V1_Volts_H1_RMS (DC…31)
PowerQuality.V3_V1_Volts_H2_RMS (32…63)
PowerQuality.V3_V1_Volts_H3_RMS (64…95, M8 model)
PowerQuality.V3_V1_Volts_H4_RMS (96…127, M8 model)
PowerQuality.I1_Amps_H1_RMS (DC…31)
PowerQuality.I1_Amps_H2_RMS (32…63)
PowerQuality.I1_Amps_H3_RMS (64…95, M8 model)
PowerQuality.I1_Amps_H4_RMS (96…127, M8 model)
PowerQuality.I2_Amps_H1_RMS (DC…31)
PowerQuality.I2_Amps_H2_RMS (32…63)
PowerQuality.I2_Amps_H3_RMS (64…95, M8 model)
PowerQuality.I2_Amps_H4_RMS (96…127, M8 model)
PowerQuality.I3_Amps_H1_RMS (DC…31)
PowerQuality.I3_Amps_H2_RMS (32…63)
PowerQuality.I3_Amps_H3_RMS (64…95, M8 model)
PowerQuality.I3_Amps_H4_RMS (96…127, M8 model)
PowerQuality.I4_Amps_H1_RMS (DC…31)
PowerQuality.I4_Amps_H2_RMS (32…63)
PowerQuality.I4_Amps_H3_RMS (64…95, M8 model)
PowerQuality.I4_Amps_H4_RMS (96…127, M8 model)
PowerQuality.L1_kW_H1_RMS (DC…31)
PowerQuality.L1_kW_H2_RMS (32…63)
PowerQuality.L1_kW_H3_RMS (64…95, M8 model)
PowerQuality.L1_kW_H4_RMS (96…127, M8 model)
PowerQuality.L2_kW_H1_RMS (DC…31)
PowerQuality.L2_kW_H2_RMS (32…63)
PowerQuality.L2_kW_H3_RMS (64…95, M8 model)
PowerQuality.L2_kW_H4_RMS (96…127, M8 model)
PowerQuality.L3_kW_H1_RMS (DC…31)
PowerQuality.L3_kW_H2_RMS (32…63)
PowerQuality.L3_kW_H3_RMS (64…95, M8 model)
PowerQuality.L3_kW_H4_RMS (96…127, M8 model)
PowerQuality.L1_kVAR_H1_RMS (DC…31)
PowerQuality.L1_kVAR_H2_RMS (32…63)
PowerQuality.L1_kVAR_H3_RMS (64…95, M8 model)
PowerQuality.L1_kVAR_H4_RMS (96…127, M8 model)
PowerQuality.L2_kVAR_H1_RMS (DC…31)
PowerQuality.L2_kVAR_H2_RMS (32…63)
PowerQuality.L2_kVAR_H3_RMS (64…95, M8 model)
PowerQuality.L2_kVAR_H4_RMS (96…127, M8 model)
PowerQuality.L3_kVAR_H1_RMS (DC…31)
Rockwell Automation Publication 1426-UM001G-EN-P - November 2014
Power Quality Monitoring
•
•
•
•
•
•
•
•
•
•
•
•
•
•
•
•
•
•
•
•
•
•
•
•
•
•
•
•
•
•
•
•
•
•
•
•
•
•
•
•
•
Chapter 5
PowerQuality.L3_kVAR_H2_RMS (32…63)
PowerQuality.L3_kVAR_H3_RMS (64…95, M8 model)
PowerQuality.L3_kVAR_H4_RMS (96…127, M8 model)
PowerQuality.L1_kVA_H1_RMS (DC…31)
PowerQuality.L1_kVA_H2_RMS (32…63)
PowerQuality.L1_kVA_H3_RMS (64…95, M8 model)
PowerQuality.L1_kVA_H4_RMS (96…127, M8 model)
PowerQuality.L2_kVA_H1_RMS (DC…31)
PowerQuality.L2_kVA_H2_RMS (32…63)
PowerQuality.L2_kVA_H3_RMS (64…95, M8 model)
PowerQuality.L2_kVA_H4_RMS (96…127, M8 model)
PowerQuality.L3_kVA_H1_RMS (DC…31)
PowerQuality.L3_kVA_H2_RMS (32…63)
PowerQuality.L3_kVA_H3_RMS (64…95, M8 model)
PowerQuality.L3_kVA_H4_RMS (96…127, M8 model)
PowerQuality.V1_N_Volts_H1_Ang (DC…31)
PowerQuality.V1_N_Volts_H2_Ang (32…63)
PowerQuality.V1_N_Volts_H3_Ang (64…95, M8 model)
PowerQuality.V1_N_Volts_H4_Ang (96…127, M8 model)
PowerQuality.V2_N_Volts_H1_Ang (DC…31)
PowerQuality.V2_N_Volts_H2_Ang (32…63)
PowerQuality.V2_N_Volts_H3_Ang (64…95, M8 model)
PowerQuality.V2_N_Volts_H4_Ang (96…127, M8 model)
PowerQuality.V3_N_Volts_H1_Ang (DC…31)
PowerQuality.V3_N_Volts_H2_Ang (32…63)
PowerQuality.V3_N_Volts_H3_Ang (64…95, M8 model)
PowerQuality.V3_N_Volts_H4_Ang (96…127, M8 model)
PowerQuality.VN_G_Volts_H1_Ang (DC…31)
PowerQuality.VN_G_Volts_H2_Ang (32…63)
PowerQuality.VN_G_Volts_H3_Ang (64…95, M8 model)
PowerQuality.VN_G_Volts_H4_Ang (96…127, M8 model)
PowerQuality.V1_V2_Volts_H1_Ang (DC…31)
PowerQuality.V1_V2_Volts_H2_Ang (32…63)
PowerQuality.V1_V2_Volts_H3_Ang (64…95, M8 model)
PowerQuality.V1_V2_Volts_H4_Ang (96…127, M8 model)
PowerQuality.V2_V3_Volts_H1_Ang (DC…31)
PowerQuality.V2_V3_Volts_H2_Ang (32…63)
PowerQuality.V2_V3_Volts_H3_Ang (64…95, M8 model)
PowerQuality.V2_V3_Volts_H4_Ang (96…127, M8 model)
PowerQuality.V3_V1_Volts_H1_Ang (DC…31)
PowerQuality.V3_V1_Volts_H2_Ang (32…63)
Rockwell Automation Publication 1426-UM001G-EN-P - November 2014
87
Chapter 5
Power Quality Monitoring
•
•
•
•
•
•
•
•
•
•
•
•
•
•
•
•
•
•
Sag and Swell Detection
PowerQuality.V3_V1_Volts_H3_Ang (64…95, M8 model)
PowerQuality.V3_V1_Volts_H4_Ang (96…127, M8 model)
PowerQuality.I1_Amps_H1_Ang (DC…31)
PowerQuality.I1_Amps_H2_Ang (32…63)
PowerQuality.I1_Amps_H3_Ang (64…95, M8 model)
PowerQuality.I1_Amps_H4_Ang (96…127, M8 model)
PowerQuality.I2_Amps_H1_Ang (DC…31)
PowerQuality.I2_Amps_H2_Ang (32…63)
PowerQuality.I2_Amps_H3_Ang (64…95, M8 model)
PowerQuality.I2_Amps_H4_Ang (96…127, M8 model)
PowerQuality.I3_Amps_H1_Ang (DC…31)
PowerQuality.I3_Amps_H2_Ang (32…63)
PowerQuality.I3_Amps_H3_Ang (64…95, M8 model)
PowerQuality.I3_Amps_H4_Ang (96…127, M8 model)
PowerQuality.I4_Amps_H1_Ang (DC…31)
PowerQuality.I4_Amps_H2_Ang (32…63)
PowerQuality.I4_Amps_H3_Ang (64…95, M8 model)
PowerQuality.I4_Amps_H4_Ang (96…127, M8 model)
The PowerMonitor 5000 unit continually monitors line voltages and sets an
alarm flag when the voltage varies below (sag) or above (swell) a predetermined
threshold, expressed as a percentage of the nominal system voltage. The
PowerMonitor 5000 models detect and report sags and swells in different ways:
• The M5 model detects sags and swells and reports them in the Alarm Log.
• The M6 and M8 models retain the simple sag/swell capabilities of the
M5 model but also permit you to adjust sag and swell thresholds. In
addition, fixed sag and swell thresholds corresponding to definitions found
in IEEE 1159 and EN 50160 independently detect and report sags and
swells. When sags or swells are detected, these models record waveforms
and record detailed event information in the Power Quality Log.
Setup
Basic metering configuration is required:
• All models include fixed thresholds for sag and swell alarming: 90% of
nominal for sags, 110% of nominal for swells, each with a 2% of nominal
hysteresis.
• In the M6 and M8 models, multi-level sag and swell thresholds and
hysteresis are user-configurable and can be adjusted by use of the
Configuration.PowerQuality web page or data table. The parameters are
listed in Table 14. Defaults have been selected to effectively disable userconfigurable sag and swell detection, to avoid creating redundant events in
the Power Quality Log.
88
Rockwell Automation Publication 1426-UM001G-EN-P - November 2014
Power Quality Monitoring
Chapter 5
Table 14 - Multi-level Sag and Swell Configuration Parameters
Parameter
Default
Range
Sag1_Trip_Point_%
0%
0.00…100.00
Sag1_Hysteresis_%
2%
0.00…10.00
Sag2_Trip_Point_%
0%
0.00…100.00
Sag2_Hysteresis_%
2%
0.00…10.00
Sag3_Trip_Point_%
0%
0.00…100.00
Sag3_Hysteresis_%
2%
0.00…10.00
Sag4_Trip_Point_%
0%
0.00…100.00
Sag4_Hysteresis_%
2%
0.00…10.00
Sag5_Trip_Point_%
0%
0.00…100.00
Sag5_Hysteresis_%
2%
0.00…10.00
Swell1_Trip_Point_%
200%
100.00…200.00
Swell1_Hysteresis_%
2%
0.00…10.00
Swell2_Trip_Point_%
200%
100.00…200.00
Swell2_Hysteresis_%
2%
0.00…10.00
Swell3_Trip_Point_%
200%
100.00…200.00
Swell3_Hysteresis_%
2%
0.00…10.00
Swell4_Trip_Point_%
200%
100.00…200.00
Swell4_Hysteresis_%
2%
0.00…10.00
Operation
The power monitor detects a sag when any phase voltage varies below the fixed
sag threshold. A swell is detected when any phase voltage exceeds a swell
threshold.
Sag and swell detection operate on line-to-line voltages in Delta wiring modes,
and on line-to-neutral voltages in Wye and split-phase wiring modes.
Status
The Status.Alarms Data Table provides the following tags for monitoring of sags
and swells. A sag or swell indication continues until 90 seconds has elapsed after
all phase voltages return to the threshold, providing a more reliable indication of
sags and swells when these tags are logged at a 1-minute interval.
• Sag_Indication_Detected
• Swell_Indication_Detected
Sags and swells are also recorded in the alarm log with alarm type = 4 and alarm
code = 1 for sag, 2 for swell. In the M6 and M8 models, sags and swells, their trip
points, and references to their associated waveform records are also recorded in
the Power Quality log.
Rockwell Automation Publication 1426-UM001G-EN-P - November 2014
89
Chapter 5
Power Quality Monitoring
Related Functions
•
•
•
•
Waveform Recording (M6
and M8 model)
Basic Metering setup
Power Quality setup
Waveform Recording
Power Quality Log
The power monitor can capture and record waveforms of all current and voltage
channels.
Setup
Basic metering setup is required. These configuration parameters are found in the
Configuration.PowerQuality tab:
• Capture_Pre_Event_Cycles - pre-event cycles for waveform capture,
range = 5 (default)…10 cycles
• Capture_Post_Event_Cycles - post-event cycles for waveform capture,
range = 2…30 cycles, default 15
These configuration parameters are found in the
Configuration.Communications_Native tab, and specify the synchronized
waveform broadcast parameters:
• WSB_Mode - waveform synchronization broadcast mode. The options are
the following:
– 0 = Disable (default)
– 1 = Enable
• WSB_Port - specified UDP port for WSB feature,
range = 1001 (default)…1009
To enable WSB capture of waveforms, PTP (IEEE 1588) must be enabled and
the power monitor must be synchronized with the PTP clock. Refer to Network
Time Synchronization.
Operation
Waveforms are recorded as a sequence of single-cycle harmonic data and stored in
a compressed file format in the power monitor. The PowerMonitor 5000 unit can
store up to 256 waveform files or a total of 21,600 cycles of waveform data. The
maximum size of a single waveform record is 3600 cycles plus the specified preevent and post-event numbers of cycles.
90
Rockwell Automation Publication 1426-UM001G-EN-P - November 2014
Power Quality Monitoring
Chapter 5
Waveform capture is triggered in three ways:
• Manually, through a command
• Automatically by the power monitor when it detects a sag, swell, or
transient event
• In response to a waveform synchronization broadcast message
Waveform triggers are ignored when insufficient space remains to store a new
waveform.
Waveform files can be cleared by using the Clear_Waveform command. See
Commands on page 92.
The waveform voltage source depends on the Metering_Mode parameter value.
For Demo, split-phase, or Wye modes, phase voltage (V-N) is used. For Delta and
single phase, line-to-line voltages are used. If the metering mode is changed while
a waveform capture is active, the active capture is stopped and saved.
Manual Waveform Recording on Command
A manually triggered waveform recording has a length of 30 cycles plus the preevent and post-event cycles.
Waveform Recording Triggered by Sag, Swell, or Transient
The length of a waveform recording triggered by a power quality event is equal to
the duration of the event (but no more than to 3600 cycles) plus the pre-event
and post-event cycles.
Network Synchronized Waveform Recording
The power monitor can receive and send remote waveform capture triggers by
using Waveform Synchronization Broadcast (WSB) messages through a UDP
port by using native Ethernet communication. The two types of WSB messages
are start waveform and end waveform. Each type of message also contains a
network id (last 3 bytes of the originator's MAC ID), trigger type (sag, swell, or
user command) and timestamp information.
WSB is disabled by default. If WSB is disabled, the unit neither sends nor
receives WSB messages. If WSB is enabled, and PTP is enabled and
synchronized, the unit broadcasts a WSB start message when an internal
triggering event begins and broadcast a WSB end message when the event is
finished. When a unit receives a WSB message through the selected UDP port, it
starts recording a waveform aligned with the WSB start message timestamp,
ending the waveform recording when the WSB end message is received from the
originator. If the WSB end message is lost, the recording ends when 3600 cycles
have been recorded.
If the PTP clock is not synchronized (IsSynchronized value = 0), WSB messages
are not broadcast or acted upon if received.
Rockwell Automation Publication 1426-UM001G-EN-P - November 2014
91
Chapter 5
Power Quality Monitoring
Waveform Capture Application Considerations
The PowerMonitor 5000 captures one waveform record at a time. It is possible
that more than one triggering event can occur in a short time. The starting point
of a waveform capture is determined by the first triggering event and the defined
pre-event cycles. If fewer cycles of data are available, then the first available cycle
is the starting point.
If more than one triggering event occurs during a waveform capture, the capture
duration extends to include the duration of the event that ends latest, plus the
post-trigger cycles. A waveform record that includes more than one triggering
event is referenced in all power quality log records of the triggering events.
Pre-event or post-event cycle settings that are changed during a waveform capture
do not take effect until the next capture. Any change to
Configuration.Metering_Basic immediately ends a waveform capture that is in
process.
In the unlikely event that the PowerMonitor 5000's resources are overstressed so
that it is unable to write a waveform record to non-volatile memory in a timely
fashion, the in-process waveform record ends with the latest cycle captured in
RAM.
Commands
The following waveform-related commands are found in the
Command.System_Registers table.
Command Word Two
Set this command word value to execute the listed action. These are the
selections:
• 14 = Trigger Waveform
• 15 = Clear Waveform
Clear Waveform operates by using the value contained in the tag listed below.
The default value is zero.
Clear Waveform File ID
Waveform File ID, the choices are the following:
• 0 = Clear All
• 1…999 = Clear selected; if the ID does not exist, the command is ignored
92
Rockwell Automation Publication 1426-UM001G-EN-P - November 2014
Power Quality Monitoring
Chapter 5
Waveform File Names
Waveform files are stored with names that contain file identification and a local
timestamp. The file name syntax is:
Waveform_ID_YYYYMMDD_hhmmss_MicroS_HH, where
• ID = the file identifier, used in the Clear_Waveform command
• YYYMMDD_hhmmss = the local date and time stamp of the record,
used to associate the waveform file with a power quality log record
• MicroS = the microsecond timestamp of the record, used for aligning
WSB waveform records
• HH = the UTC hour avoids duplication during daylight-saving time
transition
Retrieving Waveform Records by Using FTP
You can retrieve compressed waveform files by using File Transfer Protocol (ftp)
and native Ethernet communication. A number of ftp clients are available many
at no cost. This example uses Microsoft Internet Explorer as the ftp client. To
access and download waveform files by using a web browser, follow these steps.
1. Open Internet Explorer and browse to the ftp server of the PowerMonitor
5000. The url is ftp://<ip_address>/, where <ip_address> is the one
assigned to the native Ethernet port.
2. Browse to the Waveform directory.
3. Select a waveform file name from the list and click the Save to save the file
in the location of your choosing
IMPORTANT
If you are using FactoryTalk EnergyMetrix software to log data from your
PowerMonitor 5000 unit, the software can automatically download and clear
waveform files shortly after they have been recorded. In this case, the file list in
the ftp client is empty. Use the software to view and manage waveform files.
Rockwell Automation Publication 1426-UM001G-EN-P - November 2014
93
Chapter 5
Power Quality Monitoring
Reading Waveform Records by Using the Data Table Interface
The procedure for reading waveform records is similar to that used for reading
data logging records. Refer to Reading Logging Records by Using the Data Table
Interface on page 99.
Related Functions
• Sag and Swell Detection
• Network Time Synchronization
• Power Quality Log
Application
This applies only to the M6 and M8 models.
94
Rockwell Automation Publication 1426-UM001G-EN-P - November 2014
Chapter
6
Logging
Topic
Page
Logging Overview
96
Waveform Log (M6 and M8 model)
102
Energy Log
106
Data Log
110
Min/Max Log
120
Load Factor Log
126
Time-of-use (TOU) Log
128
Event Log
130
Setpoint Log
134
Alarm Log
136
Power Quality Log (M6 and M8 model)
142
Trigger Data Log (M6 and M8 model)
147
Snapshot Log
150
EN 50160 Weekly and Yearly Logs
152
This section describes the functions of the PowerMonitor 5000 unit. Most
functions require you to configure set-up parameters to align the unit with your
installation and your application requirements. The set-up parameters are listed
by name and described in this section. You can view set-up parameters by using
the PowerMonitor 5000 web page, and when logged in to an Admin account,
make changes to the setup. Set-up parameters are also accessible by using
communication.
Please refer to the Data Tables for additional information on setup parameters
including the following:
• Range of valid values
• Default values
• Data type
Set-up parameters can be found in data tables with names beginning with
‘Configuration’, for instance Configuration.Metering_Basic.
Rockwell Automation Publication 1426-UM001G-EN-P - November 2014
95
Chapter 6
Logging
Logging Overview
Log Type
Model
The PowerMonitor 5000 unit maintains a number of types of internal data logs
and records metering, status, event, and alarm data into these logs as specified in
the logging configuration. This table summarizes the data log types and sizes, and
how their records can be retrieved.
Max Number of Records
Log Data Retrieval Method
Read Selected
Record
Read Records
Sequentially, in
Forward or
Reverse Order
•
•
Web File
Download
FTP File
Download
Waveform log
M6 and M8
21,600 cycles, 256 files
Energy log
All
90 days (129,600 @ 1 minute log rate)
•
•
•
Data log
All
60,000 @ 32 parameters
•
•
•
Min/Max log
All
82 parameters (M5, M6)
207 parameters (M8)
•
•
•
•
•
Load Factor log
All
13 Including Current Month
•
•
•
•
Time-of-Use log
All
13 Including Current Month
•
•
•
•
Alarm log
All
100 Alarms
•
•
•
Event log
All
100 Events
•
•
•
Setpoint log
All
100 Setpoint Events
•
•
•
Power Quality log
M6 and M8
100
•
•
•
Trigger Data log
M6 and M8
3,600 cycles, 60 files
•
•
•
Snapshot log
M6
2270 parameters 1 file
•
•
•
M8 group 0
4447 parameters, 1 file
•
•
•
M8 group 1
1233 parameters, 1 file
•
•
•
M8 group 2
20439 parameters, 1 file
•
•
•
EN50160 Weekly Log
M8
8 including current day
•
•
•
•
EN50160 Yearly Log
M8
13 including current month
•
•
•
•
Setup
The following set-up parameters define the behavior of the data logging functions
in the PowerMonitor 5000 unit, except for the Data Log, which has its own set of
set-up parameters. These parameters are found in the Configuration.Logging
table.
Energy_Log_Interval
Energy_Log_Interval selects how often a record is logged, in minutes:
0 = Disables energy logging
1…60 = Length of logging interval in minutes
-1 = Synchronizes energy logging to the end of the demand interval
96
Rockwell Automation Publication 1426-UM001G-EN-P - November 2014
Logging
Chapter 6
Energy_Log_Mode
Energy_Log_Mode defines the log behavior when full:
0 = Stop logging
1 = Delete oldest energy log file and create a new file
Setpoint_Log_Mode
Setpoint_Log_Mode defines the log behavior when full.
0 = Stop logging
1 = Overwrite oldest record
Time_Of_Use_AutoStore
Time_Of_Use_AutoStore defines the day of the month to start a new time-ofuse log record.
Off_Peak_Days
Off_Peak_Days is a bit field that specifies off-peak days of the week.
Bit 0 = Sunday, bit 1 = Monday, and so forth
MID_Peak_AM_Hours
MID_Peak_PM_Hours
ON_Peak_AM_Hours
ON_Peak_PM_Hours
These parameters are bit fields specifying mid-peak and on-peak hours of the
weekdays not already defined as off-peak. Bit 0 = 12 a.m. …1 a.m.,
bit 1 = 1 a.m.…2 a.m. and so forth.
Load_Factor_Auto_Log_Setting
Load_Factor_Auto_Log_Setting defines the day of month to start a new load
factor log record.
PowerQuality_Log_Mode
This parameter sets the action of the log once it has filled to capacity.
0 = Stop logging
1 = Overwrite oldest record
Rockwell Automation Publication 1426-UM001G-EN-P - November 2014
97
Chapter 6
Logging
Event_Log_Mode
Event_Log_Mode defines the log behavior when full.
0 = Stop logging.
1 = Overwrite oldest record.
Retrieve Logging Results from Web Page
You can retrieve logging results from the PowerMonitor 5000 web page. Browse
to the network address of the power monitor. From the home page, choose the
LoggingResults folder and then the Data_Log or another logging results page.
To retrieve a file, click the filename link. A dialog box opens asking if you wish to
open the file (in Microsoft Excel or another spreadsheet application), or save the
file.
Energy and data logs are stored in multiple files. The date and time of each file’s
first record is embedded in the file name. The date and time of each file’s most
recent record is listed in the file creation date and time columns.
98
Rockwell Automation Publication 1426-UM001G-EN-P - November 2014
Logging
Chapter 6
Download Logging Results by Using FTP
You can retrieve logging results by using File Transfer Protocol (ftp). There are
many ftp clients available, many at no charge. This example uses the Microsoft
Windows command-line ftp client. To access log files by using this client, follow
these steps.
1. From the Windows Start menu, choose Run.
2. Type cmd and click OK.
3. At the prompt, type ftp and press Enter (this time and after each
command).
4. Type ‘open aaa.bbb.ccc.ddd’ (the IP address of the power monitor).
5. Log in with a valid user name and password.
6. To view a directory of log files, type ‘cd LoggingResults’.
7. Type ‘dir’.
8. To download a log file, type ‘get’ followed by a space and the file name.
The file is saved to the folder where the ftp client was started (typically the
Windows desktop).
There are many other ftp commands you can use. We suggest searching the Web
for ‘command-line ftp client’ for more information.
Reading Logging Records by Using the Data Table Interface
The Min/Max, Alarm, Event, Load Factor, Time-of-Use, Power Quality,
Snapshot, EN50160 Weekly, and EN50160 Yearly logs can be retrieved
sequentially, one record at a time, in either forward or reverse order. The Min/
Max, Load Factor, Time-of-Use, EN50160 Weekly, and EN50160 Yearly logs
also support the retrieval of individually specified records.
Rockwell Automation Publication 1426-UM001G-EN-P - November 2014
99
Chapter 6
Logging
The Data, Energy, Waveform, and Trigger Data logs support sequential record
retrieval but require additional configuration steps. See Energy Log on page 106,
Waveform Log (M6 and M8 model) on page 102, Data Log on page 110, and
Trigger Data Log (M6 and M8 model) on page 147 for more information.
IMPORTANT
Sequential record retrieval is available for networks such as DeviceNet that do
not support ftp. Download speed and performance by using sequential record
retrieval is significantly lower than if using ftp.
To initiate this type of log retrieval, a controller or application sets parameter
values in the Configuration.Log_Read table, writes the table to the power
monitor, and then reads the applicable LoggingResults table.
Refer to the Communication chapter for more information.
Selected Log
Selects the log from which to retrieve information. Once a single request has been
made the auto, or sequential, return feature brings back successive records each
time the log is read. Some logs support individual record requests. In the case of
the Data, Energy, Waveform, and Trigger Logs, the data returned are file names of
the log files. These are the choices.
Parameter Value
Results Table
1 = Event Log
LoggingResults.Event_Log (sequential only)
2 = Min/Max Log
LoggingResults.MIN_MAX.Log
3 = Load Factor Log
LoggingResults.LoadFactor.Log
4 = Time of Use Log
LoggingResults.TOU.Log
5 = Setpoint Log
LoggingResults.Setpoint_Log (sequential only)
6 = Alarm Log
LoggingResults.Alarm_Log (sequential only)
7 = Data Log File List
LoggingResults.DataLog_FileName
8 = Energy Log File List
LoggingResults.EnergyLog_FileName
9 = Metering Snapshot File
LoggingResults.Snapshot_Log (M6 and M8 model)
10 = Power Quality Log
LoggingResults.Power_Quality_Log (M6 and M8 model)
11 = Waveform Log File
LoggingResults.WaveformFileName (M6 and M8 model)
12 = Trigger Data File
LoggingResults.TriggerData_Log (M6 and M8 model)
13 = Trigger Header File
LoggingResults.TriggerData_Header (M6 and M8 model)
14 = EN50160 Weekly Log
LoggingResults.EN50160_Weekly_Log (M8 only)
15 = EN50160 Yearly Log
LoggingResults.EN50160_Yearly_Log (M8 only)
Requests not supported by the power monitor model are ignored.
100
Rockwell Automation Publication 1426-UM001G-EN-P - November 2014
Logging
Chapter 6
Chronology of Auto Return Data
Selects the chronological order of sequentially retrieved records. This parameter
is ignored if a specific record is requested from the Min/Max, Load Factor, or
TOU log. These are the choices:
0 = Reverse direction (most recent record first)
1 = Forward direction (oldest record first)
Min/Max Record to be Returned
These are the choices:
0 = Use sequential return in the order selected
1…207 = Retrieve the selected record. See the Min_Max_Parameter table
for the list
Load Factor or TOU Record to be Returned
These are the choices:
0 = Use sequential return in the order selected
1 = Retrieve the current active record
2 = Retrieve the latest closed monthly record
…
13 = Retrieve the earliest closed monthly record
EN 50160 Weekly Record to be Returned
These are the choices:
0 = Use sequential return in the order selected
1 = Retrieve the current active record
2 = Retrieve the latest closed daily record
…
8 = Retrieve the earliest closed daily record
EN 50160 Yearly Record to be Returned
These are the choices:
0 = Use sequential return in the order selected
1 = Retrieve the current active record
2 = Retrieve the latest closed monthly record
…
13 = Retrieve the earliest closed monthly record
Rockwell Automation Publication 1426-UM001G-EN-P - November 2014
101
Chapter 6
Logging
Waveform Log (M6 and M8
model)
You can retrieve uncompressed waveform records by using the data table interface
and optional DeviceNet or ControlNet network communication.
IMPORTANT
When using native Ethernet network communication, retrieving waveforms by
using ftp provides much faster results.
Records retrieved by using the data table interface are single-cycle harmonic
magnitudes and angles from DC to the 63rd (DC to the 127th for the M8
model), returned as REAL values in a sequence of data table reads and writes.
IMPORTANT
Waveform records returned through the data table interface are not
compressed.
To display the record as a waveform, the returned data must be appropriately
organized by the client and an inverse FFT performed to obtain a series of timedomain voltage and current data. That data can be plotted in a graphic format.
Waveform Data Table Retrieval
A controller or application can sequentially retrieve waveform records. Follow
these tasks in this process to retrieve waveform records.
1. Read the number of waveform files from the Statistics.Logging table.
The Statistics.Logging table contains the following waveform information:
• Element 13, the number of waveform cycles
• Element 14, the number of waveform files
102
Rockwell Automation Publication 1426-UM001G-EN-P - November 2014
Logging
Chapter 6
2. Write the Configuration.Log_Read table with Selected Log = 11.
The Configuration.Log_Read table contains the following elements:
• Element 0. Write a value of 11 to request the next waveform file name
• Element 1: Write a 0 to return the most recent file name first or a 1 to
return the oldest file name first
3. Read the waveform file name from the
LoggingResults. WaveformFileName Data Table one or more times until
the desired waveform file name is returned.
The LoggingResults. WaveformFileName Data Table returns a string
containing the requested file name. The file name syntax is described
above in Waveform File Names on page [nn - ed. Please update and link].
The Configuration.WaveformFileName Data Table contains the file
selection string
‘Waveform_ID_YYYYMMDD_HHMMSS_MicroS_hh/Cycle/
MagOrAng/Channel/iOrder’. Options include the following:
• The desired waveform file name from which to return records
• Appended selection switches:
– Cycle = present cycle offset to be returned; range = 0 … total cycles
in the waveform -1
– MagOrAng; 0 = magnitude data, 1 = angle data
– Channel = the selected channel to return; range = 0 (V1)…7 (I4)
– Order = the range of harmonic components to return; 0 = DC…31,
1 = 32…63
Following the write to the Configuration.WaveformFileName Data Table,
each read of the LoggingResults. Waveform_Log Data Table returns a
successive portion of the waveform record. The appended selection
switches in the filename written to the Configuration.WaveformFileName
Data Table define the first record retrieved in the sequence of data
retrieval. If no selection switches are included with the filename, the first
record returned is the waveform header.
The sequence of waveform data retrieval proceeds according to the
following logic.
For Cycle 0 to N
For MagOrAng = Magnitude to Angle
For Channel = 0 to 7
For iOrder = 0 to 3
Next iOrder
Next Channel
Next MagOrAng
Next Cycle
4. Write the selected file name into the Configuration.WaveformFileName
Data Table.
5. Perform sequential reads of the LoggingResults. Waveform_Log Data
Table and store the results in a suitable location.
Rockwell Automation Publication 1426-UM001G-EN-P - November 2014
103
Chapter 6
Logging
Waveform Data Records
The LoggingResults. Waveform_Log Data Table contains the most recent record
read from the selected waveform file, and contains the following REAL elements.
Element Number
Tag Name
Description
0
Record_Indicator
Indicates the significance of the data in the record
0 = No record returned
1 = the record contains parameter values
2 = the record contains general information of the log file being retrieved, reference to each item
description in the data table;
3 = log file not found.
1
Timestamp_Date
Date of cycle collection MMDDYY
2
Timestamp_Time
Time of cycle collection hhmmss
3
Microsecond_Stamp
Microsecond of cycle collection
4
File_ID
The selected file ID
5
Total_Cycles
Total cycles of the waveform file
6
Cycle_Returned
The current returned cycles
7
Frequency
The frequency of average cycle
8
Mag_Angle
The returned value is magnitude or angle
9
Channel
The channel returned
10
Order
The order of returned values
11
X_(0 + Order * 32)
12
X_(1 + Order * 32)
The returned value X_(h) where X_(h) = the RMS magnitude or angle of the spectral component h. Units are
Volts, Amps or degrees, depending on the value of Channel and Mag_Angle elements
…
…
42
X_(31 + Order * 32)
104
Rockwell Automation Publication 1426-UM001G-EN-P - November 2014
Logging
Chapter 6
Waveform Header
If the value of Record_Indicator is 2, the LoggingResults. Waveform_Log Data
Table returns the following information. The data type returned is REAL,
although some elements (MAC ID) are better interpreted as UINT32.
Element Number
Tag Name
Description
0
Record_Indicator
Indicates the significance of the data in the record 2 = the record contains general information of the log file
being retrieved, reference to each item description in the data table;
1
File_ID
The selected file ID
2
Waveform_Identifier_High
3
Waveform_Identifier_Low
File ID (Int16)+ Waveform Identifier(Int48)
typedef struct
{
unsigned short sFileID; //this id is used for user selection, 1…256
unsigned short sWaveformID; //the Waveform id highest 2 bytes
unsigned long lWaveformID; //the Waveform id Lowest 4 bytes
}WAVEFORM_ID;
4
Revision
Waveform file format revision
5
Compression
Indicate compression or not and the compression type, high 8 bits is compression flag , low 8 bits is
compression type
6
Metering_Mode
Metering mode, indicates voltages are L-N or L-L
7
Mac_Address_High
Mac address of power monitor - high 3 bytes
8
Mac_Address_High
Low 3 bytes
9…42
Reserved
Reserved for future use
If the waveform retrieval is interrupted for more than 60 seconds, the sequence
needs to be reinitialized by writing the Configuration.WaveformFileName Data
Table. Appending the filename with selection switches configured for the next
record in sequence begins the retrieval where it left off before the interruption.
Refer to Waveform Recording (M6 and M8 model) on page 90 for more
information about waveform setup, operation, commands, related functions, and
retrieval via ftp and the native Ethernet port.
Rockwell Automation Publication 1426-UM001G-EN-P - November 2014
105
Chapter 6
Logging
Energy Log
The energy log stores energy, demand, and scaled status input counter values at a
time interval defined in parameter Energy_Log_Interval. The power monitor
can store up to 90 days of energy log data. The default logging interval is 15
minutes.
Energy Log Results Files
The PowerMonitor 5000 unit stores the energy log in multiple commaseparated-value (.csv) files, and selects a file duration based on the value of the
Energy_Log_Interval parameter.
Interval Setting (minutes)
Log Duration
File End Date
Maximum Records
1
Day
Sunday, 00:00:00
1440
2 or above
Week
1st day of a new month,
00:00:00
5040
In addition, the active energy log file is closed and a new file is created when any
of the following events occur:
• Initial powerup of the power monitor
• Subsequent powerup, if the active energy log file is older than the expected
duration
• If the Energy_Log_Interval parameter is changed
The Energy_Log_Mode parameter determines what happens when the log
contains 90 days of data:
• If set to 0 = Stop Logging, no new energy log files are created and no more
energy data is logged.
• If set to 1 = Delete oldest energy log file and create a new file, a new file is
created and energy logging continues uninterrupted. This is the default
setting.
File Names
Energy log file names have the following semantics:
EnergyLog_YYYYMMDD_hhmm_HH.csv
Where:
• YYYYMMDD_hhmm - the file creation date and time
• HH - UTC hour avoids duplication during daylight-saving time
transition
106
Rockwell Automation Publication 1426-UM001G-EN-P - November 2014
Logging
Chapter 6
Logged Parameters
The energy log records a predefined set of parameters. The first record in each
file is a header that indicates the tag name of each parameter. Each subsequent
record is a structure of REAL elements containing the following parameters.
Table 15 - Energy Log Parameters
Element
Tag Name
Description
0
Record_Indicator
Indicate meanings of the data in the record
1
Energy_ Record_Identifier
Internal unique record number
2
Energy_Timestamp_Year
The date and time of the record
3
Energy_Timestamp_Mth_Day
4
Energy_Timestamp_Hr_Min
5
Energy_Timestamp Sec_ms
6
Status_1_Count_xM
7
Status_1_Count_x1
8
Status_2_Count_xM
9
Status_2_Count_x1
10
Status_3_Count_xM
11
Status_3_Count_x1
12
Status_4_Count_xM
13
Status_4_Count_x1
14
GWh_Fwd
15
kWh_Fwd
16
GWh_Rev
17
kWh_Rev
18
GWh_Net
19
kWh_Net
20
GVARH_Fwd
21
kVARh_Fwd
22
GVARH_Rev
23
kVARh_Rev
24
GVARH_Net
25
kVARh_Net
26
GVAh
27
kVAh
28
kW_Demand
29
kVAR_Demand
30
kVA_Demand
31
Demand_PF
32
Projected_kW_Demand
33
Projected_kVAR_Demand
34
Projected_kVA_Demand
Scaled Status input 1 counter
Scaled Status input 2 counter
Scaled Status input 3 counter
Scaled Status input 4 counter
Forward real energy
Reverse real energy
Net real energy
Forward reactive energy
Reverse reactive energy
Net reactive energy
Net apparent energy
The average real, reactive, apparent power and power
factor during the last demand period
The projected average real, reactive and apparent
power for the current demand period
Rockwell Automation Publication 1426-UM001G-EN-P - November 2014
107
Chapter 6
Logging
Energy Log Single Record Retrieval
A controller or application can sequentially retrieve records from the Energy Log
files by following the process described in this section, following these general
tasks.
1. Read the number of log files from the Statistics.Logging table.
2. Write the Configuration.Log_Read table and read the filename from the
LoggingResults.EnergyLog_FileName table until the desired log file is
selected.
3. Write the selected file name into the Configuration.EnergyLogFile table.
4. Perform sequential reads of the LoggingResults.Energy_Log table and
store the results in a suitable location.
The Statistics.Logging table contains the following Energy Log information:
• Element 5 and 6, the number of Energy Log records
• Element 10, the number of Energy Log files
The Configuration.Log_Read table contains the following elements:
• Element 0. Write a value of 8 to request the next Energy Log file name
• Element 1: Write a 0 to return the most recent file name first or a 1 to
return the oldest file name first
The LoggingResults.EnergyLog_FileName table returns a string containing the
requested file name. The file name contains the starting date and time of the log
file, as described above in File Names on page 106.
The Configuration.EnergyLogFile table contains the file selection string.
Options include the following:
• The desired Energy Log file name from which to return records
• Alternately, ‘allfiles’, to return records from all Energy Log files
• An appended chronology switch:
– ‘/r’ to begin with the most recent record
– ‘/f ’ to return the oldest record first (default if no chronology switch is
appended)
108
Rockwell Automation Publication 1426-UM001G-EN-P - November 2014
Logging
Chapter 6
For example, writing the string ‘EnergyLog_20130112_0630_11/r’ selects the
file EnergyLog_20130112_0630_11. Successive reads of the
LoggingResults.Energy_Log table return sequential energy log records, starting
with the last record.
The LoggingResults.Energy_Log table contains the most recent record read from
the selected energy log file, and contains the following elements:
• Element 0 indicates the type of record
Options are:
– 0 = No record returned
– 1 = Parameter values
– 2 = Reserved
– 3 = Log file not found
• Element 1 returns a unique record ID.
• Elements 2…5 return the date and time stamp of the record
• Elements 6…34 return parameter values.
Parameter values are listed in the order shown in Energy Log Parameters on
page 107.
Setup
The Energy Log requires the following to be configured:
• Basic metering setup
• Logging configuration
• Date and Time setup
Commands
Clear energy log
Related Functions
• Energy Metering, Demand Metering
• Data Log
• Configuration lock
Rockwell Automation Publication 1426-UM001G-EN-P - November 2014
109
Chapter 6
Logging
Data Log
The data log stores user-selected values at a time interval defined in parameter
Data_Logging_Interval. The power monitor can store up to 60,000 records of up
to 32 parameters. The default logging interval is 15 minutes.
Setup
The Data Log requires the following to be configured:
• Basic metering setup
• Date and Time setup
The first 22 parameters in the Data Log are configured by default, as listed in the
Logged Parameters table. Further configuration of the Data Log is not required if
the default selections satisfy your data logging needs.
To customize your Data Log, change the following set-up parameters, which
define the behavior of the Data Log. These parameters are found in the
Configuration.Data_Log table.
Data_Logging_Interval
Data_Logging_Interval defines the logging interval in seconds. These are the
selections:
0 = Disables data logging
-1 = synchronize log with demand period
1…3600 = User-selected data logging interval. Default is 900 (15 minutes)
Logging Mode
Logging Mode selects how records are saved.
0 = Fill and stop recording when log is full.
1 = Overwrite when log is full starting with the earliest record.
DataLog_Parameter_1
DataLog_Parameter_2
…
DataLog_Parameter_32
These parameters define the set of records that are maintained in the data log.
The Configuration.Data_Log web page includes the descriptions of the default
selections for each parameter, even if the selections have been changed from their
default value.
110
Rockwell Automation Publication 1426-UM001G-EN-P - November 2014
Logging
Chapter 6
Data Log Parameter List
Table 16 - Data Log Parameter List
Parameter
Number
Parameter Tag Name
Units
0
None
1
V1_N_Volts
V
2
V2_N_Volts
V
3
V3_N_Volts
V
4
VGN_N_Volts
V
5
Avg_V_N_Volts
V
6
V1_V2_Volts
V
7
V2_V3_Volts
V
8
V3_V1_Volts
V
9
Avg_VL_VL_Volts
V
10
I1_Amps
A
11
I2_Amps
A
12
I3_Amps
A
13
I4_Amps
A
14
Avg_Amps
A
15
Frequency_Hz
Hz
16
L1_kW
kW
17
L2_kW
kW
18
L3_kW
kW
19
Total_kW
kW
20
L1_kVAR
kVAR
21
L2_kVAR
kVAR
22
L3_kVAR
kVAR
23
Total_kVAR
kVAR
24
L1_kVA
kVA
25
L2_kVA
kVA
26
L3_kVA
kVA
27
Total_kVA
kVA
28
L1_True_PF
%
29
L2_True_PF
%
30
L3_True_PF
%
31
Avg_True_PF
%
32
L1_Disp_PF
%
33
L2_Disp_PF
%
34
L3_Disp_PF
%
35
Avg_Disp_PF
%
36
L1_PF_Lead_Lag_Indicator
-
Rockwell Automation Publication 1426-UM001G-EN-P - November 2014
111
Chapter 6
Logging
Table 16 - Data Log Parameter List
112
Parameter
Number
Parameter Tag Name
Units
37
L2_PF_Lead_Lag_Indicator
-
38
L3_PF_Lead_Lag_Indicator
-
39
Total_PF_Lead_Lag_Indicator
-
40
V1_Crest_Factor
-
41
V2_Crest_Factor
-
42
V3_Crest_Factor
-
43
V1_V2_Crest_Factor
-
44
V2_V3_Crest_Factor
-
45
V3_V1_Crest_Factor
-
46
I1_Crest_Factor
-
47
I2_Crest_Factor
-
48
I3_Crest_Factor
-
49
I4_Crest_Factor
-
50
V1_IEEE_THD_%
%
51
V2_IEEE_THD_%
%
52
V3_IEEE_THD_%
%
53
VGN_IEEE_THD_%
%
54
Avg_IEEE_THD_V_%
%
55
V1_V2_IEEE_THD_%
%
56
V2_V3_IEEE_THD_%
%
57
V3_V1_IEEE_THD_%
%
58
Avg_IEEE_THD_V_V_%
%
59
I1_IEEE_THD_%
%
60
I2_IEEE_THD_%
%
61
I3_IEEE_THD_%
%
62
I4_IEEE_THD_%
%
63
Avg_IEEE_THD_I_%
%
64
V1_IEC_THD_%
%
65
V2_IEC_THD_%
%
66
V3_IEC_THD_%
%
67
VGN_IEC_THD_%
%
68
Avg_IEC_THD_V_%
%
69
V1_V2_IEC_THD_%
%
70
V2_V3_IEC_THD_%
%
71
V3_V1_IEC_THD_%
%
72
Avg_IEC_THD_V_V_%
%
73
I1_IEC_THD_%
%
74
I2_IEC_THD_%
%
75
I3_IEC_THD_%
%
Rockwell Automation Publication 1426-UM001G-EN-P - November 2014
Logging
Chapter 6
Table 16 - Data Log Parameter List
Parameter
Number
Parameter Tag Name
Units
76
I4_IEC_THD_%
%
77
Avg_IEC_THD_I_%
%
78
I1_K_Factor
-
79
I2_K_Factor
-
80
I3_K_Factor
-
81
Pos_Seq_Volts
V
82
Neg_Seq_Volts
V
83
Zero_Seq_Volts
V
84
Pos_Seq_Amps
A
85
Neg_Seq_Amps
A
86
Zero_Seq_Amps
A
87
Voltage_Unbalance_%
%
88
Current_Unbalance_%
%
89
V1_N_Volts_DC_H_RMS
V
90
V1_N_Volts_1st_H_RMS
V
91
V1_N_Volts_2nd_H_RMS
V
92
V1_N_Volts_3rd_H_RMS
V
93
V1_N_Volts_4th_H_RMS
V
94
V1_N_Volts_5th_H_RMS
V
95
V1_N_Volts_6th_H_RMS
V
96
V1_N_Volts_7th_H_RMS
V
97
V1_N_Volts_8th_H_RMS
V
98
V1_N_Volts_9th_H_RMS
V
99
V1_N_Volts_10th_H_RMS
V
100
V1_N_Volts_11th_H_RMS
V
101
V1_N_Volts_12th_H_RMS
V
102
V1_N_Volts_13th_H_RMS
V
103
V1_N_Volts_14th_H_RMS
V
104
V1_N_Volts_15th_H_RMS
V
105
V1_N_Volts_16th_H_RMS
V
106
V1_N_Volts_17th_H_RMS
V
107
V1_N_Volts_18th_H_RMS
V
108
V1_N_Volts_19th_H_RMS
V
109
V1_N_Volts_20th_H_RMS
V
110
V1_N_Volts_21st_H_RMS
V
111
V1_N_Volts_22nd_H_RMS
V
112
V1_N_Volts_23rd_H_RMS
V
113
V1_N_Volts_24th_H_RMS
V
114
V1_N_Volts_25th_H_RMS
V
Rockwell Automation Publication 1426-UM001G-EN-P - November 2014
113
Chapter 6
Logging
Table 16 - Data Log Parameter List
114
Parameter
Number
Parameter Tag Name
Units
115
V1_N_Volts_26th_H_RMS
V
116
V1_N_Volts_27th_H_RMS
V
117
V1_N_Volts_28th_H_RMS
V
118
V1_N_Volts_29th_H_RMS
V
119
V1_N_Volts_30th_H_RMS
V
120
V1_N_Volts_31st_H_RMS
V
121
V2_N_Volts_DC_H_RMS
V
122
V2_N_Volts_1st_H_RMS
V
123
V2_N_Volts_2nd_H_RMS
V
124
V2_N_Volts_3rd_H_RMS
V
125
V2_N_Volts_4th_H_RMS
V
126
V2_N_Volts_5th_H_RMS
V
127
V2_N_Volts_6th_H_RMS
V
128
V2_N_Volts_7th_H_RMS
V
129
V2_N_Volts_8th_H_RMS
V
130
V2_N_Volts_9th_H_RMS
V
131
V2_N_Volts_10th_H_RMS
V
132
V2_N_Volts_11th_H_RMS
V
133
V2_N_Volts_12th_H_RMS
V
134
V2_N_Volts_13th_H_RMS
V
135
V2_N_Volts_14th_H_RMS
V
136
V2_N_Volts_15th_H_RMS
V
137
V2_N_Volts_16th_H_RMS
V
138
V2_N_Volts_17th_H_RMS
V
139
V2_N_Volts_18th_H_RMS
V
140
V2_N_Volts_19th_H_RMS
V
141
V2_N_Volts_20th_H_RMS
V
142
V2_N_Volts_21st_H_RMS
V
143
V2_N_Volts_22nd_H_RMS
V
144
V2_N_Volts_23rd_H_RMS
V
145
V2_N_Volts_24th_H_RMS
V
146
V2_N_Volts_25th_H_RMS
V
147
V2_N_Volts_26th_H_RMS
V
148
V2_N_Volts_27th_H_RMS
V
149
V2_N_Volts_28th_H_RMS
V
150
V2_N_Volts_29th_H_RMS
V
151
V2_N_Volts_30th_H_RMS
V
152
V2_N_Volts_31st_H_RMS
V
153
V3_N_Volts_DC_H_RMS
V
Rockwell Automation Publication 1426-UM001G-EN-P - November 2014
Logging
Chapter 6
Table 16 - Data Log Parameter List
Parameter
Number
Parameter Tag Name
Units
154
V3_N_Volts_1st_H_RMS
V
155
V3_N_Volts_2nd_H_RMS
V
156
V3_N_Volts_3rd_H_RMS
V
157
V3_N_Volts_4th_H_RMS
V
158
V3_N_Volts_5th_H_RMS
V
159
V3_N_Volts_6th_H_RMS
V
160
V3_N_Volts_7th_H_RMS
V
161
V3_N_Volts_8th_H_RMS
V
162
V3_N_Volts_9th_H_RMS
V
163
V3_N_Volts_10th_H_RMS
V
164
V3_N_Volts_11th_H_RMS
V
165
V3_N_Volts_12th_H_RMS
V
166
V3_N_Volts_13th_H_RMS
V
167
V3_N_Volts_14th_H_RMS
V
168
V3_N_Volts_15th_H_RMS
V
169
V3_N_Volts_16th_H_RMS
V
170
V3_N_Volts_17th_H_RMS
V
171
V3_N_Volts_18th_H_RMS
V
172
V3_N_Volts_19th_H_RMS
V
173
V3_N_Volts_20th_H_RMS
V
174
V3_N_Volts_21st_H_RMS
V
175
V3_N_Volts_22nd_H_RMS
V
176
V3_N_Volts_23rd_H_RMS
V
177
V3_N_Volts_24th_H_RMS
V
178
V3_N_Volts_25th_H_RMS
V
179
V3_N_Volts_26th_H_RMS
V
180
V3_N_Volts_27th_H_RMS
V
181
V3_N_Volts_28th_H_RMS
V
182
V3_N_Volts_29th_H_RMS
V
183
V3_N_Volts_30th_H_RMS
V
184
V3_N_Volts_31st_H_RMS
V
Rockwell Automation Publication 1426-UM001G-EN-P - November 2014
115
Chapter 6
Logging
Data Log Results Files
The PowerMonitor 5000 unit stores the data log in multiple comma-separatedvalue (.csv) files, and selects a file duration based on the value of the
Data_Logging_Interval parameter.
Interval, Seconds
Log File Duration
File End Date
Maximum Records
1~30
Hour
New hour, xx:00:00
(hh:mm:ss)
3600
31~90
Day
New day, 00:00:00
(hh:mm:ss)
2788
>90
Week
Sunday of a week, 00:00:00
(hh:mm:ss)
6646
In addition, the active data log file is closed and a new file is created when any of
the following events occur:
• Initial powerup of the power monitor
• Subsequent powerup, if the active data log file is older than the expected
duration
• If the Data_Logging_Interval or any other data log parameter is changed
The Data_Log_Mode parameter determines what happens when the log contains
60,000 records:
• If set to 0 = Fill and stop recording when log is full, no new data log files
are created and no more data is logged.
• If set to 1 = Overwrite when log is full starting with the earliest record, a
new file is created and data logging continues uninterrupted. This is the
default setting.
File Names
Data log file names have the following semantics:
DataLog_YYYYMMDD_hhmm_HH.csv, where:
• YYYYMMDD_hhmm - the file creation date and time
• HH - UTC hour avoids duplication during daylight-saving time transition
116
Rockwell Automation Publication 1426-UM001G-EN-P - November 2014
Logging
Chapter 6
Logged Parameters
The data log records a user-selected set of parameters. The first record in each file
is a header that indicates the tag name of each logged parameter. Each subsequent
record is a structure of REAL elements containing the following parameters.
Table 17 - Data Log Logged Parameters
Element
Tag Name
Description
0
Record_Indicator
Indicate meanings of the data in the record
1
Data_ Record_Identifier
Data log record time stamp
2
Data _Timestamp_Year
3
Data _Timestamp_Month_Day
4
Data _Timestamp_Hour_Minute
5
Data _Timestamp Sec_ms
6
DataLog_Parameter_1
(Avg_V_N_Volts)
7
DataLog_Parameter_2
(Avg_VL_VL_Volts)
8
DataLog_Parameter_3 (Avg_Amps)
9
DataLog_Parameter_4
(Frequency_Hz)
10
DataLog_Parameter_5 (Total_kW)
11
DataLog_Parameter_6 (Total_kVAR)
12
DataLog_Parameter_7 (Total_kVA)
13
DataLog_Parameter_8
(Total_PF_Lead_Lag_Indicator)
14
DataLog_Parameter_9
(Avg_True_PF)
15
DataLog_Parameter_10
(Avg_Disp_PF)
16
DataLog_Parameter_11
(Avg_IEEE_THD_V_%)
17
DataLog_Parameter_12
(Avg_IEEE_THD_V_V_%)
18
DataLog_Parameter_13
(Avg_IEEE_THD_I_%)
19
DataLog_Parameter_14
(Avg_IEC_THD_V_%)
20
DataLog_Parameter_15
(Avg_IEC_THD_V_V_%)
21
DataLog_Parameter_16
(Avg_IEC_THD_I_%)
22
DataLog_Parameter_17
(Voltage_Unbalance_%)
23
DataLog_Parameter_18
(Current_Unbalance_%)
24
DataLog_Parameter_19
25
DataLog_Parameter_20
Rockwell Automation Publication 1426-UM001G-EN-P - November 2014
Values of user-selected or default parameters
(Default parameter selection tag name)
117
Chapter 6
Logging
Table 17 - Data Log Logged Parameters
Element
Tag Name
Description
26
DataLog_Parameter_21
Values of user-selected or default parameters
27
DataLog_Parameter_22
28
DataLog_Parameter_23
29
DataLog_Parameter_24
30
DataLog_Parameter_25
31
DataLog_Parameter_26
32
DataLog_Parameter_27
33
DataLog_Parameter_28
34
DataLog_Parameter_29
35
DataLog_Parameter_30
36
DataLog_Parameter_31
37
DataLog_Parameter_32
Data Log Single Record Retrieval
A controller or application can sequentially retrieve records from the Data Log
files by following the process described in this section, following these general
tasks.
1. Read the number of log files from the Statistics.Logging table.
2. Write the Configuration.Log_Read table and read the filename from the
LoggingResults.DataLog_FileName table until the desired log file is
selected.
3. Write the selected file name into the Configuration.DataLogFile table.
4. Perform sequential reads of the LoggingResults.Data_Log table and store
the results in a suitable location.
The Statistics.Logging file contains the following Data Log information:
• Element 7 and 8, the number of Data Log records
• Element 9, the number of Data Log files
The Configuration.Log_Read table contains the following elements:
• Element 0. Write a value of 7 to request the next Data Log file name
• Element 1: Write a 0 to return the most recent file name first or a 1 to
return the oldest file name first
The LoggingResults.DataLog_FileName table returns a string containing the
requested file name. The file name contains the starting date and time of the log
file, as described in File Names on page 116
118
Rockwell Automation Publication 1426-UM001G-EN-P - November 2014
Logging
Chapter 6
The Configuration.DataLogFile table contains the file selection string. Options
include the following:
• The desired Data Log file name from which to return records
• Alternately, ‘allfiles’, to return records from all Data Log files
• An appended chronology switch:
– ‘/r’ to begin with the most recent record
– ‘/f ‘to return the oldest record first (default if no chronology switch is
appended)
For example, writing the string ‘DataLog_20130112_0630_11/r’ selects the file
DataLog_20130112_0630_11. Successive reads of the
LoggingResults.Data_Log table return sequential data log records, starting with
the last record.
The LoggingResults.Data_Log table contains the most recent record read from
the selected data log file, and contains the following elements.
• Element 0 indicates the type of record. Options are:
– 0 = No record returned
– 1 = Parameter values
– 2 = Parameter index values
– 3 = Log file not found
• Element 1 returns a unique record ID or the total number of records,
depending on the value of Element 0.
• Elements 2…5 return the date and time stamp of the record
• Elements 6…37 return parameter values or parameter index values
depending on the value of Element 0.
Parameter index values are associated with parameter tag names as listed in the
Data Log Parameter List on page 111.
Commands
Clear data log
Related Functions
• Voltage, current, frequency, power metering
• Data log
• Configuration lock
Rockwell Automation Publication 1426-UM001G-EN-P - November 2014
119
Chapter 6
Logging
Min/Max Log
The PowerMonitor 5000 unit records time-stamped minimum and maximum
values for all real-time metering data (except for energy data).
Min/Max Log Results
Min/max log records can be retrieved from the PowerMonitor 5000 web page or
ftp server. The power monitor generates the log file at the time of the request.
Records can also be retrieved individually or sequentially by using the data table
interface.
File Name
The min/max log is named Min_Max_Log.csv.
Logged Parameters
The first record in the min/max log file is a header listing the attribute names for
each logged parameter.
Table 18 - Min/Max Log Logged Parameters
Attribute Name
Description
MinMax_Parameter_Number
The number of the parameter from the MIN_MAX parameter list.
MIN_Value
The minimum value recorded since the last MIN_MIX clear.
MAX_Value
The maximum value recorded since the last MIN_MIX clear.
Timestamp_MIN_Year
The year at which this MIN record was logged.
Timestamp_MIN_Mth_Day
The month and day this MIN record was logged.
Timestamp_MIN_Hr_Min
The hour and minute this MIN record was logged.
Timestamp_MIN_Sec_ms
The seconds and milliseconds this MIN record was logged.
Timestamp_MAX_Year
The year at which this MAX record was logged.
Timestamp_MAX_Mth_Day
The month and day this MAX record was logged.
Timestamp_MAX_Hr_Min
The hour and minute this MAX record was logged.
Timestamp_MAX_Sec_ms
The seconds and milliseconds this MAX record was logged.
Each subsequent record is a structure of REAL elements containing the attributes
listed above for each of the metering parameters listed below. Parameters 83…207
are supported by the M8 model only.
Table 19 - Min/Max Log Parameter Attributes
120
Parameter No.
Parameter name
Units
1
V1_N_Volts
V
2
V2_N_Volts
V
3
V3_N_Volts
V
4
V4_N_Volts
V
Rockwell Automation Publication 1426-UM001G-EN-P - November 2014
Logging
Chapter 6
Table 19 - Min/Max Log Parameter Attributes
Parameter No.
Parameter name
Units
5
Avg_V_N_Volts
V
6
V1_V2_Volts
V
7
V2_V3_Volts
V
8
V3_V1_Volts
V
9
Avg_VL_VL_Volts
V
10
I1_Amps
A
11
I2_Amps
A
12
I3_Amps
A
13
I4_Amps
A
14
Avg_Amps
A
15
Frequency_Hz
Hz
16
L1_kW
kW
17
L2_kW
kW
18
L3_kW
kW
19
Total_kW
kW
20
L1_kVAR
kVAR
21
L2_kVAR
kVAR
22
L3_kVAR
kVAR
23
Total_kVAR
kVAR
24
L1_kVA
kVA
25
L2_kVA
kVA
26
L3_kVA
kVA
27
Total_kVA
kVA
28
L1_True_PF_Leading
%
29
L2_True_PF_Leading
%
30
L3_True_PF_Leading
%
31
Avg_True_PF_Leading
%
32
L1_True_PF_Lagging
%
33
L2_True_PF_Lagging
%
34
L3_True_PF_Lagging
%
35
Avg_True_PF_Lagging
%
36
L1_Disp_PF
%
37
L2_Disp_PF
%
38
L3_Disp_PF
%
39
Avg_Disp_PF
%
40
V1_Crest_Factor
-
41
V2_Crest_Factor
-
42
V3_Crest_Factor
-
43
I1_Crest_Factor
-
Rockwell Automation Publication 1426-UM001G-EN-P - November 2014
121
Chapter 6
Logging
Table 19 - Min/Max Log Parameter Attributes
122
Parameter No.
Parameter name
Units
44
I2_Crest_Factor
-
45
I3_Crest_Factor
-
46
I4_Crest_Factor
-
47
V1_IEEE_THD_%
%
48
V2_IEEE_THD_%
%
49
V3_IEEE_THD_%
%
50
VGN_IEEE_THD_%
%
51
Avg_IEEE_THD_V_%
%
52
I1_IEEE_THD_%
%
53
I2_IEEE_THD_%
%
54
I3_IEEE_THD_%
%
55
I4_IEEE_THD_%
%
56
Avg_IEEE_THD_I_%
%
57
V1_IEC_THD_%
%
58
V2_IEC_THD_%
%
59
V3_IEC_THD_%
%
60
VGN_IEC_THD_%
%
61
Avg_IEC_THD_V_%
%
62
I1_IEC_THD_%
%
63
I2_IEC_THD_%
%
64
I3_IEC_THD_%
%
65
I4_IEC_THD_%
%
66
Avg_IEC_THD_I_%
%
67
I1_K_Factor
-
68
I2_K_Factor
-
69
I3_K_Factor
-
70
Pos_Seq_Volts
V
71
Neg_Seq_Volts
V
72
Zero_Seq_Volts
V
73
Pos_Seq_Amps
A
74
Neg_Seq_Amps
A
75
Zero_Seq_Amps
A
76
Voltage_Unbalance_%
%
77
Current_Unbalance_%
%
78
kW Demand
kW
79
kVAR Demand
kVAR
80
kVA Demand
kVA
81
Demand PF
%
82
Demand Amperes
A
Rockwell Automation Publication 1426-UM001G-EN-P - November 2014
Logging
Chapter 6
Table 19 - Min/Max Log Parameter Attributes
Parameter No.
Parameter name
Units
83
200mS_V1_N_Magnitude
V
84
200mS_V2_N_Magnitude
V
85
200mS_V3_N_Magnitude
V
86
200mS_VN_G_Magnitude
V
87
200mS_VN_Ave_Magnitude
V
88
200mS_V1_V2_Magnitude
V
89
200mS_V2_V3_Magnitude
V
90
200mS_V3_V1_Magnitude
V
91
200mS_VV_Ave_Magnitude
V
92
200mS_I1_Amps_Magnitude
A
93
200mS_I2_Amps_Magnitude
A
94
200mS_I3_Amps_Magnitude
A
95
200mS_I4_Amps_Magnitude
A
96
200mS_Amps_Ave_Magnitude
A
97
200mS_L1_kW
kW
98
200mS_L2_kW
kW
99
200mS_L3_kW
kW
100
200mS_Total_kW
kW
101
200mS_L1_kVAR
kVAR
102
200mS_L2_kVAR
kVAR
103
200mS_L3_kVAR
kVAR
104
200mS_Total_kVAR
kVAR
105
200mS_L1_kVA
kVA
106
200mS_L2_kVA
kVA
107
200mS_L3_kVA
kVA
108
200mS_Total_kVA
kVA
109
200mS_L1_True_PF
%
110
200mS_L2_True_PF
%
111
200mS_L3_True_PF
%
112
200mS_Total_True_PF
%
113
200mS_L1_Disp_PF
%
114
200mS_L2_Disp_PF
%
115
200mS_L3_Disp_PF
%
116
200mS_Total_Disp_PF
%
117
200mS_V1_N_IEEE_THD_%
%
118
200mS_V2_N_IEEE_THD_%
%
119
200mS_V3_N_IEEE_THD_%
%
120
200mS_VN_G_IEEE_THD_%
%
121
200mS_Avg_IEEE_THD_V_%
%
Rockwell Automation Publication 1426-UM001G-EN-P - November 2014
123
Chapter 6
Logging
Table 19 - Min/Max Log Parameter Attributes
124
Parameter No.
Parameter name
Units
122
200mS_V1_V2_IEEE_THD_%
%
123
200mS_V2_V3_IEEE_THD_%
%
124
200mS_V3_V1_IEEE_THD_%
%
125
200mS_Avg_IEEE_THD_V_V_%
%
126
200mS_I1_IEEE_THD_%
%
127
200mS_I2_IEEE_THD_%
%
128
200mS_I3_IEEE_THD_%
%
129
200mS_I4_IEEE_THD_%
%
130
200mS_Avg_IEEE_THD_I_%
%
131
200mS_V1_N_IEC_THD_%
%
132
200mS_V2_N_IEC_THD_%
%
133
200mS_V3_N_IEC_THD_%
%
134
200mS_VN_G_IEC_THD_%
%
135
200mS_Avg_IEC_THD_V_%
%
136
200mS_V1_V2_IEC_THD_%
%
137
200mS_V2_V3_IEC_THD_%
%
138
200mS_V3_V1_IEC_THD_%
%
139
200mS_Avg_IEC_THD_V_V_%
%
140
200mS_I1_IEC_THD_%
%
141
200mS_I2_IEC_THD_%
%
142
200mS_I3_IEC_THD_%
%
143
200mS_I4_IEC_THD_%
%
144
200mS_Avg_IEC_THD_I_%
%
145
200mS_V1_N_THDS
%
146
200mS_V2_N_THDS
%
147
200mS_V3_N_THDS
%
148
200mS_VN_G_THDS
%
149
200mS_AVE_VN_THDS
%
150
200mS_V1_V2_THDS
%
151
200mS_V2_V3_THDS
%
152
200mS_V3_V1_THDS
%
153
200mS_AVE_LL_THDS
%
154
200mS_V1_N_TIHDS
%
155
200mS_V2_N_TIHDS
%
156
200mS_V3_N_TIHDS
%
157
200mS_VN_G_TIHDS
%
158
200mS_AVE_VN_TIHDS
%
159
200mS_V1_V2_TIHDS
%
160
200mS_V2_V3_TIHDS
%
Rockwell Automation Publication 1426-UM001G-EN-P - November 2014
Logging
Chapter 6
Table 19 - Min/Max Log Parameter Attributes
Parameter No.
Parameter name
Units
161
200mS_V3_V1_TIHDS
%
162
200mS_AVE_LL_TIHDS
%
163
200mS_I1_K_Factor
-
164
200mS_I2_K_Factor
-
165
200mS_I3_K_Factor
-
166
200mS_Pos_Seq_Volts
V
167
200mS_Neg_Seq_Volts
V
168
200mS_Zero_Seq_Volts
V
169
200mS_Pos_Seq_Amps
A
170
200mS_Neg_Seq_Amps
A
171
200mS_Zero_Seq_Amps
A
172
200mS_Voltage_Unbalance_%
%
173
200mS_Current_Unbalance_%
%
174
10s_Power_Frequency
Hz
175
3s_V1_N_Magnitude
V
176
10m_V1_N_Magnitude
V
177
2h_V1_N_Magnitude
V
178
3s_V2_N_Magnitude
V
179
10m_V2_N_Magnitude
V
180
2h_V2_N_Magnitude
V
181
3s_V3_N_Magnitude
V
182
10m_V3_N_Magnitude
V
183
2h_V3_N_Magnitude
V
184
3s_VN_G_Magnitude
V
185
10m_VN_G_Magnitude
V
186
2h_VN_G_Magnitude
V
187
3s_V1_V2_Magnitude
V
188
10m_V1_V2_Magnitude
V
189
2h_V1_V2_Magnitude
V
190
3s_V2_V3_Magnitude
V
191
10m_V2_V3_Magnitude
V
192
2h_V2_V3_Magnitude
V
193
3s_V3_V1_Magnitude
V
194
10m_V3_V1_Magnitude
V
195
2h_V3_V1_Magnitude
V
196
CH1_Short_Term_Flicker_Pst
Pst
197
CH1_Long_Term_Flicker_Plt
Plt
198
CH2_Short_Term_Flicker_Pst
Pst
199
CH2_Long_Term_Flicker_Plt
Plt
Rockwell Automation Publication 1426-UM001G-EN-P - November 2014
125
Chapter 6
Logging
Table 19 - Min/Max Log Parameter Attributes
Parameter No.
Parameter name
Units
200
CH3_Short_Term_Flicker_Pst
Pst
201
CH3_Long_Term_Flicker_Plt
Plt
202
200mS_CH1_Mains_Signaling_Volt
age
V
203
200mS_CH2_Mains_Signaling_Volt
age
V
204
200mS_CH3_Mains_Signaling_Volt
age
V
205
3s_Voltage_Unbalance
%
206
10m_Voltage_Unbalance
%
207
2h_Voltage_Unbalance
%
Setup
The Min/Max Log requires the following to be configured:
• Basic metering setup
• Logging configuration
• Date and Time setup
Commands
• Clear single min/max log record
• Clear min/max log
Related Functions
•
•
•
•
Load Factor Log
Demand metering
Voltage, current and frequency metering
Power metering
Configuration lock
The PowerMonitor 5000 unit maintains a 12-month record of real, reactive and
apparent demand and load factor. Load factor is defined as average demand
divided by peak demand and is a measure of load variability.
Load Factor Log Results
Load factor log records can be retrieved from the PowerMonitor 5000 web page
or ftp server. The power monitor generates the log file at the time of the request.
Records can also be retrieved individually or sequentially by using the data table
interface.
126
Rockwell Automation Publication 1426-UM001G-EN-P - November 2014
Logging
Chapter 6
File Name
The log file is named Load_Factor_Log.csv.
Logged Parameters
The load factor log consists of 14 records. The first is a header naming the logged
parameters. The second is an active record for the current month. The remaining
records are static and store data for each of the previous 12 months. The monthly
records operate in a circular, or FIFO fashion. On a user-selected day each
month, the current record is pushed into the stack of monthly records and, if the
stack is full, the oldest is deleted. Each record is a structure of REAL elements
containing the following parameters:
• LoadFactor_Record_Number
• LoadFactor_End_Date
• LoadFactor_Elapsed_Time
• Peak_Demand _kW
• Average_Demand_kW
• LoadFactor_kW
• Peak_Demand_kVAR
• Average_Demand_kVAR
• LoadFactor_kVAR
• Peak_Demand_kVA
• Average_Demand_kVA
• LoadFactor_kVA
Setup
The Data Log requires the following to be configured:
• Basic metering setup (including Demand)
• Data logging configuration
• Date and Time setup
Commands
• Store and clear current Load Factor Record
• Clear Load Factor Log
Related Functions
• Demand metering
• Configuration lock
Rockwell Automation Publication 1426-UM001G-EN-P - November 2014
127
Chapter 6
Logging
Time-of-use (TOU) Log
The PowerMonitor 5000 unit maintains records of energy and demand
organized by times of use defined by the user.
In the PowerMonitor 5000 model, there are three time-of-use (TOU) logs, one
each for real, reactive and apparent energy, and demand. Within each log, energy
consumption and peak demand are recorded into off-peak, mid-peak and onpeak categories. The days and times that define the mid- and on-peak periods are
user selectable. All times of use not defined as mid- or on-peak are considered offpeak.
TOU Log Results
Time-of-use log records can be retrieved from the PowerMonitor 5000 web page
or ftp server. The power monitor generates the log file at the time of the request.
Records can also be retrieved individually or sequentially by using the data table
interface.
File Name
The log file is named Time_of_Use_Log.csv.
Logged Parameters
The TOU log consists of 14 records. The first is a header naming the logged
parameters. The second is an active record for the current month. The remaining
records are static and store data for each of the previous 12 months. The monthly
records operate in a circular, or FIFO fashion. On a user-selected day each
month, the current record is pushed into the stack of monthly records and, if the
stack is full, the oldest is deleted. Each record is a structure of REAL elements
containing the following parameters:
• TOU_Record_Number
• TOU_ Start_Date
• TOU_End_Date
• Off_Peak_GWh_Net
• Off_Peak_kWh_Net
• Off_Peak_kW_Demand
• Mid_Peak_GWh_Net
• Mid_Peak_kWh_Net
• Mid_Peak_kW_Demand
• On_Peak_GWh_Net
• On_Peak_kWh_Net
• On_Peak_kW_Demand
• Off_Peak_GVARh_Net
128
Rockwell Automation Publication 1426-UM001G-EN-P - November 2014
Logging
•
•
•
•
•
•
•
•
•
•
•
•
•
•
•
•
•
Chapter 6
Off_Peak_kVARh_Net
Off_Peak_kVAR_Demand
Mid_Peak_GVARh_Net
Mid_Peak_kVARh_Net
Mid_Peak_kVAR_Demand
On_Peak_GVARh_Net
On_Peak_kVARh_Net
On_Peak_kVAR_Demand
Off_Peak _GVAh_Net
Off_Peak_kVAh_Net
Off_Peak_kVA_Demand
Mid_Peak_GVAh_Net
Mid_Peak_kVAh_Net
Mid_Peak_kVA_Demand
On_Peak_GVAh_Net
On_Peak_kVAh_Net
On_Peak_kVA_Demand
Setup
The Time-of-use Log requires the following to be configured:
• Basic metering setup (including Demand)
• Logging configuration
• Date and Time setup
Commands
• Store and clear current TOU Record
• Clear TOU Log
Related Functions
• Energy metering
• Demand metering
• Configuration lock
Rockwell Automation Publication 1426-UM001G-EN-P - November 2014
129
Chapter 6
Logging
Event Log
The event log records the date and time of changes made to the device and of
external events. The event log is up to 100 records deep. The event log cannot be
cleared.
The Event_Log_Mode parameter determines what happens when log is full:
• If 0 = Stop logging, no more event data is logged.
• If 1 = Overwrite oldest record, event logging continues and oldest events
are deleted.
Event Log Results
Event log records can be retrieved from the PowerMonitor 5000 web page or ftp
server. Event log records can also be retrieved sequentially by using the data table
interface.
File Name
The event log is named Event_Log.csv.
Logged Parameters
The event log operates in a circular, or FIFO fashion. The first record is a header
naming the logged parameters. Each subsequent record is a structure of INT16
elements containing the following parameters.
Table 20 - Event Log Logged Parameters
130
Tag Name
Description
Event_Record_Identifier
Used to verify record sequence when returning multiple
records.
Event_Timestamp_Year
The year when the record was recorded.
Event_Timestamp_Mth_Day
The month and day when the record was recorded.
Event_Timestamp_Hr_Min
The hour and minute when the record was recorded.
Event_Timestamp_Sec_ms
The seconds and milliseconds when the record was
recorded.
Event Type
Indicates the type of event that has occurred.
General Code
Indicates general information about the status event.
Information Code
Indicates specific information about the status event.
Rockwell Automation Publication 1426-UM001G-EN-P - November 2014
Logging
Chapter 6
Table 21 - Event, General, and Information Codes
Event Type
Event #
General Code
Code
Self-Test Status
1
Pass
0
Nor Flash Memory
1
Information Code
Code
Overall Status
1
Boot Code Checksum
2
Application Code Checksum 4
Wrong Application FRN
8
Invalid Model Type
16
WIN Mismatch
32
Missing Upgrade Block
64
SDRAM
2
Failed Read/Write Test
1
NAND Flash Memory
4
Read/Write Failed
1
FRAM
8
Failed Read/Write Test
1
Real Time Clock
16
Real Time Clock Failed
1
Real Time Clock not Set
2
Watchdog Timer
32
Watchdog Time Out
1
Ethernet communication
64
Ethernet Communication
Port Failed
1
SNTP_Task_init_failed
2
Demand_Broadcast_task_ 4
init_failed
Rockwell Automation Publication 1426-UM001G-EN-P - November 2014
131
Chapter 6
Logging
Table 21 - Event, General, and Information Codes
Event Type
Event #
General Code
Code
Configuration Changed
2
Clock Set
1
Status Input Counter Set
2
Factory Defaults Restored
4
Energy Register Set
8
Information Code
Code
Status Input 1
1
Status Input 2
2
Status Input 3
4
Status Input 4
8
Wh Register
1
VARh Register
2
VAh Register
4
Ah Register
8
All Energy Registers Cleared 16
Log Cleared or Set
Relay/KYZ Output Forced
Status Input Activated
132
4
8
16
Terminal Locked
16
Terminal Unlocked
32
Min/Max Log Cleared
1
Energy Log Cleared
2
LoadFactor Log Cleared
4
TOU Log Cleared
8
Data Log Cleared
16
Setpoint Log Cleared
32
Trigger Data Log Cleared
64
Power Quality Log Cleared
128
Waveform Log Cleared
256
KYZ Forced On
1
KYZ Forced Off
2
Relay 1 Forced On
4
Relay 1 Forced Off
8
Relay 2 Forced On
16
Relay 2 Forced Off
32
Relay 3 Forced On
64
Relay 3 Forced Off
128
Status Input 1
1
Status Input 2
2
Status Input 3
4
Status Input 4
8
Rockwell Automation Publication 1426-UM001G-EN-P - November 2014
Logging
Chapter 6
Table 21 - Event, General, and Information Codes
Event Type
Event #
General Code
Code
Status Input Deactivated
32
Status Input 1
1
Status Input 2
2
Status Input 3
4
Status Input 4
8
Wh Register
1
VARh Register
2
Energy Register Rollover
64
Device Power Up
128
Device Power Down
256
Missed External Demand
Sync
512
Register Set Clear
1024
VAh Register
4
Status Input 1 Register
8
Status Input 2 Register
16
Status Input 3 Register
32
Status Input 4 Register
64
Information Code
Code
Setup
Logging configuration.
Commands
None.
Related Functions
Log status input changes.
Rockwell Automation Publication 1426-UM001G-EN-P - November 2014
133
Chapter 6
Logging
Setpoint Log
The setpoint log records information when a setpoint output activates (asserts)
or deactivates (de-asserts). The setpoint log is up to100 records deep.
The Setpoint_Log_Mode parameter determines what happens when log is full:
• If 0 = Stop logging, no more setpoint data is logged.
• If 1 = Overwrite oldest record, logging continues and oldest events are
deleted.
Setpoint Log Results
Setpoint log records can be retrieved from the PowerMonitor 5000 web page or
ftp server. Setpoint log records can also be retrieved sequentially by using the data
table interface.
File Name
The setpoint log is named Setpoint_Log.csv.
Logged Parameters
The setpoint log operates in a circular, or FIFO fashion. The first record is a
header naming the logged parameters. Each subsequent record is a structure of
REAL elements containing the following parameters.
Table 22 - Setpoint Log Logged Parameters
134
Item Name
Description
Setpoint_Record_Identifier
Used to verify record sequence when returning multiple records.
Setpoint_Timestamp_Year
The year when the record was recorded.
Setpoint_Timestamp_Mth_Day
The month and day when the record was recorded.
Setpoint_Timestamp_Hr_Min
The hour and minute when the record was recorded.
Setpoint_Timestamp_Sec_ms
The seconds and milliseconds when the record was recorded.
Setpoint_Number
Setpoint number of record.
Setpoint_Status
Setpoint is active or not active.
Input_Parameter
Input test parameter of setpoint.
Test_Condition
Test Condition.
Evaluation_Type
Evaluation type for setpoint.
Threshold_Setting
The threshold setting magnitude or percent.
Hysteresis_Setting
Magnitude or percent.
Assert_Delay
Time delay before actuation.
Deassert_Delay
Time delay before deassert.
Output_Source
Output flag or bit.
Rockwell Automation Publication 1426-UM001G-EN-P - November 2014
Logging
Chapter 6
Table 22 - Setpoint Log Logged Parameters
Item Name
Description
Output_Action
Configured action when actuated.
Accumulated_Time
Total accumulation in seconds.
Number_Of_Transitions
Number of transitions from off to on.
Setup
•
•
•
•
•
•
•
•
•
Basic metering setup
Setpoints 1…5 configuration
Setpoints 6…10 configuration
Setpoints 11…15 configuration
Setpoints 16…20 configuration
Setpoint Logic configuration
Setpoint Outputs configuration
Date and Time setup
Logging configuration
Commands
• Clear Setpoint Log
• Clear Setpoint Accumulators
Related Functions
Setpoint configuration and operation.
Rockwell Automation Publication 1426-UM001G-EN-P - November 2014
135
Chapter 6
Logging
Alarm Log
The alarm log records information when an alarm occurs. The alarm log is up
to 100 records deep. The alarm log cannot be cleared.
Alarm Log Results
Alarm log records can be retrieved from the PowerMonitor 5000 web page or ftp
server. Alarm log records can also be retrieved sequentially by using the data table
interface.
File Name
The alarm log is named Alarm_Log.csv.
Logged Parameters
The alarm log operates in a circular, or FIFO fashion. The first is a header naming
the logged parameters. Each subsequent record is a structure of INT16 elements
containing the following parameters.
Table 23 - Alarm Log Logged Parameters
136
Tag Name
Description
Alarm_Record_Identifier
Used to verify record sequence when returning multiple
records.
Alarm_Timestamp_Year
The year when the record was recorded.
Alarm_Timestamp_Mth_Day
The month and day when the record was recorded.
Alarm_Timestamp_Hr_Min
The hour and minute when the record was recorded.
Alarm_Timestamp_Sec_ms
The seconds and milliseconds when the record was
recorded.
Alarm Type
Indicates the type of event that has occurred.
Alarm Code
Indicates information about the alarm.
Rockwell Automation Publication 1426-UM001G-EN-P - November 2014
Logging
Chapter 6
Table 24 - Alarm Codes and Descriptions
Alarm Type Description
Type
Alarm Code Description
Code
Metering_Status
1
Virtual_Wiring_Correction
1
Volts_Loss_V1
2
Volts_Loss_V2
4
Volts_Loss_V3
8
Voltage_Over_Range_Indication
16
Ampere_Over_Range_Indication
32
Wiring_Diagnostics_Active
64
V1G_Over_Range
1
V2G_Over_Range
2
V3G_Over_Range
4
VNG_Over_Range
8
I1_Over_Range
16
I2_Over_Range
32
I3_Over_Range
64
Over_Range_Information
PowerQuality_Status
Logs_Status
Output_Pulse_Overrun
2
4
8
16
I4_Over_Range
128
Sag_Indication_Detected
1
Swell_Indication_Detected
2
Transient_Indication
4
200mS_Sag_Swell_Status_Flag
8
3s_Sag_Swell_Status_Flag
16
10m_Sag_Swell_Status_Flag
32
2h_Sag_Swell_Status_Flag
64
Data_Log_Full_Fill_And_Stop
1
Event_Log_Full_Fill_And_Stop
2
Setpoint_Log_Full_Fill_And_Stop
4
PowerQuality_Log_Full_Fill_And_Stop
8
Energy_Log_Full_Fill_And_Stop
16
Waveform_Full
32
TriggerData_Full_Fill_And_Stop
64
KYZ_Pulse_Overrun
1
Relay1_Pulse_Overrun
2
Relay2_Pulse_Overrun
4
Relay3_Pulse_Overrun
8
Rockwell Automation Publication 1426-UM001G-EN-P - November 2014
137
Chapter 6
Logging
Table 24 - Alarm Codes and Descriptions
Alarm Type Description
Type
Alarm Code Description
Code
IEEE1159_Over/Under_Voltage_Imbalance
32
IEEE1159_Over_Voltage_V1
1
IEEE1159_Over_Voltage_V2
2
IEEE1159_Over_Voltage_V3
4
IEEE1159_Under_Voltage_V1
8
IEEE1159_Under_Voltage_V2
16
IEEE1159_Under_Voltage_V3
32
IEEE1159_Imbalance_Condition_Volts
64
IEEE1159_Imbalance_Condition_Current
128
IEEE1159_DCOffset_Condition_V1
1
IEEE1159_DCOffset_Condition_V2
2
IEEE1159_DCOffset_Condition_V3
4
IEEE1159_Voltage_THD_Condition_V1
8
IEEE1159_Voltage_THD_Condition_V2
16
IEEE1159_Voltage_THD_Condition_V3
32
IEEE1159_Current_THD_Condition_ I1
64
IEEE1159_Current_THD_Condition_ I2
128
IEEE1159_Current_THD_Condition_ I3
256
IEEE1159_PowerFrequency_Condition
512
IEEE1159_Current_THD_Condition_ I4
1024
IEEE1159_Voltage_TID_Condition_V1
1
IEEE1159_Voltage_TID_Condition_V2
2
IEEE1159_Voltage_TID_Condition_V3
4
IEEE1159_Current_TID_Condition_I1
8
IEEE1159_Current_TID_Condition_ I2
16
IEEE1159_Current_TID_Condition_ I3
32
IEEE1159_Current_TID_Condition_ I4
64
ShortTerm_TDD_THD_PASS_FAIL
1
LongTerm_TDD_THD_PASS_FAIL
2
ShortTerm_Individual_Harmonic_PASS_FAIL
4
LongTerm_Individual_Harmonic_PASS_FAIL
8
IEEE1159_DCOffset_THD_Frequency_Conditi
on
IEEE1159_TID_Condition
IEEE519_Overall_Status
138
64
65
128
Rockwell Automation Publication 1426-UM001G-EN-P - November 2014
Logging
Chapter 6
Table 24 - Alarm Codes and Descriptions
Alarm Type Description
Type
Alarm Code Description
Code
ShortTerm_2nd_To_17th_Harmonic_Status
256
2nd_Harmonic_PASS_FAIL
1
3rd_Harmonic_PASS_FAIL
2
4th_Harmonic_PASS_FAIL
4
5th_Harmonic_PASS_FAIL
8
6th_Harmonic_PASS_FAIL
16
7th_Harmonic_PASS_FAIL
32
8th_Harmonic_PASS_FAIL
64
9th_Harmonic_PASS_FAIL
128
10th_Harmonic_PASS_FAIL
256
11th_Harmonic_PASS_FAIL
512
12th_Harmonic_PASS_FAIL
1024
13th_Harmonic_PASS_FAIL
2048
14th_Harmonic_PASS_FAIL
4096
15th_Harmonic_PASS_FAIL
8192
16th_Harmonic_PASS_FAIL
16384
17th_Harmonic_PASS_FAIL
32768
18th_Harmonic_PASS_FAIL
1
19th_Harmonic_PASS_FAIL
2
20th_Harmonic_PASS_FAIL
4
21st_Harmonic_PASS_FAIL
8
22nd_Harmonic_PASS_FAIL
16
23rd_Harmonic_PASS_FAIL
32
24th_Harmonic_PASS_FAIL
64
25th_Harmonic_PASS_FAIL
128
26th_Harmonic_PASS_FAIL
256
27th_Harmonic_PASS_FAIL
512
28th_Harmonic_PASS_FAIL
1024
29th_Harmonic_PASS_FAIL
2048
30th_Harmonic_PASS_FAIL
4096
31st_Harmonic_PASS_FAIL
8192
32nd_Harmonic_PASS_FAIL
16384
33rd_Harmonic_PASS_FAIL
32768
34th_Harmonic_PASS_FAIL
1
35th_Harmonic_PASS_FAIL
2
36th_Harmonic_PASS_FAIL
4
37th_Harmonic_PASS_FAIL
8
38th_Harmonic_PASS_FAIL
16
39th_Harmonic_PASS_FAIL
32
40th_Harmonic_PASS_FAIL
64
ShortTerm_18th_To_33rd_Harmonic_Status 512
ShortTerm_34th_To_40th_Harmonic_Status 1024
Rockwell Automation Publication 1426-UM001G-EN-P - November 2014
139
Chapter 6
Logging
Table 24 - Alarm Codes and Descriptions
Alarm Type Description
Type
Alarm Code Description
Code
LongTerm_2nd_To_17th_Harmonic_Status
2048
2nd_Harmonic_PASS_FAIL
1
3rd_Harmonic_PASS_FAIL
2
4th_Harmonic_PASS_FAIL
4
5th_Harmonic_PASS_FAIL
8
6th_Harmonic_PASS_FAIL
16
7th_Harmonic_PASS_FAIL
32
8th_Harmonic_PASS_FAIL
64
9th_Harmonic_PASS_FAIL
128
10th_Harmonic_PASS_FAIL
256
11th_Harmonic_PASS_FAIL
512
12th_Harmonic_PASS_FAIL
1024
13th_Harmonic_PASS_FAIL
2048
14th_Harmonic_PASS_FAIL
4096
15th_Harmonic_PASS_FAIL
8192
16th_Harmonic_PASS_FAIL
16384
17th_Harmonic_PASS_FAIL
32768
18th_Harmonic_PASS_FAIL
1
19th_Harmonic_PASS_FAIL
2
20th_Harmonic_PASS_FAIL
4
21st_Harmonic_PASS_FAIL
8
22nd_Harmonic_PASS_FAIL
16
23rd_Harmonic_PASS_FAIL
32
24th_Harmonic_PASS_FAIL
64
25th_Harmonic_PASS_FAIL
128
26th_Harmonic_PASS_FAIL
256
27th_Harmonic_PASS_FAIL
512
28th_Harmonic_PASS_FAIL
1024
29th_Harmonic_PASS_FAIL
2048
30th_Harmonic_PASS_FAIL
4096
31st_Harmonic_PASS_FAIL
8192
32nd_Harmonic_PASS_FAIL
16384
33rd_Harmonic_PASS_FAIL
32768
34th_Harmonic_PASS_FAIL
1
35th_Harmonic_PASS_FAIL
2
36th_Harmonic_PASS_FAIL
4
37th_Harmonic_PASS_FAIL
8
38th_Harmonic_PASS_FAIL
16
39th_Harmonic_PASS_FAIL
32
40th_Harmonic_PASS_FAIL
64
LongTerm_18th_To_33rd_Harmonic_Status
LongTerm_34th_To_40th_Harmonic_Status
140
4096
8192
Rockwell Automation Publication 1426-UM001G-EN-P - November 2014
Logging
Chapter 6
Table 24 - Alarm Codes and Descriptions
Alarm Type Description
Type
Alarm Code Description
Code
IEEE1159_Voltage_Fluctuation_Condition
16384
IEEE1159_Voltage_Fluctuation_Condition_V1
1
IEEE1159_Voltage_Fluctuation_Condition_V2
2
IEEE1159_Voltage_Fluctuation_Condition_V3
4
EN61000_4_30_Mains_Signal_Under_Over
_Deviation_Condition
32768
EN61000_4_30_Mains_Signal_Condition_V1 1
EN61000_4_30_Mains_Signal_Condition_V2 2
EN61000_4_30_Mains_Signal_Condition_V3 4
EN61000_4_30_Under_Deviation_V1
8
EN61000_4_30_Under_Deviation_V2
16
EN61000_4_30_Under_Deviation_V3
32
EN61000_4_30_Over_ Deviation _V1
64
EN61000_4_30_Over_ Deviation _V2
128
EN61000_4_30_Over_ Deviation _V3
256
Setup
Basic metering setup.
Commands
None.
Related Functions
None.
Rockwell Automation Publication 1426-UM001G-EN-P - November 2014
141
Chapter 6
Logging
Power Quality Log
(M6 and M8 model)
The power monitor records power quality events that it has detected and
classified into a Power Quality log.
Setup
• Basic metering setup
• Date and time setup
• Logging configuration
The Power_Quality_Log_Mode parameter in the Configuration.Logging tab
determines what happens when the log is full:
• 0 = Stop logging; no more power quality data is logged.
• 1 = Overwrite oldest record; logging continues and oldest events are
deleted.
Operation
A Power Quality log record is comprised of the event classification, local and
UTC timestamps, duration of event, minimum sag rms voltage and maximum
swell rms voltage level, and the trip point setting. Time stamps have a resolution
of 1 microsecond. If a sag or swell event has an associated waveform recording,
the Power Quality log entry includes the Association_Timestamp, a date/time
reference to the waveform.
Because the user or software can delete waveform files to make room for more
captures, a situation can occur in which a reference appears in a power quality log
record but the file no longer exists. In this case, the write status table returns ‘Log
File Not Found’ to the user.
The power quality log is 100 records deep.
File Name
The power quality log is named Power_Quality_Log.csv.
142
Rockwell Automation Publication 1426-UM001G-EN-P - November 2014
Logging
Chapter 6
Logged Parameters
The event log operates in a circular, or FIFO fashion. When accessed as a file, the
first record is a header containing the tag names. Each subsequent record is a
structure of REAL elements containing the following parameters.
Tag Name
Description
Record_Identifier
Used to verify record sequence when returning multiple records
Event_Type
Power quality event type, see Power Quality Event Code table.
Sub_Event_Code
Indicate the sub event of the event type. For example, a sag event can happen in V1, V2 or V3. See Power Quality Event Code table.
Local_Timestamp_Year
Year of the local time when the record was recorded
Local_Timestamp_Mth_Day
Month and Day of the local time when the record was recorded
Local_Timestamp_Hr_Min
Hour and Minute of the local time when the record was recorded
Local_Timestamp_Sec_mS
Second and Millisecond of the local time when the record was recorded.
Local_Timestamp_uS
Microsecond when the record was recorded
UTC_Timestamp_Year
Year of the UTC when the record was recorded
UTC_Timestamp_Mth_Day
Month and Day of the UTC when the record was recorded
UTC_Timestamp_Hr_Min
Hour and Minute of the UTC when the record was recorded.
UTC_Timestamp_Sec_mS
Second and Millisecond of UTC when the record was recorded.
UTC_Timestamp_uS
Microsecond of UTC when the record was recorded.
Association_Timestamp_Year
Year of the timestamp associated with waveform file if the event can trigger a waveform capture
Association_Timestamp_Mth_Day
Month and Day of the timestamp associated with waveform file if the event can trigger a waveform capture
Association_Timestamp_Hr_Min
Hour and Minute of the timestamp associated with waveform file if the event can trigger a waveform capture
Association_Timestamp_Sec_mS
Second and Millisecond of the timestamp associated with waveform file if the event can trigger a waveform capture
Association_Timestamp_uS
Microsecond of the timestamp associated with waveform file
Event_Duration_mS
Event duration in milliseconds
Min_or_Max
Minimum or maximum value of the related parameter during the event
Trip_Point
The trip point that triggered the event
WSB Originator
ID of the unit that originated the WSB message; the 3 least significant bytes of its MAC ID
Rockwell Automation Publication 1426-UM001G-EN-P - November 2014
143
Chapter 6
Logging
Power Quality Event Codes
Power Quality Event Name
Event Code
Sub Event Name
Sub Event Code
Can Trigger Waveform
Capture
Description
Voltage_Swell
1
V1_Swell
1
•
Voltage Swell (4 trip points for V1)
V2_Swell
2
•
Voltage Swell (4 trip points for V2)
V3_Swell
3
•
Voltage Swell (4 trip points for V3)
V1_Sag
1
•
Voltage Sag (5 trip points for V1)
V2_Sag
2
•
Voltage Sag (5 trip points for V2)
V3_Sag
3
•
Voltage Sag (5 trip points for V3)
Voltage Imbalance
1
Voltage Imbalance
Current Imbalance
2
Current Imbalance
--
--
Power Frequency Deviation
Voltage_Sag
Imbalance
2
3
Power_Frequency
4
Voltage_DC_Offset
5
Voltage THD
Current THD
IEEE1159_Over_Voltage
IEEE1159_Under_Voltage
Voltage_TID
Current_TID
IEEE1159_Voltage_Fluctuations
Voltage_Transient
Command_Trigger
144
6
7
8
9
10
11
12
13
14
V1_DC_Offset
1
V1 DC offset
V2_DC_Offset
2
V2 DC offset
V3_DC_Offset
3
V3 DC offset
V1_THD
1
V1 DC offset
V2_THD
2
V2 DC offset
V3_THD
3
V3 DC offset
I1_THD
1
I1 THD
I2_THD
2
I2 THD
I3_THD
3
I3 THD
V1_Over_Voltage
1
V1 over voltage
V2_Over_Voltage
2
V2 over voltage
V3_Over_Voltage
3
V3 over voltage
V1_Under_Voltage
1
V1 under voltage
V2_Under_Voltage
2
V2 under voltage
V3_Under_Voltage
3
V3 under voltage
V1_Interharmonics
1
Voltage V1 total interharmonic distortion
V2_Interharmonics
2
Voltage V2 total interharmonic distortion
V3_Interharmonics
3
Voltage V3 total interharmonic distortion
I1_Interharmonics
1
Current I1total interharmonic distortion
I2_Interharmonics
2
Current I2 total interharmonic distortion
I3_Interharmonics
3
Current I3 total interharmonic distortion
I4_Interharmonics
4
Current I4 total interharmonic distortion
V1_Pst
1
V1 Pst configured limit has been exceeded
V2_Pst
2
V2 Pst configured limit has been exceeded
V3_Pst
3
V3 Pst configured limit has been exceeded
V1_Transient
1
•
V1 transient
V2_Transient
2
•
V2 transient
V3_Transient
3
•
V3 transient
--
--
•
Event triggered by the user command
Rockwell Automation Publication 1426-UM001G-EN-P - November 2014
Logging
Chapter 6
Power Quality Event Name
Event Code
Sub Event Name
Sub Event Code
Can Trigger Waveform
Capture
Description
WSB_Sag
15
--
--
•
Sag event from WSB (waveform
synchronization broadcast) message.
WSB_Swell
16
--
--
•
Swell event from WSB message
WSB_Transient
17
--
--
•
Transient event from WSB message
WSB_Command
18
--
--
•
User command from WSB message
IEEE1159_Swell
19
V1_Swell
1
•
Voltage Swell greater than 110% of
nominal
V2_Swell
2
•
Voltage Swell greater than 110% of
nominal
V3_Swell
3
•
Voltage Swell greater than 110% of
nominal
V1_Sag
1
•
Voltage Sag less than 90% of nominal
V2_Sag
2
•
Voltage Sag less than 90% of nominal
V3_Sag
3
•
Voltage Sag less than 90% of nominal
V1_Interruption
1
•
Voltage Interruption less than 10%
nominal
V2_Interruption
2
•
Voltage Interruption less than 10%
nominal
V3_Interruption
3
•
Voltage Interruption less than 10%
nominal
V1_Mains_Signal
1
V1 mains signaling has exceeded the
configured limit
V2_Mains_Signal
2
V2 mains signaling has exceeded the
configured limit
V3_Mains_Signal
3
V3 mains signaling has exceeded the
configured limit
V1_Under_Deviation
1
An under deviation is detected on V1
V2_Under_ Deviation
2
An under deviation is detected on V2
V3_Under_ Deviation
3
An under deviation is detected on V3
V1_Over_ Deviation
1
An over deviation is detected on V1
V2_Over_ Deviation
2
An over deviation is detected on V2
V3_Over_ Deviation
3
An over deviation is detected on V3
IEEE1159_Sag
IEEE1159_Interruption
EN61000_4_30_Mains_Signaling
EN61000_4_30_Under_Deviation
EN61000_4_30_Over_Deviation
20
21
22
23
24
Rockwell Automation Publication 1426-UM001G-EN-P - November 2014
145
Chapter 6
Logging
Power Quality Log Results
Power quality log records can be retrieved in a file from the PowerMonitor 5000
web page or ftp server. The link for the power quality log is found in the
LoggingResults.General_Logs tab in the web page.
To retrieve the file, click the link and follow the prompts to save or open the file.
The ftp server works in a similar way.
Records can also be retrieved sequentially through the native Ethernet network
communication or an optional communication port by using the data table
interface. A read of the Statistics.Logging table returns the number of power
quality log records in Element 15.
Select the power quality log and the desired order of record retrieval by writing
values to these tags in the Configuration.Log_Read table.
• Selected Log = 10, Power Quality Log
• Chronology of Auto Return Data = 0 for most recent first (default), 1 for
earliest first
Successive reads of the LoggingResults.Power_Quality_Log (M6 and M8 model)
table return records in the selected sequence. After the last record is read, the next
read starts again from the end or beginning of the log as was selected.
Commands
Clear power quality log
146
Rockwell Automation Publication 1426-UM001G-EN-P - November 2014
Logging
Trigger Data Log (M6 and M8
model)
Chapter 6
A trigger data log is enabled as a setpoint or logic gate output action and stores a
cycle-by-cycle record of the values of up to 8 selected parameters for a selected
duration when its associate setpoint activates.
Setup
The trigger log requires the following to be configured:
• Basic Metering setup
• Date and Time setup
• Setpoint setup
At least one setpoint or logic gate output must be configured with a value of
30 = ‘Trigger Data Log’, to utilize the trigger data feature.
The trigger log is configured by default. If the default configuration satisfies your
requirements, you do not need to change it. To modify the setup, edit the
parameters in the Configuration.TriggerData tab, which contains the following
parameters.
Trigger_Mode - Selects how records are saved. Options are:
• 0 = Fill and stop recording when log is full
• 1 = Overwrite when log is full starting with the earliest record (default)
TriggerData_Length_s - Log duration, range = 1 (default) …10 seconds
Trigger log parameter selection. For each, the range is 1…184, from the Data Log
Parameter List on page 111. The default values of the parameters are listed below.
• TriggerData_Parameter_1 - 5 = Avg_V_N_Volts
• TriggerData_Parameter_2 - 9 = Avg_VL_VL_Volts
• TriggerData_Parameter_3 - 14 = Avg_Amps
• TriggerData_Parameter_4 - 15 = Frequency_Hz
• TriggerData_Parameter_5 - 19 = Total_kW
• TriggerData_Parameter_6 - 23 = Total_kVAR
• TriggerData_Parameter_7 - 27 = Total_kVA
• TriggerData_Parameter_8 - 39 = Total_PF_Lead_Lag_Indicator
Operation
When an associated setpoint activates, the trigger data file stores the selected
parameters for the selected duration in a data file and stores the associated
setpoint or logic gate identity and configuration parameters in a setpoint
information file.
Rockwell Automation Publication 1426-UM001G-EN-P - November 2014
147
Chapter 6
Logging
File Names
Triggerlog_YYYYMMDD_hhmmss_HH, and
TriggerSetpointInfo_YYYYMMDD_hhmmss_HH, where
• YYYMMDD_hhmmss = the local date and time stamp of the record, used
to associate the trigger data file with its associated setpoint information
• HH = the UTC hour avoids duplication during daylight-saving time
transition
Refer to Appendix A, LoggingResults. TriggerData_Header Data Table for the
content and structure of the setpoint information file, and LoggingResults.
TriggerData_Log Data Table for the content and structure of the trigger data file.
Trigger Data Log Results
Trigger data log records can be retrieved from the PowerMonitor 5000 web page
or ftp server. Trigger data log records can also be retrieved sequentially by using
the data table interface.
When retrieved from the web page or ftp server, the first row in the files is a
header row containing parameter names.
Trigger Data Log Single Record Retrieval
A controller or application can sequentially retrieve trigger data records by
following the process described in this section, following these general tasks.
1. Read the number of trigger data files from the Statistics.Logging table.
The Statistics.Logging table contains the following trigger data
information:
• Element 11, the number of trigger data records (cycles)
• Element 12, the number of trigger data files
2. Write the Configuration.Log_Read table with Selected Log = 12.
The Configuration.Log_Read table contains the following elements:
• Element 0: Write a value of 12 to request the next trigger data log or
trigger data setpoint information file name, or a value of 13 to select the
trigger data header
148
Rockwell Automation Publication 1426-UM001G-EN-P - November 2014
Logging
Chapter 6
• Element 1: Write a 0 to return the most recent file name first or a 1 to
return the oldest file name first
3. Read the trigger data setpoint information file name from the
LoggingResults. TriggerLog_Setpoint_Info_File_Name Data Table one or
more times until the desired file name is returned.
4. Read the trigger data file name from the
LoggingResults.TriggerLog_FileName Data Table one or more times until
the desired file name is returned.
5. Write the selected file names into the Configuration.TriggerDataLogFile
Data Table and Configuration.TriggerSetpointInfoFile Data Table.
6. Perform a read of the LoggingResults. TriggerData_Header Data Table
and store the results in a suitable location.
7. Perform sequential reads of the LoggingResults. TriggerData_Log Data
Table table and store the results in a suitable location.
The first read returns the total number of cycle data records in the log
along with the selected parameter ID numbers. Subsequent reads return
each the value of the selected parameters, cycle-by-cycle.
Commands
• Clear trigger data log
Rockwell Automation Publication 1426-UM001G-EN-P - November 2014
149
Chapter 6
Logging
Snapshot Log
The Snapshot log captures a record of all data from a single cycle on command.
Setup
The Snapshot log requires the following to be configured:
• Basic Metering setup
• Date and Time setup
Operation
The Snapshot log captures and records the present cycle's data when a command
is issued. The content and file structure of the Snapshot log differs between the
M6 and M8 models. This table depicts the Snapshot log content for each model.
150
Model
Parameter Group
Results Set
Number of Records
M6
n/a
Date and time stamp to the millisecond
All metering data
All harmonic data
Single harmonic results, DC up to the 63rd for the
following
- Voltage channels and average
- Current channels and average
- Real, reactive and apparent power per phase and total
2270
M8
0 (default)
Parameter Group No.
Date and time stamp to the millisecond
All metering data
All harmonic data
Single harmonic results, DC up to the 127th for the
following
- Voltage channels and average
- Current channels and average
- Real, reactive and apparent power per phase and total
4447
1
Parameter Group No.
Date and time stamp to the millisecond
EN61000-4-30 Harmonic subgroups up to the 50th for
voltage and current
EN61000-4-30 Interharmonic subgroups up to the 50th for
voltage and current
EN61000-4-30 Power Quality parameters table
1233
2
Parameter Group No.
Date and time stamp to the millisecond
EN61000-4-30 5Hz harmonic results, magnitude and angle
for voltage and current
EN61000-4-30 5Hz harmonic results, kW, kVAR, kVA
magnitude
20,439
Rockwell Automation Publication 1426-UM001G-EN-P - November 2014
Logging
Chapter 6
For the M8 model, select a Parameter Group by setting the value of the
Metering_Snapshot_Parameter_Selection parameter in the
Configuration.PowerQuality table or web page. You can download snapshot log
parameter lists from the M6 and M8 model web pages to help interpret the log
contents:
• Snapshot_ParameterList_Group0.csv
• Snapshot_ParameterList_Group1.csv
• Snapshot_ParameterList_Group2.csv
The file name includes the local date and time stamp. Subsequent metering data
snapshot commands overwrite the previous file.
File Name
The snapshot log file name is
Metering_Snapshot_[Group#_]YYYYMMDD_hhmmssmmm.csv, where:
• Group# = Group 0, 1, or 2 (M8 model only)
• YYYYMMMDD = Year, month, and day
• hhmmssmmm = Hour, minute, seconds and milliseconds
Metering Snapshot Log Results
The metering snapshot log results can be retrieved from the PowerMonitor 5000
web page or ftp server. Records are also retrieved sequentially starting from the
beginning of the file by using the data table interface.
Rockwell Automation Publication 1426-UM001G-EN-P - November 2014
151
Chapter 6
Logging
Web Interface
Click the link and follow the prompts to save or open the log file. The
Snapshot_ParameterList file lists the parameter IDs and their corresponding tag
names. The ftp page is similar.
Figure 26 - Metering Snapshot Tab for the M6 Model
Figure 27 - Metering Snapshot Tab for the M8 Model
Data Table Interface
Successive reads of the LoggingResults. Snapshot_Log Data Table return
sequential single parameters. The following is the data returned:
• Parameter_Number - the ID number of the parameter. The
Snapshot_ParameterList.csv file contains a listing of tag names associated
to parameter IDs and can be downloaded from the web page or ftp server.
• Parameter_Value
Commands
Metering data snapshot
For the M8 model, the Parameter Group returned is based on the the value of the
Metering_Snapshot_Parameter_Selection parameter in the
Configuration.PowerQuality table when the Metering Data Snapshot command
is executed.
EN 50160 Weekly and Yearly
Logs
152
Please refer to Appendix G for information on the EN 50160 logs and
compliance record.
Rockwell Automation Publication 1426-UM001G-EN-P - November 2014
Chapter
7
Logic Functions
Topic
Page
Relay and KYZ Outputs
153
Status Inputs
157
Setpoints
159
This section describes the functions of the PowerMonitor 5000 unit. Most
functions require you to configure set-up parameters to align the unit with your
installation and your application requirements. The set-up parameters are listed
by name and described in this section. You can view set-up parameters by using
the PowerMonitor 5000 web page, and when logged in to an Admin account,
make changes to the setup. Set-up parameters are also accessible by using
communication.
Please refer to the PowerMonitor 5000 Unit Data Tables for additional
information on setup parameters including the following:
• Range of valid values
• Default values
• Data type
Set-up parameters can be found in data tables with names beginning with
‘Configuration’, for instance Configuration.Metering.Basic.
Relay and KYZ Outputs
The PowerMonitor 5000 unit is equipped with three electromechanical Form C
relay outputs, typically used for control and annunciation, and one KYZ output
solid-state relay designed for low-power, long-life signaling operation. The KYZ
output’s typical use is to provide a pulse output proportional to energy
consumption to an external totalizer.
Applications
This applies to all models.
Rockwell Automation Publication 1426-UM001G-EN-P - November 2014
153
Chapter 7
Logic Functions
Operation
The outputs can operate in the following modes:
• Energy pulse operation with fixed pulse width or toggle
• Setpoint operation
• I/O control through a Class 1 connection
• Forced operation
IMPORTANT
I/O control can use relay output contacts and solid-state KYZ outputs on the
PowerMonitor 5000 unit to control other devices. You can select the response
of these outputs to a loss of the connection. Be sure to evaluate the safety
impact of the output configuration on your plant or process.
The Default output state on communication loss defines the behavior of the
output if the PowerMonitor 5000 unit experiences the loss of a Class 1 (I/O)
connection with a Logic controller.
Forced operation of outputs over-rides pulsed operation and setpoint control.
Forced operation is not permitted if an I/O (for example, Exclusive Owner or
Data) connection exists. Force operations are written to the Status Log.
Setup
Relay and KYZ output setup parameters specify the operation of each output,
and are found in the Configuration.System.General table.
KYZ_Output_Parameter
Output_Relay_1_Output_Parameter
Output_Relay_2_Output_Parameter
Output_Relay_3_Output_Parameter
The output parameter defines how each output is controlled, and for pulsed
operation, relates an output’s pulse rate to a specified energy value. These are the
selections:
0 = Disable
1 = Wh Fwd
2 = Wh Rev
3 = VARh Fwd
4 = VARh Rev
5 = Vah
6 = Ah
154
Rockwell Automation Publication 1426-UM001G-EN-P - November 2014
Logic Functions
Chapter 7
KYZ_Solid_State_Output_Scale
Output_Relay_1_Output_Scale
Output_Relay_2_Output_Scale
Output_Relay_3_Output_Scale
The output parameter divided by the scale is the output pulse rate. Example: Wh
is selected for the parameter and 1,000 is the scale value. The output is pulsed
every 1000 Wh, or 1 kWh. This parameter is ignored for setpoint or
communication operation.
KYZ_Pulse_Duration_Setting
Output_Relay_1_Pulse_Duration_Setting
Output_Relay_2_Pulse_Duration_Setting
Output_Relay_3_Pulse_Duration_Setting
Defines the duration of each output pulse. These are the choices:
0 = KYZ-style transition output (toggle)
50…1000 = Pulse duration in milliseconds, rounded to the nearest 10 ms.
This parameter is ignored for setpoint or communication operation.
Default_KYZ_State_On_Comm_Loss
Default_Relay_1_State_On_Comm_Loss
Default_Relay_2_State_On_Comm_Loss
Default_Relay_3_State_On_Comm_Loss
In Class 1 scheduled communication operation, this parameter defines the
behavior of the specified output if the power monitor experiences a
communication loss/communication recovery. These are the selections:
0 = Last state/resume
1 = Last state/freeze
2 = De-energize/resume
3 = De-energize/freeze
4 = Local control
Rockwell Automation Publication 1426-UM001G-EN-P - November 2014
155
Chapter 7
Logic Functions
Semantics of selections:
• Last-state = hold the output in its last state on communication loss
• De-energize = put output into de-energized or normal state on
communication loss
• Resume = restore output control when communication recovers
• Freeze = maintain state of output when communication recovers until one
of the following occurs:
– Logic controller enters program mode
– Power cycle to the power monitor
– Change the parameter value to ‘resume’
• Local Control = Revert to local power monitor control (pulsed or
setpoint) on communication loss. When communication recovers and
connection is re-established, output control by the connection host
resumes.
Status
Relay and KYZ output status is reported by the state of the following Boolean
tags, found in the Status.DiscreteIO table. For each tag, 0 = False, 1 = True.
KYZ _Output_Energized
KYZ_Forced_On
KYZ_Forced_Off
Relay_1_Output_Energized
Relay_1_Forced_On
Relay_1_Forced_Off
Relay_2_Output_Energized
Relay_2_Forced_On
Relay_2_Forced_Off
Relay_3_Output_Energized
Relay_3_Forced_On
Relay_3_Forced_Off
Commands
The following command parameters are found in the
Command.System_Registers table. These commands are not permitted if an
Exclusive Owner connection has been established with a Logix controller.
156
Rockwell Automation Publication 1426-UM001G-EN-P - November 2014
Logic Functions
Chapter 7
Command Word One
Set this command word value to execute the corresponding action. These are the
selections:
10 = Force KYZ Output On
11 = Force KYZ Output Off
12 = Remove Force from KYZ
13 = Force Relay 1 Output On
14 = Force Relay 1 Output Off
15 = Remove Force from Relay 1
16 = Force Relay 2 Output On
17 = Force Relay 2 Output Off
18 = Remove Force from Relay 2
19 = Force Relay 3 Output On
20 = Force Relay 3 Output Off
21 = Remove Force from Relay 3
Related Functions
•
•
•
•
Status Inputs
Configuration lock
Status Log
Setpoints
EDS add-on profile
The PowerMonitor 5000 unit has four self-powered (24V DC) status inputs.
Two typical uses for status inputs are to totalize external pulse meters and to
synchronize the demand end of interval (EOI).
Applications
This applies to all models.
Operation
Each time status input 1 sees an off to on transition, the status input 1 scale factor
is added to the status input 1 count. The count continues to increase, rolling over
to zero at a value of 9,999,999,999,999 (1013 – 1). Status input 2, 3 and 4 operate
in the same fashion. The status input 2 counter operates whether or not the input
is used for demand EOI synchronization.
Setup
The setup parameters for pulse totalizing and scaling are in the
Configuration.System.General table and are summarized below.
Rockwell Automation Publication 1426-UM001G-EN-P - November 2014
157
Chapter 7
Logic Functions
Log_Status_Input_Changes
These are the choices:
0 = Disable recording of status input changes into the event log
1 = Enable recording of event input changes into the event log
Status_Input_1_Input_Scale
Status_Input_2_Input_Scale
Status_Input_3_Input_Scale
Status_Input_4_Input_Scale
When a status pulse is received the count is increased by the scale factor. (Input
pulse * input scale) added to total status count.
Setup for demand EOI synchronization is described in Basic Metering on
page 55.
Status
Status input status is reported by the state of the following Boolean tags, found in
the Status.DiscreteIO table. For each tag, 0 = false, 1 = true.
Status_Input_1_Actuated
Status_Input_2_Actuated
Status_Input_3_Actuated
Status_Input_4_Actuated
The scaled value of status input counters are reported in the following tags, found
in the MeteringResults.Energy_Demand table.
Status_1_Count_xM
Status_1_Count_x1
Status_2_Count_xM
Status_2_Count_x1
Status_3_Count_xM
Status_3_Count_x1
Status_4_Count_xM
Status_4_Count_x1
These are the semantics:
X 1 = value time 1, range = 0…999,999
X M = value time 1 million, range = 0…9,999,999
Combined range (X M, X 1) = 0…9,999,999,999,999
158
Rockwell Automation Publication 1426-UM001G-EN-P - November 2014
Logic Functions
Chapter 7
Commands
The following command parameters are found in the
Command.System_Registers table.
Command Word One
Set this command word value to set or reset (to zero) a scaled status input counter
value. These are the selections:
6 = Set Status 1 Count
7 = Set Status 2 Count
8 = Set Status 3 Count
9 = Set Status 4 Count
These commands operate by using the values contained in the tags listed below.
The default values are zero. The semantics are the same as described in the Status
sub-clause above.
Status 1 Count x M Register Set Value
Status 1 Count X 1 Register Set Value
Status 2 Count x M Register Set Value
Status 2 Count X 1 Register Set Value
Status 3 Count x M Register Set Value
Status 3 Count X 1 Register Set Value
Status 4 Count x M Register Set Value
Status 4 Count X 1 Register Set Value
Related Functions
Configuration lock.
Setpoints
A Setpoint tracks the value of a user-selected parameter and when the value meets
user-defined criteria, sets the corresponding Setpoint_Active flag and executes an
optional user-selected action.
Applications
• M5 model: 10 simple setpoints
• M6 and M8 models: 20 simple or logical setpoints with 10 logic gates
Rockwell Automation Publication 1426-UM001G-EN-P - November 2014
159
Chapter 7
Logic Functions
Operation
A PowerMonitor 5000 unit setpoint continually monitors the selected parameter
and evaluates its value against the configured test condition, evaluation types,
threshold, and hysteresis values. The setpoint is armed when the parameter value
satisfies the test condition. A setpoint activates when it has been armed for at
least the assert delay time. The setpoint is dis-armed when the parameter value no
longer satisfies the test condition (including a dead band defined by the hysteresis
value), and de-activates when it has been dis-armed for at least the deassert delay
time.
Each setpoint can be tied to an output action, such as energizing a relay output or
clearing a value. In the M6 and M8 models, setpoints can also be used as inputs to
up to 10 logic gates, which lets you combine setpoints to take specified actions.
The power monitor provides setpoint data including status of each setpoint,
statistics relating to setpoint operations, and a setpoint history log.
See Setpoint and Logic Gate Status on page 174 for more information.
Evaluation Types
The M5 model provides two evaluation types for setpoints:
• Magnitude - the selected parameter is compared against a fixed value
configured by you in the Threshold tag for the setpoint. Magnitude is the
default selection and is typically used with metering values that are analog
in nature.
• State - the selected parameter is compared against a Boolean value (0…1)
configured by you in the Threshold tag for the setpoint. State is typically
used with discrete parameter values that are either off (0) of on (1).
The M6 and M8 models provide two additional evaluation types:
• Percent of Reference - the selected parameter is compared against a
percentage of a fixed nominal reference value. You configure a nominal
value in the Reference Value tag for the setpoint, and configure the
percentage in the Threshold tag for the setpoint. This operates similar to
the Magnitude evaluation type but the power monitor, rather than you,
calculates the percentage of the nominal value.
• Percent of Sliding Reference - the selected parameter is compared against
that parameter’s own sliding average. This evaluation type can identify
rapid variations from a nominal value that changes relatively slowly over
time. You configure the sliding average interval in minutes by setting the
value of the Relative_Setpoint_Interval_m tag, found in the
Configuration.PowerQuality Data Table which has a range of 1…1440
minutes (24 hours). A single Relative_Setpoint_Interval is used for all
setpoints. The sliding average is updated at a rate of one second per minute
of interval. For example, a 5 minute sliding average interval updates every 5
seconds. You configure the percentage of the sliding average in the
Threshold tag for each setpoint. The Reference tag is not used in the
Percent of Sliding Reference evaluation type.
160
Rockwell Automation Publication 1426-UM001G-EN-P - November 2014
Logic Functions
Chapter 7
Simple Setpoint Logic (all models)
The PowerMonitor 5000 unit provides three test conditions for setpoint logic.
Any parameter type is permitted to be used with any test condition. Be sure to
test the operation of your setpoint setup to assure the desired operation.
Greater Than
A Greater Than setpoint test condition arms the setpoint for activation when the
monitored value is greater than the threshold, and dis-arms the setpoint when the
value is less than the threshold less the hysteresis value. Figure 28 illustrates this.
In Figure 28, the setpoint is armed at point A, dis-armed at point B, and armed at
point C. Points d and f also arm the setpoint but the value decreases below the
threshold at points e and g before the assert delay time passes.
Figure 28 - Greater Than Test Condition
Selected
Parameter
b
Threshold
g
d
A
a
Hysteresis
Setpoint
Status
1
C
e f
c
B
Assert
Delay
Assert
Delay
Deassert
Delay
0
Less Than
A Less Than test condition arms the setpoint for activation when the monitored
value is less than the threshold, and dis-arms the setpoint when the value is
greater than the threshold plus hysteresis. Figure 29 illustrates this. In Figure 29,
the setpoint is armed at point A, dis-armed at point B, and armed at point C.
Points d and f also arm the setpoint but the value increase above the threshold at
points e and g before the assert delay time passes.
Figure 29 - Less Than Test Condition
Selected
Parameter
Hysteresis
a
B
Threshold
e f
b
Setpoint 1
Status
0
c
A
Assert
Delay
Rockwell Automation Publication 1426-UM001G-EN-P - November 2014
d
C
g
Assert
Delay
Deassert
Delay
161
Chapter 7
Logic Functions
Equal To
An Equal To test condition arms the setpoint for activation when the monitored
value exactly equals the threshold, and dis-arms the setpoint when the value no
longer equals the threshold. Hysteresis is ignored in the Equal To test condition.
Figure 30 illustrates this. In Figure 30, the setpoint is armed at point A, dis-armed
at point B, and armed at point C. Point d also arms the setpoint but the value
changes at point e before the assert delay time passes.
Figure 30 - Equal To Test Condition
A
Threshold
B
C
d e
Deassert
Delay
Assert
Delay
Output
Assert
Delay
Setpoint Logic Gates (M6 and M8 models)
Up to 10 logic gates can be used to logically combine setpoints to enable output
actions. Each logic gate can have up to four inputs. Select among AND, NAND,
OR, NOR, XOR or XNOR logic. XOR and XNOR use inputs 1 and 2.
In Figure 31, Setpoint Output 1 activates when Setpoint 1 asserts. Setpoint
Output 2 activates when both Setpoint 1 and Setpoint 2 assert.
Figure 31 - Setpoint Example
Setpoint 1
·
·
·
·
·
·
·
·
Parameter Selection 1
Reference Value 1
Test Condition 1
Evaluation Type 1
Threshold 1
Hysteresis 1
Assert Delay Seconds 1
Deassert Delay Seconds 1
Setpoint Output 1
Setpoint Output 1 Input Source : Setpoint 1
Setpoint Output 1 Action
Logic Gate 1
·
Setpoint 2
·
·
·
·
·
·
·
·
162
Parameter Selection 2
Reference Value 2
Test Condition 2
Evaluation Type 2
Threshold 2
Hysteresis 2
Assert Delay Seconds 2
Deassert Delay Seconds 2
·
·
·
·
Logic Level 1 Gate 1
Function: AND
L 1 _ G1 Input 1 : Setpoint 1
L 1 _ G1 Input 2 : Setpoint 2
L 1 _ G1 Input 3 : Disabled
L 1 _ G1 Input 4 : Disabled
Setpoint Output 2
Setpoint Output 2 Input Source : Logic Gate
Setpoint Output 2 Action
Rockwell Automation Publication 1426-UM001G-EN-P - November 2014
1
Logic Functions
Chapter 7
Operation
• AND
An AND gate output asserts when ALL of its enabled inputs are asserted.
Disabled inputs are ignored. If only one input is enabled, the logic gate
output copies the input state.
• NAND
A NAND, or Not-AND, gate output asserts except when ALL of its
enabled inputs are asserted. Disabled inputs are ignored. If only one input
is enabled, the logic gate output inverts the input state.
• OR
An OR gate output asserts when ANY of its enabled inputs are asserted.
Disabled inputs are ignored. If only one input is enabled, the logic gate
output copies the input state.
• NOR
A NOR, or Not-OR, gate asserts when NONE of its enabled inputs are
asserted. Disabled inputs are ignored. If only one input is enabled, the logic
gate output inverts the input state.
• XOR
An XOR, or exclusive-OR, gate asserts when only one of its two inputs is
asserted. An XOR gate must have two and only two inputs enabled. Both
inputs must be configured at the same time or an error results.
• XNOR
An XNOR, or exclusive-NOR, gate asserts when either both of its two
inputs are asserted or both are de-asserted. An XNOR gate must have two
and only two inputs enabled. Both inputs must be configured at the same
time or an error results.
In general, a logic gate is disabled and its output is de-asserted if none of its inputs
are enabled. Except for XOR and XNOR gates, any combination of enabled and
disabled inputs is accepted. The output of a logic gate is not permitted to be used
as the input to a logic gate.
Setpoint Setup
The tags listed below configure the operation of each setpoint, and are found in
the Configuration.Setpoints_1_5 and Configuration.Setpoints_6_10 tables in
the M5 model. The M6 and M8 models also have two additional tables for
setting up setpoints, Configuration.Setpoints_11_15 Data Table and
Configuration.Setpoints_16_20 Data Table, and a Relative_Setpoint_Interval
tag in the Configuration.PowerQuality table for configuring the sliding reference
for all setpoints.
Rockwell Automation Publication 1426-UM001G-EN-P - November 2014
163
Chapter 7
Logic Functions
Parameter Selection n
Selects a power monitor parameter to track. See Setpoint Parameter Selection
List on page 166.
Reference Value n
Used only when Evaluation Type n = 2, Percent of Reference; otherwise
ignored.
Range = -10,000,000…10,000,000, default = 0
Test Condition n
0 = Disable (default)
1 = Less Than
2 = Greater Than
3 = Equals
Evaluation Type n
0 = Magnitude (default)
1 = State (0 = off, 1 = on)
2 = Percent of Reference (M6 and M8 models only)
3 = Percent of Sliding Reference (M6 and M8 models only)
Threshold n
When Evaluation_Type is set to 0 = Magnitude or 1 = State, this parameter
specifies the value or state that arms the Assert Delay timer to activate the
setpoint and trigger the optional output action. When Evaluation_Type is 2 =
Percent of Reference or 3 = Percent of Sliding Reference, this parameter specifies
the percentage of Reference_Value_n which then becomes the effective threshold
for the setpoint. Range: -10,000,000…10,000,000, default = 0
Hysteresis n
The dead band from the Threshold value arms the Deassert Delay timer to deactivate the setpoint and release the optional output action. Hysteresis is ignored
when TestCondition n is ‘Equals’.
Range = 0…10,000,000, default = 0
Assert Delay Seconds n
The amount of time the selected value must satisfy the test condition to activate
the setpoint. Range = 0.000 (default)…3600.
Actual minimum time is equal to the setting of the Realtime_Update_Rate in
Configuration.Metering.Basic.
164
Rockwell Automation Publication 1426-UM001G-EN-P - November 2014
Logic Functions
Chapter 7
Deassert Delay Seconds n
The amount of time the selected value must no longer satisfy the test condition
to activate the setpoint. Range = 0.000…3600.
Actual minimum time is equal to the setting of the Realtime_Update_Rate in
Configuration.Metering.Basic.
Relative_Setpoint_Interval_m
This tag, found in the Configuration.PowerQuality table, defines the length of
the sliding average interval used in all setpoints with Percent of Sliding Reference
evaluation type. Range: 1…1440 minutes, default 60.
Setpoint Logic Gate Setup
The tags listed below can be used to configure setpoint logic gates and are found
in the Configuration.Setpoint_Logic Data Table.
Logic Level 1 Gate n Function
Selects the logic type for the gate. These are the choices:
0 = disabled
1 = AND
2 = NAND
3 = OR
4 = NOR
5 = XOR
6 = XNOR
L1_Gn Input 1
L1_Gn Input 2
L1_Gn Input 3
L1_Gn Input 4
Selects input parameters for the nth logic gate (n = 1 … 10). Each AND, NAND,
OR, and NOR gate has up to four inputs. These are the choices:
0 = Disabled
1 = Setpoint 1; -1 = Setpoint 1 inverted
2 = Setpoint 2; -2 = Setpoint 2 inverted
3 = Setpoint 3; -3 = Setpoint 3 inverted
…
20 = Setpoint 20; -20 = Setpoint 20 inverted
IMPORTANT
XOR and XNOR use Inputs 1 and 2; both must be configured at the same time,
otherwise an error is reported and the logic gate configuration is rejected.
Rockwell Automation Publication 1426-UM001G-EN-P - November 2014
165
Chapter 7
Logic Functions
Setpoint Output Setup
The Status.Alarms table contains a status bit that is on when each setpoint or
logic gate is active and is off when the setpoint or logic gate is not active. You can
optionally assign an output action, such as energizing a relay output or clearing a
counter. It is not necessary to assign an output action; many applications can
monitor the setpoint or logic gate status bits in the Status.Alarms table. The tags
listed below can be used to optionally tie output actions to setpoints, and are
found in the Configuration.Setpoint_Outputs table.
Setpoint Output n Input Source
The Setpoint Output n (1, 2, …) Input Source specifies the setpoint or logic gate
to associate with the output action.
1…10 = Setpoints 1…1
11…20 = Setpoints 11…20 (M6 and M8 models)
21…30 = Level 1 Logic Gates 1…10 (M6 and M8 models)
Setpoint Output n Action
See Setpoint Output Action List on page 173 for selections.
Setpoint Reference Tables
Table 25 - Setpoint Parameter Selection List
Parameter Parameter Tag Name
Number
166
Units
Range
M5
M6
M8
X
X
X
0
None
1
V1_N_Volts
V
0…9.999E15
X
X
X
2
V2_N_Volts
V
0…9.999E15
X
X
X
3
V3_N_Volts
V
0…9.999E15
X
X
X
4
VGN_N_Volts
V
0…9.999E15
X
X
X
5
Avg_V_N_Volts
V
0…9.999E15
X
X
X
6
V1_V2_Volts
V
0…9.999E15
X
X
X
7
V2_V3_Volts
V
0…9.999E15
X
X
X
8
V3_V1_Volts
V
0…9.999E15
X
X
X
9
Avg_VL_VL_Volts
V
0…9.999E15
X
X
X
10
I1_Amps
A
0…9.999E15
X
X
X
11
I2_Amps
A
0…9.999E15
X
X
X
12
I3_Amps
A
0…9.999E15
X
X
X
13
I4_Amps
A
0…9.999E15
X
X
X
14
Avg_Amps
A
0…9.999E15
X
X
X
Rockwell Automation Publication 1426-UM001G-EN-P - November 2014
Logic Functions
Chapter 7
Table 25 - Setpoint Parameter Selection List
Parameter Parameter Tag Name
Number
Units
Range
M5
M6
M8
15
Frequency_Hz
Hz
40.00…70.00
X
X
X
16
L1_kW
kW
-9.999E15…9.999E15
X
X
X
17
L2_kW
kW
-9.999E15…9.999E15
X
X
X
18
L3_kW
kW
-9.999E15…9.999E15
X
X
X
19
Total_kW
kW
-9.999E15…9.999E15
X
X
X
20
L1_kVAR
kVAR
-9.999E15…9.999E15
X
X
X
21
L2_kVAR
kVAR
-9.999E15…9.999E15
X
X
X
22
L3_kVAR
kVAR
-9.999E15…9.999E15
X
X
X
23
Total_kVAR
kVAR
-9.999E15…9.999E15
X
X
X
24
L1_kVA
kVA
0…9.999E15
X
X
X
25
L2_kVA
kVA
0…9.999E15
X
X
X
26
L3_kVA
kVA
0…9.999E15
X
X
X
27
Total_kVA
kVA
0…9.999E15
X
X
X
28
L1_True_PF
%
0.00…100.00
X
X
X
29
L2_True_PF
%
0.00…100.00
X
X
X
30
L3_True_PF
%
0.00…100.00
X
X
X
31
Total_True_PF
%
0.00…100.00
X
X
X
32
L1_Disp_PF
%
0.00…100.00
X
X
X
33
L2_Disp_PF
%
0.00…100.00
X
X
X
34
L3_Disp_PF
%
0.00…100.00
X
X
X
35
Total_Disp_PF
%
0.00…100.00
X
X
X
36
L1_PF_Lead_Lag_Indicator
-
-1 or 1
X
X
X
37
L2_PF_Lead_Lag_Indicator
-
-1 or 1
X
X
X
38
L3_PF_Lead_Lag_Indicator
-
-1 or 1
X
X
X
39
Total_PF_Lead_Lag_Indicator
-
-1 or 1
X
X
X
40
V1_Crest_Factor
-
0…9.999E15
X
X
X
41
V2_Crest_Factor
-
0…9.999E15
X
X
X
42
V3_Crest_Factor
-
0…9.999E15
X
X
X
43
V1_V2_Crest_Factor
-
0…9.999E15
X
X
X
44
V2_V3_Crest_Factor
-
0…9.999E15
X
X
X
45
V3_V1_Crest_Factor
-
0…9.999E15
X
X
X
46
I1_Crest_Factor
-
0…9.999E15
X
X
X
47
I2_Crest_Factor
-
0…9.999E15
X
X
X
48
I3_Crest_Factor
-
0…9.999E15
X
X
X
49
I4_Crest_Factor
-
0…9.999E15
X
X
X
50
V1_IEEE_THD_%
%
0.00…100.00
X
X
X
51
V2_IEEE_THD_%
%
0.00…100.00
X
X
X
52
V3_IEEE_THD_%
%
0.00…100.00
X
X
X
53
VN_G_IEEE_THD_%
%
0.00…100.00
X
X
X
Rockwell Automation Publication 1426-UM001G-EN-P - November 2014
167
Chapter 7
Logic Functions
Table 25 - Setpoint Parameter Selection List
168
Parameter Parameter Tag Name
Number
Units
Range
M5
M6
M8
54
Avg_IEEE_THD_V_%
%
0.00…100.00
X
X
X
55
V1_V2_IEEE_THD_%
%
0.00…100.00
X
X
X
56
V2_V3_IEEE_THD_%
%
0.00…100.00
X
X
X
57
V3_V1_IEEE_THD_%
%
0.00…100.00
X
X
X
58
Avg_IEEE_THD_V_V_%
%
0.00…100.00
X
X
X
59
I1_IEEE_THD_%
%
0.00…100.00
X
X
X
60
I2_IEEE_THD_%
%
0.00…100.00
X
X
X
61
I3_IEEE_THD_%
%
0.00…100.00
X
X
X
62
I4_IEEE_THD_%
%
0.00…100.00
X
X
X
63
Avg_IEEE_THD_I_%
%
0.00…100.00
X
X
X
64
V1_IEC_THD_%
%
0.00…100.00
X
X
X
65
V2_IEC_THD_%
%
0.00…100.00
X
X
X
66
V3_IEC_THD_%
%
0.00…100.00
X
X
X
67
VN_G_IEC_THD_%
%
0.00…100.00
X
X
X
68
Avg_IEC_THD_V_%
%
0.00…100.00
X
X
X
69
V1_V2_IEC_THD_%
%
0.00…100.00
X
X
X
70
V2_V3_IEC_THD_%
%
0.00…100.00
X
X
X
71
V3_V1_IEC_THD_%
%
0.00…100.00
X
X
X
72
Avg_IEC_THD_V_V_%
%
0.00…100.00
X
X
X
73
I1_IEC_THD_%
%
0.00…100.00
X
X
X
74
I2_IEC_THD_%
%
0.00…100.00
X
X
X
75
I3_IEC_THD_%
%
0.00…100.00
X
X
X
76
I4_IEC_THD_%
%
0.00…100.00
X
X
X
77
Avg_IEC_THD_I_%
%
0.00…100.00
X
X
X
78
I1_K_Factor
-
1.00…25000.00
X
X
X
79
I2_K_Factor
-
1.00…25000.00
X
X
X
80
I3_K_Factor
-
1.00…25000.00
X
X
X
81
Pos_Seq_Volts
V
0…9.999E15
X
X
X
82
Neg_Seq_Volts
V
0…9.999E15
X
X
X
83
Zero_Seq_Volts
V
0…9.999E15
X
X
X
84
Pos_Seq_Amps
A
0…9.999E15
X
X
X
85
Neg_Seq_Amps
A
0…9.999E15
X
X
X
86
Zero_Seq_Amps
A
0…9.999E15
X
X
X
87
Voltage_Unbalance_%
%
0.00…100.00
X
X
X
88
Current_Unbalance_%
%
0.00…100.00
X
X
X
89
kW Demand
kW
±0.000…9,999,999
X
X
X
90
kVAR Demand
kVAR
±0.000…9,999,999
X
X
X
91
kVA Demand
kVA
0.000…9,999,999
X
X
X
92
Demand PF
%
-100.0…+100.0
X
X
X
Rockwell Automation Publication 1426-UM001G-EN-P - November 2014
Logic Functions
Chapter 7
Table 25 - Setpoint Parameter Selection List
Parameter Parameter Tag Name
Number
Units
Range
M5
M6
M8
93
Demand Amps
A
0.000…9,999,999
X
X
X
94
Projected_kW_Demand
kW
-9,999,999…9,999,999
X
X
X
95
Projected_kVAR_Demand
kVAR
-9,999,999…9,999,999
X
X
X
96
Projected_kVA_Demand
kVA
0.000…9,999,999
X
X
X
97
Projected_Ampere_Demand
A
0.000…9,999,999
X
X
X
98
Status_Input_1_Actuated
0 or 1
X
X
X
99
Status_Input_2_Actuated
0 or 1
X
X
X
100
Status_Input_3_Actuated
0 or 1
X
X
X
101
Status_Input_4_Actuated
0 or 1
X
X
X
102
Log_Status
See Status.Alarms table
X
X
X
103
PowerQuality_Status
See Status.Alarms table
X
X
X
104
Over_Range_Information
See Status.Alarms table
X
X
X
105
Metering_Status
See Status.Alarms table
X
X
X
106
200mS_V1_N_Magnitude
V
0.000…9,999,999
X
107
200mS_V2_N_Magnitude
V
0.000…9,999,999
X
108
200mS_V3_N_Magnitude
V
0.000…9,999,999
X
109
200mS_VN_G_Magnitude
V
0.000…9,999,999
X
110
200mS_VN_Ave_Magnitude
V
0.000…9,999,999
X
111
200mS_V1_V2_Magnitude
V
0.000…9,999,999
X
112
200mS_V2_V3_Magnitude
V
0.000…9,999,999
X
113
200mS_V3_V1_Magnitude
V
0.000…9,999,999
X
114
200mS_VV_Ave_Magnitude
V
0.000…9,999,999
X
115
200mS_I1_Amps_Magnitude
A
0.000…9,999,999
X
116
200mS_I2_Amps_Magnitude
A
0.000…9,999,999
X
117
200mS_I3_Amps_Magnitude
A
0.000…9,999,999
X
118
200mS_I4_Amps_Magnitude
A
0.000…9,999,999
X
119
200mS_Amps_Ave_Magnitude
A
0.000…9,999,999
X
120
200mS_L1_kW
kW
-9.999E15…9.999E15
X
121
200mS_L2_kW
kW
-9.999E15…9.999E15
X
122
200mS_L3_kW
kW
-9.999E15…9.999E15
X
123
200mS_Total_kW
kW
-9.999E15…9.999E15
X
124
200mS_L1_kVAR
kVAR
-9.999E15…9.999E15
X
125
200mS_L2_kVAR
kVAR
-9.999E15…9.999E15
X
126
200mS_L3_kVAR
kVAR
-9.999E15…9.999E15
X
127
200mS_Total_kVAR
kVAR
-9.999E15…9.999E15
X
128
200mS_L1_kVA
kVA
0.000…9.999E15
X
129
200mS_L2_kVA
kVA
0.000…9.999E15
X
130
200mS_L3_kVA
kVA
0.000…9.999E15
X
131
200mS_Total_kVA
kVA
0.000…9.999E15
X
Rockwell Automation Publication 1426-UM001G-EN-P - November 2014
169
Chapter 7
Logic Functions
Table 25 - Setpoint Parameter Selection List
170
Parameter Parameter Tag Name
Number
Units
Range
M5
M6
M8
132
200mS_L1_True_PF
%
0.00…100.00
X
133
200mS_L2_True_PF
%
0.00…100.00
X
134
200mS_L3_True_PF
%
0.00…100.00
X
135
200mS_Total_True_PF
%
0.00…100.00
X
136
200mS_L1_Disp_PF
%
0.00…100.00
X
137
200mS_L2_Disp_PF
%
0.00…100.00
X
138
200mS_L3_Disp_PF
%
0.00…100.00
X
139
200mS_Total_Disp_PF
%
0.00…100.00
X
140
200mS_V1_N_IEEE_THD_%
%
0.00…100.00
X
141
200mS_V2_N_IEEE_THD_%
%
0.00…100.00
X
142
200mS_V3_N_IEEE_THD_%
%
0.00…100.00
X
143
200mS_VN_G_IEEE_THD_%
%
0.00…100.00
X
144
200mS_Avg_IEEE_THD_V_%
%
0.00…100.00
X
145
200mS_V1_V2_IEEE_THD_%
%
0.00…100.00
X
146
200mS_V2_V3_IEEE_THD_%
%
0.00…100.00
X
147
200mS_V3_V1_IEEE_THD_%
%
0.00…100.00
X
148
200mS_Avg_IEEE_THD_V_V_%
%
0.00…100.00
X
149
200mS_I1_IEEE_THD_%
%
0.00…100.00
X
150
200mS_I2_IEEE_THD_%
%
0.00…100.00
X
151
200mS_I3_IEEE_THD_%
%
0.00…100.00
X
152
200mS_I4_IEEE_THD_%
%
0.00…100.00
X
153
200mS_Avg_IEEE_THD_I_%
%
0.00…100.00
X
154
200mS_V1_N_IEC_THD_%
%
0.00…100.00
X
155
200mS_V2_N_IEC_THD_%
%
0.00…100.00
X
156
200mS_V3_N_IEC_THD_%
%
0.00…100.00
X
157
200mS_VN_G_IEC_THD_%
%
0.00…100.00
X
158
200mS_Avg_IEC_THD_V_%
%
0.00…100.00
X
159
200mS_V1_V2_IEC_THD_%
%
0.00…100.00
X
160
200mS_V2_V3_IEC_THD_%
%
0.00…100.00
X
161
200mS_V3_V1_IEC_THD_%
%
0.00…100.00
X
162
200mS_Avg_IEC_THD_V_V_%
%
0.00…100.00
X
163
200mS_I1_IEC_THD_%
%
0.00…100.00
X
164
200mS_I2_IEC_THD_%
%
0.00…100.00
X
165
200mS_I3_IEC_THD_%
%
0.00…100.00
X
166
200mS_I4_IEC_THD_%
%
0.00…100.00
X
167
200mS_Avg_IEC_THD_I_%
%
0.00…100.00
X
168
200mS_V1_N_THDS
%
0.00…100.00
X
169
200mS_V2_N_THDS
%
0.00…100.00
X
170
200mS_V3_N_THDS
%
0.00…100.00
X
Rockwell Automation Publication 1426-UM001G-EN-P - November 2014
Logic Functions
Chapter 7
Table 25 - Setpoint Parameter Selection List
Parameter Parameter Tag Name
Number
Units
Range
171
200mS_VN_G_THDS
%
0.00…100.00
X
172
200mS_AVE_VN_THDS
%
0.00…100.00
X
173
200mS_V1_V2_THDS
%
0.00…100.00
X
174
200mS_V2_V3_THDS
%
0.00…100.00
X
175
200mS_V3_V1_THDS
%
0.00…100.00
X
176
200mS_AVE_LL_THDS
%
0.00…100.00
X
177
200mS_V1_N_TIHDS
%
0.00…100.00
X
178
200mS_V2_N_TIHDS
%
0.00…100.00
X
179
200mS_V3_N_TIHDS
%
0.00…100.00
X
180
200mS_VN_G_TIHDS
%
0.00…100.00
X
181
200mS_AVE_VN_TIHDS
%
0.00…100.00
X
182
200mS_V1_V2_TIHDS
%
0.00…100.00
X
183
200mS_V2_V3_TIHDS
%
0.00…100.00
X
184
200mS_V3_V1_TIHDS
%
0.00…100.00
X
185
200mS_AVE_LL_TIHDS
%
0.00…100.00
X
186
200mS_I1_K_Factor
-
1.00…25000.00
X
187
200mS_I2_K_Factor
-
1.00…25000.00
X
188
200mS_I3_K_Factor
-
1.00…25000.00
X
189
200mS_Pos_Seq_Volts
V
0…9.999E15
X
190
200mS_Neg_Seq_Volts
V
0…9.999E15
X
191
200mS_Zero_Seq_Volts
V
0…9.999E15
X
192
200mS_Pos_Seq_Amps
A
0…9.999E15
X
193
200mS_Neg_Seq_Amps
A
0…9.999E15
X
194
200mS_Zero_Seq_Amps
A
0…9.999E15
X
195
200mS_Voltage_Unbalance_%
%
0.00…100.00
X
196
200mS_Current_Unbalance_%
%
0.00…100.00
X
197
10s_Power_Frequency
Hz
40.00…70.00
X
198
3s_V1_N_Magnitude
V
0…9.999E15
X
199
10m_V1_N_Magnitude
V
0…9.999E15
X
200
2h_V1_N_Magnitude
V
0…9.999E15
X
201
3s_V2_N_Magnitude
V
0…9.999E15
X
202
10m_V2_N_Magnitude
V
0…9.999E15
X
203
2h_V2_N_Magnitude
V
0…9.999E15
X
204
3s_V3_N_Magnitude
V
0…9.999E15
X
205
10m_V3_N_Magnitude
V
0…9.999E15
X
206
2h_V3_N_Magnitude
V
0…9.999E15
X
207
3s_VN_G_Magnitude
V
0…9.999E15
X
208
10m_VN_G_Magnitude
V
0…9.999E15
X
209
2h_VN_G_Magnitude
V
0…9.999E15
X
Rockwell Automation Publication 1426-UM001G-EN-P - November 2014
M5
M6
M8
171
Chapter 7
Logic Functions
Table 25 - Setpoint Parameter Selection List
172
Parameter Parameter Tag Name
Number
Units
Range
210
3s_V1_V2_Magnitude
V
0…9.999E15
X
211
10m_V1_V2_Magnitude
V
0…9.999E15
X
212
2h_V1_V2_Magnitude
V
0…9.999E15
X
213
3s_V2_V3_Magnitude
V
0…9.999E15
X
214
10m_V2_V3_Magnitude
V
0…9.999E15
X
215
2h_V2_V3_Magnitude
V
0…9.999E15
X
216
3s_V3_V1_Magnitude
V
0…9.999E15
X
217
10m_V3_V1_Magnitude
V
0…9.999E15
X
218
2h_V3_V1_Magnitude
V
0…9.999E15
X
219
CH1_Short_Term_Flicker_Pst
Pst
0.0…100.00
X
220
CH1_Long_Term_Flicker_Plt
Plt
0.0…100.00
X
221
CH2_Short_Term_Flicker_Pst
Pst
0.0…100.00
X
222
CH2_Long_Term_Flicker_Plt
Plt
0.0…100.00
X
223
CH3_Short_Term_Flicker_Pst
Pst
0.0…100.00
X
224
CH3_Long_Term_Flicker_Plt
Plt
0.0…100.00
X
225
200mS_CH1_Mains_Signaling_Voltage
V
0…9.999E15
X
226
200mS_CH2_Mains_Signaling_Voltage
V
0…9.999E15
X
227
200mS_CH3_Mains_Signaling_Voltage
V
0…9.999E15
X
228
3s_Voltage_Unbalance
%
0.0…100.00
X
229
10m_Voltage_Unbalance
%
0.0…100.00
X
230
2h_Voltage_Unbalance
%
0.0…100.00
X
Rockwell Automation Publication 1426-UM001G-EN-P - November 2014
M5
M6
M8
Logic Functions
Chapter 7
Table 26 - Setpoint Output Action List
Parameter Number
Action Name
0
None
1
Energize Relay 1
2
Energize Relay 2
3
Energize Relay 3
4
Energize KYZ
5
Clear kWh result
6
Clear kVARh result
7
Clear kVAh result
8
Clear Ah result
9
Clear all energy results
10
Clear setpoint #1 time accumulator and transition count
11
Clear setpoint #2 time accumulator and transition count
12
Clear setpoint #3 time accumulator and transition count
13
Clear setpoint #4 time accumulator and transition count
14
Clear setpoint #5 time accumulator and transition count
15
Clear setpoint #6 time accumulator and transition count
16
Clear setpoint #7 time accumulator and transition count
17
Clear setpoint #8 time accumulator and transition count
18
Clear setpoint #9 time accumulator and transition count
19
Clear setpoint #10 time accumulator and transition count
20
Clear setpoint #11 time accumulator and transition count
21
Clear setpoint #12 time accumulator and transition count
22
Clear setpoint #13 time accumulator and transition count
23
Clear setpoint #14 time accumulator and transition count
24
Clear setpoint #15 time accumulator and transition count
25
Clear setpoint #16 time accumulator and transition count
26
Clear setpoint #17 time accumulator and transition count
27
Clear setpoint #18 time accumulator and transition count
28
Clear setpoint #19 time accumulator and transition count
29
Clear setpoint #20 time accumulator and transition count
30
Start Trigger Data logging
Rockwell Automation Publication 1426-UM001G-EN-P - November 2014
173
Chapter 7
Logic Functions
Setpoint and Logic Gate Status
Setpoint status is reported in the following tags, found in the Status.Alarms table.
Setpoints_1_10_Active
Bit 0 = Setpoint1_Active (0 = False, 1 = True)
Bit 1 = Setpoint2_Active
…
Bit 9 = Setpoint10_Active
Setpoints_11_20_Active (M6 and M8 models)
Bit 0 = Setpoint11_Active (0 = False, 1 = True)
Bit 1 = Setpoint12_Active
…
Bit 9 = Setpoint20_Active
Logic_Level_1 Gates_Active (M6 and M8 models)
Bit 0 = Level1_Gate1_Active (0 = False, 1 = True)
Bit 1 = Level1_Gate2_Active
…
Bit 9 = Level1_Gate10_Active
Setpoint and Logic Gate Statistics
Setpoint statistics are reported in the Statistics.Setpoint_Output table, which
includes the following information tags for each setpoint.
Setpoint n Seconds Accumulator
Setpoint n Minutes Accumulator
Setpoint n Hours Accumulator
Setpoint n Transitions to Active x1
Setpoint n Transitions to Active x1000
Logic gate statistics are reported in the Statistics.Setpoint_Logic Data Table,
which reports the information listed above for each logic gate.
Commands
The following command parameters are found in the
Command.System_Registers table.
174
Rockwell Automation Publication 1426-UM001G-EN-P - November 2014
Logic Functions
Chapter 7
Command Word Two
Set this command word value to execute the listed action. These are the
selections:
6 = Clear Setpoint Log
7 = Clear Setpoint (Time) Accumulators
18 = Clear Setpoint Logic Gate (Time) Accumulators
Clear Setpoint Accumulators operates by using the value contained in the tag
listed below. The default value is zero.
Clear Single Setpoint or Logic Gate Accumulator
0 = Clear all time accumulators
1…20 = Clear selected time accumulator
Related Functions
•
•
•
•
Basic Metering
Status Inputs
KYZ and Relay Outputs
Power Quality Monitoring
Rockwell Automation Publication 1426-UM001G-EN-P - November 2014
175
Chapter 7
Logic Functions
Notes:
176
Rockwell Automation Publication 1426-UM001G-EN-P - November 2014
Chapter
8
Other Functions
Table
Page
Security
177
Date and Time Functions
179
Network Time Synchronization
181
System Error Response
184
Miscellaneous Commands
186
This section describes the functions of the PowerMonitor 5000 unit. Most
functions require you to configure set-up parameters to align the unit with your
installation and your application requirements. The set-up parameters are listed
by name and described in this section. You can view set-up parameters by using
the PowerMonitor 5000 web page, and when logged in to an Admin account,
make changes to the setup. Set-up parameters are also accessible by using
communication.
Please refer to the Data Tables for additional information on setup parameters
including the following:
• Range of valid values
• Default values
• Data type
Set-up parameters can be found in data tables with names beginning with
‘Configuration’, for instance Configuration.Metering_Basic.
Security
The PowerMonitor 5000 unit protects access against unauthorized set-up
changes through an account-based security system.
IMPORTANT
Security is disabled by default.
With security disabled, any application or web page user effectively has admin
privileges. We do not recommend operating the unit with security disabled
except during evaluation, testing, or initial setup.
Please refer to Set Up Initial Security on page 50 for the procedure to enable
security if desired and set up one or more Admin class accounts for configuration
access from the Ethernet network.
Rockwell Automation Publication 1426-UM001G-EN-P - November 2014
177
Chapter 8
Other Functions
Once security is enabled and an Admin class account is set up during initial
configuration, the remaining security configuration can be done through the
network web page.
If you want to configure power monitors by using software, such as FactoryTalk
EnergyMetrix RT software, set up at least one Application class account.
This table summarizes the security classes, privileges, access, and limits that apply
to the PowerMonitor 5000 unit.
Table 27 - Account Classes and Privileges
Account Class
Privileges
Interface
Maximum Number of Accounts
USB admin
Manage security accounts
Read data
Write configuration parameters
Download log files
USB only web page
1
Admin
Manage security accounts
Read data
Write configuration parameters
Download log files
USB and native Ethernet web page
10
User
Read data
Download log files
USB and native Ethernet web page
20
Application
Read data
Write configuration parameters
Download log files
Native EtherNet/IP and optional DeviceNet
communication CIP assembly and
parameters objects CSP/PCCC data tables
10
privileges with security disabled (all)
Read data
Write configuration parameters
Download log files
Any
-
security enabled but no user logged in
Read data
Any
-
The following rules further define security operation:
• The USB Admin account can be accessed only through the web page when
connected via USB.
• Only one Admin can be active at a time, including the USB Admin class.
• A logged in account remains active until logged out or until 30 minutes has
elapsed without writing a configuration parameter. FTP access to log files
remains until the account is logged out.
• Only an Admin class account can add, remove, or edit accounts. An
Admin class account cannot delete itself and the default USB Admin
account cannot be deleted.
• An Application class account is used for access by using CIP or PCCC
protocols via native Ethernet network or optional DeviceNet network
communication. An Application class account logs in by writing its
username to the Security.Username table and then its password to the
Security.Password table within 30 seconds. An application can obtain
security status information by reading the Status.TableWrite data table.
178
Rockwell Automation Publication 1426-UM001G-EN-P - November 2014
Other Functions
Chapter 8
If an Exclusive Owner connection has been set up between a Logix controller and
the PowerMonitor 5000 unit, configuration of the power monitor is permitted
only through the controller. Attempts to change configuration by using the web
interface or other means returns an ownership conflict error.
The PowerMonitor 5000 unit does not have a ‘backdoor’ password. If security
accounts are inadvertently deleted or login credentials are lost, connect to the
power monitor by using USB and log in to the USB Admin account to edit and/
or create new accounts to restore security access.
Security configuration using messaging on the optional DeviceNet network is
not supported.
Date and Time Functions
The PowerMonitor 5000 unit internal clock and calendar is used in demand
metering and data logging functions. A number of user-selectable options are
available for synchronizing and controlling the internal clock and calendar.
Daylight Saving Time is disabled by default. With DST enabled, the power
monitor internal clock advances by one hour on the start date and hour specified,
and is set back by one hour on the return date and hour specified. The defaults
represent the common DST start and return date/times in the use in the United
States since 2006. The DST function also adjusts the network-time sync offset
when used.
Applications
This applies to all models.
Date and Time Parameters
• Date: Year, Month, Day
• Time: Hour, Minute, Seconds, Milliseconds
Setup
Basic date and time parameters are found in the Configuration.DateTime table.
Date_Year
These are the values: 1970…2100 (default = 2010)
Date_Month
These are the values: 1 (default)…12
Rockwell Automation Publication 1426-UM001G-EN-P - November 2014
179
Chapter 8
Other Functions
Date_Day
These are the values: 1 (default)…31
Time_Hour
These are the values: 0 (default)…23
Time_Minute
These are the values: 0 (default)…59
Time_Seconds
These are the values: 0 (default)…59
Time_Milliseconds
These are the values: 0 (default)…999
Daylight Saving Time Setup
Daylight saving time (DST) setup parameters are found in the
Configuration.System.General table.
The DST format is split into Month/Week/Day:
• Month Settings: 01= January 12= December
• Week Settings: 01=1st week 05= last week
• Day Settings: 01= Sunday, 07 = Saturday
• For example: 040107= April/1st Week/Saturday
Parameter
Description
Range
Default
0…23
2 a.m.
10101…120507
30201 March, 2nd week,
Sunday
Return_from_Daylight_Sa Format same as start date
vings_Month/Week/Day
10101…120507
110101 November, 1st
week, Sunday
Hour_of_Day_End
0…23
2 a.m.
Hour_of_ Day_Start
Daylight_Savings_Month/
Week/Day_Start
180
Format is Month/Week/
Day. (See above for
clarification)
Rockwell Automation Publication 1426-UM001G-EN-P - November 2014
Other Functions
Network Time
Synchronization
Chapter 8
The PowerMonitor 5000 unit can be set up to synchronize its system clock by
using Network Time Synchronization. Network time synchronization clock
sources provide better precision and improved coordination between multiple
meters. Two different methods of time synchronization are supported, simple
network time protocol (SNTP) or precision time protocol (PTP).
Applications
This applies to all models.
Operation
With SNTP selected as the time sync source, the power monitor updates its time
from a simple network time protocol server or an anycast group of SNTP servers,
depending on set-up parameter values. This requires an available SNTP time
server.
When PTP is selected, the power monitor updates its time from a precision time
protocol master clock. A PTP master clock source must be available. PTP is the
more accurate of the two network time synchronization options.
IMPORTANT
Quality of Service (QoS) is a general term that is applied to mechanisms used to
treat traffic streams with different relative priorities or other delivery
characteristics. Standard QoS mechanisms include IEEE 802.1D/Q (Ethernet
frame priority) and Differentiated Services (DiffServ) in the TCP/IP protocol
suite. The QoS Object provides a means to configure certain QoS-related
behaviors in EtherNet/IP devices. QoS by default is enabled. We suggest that
you do not change the default values.
Rockwell Automation Publication 1426-UM001G-EN-P - November 2014
181
Chapter 8
Other Functions
Setup
The Network Time Synchronization set-up parameters for SNTP and PTP are
found in the Configuration.Communications_Native table.
Parameter
Description
Range
Default
Time_Sync_Source
Selection for Time Sync
0 = Disable
1 = SNTP
2 = PTP_Slave
3 = PTP_Master
0…2
2
SNTP_Mode_Select
0 = Unicast
1= Anycast Mode
The SNTP address is a broadcast address of an anycast group
0…1
0
SNTP_Update_Interval
Number of seconds before next update
1…32766
300
SNTP_Time_Zone
The time zone in which the power monitor is located
0…32
6 (Central Time)
SNTP Time Server IP
Unicast server or anycast group IP address in format aaa.bbb.ccc.ddd
0.0.0.0…255.255.255.255
0.0.0.0
QOS_DSCP_Enable
0 = Disable
1 = Enable
0…1
1
QOS_DSCP_PTP_Event
PTP (IEEE 1588) event messages
0…63
59
QOS_DSCP_PTP_General
PTP (IEEE 1588) general messages
0…63
47
QOS_DSCP_Urgent
CIP transport class 0/1 messages with Urgent priority
0…63
55
QOS_DSCP_Scheduled
CIP transport class 0/1 messages with Scheduled priority
0…63
47
QOS_DSCP_High
CIP transport class 0/1 messages with high priority
0…63
43
QOS_DSCP_Low
CIP transport class 0/1 messages with low priority
0…63
31
QOS_DSCP_Explicit
CIP UCMM CIP class 3
0…63
27
Time Zones
Table 28 - Time Zone Information
Value
Offset
from GMT
Time Zone Name
Areas in Time Zone
0
GMT-12:00
Dateline Standard Time
Eniwetok, Kwajalein
1
GMT-11:00
Samoa Standard Time
Midway Island, Samoa
2
GMT-10:00
Hawaiian Standard Time
Hawaii
3
GMT-09:00
Alaskan Standard Time
Alaska
4
GMT-08:00
Pacific Standard Time
Pacific Time (US & Canada,; Tijuana)
5
GMT-07:00
Mountain Standard Time
Mountain Time (US & Canada)
US Mountain Standard Time
Arizona
Canada Central Standard Time
Saskatchewan
6
182
GMT-06:00
Central America Standard Time
Central America
Central Standard Time
Central Time (US & Canada)
Mexico Standard Time
Mexico City
Rockwell Automation Publication 1426-UM001G-EN-P - November 2014
Other Functions
Chapter 8
Table 28 - Time Zone Information
Value
Offset
from GMT
Time Zone Name
Areas in Time Zone
7
GMT-05:00
Eastern Standard Time
Eastern Time (US & Canada)
SA Pacific Standard Time
Bogota, Lima, Quito
US Eastern Standard Time
Indiana (East)
Atlantic Standard Time
Atlantic Time (Canada)
Pacific SA Standard Time
Santiago
SA Western Standard Time
Caracas, La Paz
8
GMT-04:00
9
GMT-03:30
Newfoundland Standard Time
Newfoundland
10
GMT-03:00
E. South America Standard Time
Brasilia
Greenland Standard Time
Greenland
SA Eastern Standard Time
Buenos Aires, Georgetown
11
GMT-02:00
Mid-Atlantic Standard Time
Mid-Atlantic
12
GMT-01:00
Azores Standard Time
Azores
Cape Verde Standard Time
Cape Verde Is.
Standard Time
Greenwich Mean Time : Dublin, Edinburgh, Lisbon,
London
Greenwich Standard Time
Casablanca, Monrovia
13
14
15
16
GMT
GMT+01:00 Central Europe Standard Time
Belgrade, Bratislava, Budapest, Ljubljana, Prague
Central European Standard Time
Sarajevo, Skopje, Sofija, Vilnius, Warsaw, Zagreb
Romance Standard Time
Brussels, Copenhagen, Madrid, Paris
W. Central Africa Standard Time
West Central Africa
W. Europe Standard Time
Amsterdam, Berlin, Bern, Rome, Stockholm, Vienna
GMT+02:00 E. Europe Standard Time
Bucharest
Egypt Standard Time
Cairo
FLE Standard Time
Helsinki, Riga, Tallinn
GTB Standard Time
Athens, Istanbul, Minsk
Israel Standard Time
Jerusalem
South Africa Standard Time
Harare, Pretoria
GMT+03:00 Arab Standard Time
Kuwait, Riyadh
Arabic Standard Time
Baghdad
E. Africa Standard Time
Nairobi
Russian Standard Time
Moscow, St. Petersburg, Volgograd
17
GMT+03:30 Iran Standard Time
Tehran
18
GMT+04:00 Arabian Standard Time
Abu Dhabi, Muscat
Caucasus Standard Time
Baku, Tbilisi, Yerevan
19
GMT+04:30 Afghanistan Standard Time
Kabul
20
GMT+05:00 Ekaterinburg Standard Time
Ekaterinburg
West Asia Standard Time
Islamabad, Karachi, Tashkent
21
GMT+05:30 India Standard Time
Calcutta, Chennai, Mumbai, New Delhi
22
GMT+05:45 Nepal Standard Time
Kathmandu
Rockwell Automation Publication 1426-UM001G-EN-P - November 2014
183
Chapter 8
Other Functions
Table 28 - Time Zone Information
Value
Offset
from GMT
Time Zone Name
23
GMT+06:00 Central Asia Standard Time
Areas in Time Zone
Astana, Dhaka
N. Central Asia Standard Time
Almaty, Novosibirsk
Sri Lanka Standard Time
Sri Jayawardenepura
24
GMT+06:30 Myanmar Standard Time
Rangoon
25
GMT+07:00 North Asia Standard Time
Krasnoyarsk
SE Asia Standard Time
26
27
28
GMT+08:00 China Standard Time
Beijing, Chongqing, Hong Kong, Urumqi
North Asia East Standard Time
Irkutsk, Ulaan Bataar
Singapore Standard Time
Kuala Lumpur, Singapore
Taipei Standard Time
Taipei
W. Australia Standard Time
Perth
GMT+09:00 Korea Standard Time
Seoul
Tokyo Standard Time
Osaka, Sapporo, Tokyo
Yakutsk Standard Time
Yakutsk
GMT+09:30 AUS Central Standard Time
Cen. Australia Standard Time
29
Bangkok, Hanoi, Jakarta
GMT+10:00 AUS Eastern Standard Time
Darwin
Adelaide
Canberra, Melbourne, Sydney
E. Australia Standard Time
Brisbane
Tasmania Standard Time
Hobart
Vladivostok Standard Time
Vladivostok
West Pacific Standard Time
Guam, Port Moresby
30
GMT+11:00 Central Pacific Standard Time
Magadan, Solomon Is., New Caledonia
31
GMT+12:00 Fiji Standard Time
Fiji, Kamchatka, Marshall Is.
New Zealand Standard Time
32
GMT+13:00 Tonga Standard Time
Auckland, Wellington
Nuku'alofa
Related Functions
• Demand metering
• Data logging
System Error Response
The PowerMonitor 5000 unit provides options for the handling of critical
internal unit run-time errors.
Operation
The PowerMonitor 5000 unit can be reset or operate in Safe mode.
184
Rockwell Automation Publication 1426-UM001G-EN-P - November 2014
Other Functions
Chapter 8
Reset (default)
Reset performs a warm restart of the power monitor firmware. With Reset
selected for unit error action, if a critical error occurs, the power monitor logs the
error record to its internal Error Log and then restarts automatically. With Reset
selected for the error log full option, the oldest error log record is discarded, and
then the power monitor logs the error record to its internal Error Log and then
restarts automatically. This option is intended for applications where continuity
of metering operation is paramount, and where critical control functionality
cannot be affected by an operating error in the power monitor.
Safe Mode
In Safe mode each power monitor output is forced to its de-energized state, native
Ethernet communication stops, and the power monitor enters a state of minimal
functionality. In safe mode, you can access the unit’s Safe mode web page through
the USB device port. The Safe mode web page displays the following:
• Links for downloading error and warning logs
• Control buttons to clear diagnostic logs and reset the unit
From Safe Mode, if the error log is full, you need to clear the error log before
attempting to reset the unit.
Contact Rockwell Automation Technical Support for assistance with the
PowerMonitor 5000 unit diagnostic information.
Setup
Setup parameters of these functions are in the Configuration.System.General
table.
Rockwell Automation Publication 1426-UM001G-EN-P - November 2014
185
Chapter 8
Other Functions
Unit_Error_Action
These are the selections:
0 = Safe mode
1 = Reset (default)
Software_Error_Log_Full_Action
0 = Safe mode
1 = Reset (default)
Miscellaneous Commands
The following commands relate to the operation of the power monitor at a
system level. These commands are found in the Command.System_Registers
table.
Command_Word_One
Set this command word value to execute the listed action. These are the
selections:
22 = Restore factory defaults
23 = Reset power monitor system
These are the semantics:
Restore factory defaults = Clears all user-configured values from the
setup menus to their factory default settings.
Reset system = Warm reboot; performs a power-on self-test of the
PowerMonitor 5000 unit.
Related Functions
Configuration lock.
186
Rockwell Automation Publication 1426-UM001G-EN-P - November 2014
Chapter
9
Communication
Native Ethernet
Communication
All PowerMonitor 5000 units are equipped with a native EtherNet/IP 100 BaseT
communication port. This section describes EtherNet/IP communication and
the available protocols to use for your application.
The Ethernet communication port allows communication with your power
monitor by using a local-area-network (LAN). The Ethernet port can be used to
view the unit’s internal webpage.
The PowerMonitor 5000 unit communicates through Ethernet or EtherNet/IP
drivers in RSLinx® Classic software, and through explicit messages from Rockwell
Automation controllers communicating via an EtherNet/IP network.
Setup
Setup parameters for the Ethernet native communication port are found in the
Configuration.Comunications_Native table. Addresses in this list are expressed
as A.B.C.D where A is the first octet of the IP address or subnet mask, for
example, 192.168.200.101.
IP_Address_Obtain
Selects the IP Address at startup. These are the values:
0 = Static IP
1 = DHCP (default)
These are the semantics:
This table displays the setup parameters for the native Ethernet port whether
Static or DHCP is selected. If Static is selected, the value of parameters in this
table defines the port settings.
IP_Address_A
IP_Address_B
IP_Address_C
IP_Address_D
Ethernet port Internet Protocol (IP) address.
Rockwell Automation Publication 1426-UM001G-EN-P - November 2014
187
Chapter 9
Communication
Subnet_Mask_A
Subnet_Mask_B
Subnet_Mask_C
Subnet_Mask_D
Ethernet port subnet mask.
Gateway_Address_A
Gateway_Address_B
Gateway_Address_C
Gateway_Address_D
Ethernet port default gateway address.
DNS_Enable
Selects DNS Option. These are the values:
0 = Disable
1 = Enable
DNS_Server_Address_A
DNS_Server_Address_B
DNS_Server_Address_C
DNS_Server_Address_D
DNS_Server2_Address_A
DNS_Server2_Address_B
DNS_Server2_Address_C
DNS_Server2_Address_D
Domain Name Server (DNS) addresses
The remaining parameters in the Configuration.Communications_Native table
are described in Date and Time Functions on page 179 and Demand Metering on
page 66 .
Optional DeviceNet
Communication
188
PowerMonitor 5000 units can be optionally equipped with a DeviceNet
communication port. A DeviceNet communication port can be factory installed
or field installed by you. The DeviceNet network is an open-standard, multivendor, industrial device data network that uses a variety of physical media. The
DeviceNet network also provides 24V DC power to devices connected to the
network. The DeviceNet network port and the native Ethernet network port can
be used simultaneously.
Rockwell Automation Publication 1426-UM001G-EN-P - November 2014
Communication
Chapter 9
Setup
Setup parameters for the optional DeviceNet port are found in the
Configuration.OptionalComm.DNT table.
Mac ID
Selects the DeviceNet node address. The range is 0…63 (default).
Communication Rate
Selects the DeviceNet network communication (data) rate, and must be selected
to match the remaining devices on the network. The selections are the following:
• 0 = 125 Kbps
• 1 = 250 Kbps
• 2 = 500 Kbps
• 3 = Autobaud
Optional ControlNet
Communication
PowerMonitor 5000 units can be optionally equipped with a ControlNet
communication port. A ControlNet communication port can be factory
installed or field installed by you. The ControlNet network is an open-standard,
multi-vendor, industrial device data network that supports scheduled, I/O
communication as well as unscheduled messaging. The ControlNet port and the
native Ethernet port can be used simultaneously.
Setup
The Configuration.OptionalComm.CNT table contains the Address tag, the
only setup parameter. Valid ControlNet addresses range from 1…99. The default
value is 255.
Rockwell Automation Publication 1426-UM001G-EN-P - November 2014
189
Chapter 9
Communication
Electronic Data Sheet (EDS)
The EDS file is used to convey device configuration data that is provided by the
manufacturer. You can obtain EDS files for the PowerMonitor 5000 unit by
downloading the file from the following website.
http://www.rockwellautomation.com/rockwellautomation/support/networks/eds.page
You can install EDS files on your computer by using the EDS Hardware
Installation Tool that comes with RSLinx® Classic software, RSNetWorx™
software, or other tools.
PowerMonitor 5000 Unit
Memory Organization
Memory is organized like that of a ControlLogix controller, by using symbolic tag
addressing. Support for PLC-5® or SLC 500 controller type addressing is also
provided. Data tables organize individual data items of similar function. For
example, real-time metering parameters voltages, current, frequency, and power
are grouped in one data table, and billing-related parameters like demand and
energy are in a second metering results table.
Appendix A provides a comprehensive listing of the PowerMonitor 5000 unit
data tables.
190
Rockwell Automation Publication 1426-UM001G-EN-P - November 2014
Communication
Chapter 9
Data Table Addressing
Data tables can be addressed in several ways.
Symbolic Addressing
Status and metering results data can be addressed by their tag names, similar to
the manner in which ControlLogix controller tags are addressed. Symbolic tag
addresses are displayed in the power monitor’s web page, and appear in an
RSLinx Classic software OPC topic set up for a PowerMonitor 5000 unit.
CIP Addressing
Addresses are of the form Object:Instance:Attribute. CIP addressing allows
reading and writing of an entire data table (assembly instance) rather than
individual elements. In CIP addressing, the energy metering results table is
Object Class 4 (Assembly object), Instance 844
(MeteringResults.RealTime_VIF_Power table) and Attribute 3 (data).
CSP Addressing
This is also known as ‘PLC-5 style’ or ‘PCCC’ addressing. Addresses are written
in the form ‘Axx:yy’ where A is a letter describing the function of the data table,
xx is the table number, and yy is the element within, or offset into, the table. For
example, ‘F53:0’ is the CSP address of the first element in the
MeteringResults.RealTime_VIF_Power table. PCCC messaging can be used to
read or write a single data element or a range of data elements within a data table.
Data Types
The PowerMonitor 5000 unit stores data by using several data types:
• Int16, in which the 16-bit word can be represented by an integer value or a
bitmap
• Int32, a 32-bit integer value
• SINT, a 8-bit (Byte) value
• REAL, using the 32-bit IEEE 754 floating-point format
• String, containing alphanumeric characters used for security and unit
descriptive information
• DWORD, a 32-bit structure typically containing bitmap status
information
• SINT, INT, and DINT data types are also used as pads for data alignment
with the Logix architecture
Rockwell Automation Publication 1426-UM001G-EN-P - November 2014
191
Chapter 9
Communication
Communication Command
Summary
This section lists the commands supported by each communications network
type.
EtherNet/IP Network
• CIP Generic Assembly Object (Class 04), Get & Set Attribute Single for
Attribute 3 (data)
• CIP Generic Assembly Object (Class 04), Get Attribute Single for
Attribute 4 (size)
• PCCC PLC5 Word Range Write Function (CMD = 0x0F, FUNC =
0x00)
• PCCC PLC5 Word Range Read Function (CMD = 0x0F, FUNC =
0x01)
• PCCC PLC5 Typed Write Function (CMD = 0x0F, FUNC = 0x67)
• PCCC PLC5 Typed Read Function (CMD = 0x0F, FUNC = 0x68)
• PCCC Protected Logical Read Function w/2 Address Fields (CMD =
0x0F, FUNC = 0xA1)
• PCCC Protected Logical Write Function w/2 Address Fields (CMD =
0x0F, FUNC = 0xA9)
• PCCC Protected Logical Read Function w/3 Address Fields (CMD =
0x0F, FUNC = 0xA2)
• PCCC Protected Logical Write Function w/3 Address Fields (CMD =
0x0F, FUNC = 0xAA)
• PCCC Status Diagnostics (CMD = 0x06, FUNC = 0x03)
DeviceNet and ControlNet Network
• CIP Generic Assembly Object (Class 04), Get & Set Attribute Single for
Attribute 3 (data)
• PCCC PLC5 Word Range Write Function (CMD = 0x0F, FUNC =
0x00)
• PCCC PLC5 Word Range Read Function (CMD = 0x0F, FUNC =
0x01)
• PCCC PLC5 Typed Write Function (CMD = 0x0F, FUNC = 0x67)
• PCCC PLC5 Typed Read Function (CMD = 0x0F, FUNC = 0x68)
• PCCC Protected Logical Read Function w/2 Address Fields (CMD =
0x0F, FUNC = 0xA1)
• PCCC Protected Logical Write Function w/2 Address Fields (CMD =
0x0F, FUNC = 0xA9)
• PCCC Protected Logical Read Function w/3 Address Fields (CMD =
0x0F, FUNC = 0xA2)
• PCCC Protected Logical Write Function w/3 Address Fields (CMD
=0x0F, FUNC = 0xAA)
• PCCC Status Diagnostics (CMD = 0x06, FUNC = 0x03)
192
Rockwell Automation Publication 1426-UM001G-EN-P - November 2014
Communication
EtherNet/IP Object Model
Chapter 9
This section provides the object model for a PowerMonitor 5000 device type on
an EtherNet/IP network. The table below indicates the following:
• The object classes present in this device
• Whether or not the class is required
• The number of instances present in each class
Object Class List
The PowerMonitor 5000 unit supports the following CIP classes.
Table 29 - CIP Object Class List
Object Class
Need in Implementation
Number of Instances
Identity (1, 1hex)
Required
1
Message Router (2, 2hex)
Required
1
TCP/IP Interface Object (245, F5hex)
Required
1
Ethernet Link Object (246, F6hex)
Required
1 Required (2 Optional)
Connection Manager Object (6, 6hex)
Required
1
Assembly Object (4, 4 hex)
Required
Minimum of 3
Parameter Object (15, Fhex)
Required
Product Specific
Parameter Group Object (16, 10hex)
Optional
Product Specific
Non-Volatile Storage Object (161, A1hex)
Required
Product Specific
File Object (55, 37hex)
Required
Minimum of 1
Time-Sync Object (67, 43hex)
Optional
1
QoS Object (72, 48hex)
Optional
1
PCCC Object (103, 67hex)
Optional
1
Symbol Object (107, 6Bhex)
Optional
Product Specific
User Defined Template Object (108, 6Chex)
Optional
Product Specific
File Manager Object (794, 31Ahex)
Optional
1
Email Object (815, 32Fhex)
Optional
1
Device Level Ring Object (71, 47hex)
Optional
1
Energy Object (78, 4Ehex)
Required
1
Electrical Energy Object (79, 4Fhex)
Required
1
Rockwell Automation Publication 1426-UM001G-EN-P - November 2014
193
Chapter 9
Communication
DeviceNet and ControlNet
Object Model
This section provides the object model for a PowerMonitor 5000 device type on
either a DeviceNet or ControlNet network. The table below indicates the
following:
• The object classes present in this device
• Whether or not the class is required
• The number of instances present in each class
Object Class List
The PowerMonitor 5000 unit supports the following classes.
Table 30 - DeviceNet and ControlNet Object Model
Object Class
Need in Implementation
Number of Instances
Identity (1, 1hex)
Required
1
Message Router (2, 2hex)
Required
1
DeviceNet Object (3, 3hex)
Required
1
Assembly Object (4, 4 hex)
Required
Minimum of 3
Connection Object (5, 5hex)
Required
Minimum of 1
Parameter Object (15, Fhex)
Required
Product Specific
Parameter Group Object (16, 10hex)
Optional
Product Specific
Acknowledge HandleObject (43, 28hex)
Required
1
Non-Volatile Storage Object (161, A1hex)
Required
Product Specific
File Object (55, 37hex)
Required
Minimum of 1
PCCC Object (103, 67hex)
Optional
1
Energy Object (78, 4Ehex)
Required
1
Electrical Energy Object (79, 4Fhex)
Required
1
Email Object (815, 32Fhex)
Optional
1
Explicit Messaging
This section discusses data retrieval and parameter configuration by using explicit
messaging from Rockwell Automation controllers. Explicit messaging provides
the mechanism for users to program a controller to read and write specific data
tables in a power monitor. With explicit messages, users can read real-time
metering values, configure metering and communication parameters, and also
read certain logs.
The PowerMonitor 5000 unit supports PLC-5 Typed, SLC Typed, and CIP
Generic message requests.
194
Rockwell Automation Publication 1426-UM001G-EN-P - November 2014
Communication
Chapter 9
Security Considerations
A controller or application does not need to log in to read real-time metering,
configuration, and status data from a PowerMonitor 5000 unit, whether security
is disabled or enabled.
If security is enabled, a controller must log in under an Application account class
to perform the following:
• Write configuration or commands
• Read log data
To log in, write the username to the Security.Username table. Within 30 seconds,
write the password to the Security.Password table. In the source data, buffer the
username and password with null characters so the string length is 32 bytes.
A read of the Status.TableWrite table verifies success of the login and indicate
which account class is active. A login remains active until 30 minutes have elapsed
since the last write message.
Examples: Explicit Message
Setup
Refer to the following examples for details about setting up an explicit message.
TIP
The Studio 5000™ Engineering and Design Environment combines engineering
and design elements into a common environment. The first element in the
Studio 5000 environment is the Logix Designer application. The Logix Designer
application is the rebranding of RSLogix™ 5000 software.
RSLogix 5000 Software – PLC-5 or SLC Typed Read Message Setup
The following is an example of a message instruction to read single or multiple
elements from a PowerMonitor 5000 unit by using PLC-5 or SLC Typed
messages. This setup applies to ControlLogix and CompactLogix™
programmable logic controllers.
After setting up a message instruction, open the message configuration dialog
box. The Configuration tab is selected initially.
Rockwell Automation Publication 1426-UM001G-EN-P - November 2014
195
Chapter 9
Communication
Message Type
These are the choices:
PLC-5 Typed Read
SLC Typed Read
Source Element
Look up the PCCC address of the specific data table address to read. If you are
performing a multiple element read, this address specifies the first element in the
array.
Number of Elements
This is the number of elements being read. These are the values:
1 = Single element read
>1 = Multiple element read, number of elements to read including the
first element
Destination Element
The controller tag in which to store the data being read.
Click the Communication tab.
196
Rockwell Automation Publication 1426-UM001G-EN-P - November 2014
Communication
Chapter 9
For an explicit message using a DeviceNet or ControlNet network, only the
communication path changes, as shown below.
Path
This field specifies the communication path from the controller to the power
monitor. Set-up the path as <Backplane (always 1), Slot of Communication
Module, Port (2 for Ethernet and DeviceNet networks), power monitor IP
Address or DeviceNet address>.
Communication Method
For PLC-5 and SLC Typed Reads, this always defaults to CIP.
RSLogix 5000 Software – PLC-5 or SLC Typed Write Message Setup
A write message is very similar to the PLC-5 and SLC Type read message
described above. The changes are in the Configuration tab, as follows.
Message Type
These are the choices:
PLC-5 Typed Write
SLC Typed Write
Source Element
This field specifies the controller tag in which to store the data to write to the
power monitor.
Rockwell Automation Publication 1426-UM001G-EN-P - November 2014
197
Chapter 9
Communication
Number of Elements
This is the number of elements being read. These are the values:
1 = Single element write
>1 = Multiple element write, number of elements to read including the
first element
Destination Element
Look up the PCCC address (in Appendix A) of the specific data table address to
read. If performing a multiple element read, this addresses the first element in the
array.
RSLogix 5000 Software – CIP Generic Messaging Setup
The following example demonstrates a message instruction to read or write a data
table in the PowerMonitor 5000 unit by using the CIP Generic message type.
This setup applies to ControlLogix and CompactLogix programmable logic
controllers.
Message Type
CIP Generic.
Service Type
These are the choices:
Get Attribute Single = Read message
Set Attribute Single = Write message
198
Rockwell Automation Publication 1426-UM001G-EN-P - November 2014
Communication
Chapter 9
Class
4 = Assembly object
Instance
Look up the CIP Instance (in Appendix A) of the specific data table to read or
write. This example uses instance 844, the
MeteringResults.RealTime_VIF_Power table.
Attribute
3 = Data
Source Element
Used with Write messages, this specifies the controller tag to write to the power
monitor.
Source Length
Used with Write messages, this specifies the length in bytes of the data written to
the power monitor.
Destination
Used with Read messages, this specifies the controller tag in which to store the
data read from the power monitor.
Click the Communication tab.
Rockwell Automation Publication 1426-UM001G-EN-P - November 2014
199
Chapter 9
Communication
Path
This field specifies the communication path from the controller to the power
monitor. Set-up the path as <Backplane (always 1), Slot of Ethernet Module, Port
(always 2 for Ethernet), power monitor IP Address>.
Communication Method
For CIP Generic messaging, this defaults to CIP.
RSLogix 500 Software - Message Setup by Using PLC-5 or SLC Typed
Read/Write
The following is an example of a message instruction to read or write single or
multiple elements in a PowerMonitor 5000 unit by using peer-to-peer PLC-5 or
SLC 500 Typed messages in RSLogix 500 software. This setup applies to SLC
and MicroLogix programmable logic controllers.
Read/Write
Select Read or Write.
Target Device
Select PLC5 or 500CPU as appropriate.
Local/Remote
Select Local.
200
Rockwell Automation Publication 1426-UM001G-EN-P - November 2014
Communication
Chapter 9
Control Block
Select an available Integer word. This example uses N7:0.
Click Setup Screen.
This Controller Data Table Address
For a Read message, the controller tag in which to store the power monitor data.
For a Write message, the controller tag that stores the value written to the power
monitor.
Size in Elements
This is the number of elements being read or written. These are the values:
1 = Single element read or write
2…59 = Multiple element read or write, number of elements to read
including the first element
IMPORTANT
The maximum size in elements is 59 for a 500CPU target device Read type
message.
Channel
Select 1.
Target Device Data Table Address
Look up the PCCC address (in Appendix A) of the specific data table address to
read or write. If you are performing a multiple element read or write, this is the
first element in the array.
Rockwell Automation Publication 1426-UM001G-EN-P - November 2014
201
Chapter 9
Communication
MultiHop
Click Yes, then click the MultiHop tab.
Enter the IP Address of the PowerMonitor 5000 unit in the To Address box.
SCADA Applications
SCADA is short for ‘Supervisory Control and Data Acquisition’, and describes
applications in which process data from controllers and other devices is displayed
on human-machine interface (HMI) workstations to help system operators
monitor operations and make control decisions. HMI applications such as
FactoryTalk View software utilize communication applications such as RSLinx
Classic and RSLinx Enterprise software to gather data from the process through
controller, power monitors, and the like.
This section covers RSLinx Classic software driver setup, and OPC setup by
using the RSLinx Classic OPC Server.
RSLinx Classic Driver Configuration
Install the PowerMonitor 5000 unit EDS (Electronic Data Sheet) file on the
computer running RSLinx Classic software. You can use the RSLinx EDS
Hardware Installation tool to register EDS file, or they can be uploaded in
RSLinx software after configuring drivers by right clicking on the power monitor
icon in RSWho and registering the device.
EtherNet/IP by Using Ethernet Devices Driver
• Create an Ethernet devices driver in RSLinx software.
• Add the IP address of the PowerMonitor 5000 unit to the driver station
mapping.
• Use RSWho to verify that RSLinx software is communicating to the
PowerMonitor 5000 unit.
202
Rockwell Automation Publication 1426-UM001G-EN-P - November 2014
Communication
Chapter 9
EtherNet/IP using Ethernet/IP Driver
• Create an Ethernet/IP network driver in RSLinx software.
• Make selections to browse the local or remote subnet as appropriate.
• Use RSWho to verify that RSLinx software is communicating to the
PowerMonitor 5000 unit.
IMPORTANT
The PowerMonitor 5000 unit connects to either the RSLinx Classic Ethernet
Devices driver or the Ethernet/IP driver on a single computer but not both
simultaneously.
RSLinx Classic OPC Server Setup
RSLinx Classic software functions as an OPC Server to serve data from a
PowerMonitor 5000 unit to an OPC 2.0 compliant application. To set up the
OPC driver, first setup an Ethernet Devices or EtherNet/IP driver as described
above to communicate to the power monitor. You can then create an OPC topic
to serve data to your SCADA application.
Setup OPC Topic
Follow these steps to set up an OPC topic.
1. Open RSLinx software.
2. From the DDE/OPC menu, choose Topic Configuration.
3. When the topic configuration window appears, click New.
Rockwell Automation Publication 1426-UM001G-EN-P - November 2014
203
Chapter 9
Communication
This creates a new, un-named topic in the left pane.
4. Give the topic a name pertinent to your application.
5. In the right pane, with the Data Source tab selected, browse to the
PowerMonitor 5000 unit by using the previously-configured driver.
6. With the topic highlighted in the left pane, and the PowerMonitor 5000
unit highlighted in the right pane, click Apply.
7. Click the Data Collection tab.
8. From the Processor pull-down menu, choose Logix5000.
This selection provides symbolic tag addressing.
9. Click Done.
OPC Topic configuration is complete. You can now use the RSLinx OPC
Server, and the topic just created, to serve data to your application.
TIP
204
You can also select the SLC 5/03 processor type. The topic using this processor
type supports PCCC addressing.
Rockwell Automation Publication 1426-UM001G-EN-P - November 2014
Communication
Chapter 9
Testing the OPC Server by Using Microsoft Excel Software
Follow these steps to test the OPC server.
1. From the Edit menu, choose Copy DDE/OPC Link to check out the
RSLinx Classic OPC server and the new power monitor topic.
2. In the left pane, browse to Online > MeteringResults >
RealTime_VIF_Power and select a tag on the right, then click OK.
3. Open Microsoft Excel software.
4. Right-click a cell and choose Paste Special.
Rockwell Automation Publication 1426-UM001G-EN-P - November 2014
205
Chapter 9
Communication
5. Click Paste link, and then click OK.
The value of the selected tag displays in the cell.
You can also check out the OPC topic with the RSLinx OPC Test Client. The
figure below shows the difference between symbolic and PCCC addressing. The
second item uses symbolic addressing.
FactoryTalk Live Data
You can also use RSLinx Enterprise software to serve power monitor data to
other FactoryTalk applications. The PowerMonitor 5000 unit supports PCCC
addressing through RSLinx Enterprise software.
This example illustrates the use of FactoryTalk Administrator Console. The local
FactoryTalk directory is configured for an OPC topic in RSLinx Enterprise
software. In the application area’s communication setup, the PowerMonitor 5000
unit initially appears with a yellow question mark icon, its IP address, and its
catalog number.
1. Delete this device from the Ethernet driver tree.
2. Create a new device.
3. In the Add Device Selection dialog box, choose Ethernet SLC devices >
1408-ENT PM 1000 EnergyMonitor, and assign the new device its IP
address.
206
Rockwell Automation Publication 1426-UM001G-EN-P - November 2014
Communication
Chapter 9
4. Create a device shortcut that references the new device in the tree and click
OK when done.
Once the shortcut is created, you can use the Rockwell Live Data Test
Client to view PowerMonitor 5000 data.
5. Select the local server and the application area.
6. Select the shortcut, and browse to the Online link.
7. In Appendix A, look up the PCCC address of a data point to monitor.
Rockwell Automation Publication 1426-UM001G-EN-P - November 2014
207
Chapter 9
Communication
8. Find the address in the list, select it, and click OK.
The Test Client displays the data and other properties of the selected tag.
This example uses F53:4, V2_N_Volts.
Controller Applications:
Class 1 Connection
This section describes how to set up Class 1 connections with a Logix controller
and Studio 5000 Logix Designer application and RSNetWorx software.
IMPORTANT
Class 1 connections must be inhibited to update the power monitor firmware.
Generic Ethernet Module Connection, RSLogix 5000 Software
Version 19 and Earlier
1. To create a connection to a PowerMonitor 5000 unit, choose the Ethernet
network under the applicable communication adapter in the I/O tree.
2. Right-click and choose New Module from the menu.
208
Rockwell Automation Publication 1426-UM001G-EN-P - November 2014
Communication
Chapter 9
3. Fill in the power monitor IP address, and the values shown in the figure
below for the input, output, and configuration instances.
4. Click OK when finished.
The generic Ethernet module connection creates three controller tags in the
Logix project, as identified by the Input, Output, and Configuration assembly
instances. These assembly instances identify the ScheduledData.Input Data,
ScheduledData.Output Data, and Configuration.Instance data tables. These data
tables are described in Appendix A. The Input instance and Configuration
instances contain a variety of data types. You need to create controller tags and
write controller logic to copy the Input and Configuration instance data into a
usable form.
DeviceNet I/O Connection
The DeviceNet Class 1 connection sets up implicit communication between the
DeviceNet scanner and the PowerMonitor 5000 unit. This connection makes it
possible to read power monitor parameters into a Logix controller and to control
the power monitor discrete outputs. The DeviceNet network connection does
not include the configuration instance of the PowerMonitor 5000 unit. You can
use a web browser for setting up the power monitor, except that when a
DeviceNet network connection is active, the web browser is not permitted to
change the Configuration.OptionalComm.DNT setup values or execute output
forcing commands.
It is not necessary to establish an I/O connection to allow explicit messaging with
a DeviceNet PowerMonitor 5000 unit that is connected on a DeviceNet
network.
Rockwell Automation Publication 1426-UM001G-EN-P - November 2014
209
Chapter 9
Communication
Follow these steps to set up a DeviceNet I/O connection by using RSNetWorx™
for DeviceNet software.
1. Launch RSNetWorx for DeviceNet software.
2. Click Online.
210
Rockwell Automation Publication 1426-UM001G-EN-P - November 2014
Communication
Chapter 9
3. Browse to and choose the DeviceNet network.
4. Accept the prompt to upload the network data.
5. If the PowerMonitor 5000 icon does not appear, upload and install the eds
file from the device.
Rockwell Automation Publication 1426-UM001G-EN-P - November 2014
211
Chapter 9
Communication
6. Select the scanner and upload its configuration.
7. Open the scanner Properties and click the Scanlist tab.
8. Select the PowerMonitor 5000 unit and click the > button to add the unit
to the scanlist.
212
Rockwell Automation Publication 1426-UM001G-EN-P - November 2014
Communication
Chapter 9
9. Click the Input tab.
Note that the Input mapping is now populated with 60 DWORD
elements, obtained from the eds file. The Output mapping is similarly set
up with one DWORD.
10. Click OK to accept the changes and download to the scanner.
If necessary, place the controller in Program mode.
In the Logix controller, the mapped data now appears in the scanner's
Local Data tags with a DINT data type. The Local Data tags must be
copied into tags with the correct data type so the data can be interpreted
correctly.
With a DeviceNet I/O connection active, any attempt to change the
DeviceNet communication setting results in an exclusive owner conflict
error.
The following example copies the scanner local data first to a SINT array
and then to a user-defined tag set up with the correct data types and
symbolic addressing.
You can obtain the user-defined data type (UDT) import files from the
resources tab in the PowerMonitor 5000 web page:
http://ab.rockwellautomation.com/Energy-Monitoring/1426PowerMonitor-5000
Rockwell Automation Publication 1426-UM001G-EN-P - November 2014
213
Chapter 9
Communication
ControlNet I/O Connection
A ControlNet Class 1 connection sets up the ControlNet scanner in a Logix
controller to implicitly read the ScheduledData.Input instance and control
outputs without the use of message instructions in logic. The ControlNet
connection does not include the power monitor configuration. You can use a web
browser, FactoryTalk EnergyMetrix RealTime (RT) software, or other means for
power monitor setup. If a ControlNet connection is active, you are not permitted
to change the Configuration.OptionalComm.CNT setup or execute output
forcing commands.
It is not necessary to establish an I/O connection to allow explicit messaging with
a ControlNet PowerMonitor 5000 unit that is connected on a ControlNet
network.
Follow these steps to set up a ControlNet I/O connection by using the Logix
Designer application and RSNetWorx for ControlNet software.
1. Launch the Logix Designer application.
2. Open the project file for your controller in offline mode.
3. Expand the I/O tree and choose the ControlNet network.
4. Right-click the ControlNet item and choose New Module.
5. Select the Generic ControlNet Module CONTROLNET-MODULE
from the list of Communication modules and then click Create.
214
Rockwell Automation Publication 1426-UM001G-EN-P - November 2014
Communication
Chapter 9
6. Complete the New Module setup as shown in the example and click OK
when done.
The Comm. Format, Input, Output, and Configuration assembly
TIP
instances and sizes must be entered as shown. Name and optional
Description are your choice. Node is the ControlNet address of the
power monitor. Click OK when done.
7. In the Module Properties dialog box, click the Connection tab and choose
a Requested Packet Interval to suit your application.
The fastest metering update rate in the PowerMonitor 5000 unit is once
per cycle, which is 20 ms for 50 Hz and 16.67 ms for 60 Hz.
8. Click OK when done.
9. Download the revised program to the Logix controller.
You can leave the controller in Remote Program mode for now.
Rockwell Automation Publication 1426-UM001G-EN-P - November 2014
215
Chapter 9
Communication
10. Open RSNetWorx for ControlNet software and click the Online button.
11. Browse to and select the ControlNet network to which the power monitor
is connected, and then click OK.
12. Wait until the online browse is complete.
216
Rockwell Automation Publication 1426-UM001G-EN-P - November 2014
Communication
Chapter 9
13. If the PowerMonitor 5000 icon does not appear, upload and install the eds
file from the device.
14. Check Edits Enabled, and then click OK.
15. Click the Save icon, then OK to optimize and re-write schedule for all
connections.
The controller needs to be in Program mode for the download to happen.
16. Put the Logix controller into Run mode and verify the new I/O
connection is running.
17. Close out RSNetWorx software, saving the project if desired.
Data is now being written to the <ModuleName>.I.Data tag in Decimal
style. The input tag contains a mixture of different data types. The I.Data
tag must be copied into tags with the correct data type so the data can be
interpreted correctly.
Rockwell Automation Publication 1426-UM001G-EN-P - November 2014
217
Chapter 9
Communication
The following example copies the I.Data tag into a user-defined tag set up
with correct data types and symbolic addressing.
You must create a destination tag with the appropriate data type. You can
obtain user-defined data type (UDT) import files from the Resources tab
on the PowerMonitor 5000 product web page. The UDT files for
DeviceNet input and output instances also work with ControlNet
instances.
http://ab.rockwellautomation.com/Energy-Monitoring/1426-PowerMonitor-5000
218
Rockwell Automation Publication 1426-UM001G-EN-P - November 2014
Communication
Chapter 9
EDS Add-on Profile Connection (Native EtherNet/IP units only)
The PowerMonitor 5000 unit can be configured with an electronic data sheet
(EDS) based AOP (add-on profile) in RSLogix 5000 software version 20 or
Logix Designer application version 21 or later. You need to register the
PowerMonitor 5000 EDS file on the computer on which software project
development is done.
IMPORTANT
If a connection returns an error code 16#0203 Connection timed out, please
refer to Answer 63904 in the Rockwell Automation Knowledgebase.
The PowerMonitor 5000 device class is displayed under ‘Unknown Device Type
146’ when adding a new EtherNet module.
1. Select the desired device and click Create.
2. Enter the name and IP address of the power monitor.
3. In the module definition, select Compatible Module and enter the correct
major and minor revisions.
There are three choices for the connection type.
PowerMonitor 5000 Unit Exclusive Owner Connection
The Exclusive Owner connection provides complete control of a PowerMonitor
5000 unit to a Logix controller. When you first set up an Exclusive Owner
connection, the following module-defined controller tags are created:
• <ModuleName>:C, the Configuration tag, mapped to the
Configuration.Instance table
• <ModuleName>:I, the Input tag, mapped to the ScheduledData.Input
table
• <ModuleName>:O, the Output tag, mapped to the
ScheduledData.Output table
Rockwell Automation Publication 1426-UM001G-EN-P - November 2014
219
Chapter 9
Communication
Refer to Appendix A for the content of these data tables. The
<ModuleName>:C tag is populated with default configuration values. When
the connection is opened, the configuration tag is written to the power monitor
and over-writes any existing configuration. In most cases this restores the default
Metering_Basic and SystemGeneral configuration of the power monitor.
With an exclusive owner connection active, the following capabilities and
restrictions apply:
• Only the owner controller is permitted to modify the power monitor
configuration. You can use the Logix Designer application and the module
properties dialog box to view and edit the power monitor configuration,
including the native EtherNet/IP communication parameters. Attempts to
change the configuration through the web page or other applications is
rejected with an ‘exclusive ownership conflict’ error.
• The owner controller can read the Input tag elements in its logic and write
the Output tag elements in its logic.
• You can use Logix Designer application online with the owner controller
to force inputs and outputs configured for native EtherNet/IP control in
the power monitor.
• If the connection is lost, the Default_State_on_Comm_Loss parameter
determines the behavior of each output.
Listen Only
If an Exclusive Owner connection exists, additional controllers can establish
Listen Only connections that permit the controller to read data from the power
monitor's Input data tables. You can also view (but not edit) the power monitor's
parameters from the module properties dialog box.
To add a Listen Only connection, the Exclusive Owner connection must be set to
Multicast and both connections must be set to the same RPI.
When you first set up a Listen Only connection, the following module-defined
controller tag is created: <ModuleName>:I, the Input tag, mapped to the
ScheduledData.Input table.
220
Rockwell Automation Publication 1426-UM001G-EN-P - November 2014
Communication
Chapter 9
Refer to Appendix A for the content of the data table.
If there is no exclusive owner connection, a listen-only connection returns an
error code 16#0119 Connection request error: Module not owned.
PowerMonitor 5000 Input Only
The PowerMonitor 5000 Input Only connection is similar to the Listen Only
connection but does not require an Exclusive Owner connection to exist. The
Input Only connection permits you to configure the power monitor by using the
Web interface and the parameters in the Module Properties dialog box.
Rockwell Automation Publication 1426-UM001G-EN-P - November 2014
221
Chapter 9
Communication
When you first set up an Input Only connection, the following module-defined
controller tag is created: <ModuleName>:I, the Input tag, mapped to the
ScheduledData.Input table.
Refer to Appendix A for the content of the data table.
CIP Energy Object
The EtherNet/IP communication protocol complies with the Common
Industrial Protocol (CIP) and the EtherNet/IP implementation of the CIP
specification, published by ODVA. The CIP object library includes the following
energy-related objects:
• Base Energy Object, Class Code 0x4E
• Electrical Energy Object, Class Code 0x4F
The PowerMonitor 5000 unit provides support of the base and electrical energy
objects.
222
Rockwell Automation Publication 1426-UM001G-EN-P - November 2014
Communication
Chapter 9
CIP Base Energy Object
The PowerMonitor 5000 unit supports the following attributes and services of
the Base Energy Object, Class Code 0x4E.
Table 31 - Supported Attributes
Energy Object Attribute ID
Need in Implementation
Access Rule
Energy Object Attribute Name PowerMonitor 5000
Implementation
1
Required
Get
Energy/Resource Type
Supported
2
Required
Get
Energy Object Capabilities
Supported
3
Required
Get
Energy Accuracy
Supported
4
Optional
Get/Set
Energy Accuracy Basis
Get only
5
Conditional
Get/Set
Full Scale Reading
Not needed
6
Optional
Get
Device Status
Not supported
7
Optional
Get
Consumed Energy Odometer
Supported
8
Optional
Get
Generated Energy Odometer
Supported
9
Conditional
Get
Total Energy Odometer
Supported
10
Conditional
Get
Energy Transfer Rate
Supported
11
Optional
Set
Energy Transfer Rate User Setting
Not applicable
12
Required
Get
Energy Type Specific Object Path
Supported
13-14
Optional
Set
Energy Aggregation Paths
Not needed
15
Optional
Set
Energy Identifier
Returns Device_Name
16
Optional
Set
Odometer Reset Enable
Not supported
17
Conditional
Get
Metering State
Supported
Service Name
PowerMonitor 5000
Implementation
Table 32 - Supported Services
Energy Service Code
Need in Implementation
Class
Instance
01hex
Optional
Optional
Get_Attributes_All
Supported
03hex
Optional
Optional
Get_Attribute_List
Supported
04hex
N/A
Optional
Set_Attribute_List
Not supported
05hex
Optional
Required
Reset
Not supported
08hex
Optional
N/A
Create
Not supported
09hex
N/A
Optional
Delete
Not supported
0Ehex
Conditional
Required
Get_Attribute_Single
Supported
10hex
N/A
Required
Set_Attribute_Single
Supported
18hex
N/A
Optional
Get_Member
Not supported
19hex
N/A
Optional
Set_Member
Not supported
Rockwell Automation Publication 1426-UM001G-EN-P - November 2014
223
Chapter 9
Communication
CIP Electrical Energy Object
The PowerMonitor 5000 unit supports the following attributes and services of
the Electrical Energy Object, Class Code 0x4F.
Table 33 - Supported Attributes
224
Electrical Energy
Object Attribute ID
Need in
Electrical Energy Object Attribute Name
Implementation
PM5000
Implementation
1
Optional
Real Energy Consumed Odometer
Supported
2
Optional
Real Energy Generated Odometer
Supported
3
Conditional
Real Energy Net Odometer
Supported
4
Optional
Reactive Energy Consumed Odometer
Supported
5
Optional
Reactive Energy Generated Odometer
Supported
6
Optional
Reactive Energy Net Odometer
Supported
7
Optional
Apparent Energy Odometer
Supported
8
Optional
Kiloampere-Hours Odometer
Supported
9
Optional
Line Frequency
Supported
10
Optional
L1 Current
Supported
11
Optional
L2 Current
Supported
12
Optional
L3 Current
Supported
13
Optional
Average Current
Supported
14
Optional
Percent Current Unbalance
Supported
15
Optional
L1-N Voltage
Supported
16
Optional
L2-N Voltage
Supported
17
Optional
L3-N Voltage
Supported
18
Optional
Average L-N Voltage
Supported
19
Optional
L1-L2 Voltage
Supported
20
Optional
L2-L3 Voltage
Supported
21
Optional
L3-L1 Voltage
Supported
22
Optional
Average L-L Voltage
Supported
23
Optional
Percent Voltage Unbalance
Supported
24
Optional
L1 Real Power
Supported
25
Optional
L2 Real Power
Supported
26
Optional
L3 Real Power
Supported
27
Conditional
Total Real Power
Supported
28
Optional
L1 Reactive Power
Supported
29
Optional
L2 Reactive Power
Supported
30
Optional
L3 Reactive Power
Supported
31
Optional
Total Reactive Power
Supported
32
Optional
L1 Apparent Power
Supported
33
Optional
L2 Apparent Power
Supported
34
Optional
L3 Apparent Power
Supported
35
Optional
Total Apparent Power
Supported
Rockwell Automation Publication 1426-UM001G-EN-P - November 2014
Communication
Chapter 9
Table 33 - Supported Attributes
Electrical Energy
Object Attribute ID
Need in
Electrical Energy Object Attribute Name
Implementation
PM5000
Implementation
36
Optional
L1 True Power Factor
Supported
37
Optional
L2 True Power Factor
Supported
38
Optional
L3 True Power Factor
Supported
39
Optional
Three Phase True Power Factor
Supported
40
Optional
Phase Rotation
Supported
41
Required
Associated Energy Object Path
Supported
Table 34 - Supported Services
Energy Service
Code
Need in Implementation
Service Name
PowerMonitor
5000
Implementation
Class
Instance
01hex
Optional
Optional
Get_Attributes_All
Supported
03hex
Optional
Optional
Get_Attribute_List
Supported
0Ehex
Conditional
Required
Get_Attribute_Single
Supported
Examples of Message Configuration
A sample message instruction configuration dialog box for reading the electrical
energy object is shown below. This message calls the Get_Attributes_All service
(service code 0x01) for the Electrical Energy Object (Class code 0x4F).
Rockwell Automation Publication 1426-UM001G-EN-P - November 2014
225
Chapter 9
Communication
The second sample message instruction reads a single value from the electrical
energy object. This message calls the Get_Attribute_Single service (service code
0x0E) for the Base Energy Object (Class code 0x4E), to read the Total Energy
Odometer, attribute 9.
The data is returned in the correct ‘odometer’ format of five integers scaled by
powers of 10. In this example, the total energy value is 1,471.371 kWh.
226
Rockwell Automation Publication 1426-UM001G-EN-P - November 2014
Chapter
10
Maintenance
Update the PowerMonitor
5000 Unit Firmware
From time to time, firmware updates can be made available for your power
monitor. You can also purchase firmware upgrades to add capabilities to your
power monitor, for example, promoting an M5 unit to an M6 or M8 unit.
To load firmware, use the ControlFLASH™ utility. You can download firmware
updates from the Rockwell Automation technical support website
http://www.rockwellautomation.com/compatibility.
To purchase model upgrades, please contact your local Rockwell Automation
representative or Allen-Bradley distributor.
Follow these steps to download firmware from the support website.
1. Click Find Product Downloads.
Rockwell Automation Publication 1426-UM001G-EN-P - November 2014
227
Chapter 10
Maintenance
2. From the Product Search pull-down menu, choose Energy Monitoring.
3. Select the 1426-M5E, series and version to download and respond to the
prompts.
Your selections appear in the column on the right.
4. Click Find Downloads.
Your download selections appear.
5. Click the download button
and follow the prompts.
6. After you have downloaded the firmware kit, locate the downloaded ZIP
file.
7. Open the ZIP file, and then double-click the ControlFLASH.msi file to
install the ControlFLASH utility and the power monitor firmware to your
computer
8. Follow the prompts to install the software.
228
Rockwell Automation Publication 1426-UM001G-EN-P - November 2014
Maintenance
Upgrading the PowerMonitor
5000 Model and
Communication
Chapter 10
You can upgrade an M5 model to an M6 or M8 model by installing a firmware
upgrade kit. Contact your local Rockwell Automation representative or
Allen-Bradley distributor to purchase an upgrade. You need to provide the
catalog and serial numbers of your existing PowerMonitor 5000 units. The
upgrade is furnished with instructions for installation over the native Ethernet,
USB, or optional communication ports.
You can also add an optional DeviceNet or ControlNet port. Contact your local
Allen-Bradley distributor or Rockwell Automation sales representative to
purchase an optional communication port. The port is provided with installation
instructions. No firmware update is required to utilize a newly installed optional
communication port. Following installation, the power monitor functions
identically to a unit with a factory-installed optional port, except it still identifies
itself with its original catalog number for the purpose of tasks like firmware
updates.
Use the ControlFLASH Utility
to Update Firmware
You can use the ControlFLASH utility to load firmware via the Ethernet
network.
Make sure the appropriate network connection is made and that a driver for the
network is configured in RSLinx Classic software before starting.
IMPORTANT
The ControlFLASH utility does not update the firmware if any Class 1
connections (generic or EDS AOP connections) exist. A connection exists if the
Network Status indicator is either solid green (connection active) or blinking
red (connection timed out). Use the Studio 5000 Logix Designer application to
connect to the controller that owns each connection and inhibit the
connection. After successfully updating the power monitor firmware, you can
uninhibit the connections. Note that you can edit connection properties to
reflect the new power monitor firmware revision..
1. Start the ControlFLASH utility.
2. From the Welcome dialog box, click Next.
3. Select the catalog number of the power monitor, and click Next.
4. Expand the network until you see the power monitor.
[If the required network is not shown, configure a driver for the network
in RSLinx Classic software]
5. Select the power monitor, and click OK.
6. Select the revision level to which you want to update the controller, and
click Next.
7. To start the update of the controller, click Finish and Yes.
After the controller is updated, the ControlFLASH utility polls the unit
to determine that it has restarted. After the unit has restarted, the Status
dialog box displays Update complete.
8. Click OK.
Rockwell Automation Publication 1426-UM001G-EN-P - November 2014
229
Chapter 10
Maintenance
9. To close the ControlFLASH utility, click Cancel and Yes.
TIP
230
If an error message appears that indicates the target device is not in a proper
mode to accept an update, then one or more Class 1 connections exist. Refer to
the IMPORTANT note above.
Rockwell Automation Publication 1426-UM001G-EN-P - November 2014
Appendix
A
PowerMonitor 5000 Unit Data Tables
Summary of Data Tables
The Data Table Summary Index table summarizes all data tables available and
their general attributes.
Table 35 - Data Table Summary Index
Name of Data Table
Read
ScheduledData.Input
X
ScheduledData.Output
M5
M6
M8
Write
PCCC File
Number
CIP Instance
Number
# of Table
Parameters
Refer to Page
X
X
X
100
65
page 234
X
X
X
X
101
1
page 238
102
44
page 239
NA
NA
52
page 245
NA
NA
117
page 247
Configuration.Instance
X
X
X
X
X
Configuration Parameter Object Table
X
X
X
X
X
Display Parameter Object Table
X
X
X
X
Configuration.DateTime
X
X
X
X
X
N9
800
15
page 250
Configuration.Logging
X
X
X
X
X
N10
801
40
page 251
Configuration.Metering.Basic
X
X
X
X
X
F11
802
33
page 253
Configuration.System.General
X
X
X
X
X
F12
803
50
page 255
Configuration.Communications_Native
X
X
X
X
X
N13
804
70
page 258
Configuration.Network.Text
X
X
X
X
X
ST14
805
5
page 260
Configuration.Setpoints_1_5
X
X
X
X
X
F16
807
50
page 261
Configuration.Setpoints_6_10
X
X
X
X
X
F17
808
50
page 264
Configuration.Setpoints_11_15 (M6 and M8 model)
X
X
X
X
F18
809
50
page 267
Configuration.Setpoints_16_20 (M6 and M8 model)
X
X
X
X
F19
810
50
page 270
Configuration.Setpoint_Logic (M6 and M8 Model)
X
X
X
X
N20
811
100
page 273
Configuration.Setpoint_Outputs
X
X
X
X
X
N21
812
100
page 282
Configuration.Data_Log
X
X
X
X
X
N22
813
34
page 286
Configuration.Log_Read
X
X
Configuration.PowerQuality
X
Configuration.OptionalComm.DNT
X
Configuration.OptionalComm.CNT
X
X
X
X
N23
814
15
page 288
X
X
X
F24
815
50
page 289
X
X
X
X
N25
816
30
page 291
X
X
X
X
N25
816
30
page 292
Configuration.DataLogFile
X
X
X
X
ST26
817
1
page 292
Configuration.EnergyLogFile
X
X
X
X
ST27
818
1
page 293
Configuration.TriggerDataLogFile (M6 and M8 model)
X
X
X
ST77
868
1
page 293
Configuration.TriggerSetpointInfoFile (M6 and M8
model)
X
X
X
ST76
867
1
page 294
X
X
X
N31
822
10
page 294
X
X
X
N28
819
15
page 295
Configuration.TriggerData_Log (M6 and M8 model)
Configuration.Harmonics_Optional_Read
X
Rockwell Automation Publication 1426-UM001G-EN-P - November 2014
231
Appendix A
PowerMonitor 5000 Unit Data Tables
Table 35 - Data Table Summary Index
Name of Data Table
Read
M5
Configuration.WaveformFileName (M6 and M8 model)
M6
M8
Write
PCCC File
Number
CIP Instance
Number
# of Table
Parameters
Refer to Page
X
X
X
ST79
870
1
page 296
Security.Username
X
X
X
X
ST29
820
1
page 296
Security.Password
X
X
X
X
ST30
821
1
page 297
Status.General
X
X
X
X
N32
823
55
page 298
Status.Communications
X
X
X
X
N33
824
61
page 300
Status.RunTime
X
X
X
X
N34
825
74
page 301
Status.DiscreteIO
X
X
X
X
N35
826
112
page 304
Status.Wiring_Diagnostics
X
X
X
X
F38
829
33
page 305
Status.TableWrite
X
X
X
X
N39
830
13
page 308
Status.InformationTable
X
X
X
X
ST40
831
10
page 309
Status.Alarms
X
X
X
X
N41
832
32
page 310
Status.OptionalComm
X
X
X
X
N44
835
30
page 318
Status.Wiring_Corrections
X
X
X
X
N43
834
14
page 320
Status.IEEE1588 (M6 and M8 model)
X
X
X
N82
873
45
page 322
Statistics.Setpoint_Output
X
X
X
X
N36
827
112
page 324
Statistics.Logging
X
X
X
X
N42
833
20
page 329
Statistics.Setpoint_Logic (M6 and M8 model)
X
X
X
N37
828
112
page 330
Command.System_Registers
X
X
X
X
F47
838
45
page 333
Command.Controller_Interface
X
X
X
X
N48
839
16
page 335
Command.Wiring_Corrections
X
X
X
X
N49
840
14
page 336
MeteringResults.RealTime_VIF_Power
X
X
X
X
F53
844
56
page 338
MeteringResults.Energy_Demand
X
X
X
X
F55
846
56
page 340
MeteringResults.EN61000_4_30_VIP (M8 only)
X
X
F89
880
43
page 341
LoggingResults.DataLog_FileName
X
X
X
X
ST58
849
1
page 343
LoggingResults.EnergyLog_FileName
X
X
X
X
ST59
850
1
page 343
LoggingResults.Data_Log
X
X
X
X
F60
851
38
page 344
LoggingResults.Energy_Log
X
X
X
X
F61
852
35
page 346
LoggingResults.LoadFactor.Log
X
X
X
X
F62
853
40
page 348
LoggingResults.TOU.Log
X
X
X
X
F63
854
38
page 349
LoggingResults.MIN_MAX.Log
X
X
X
X
F64
855
11
page 350
LoggingResults.Alarm_Log
X
X
X
X
N65
856
7
page 351
LoggingResults.Event_Log
X
X
X
X
N66
857
9
page 352
LoggingResults.Setpoint_Log
X
X
X
X
F67
858
18
page 353
LoggingResults.Error_Log
X
X
X
X
N68
859
24
page 354
LoggingResults.TriggerLogSetpointInfo_FileName
(M6 and M8 model)
X
X
X
ST75
866
1
page 356
LoggingResults.TriggerLog_FileName (M6 and M8
model)
X
X
X
ST74
865
1
page 356
LoggingResults.TriggerData_Header (M6 and M8
model)
X
X
X
F71
862
15
page 357
232
Rockwell Automation Publication 1426-UM001G-EN-P - November 2014
PowerMonitor 5000 Unit Data Tables
Appendix A
Table 35 - Data Table Summary Index
Name of Data Table
Read
LoggingResults.TriggerData_Log (M6 and M8 model)
M5
M6
M8
X
X
LoggingResults.Power_Quality_Log (M6 and M8
model)
X
LoggingResults.Snapshot_Log (M6 and M8 model)
PCCC File
Number
CIP Instance
Number
# of Table
Parameters
Refer to Page
X
F70
861
14
page 358
X
X
F73
864
32
page 359
X
X
X
F81
872
2
page 360
LoggingResults.WaveformFileName (M6 and M8
model)
X
X
X
ST78
869
1
page 361
LoggingResults.Waveform_Log (M6 and M8 model)
X
X
X
F80
871
43
page 361
LoggingResults.EN50160_Weekly_Log (M8 only)
X
X
F83
874
13
page 364
LoggingResults.EN50160_Yearly_Log (M8 only)
X
X
F84
875
37
page 365
PowerQuality.RealTime_PowerQuality
X
X
F54
845
56
page 367
PowerQuality.EN61000_4_30_HSG (M8 only)
X
X
F88
879
23
page 369
PowerQuality.EN61000_4_30_THD (M8 only)
X
X
F90
881
46
page 370
PowerQuality.EN61000_4_30_Sequence (M8 only)
X
X
F91
882
13
page 372
PowerQuality.EN61000_4_30_Aggregation (M8 only) X
X
F92
883
46
page 373
PowerQuality.EN50160_Compliance_Results (M8
only)
X
X
F93
884
40
page 375
PowerQuality.Harmonics_Results (M6 and M8 model)
X
X
X
F69
860
37
page 377
PowerQuality.IEEE1159_Results (M6 and M8 model)
X
X
X
F72
863
26
page 379
PowerQuality.Synchro_Phasor_Results
X
X
X
F103
894
26
page 381
PowerQuality.IEEE519_ Results (M6 and M8 model)
X
X
X
Fn (varies)
Varies
44
page 383
PowerQuality.Harmonics Results (M6 and M8 model)
X
X
X
Fn (varies)
Varies
35
page 388
PowerQuality.EN61000_4_30 Harmonic and
Interharmonic Group Results (M8 only)
X
X
Fn (varies)
Varies
54
page 394
X
X
Write
Rockwell Automation Publication 1426-UM001G-EN-P - November 2014
233
Appendix A
PowerMonitor 5000 Unit Data Tables
Data Tables
These tables detail each specific data table and its associated elements, such as
start bytes, size, default value, ranges, and description.
IMPORTANT
The lock symbol
designates that the parameter that is marked is not able
to be written when the hardware lock switch is in the lock position.
ScheduledData.Input
Table 36 - Table Properties
CIP Assembly Instance
100
No. of Elements
65
Length in Words
120
Data Type
Shown in
table
Data Access
Read Only
Table 37 - ScheduledData.Input Data Table
Start
Byte
Size
Type
Tag Name
Description
0
4
DWORD
Fault
The status of the connection
4
2
Int16
SetPoint01_10Status
Actuation Status of Setpoints 1 through 10
0…65535
Bit 0
SetPoint01Active
1 Indicates the setpoint is Active
0 or 1
Bit 1
SetPoint02Active
1 Indicates the setpoint is Active
0 or 1
Bit 2
SetPoint03Active
1 Indicates the setpoint is Active
0 or 1
Bit 3
SetPoint04Active
1 Indicates the setpoint is Active
0 or 1
Bit 4
SetPoint05Active
1 Indicates the setpoint is Active
0 or 1
Bit 5
SetPoint06Active
1 Indicates the setpoint is Active
0 or 1
Range
Bit 6
SetPoint07Active
1 Indicates the setpoint is Active
0 or 1
Bit 7
SetPoint08Active
1 Indicates the setpoint is Active
0 or 1
Bit 8
SetPoint09Active
1 Indicates the setpoint is Active
0 or 1
Bit 9
SetPoint10Active
1 Indicates the setpoint is Active
0 or 1
Future Use
0
Bit 10…15 Reserved
234
Units
Rockwell Automation Publication 1426-UM001G-EN-P - November 2014
PowerMonitor 5000 Unit Data Tables
Appendix A
Table 37 - ScheduledData.Input Data Table
Start
Byte
Size
Type
Tag Name
Description
6
2
Int16
SetPoint11_20Status
Actuation Status of Setpoints 11 through 20
0…65535
Bit 0
SetPoint11Active
1 Indicates the setpoint is Active
0 or 1
Bit 1
SetPoint12Active
1 Indicates the setpoint is Active
0 or 1
Bit 2
SetPoint13Active
1 Indicates the setpoint is Active
0 or 1
Bit 3
SetPoint14Active
1 Indicates the setpoint is Active
0 or 1
Bit 4
SetPoint15Active
1 Indicates the setpoint is Active
0 or 1
Bit 5
SetPoint16Active
1 Indicates the setpoint is Active
0 or 1
Bit 6
SetPoint17Active
1 Indicates the setpoint is Active
0 or 1
Bit 7
SetPoint18Active
1 Indicates the setpoint is Active
0 or 1
Bit 8
SetPoint19Active
1 Indicates the setpoint is Active
0 or 1
Bit 9
SetPoint20Active
1 Indicates the setpoint is Active
0 or 1
Bit 10…15 Reserved
Future Use
0
Int16
DiscreteOutputStatus
Discrete Output status
0…65535
Bit 0
KYZLogicState
KYZ Logic State
0 or 1
Bit 1
R1LogicState
Relay 1 Logic State
0 or 1
Bit 2
R2LogicState
Relay 2 Logic State
0 or 1
Bit 3
R3LogicState
Relay 3 Logic State
0 or 1
Bit 4
KYZReadback
Indicates Output KYZ Energized
0 or 1
Bit 5
KYZForcedOn
Software Control Forced On KYZ
0 or 1
Bit 6
KYZForcedOff
Software Control Forced Off KYZ
0 or 1
Bit 7
R1Readback
Indicates Output Relay 1 Energized
0 or 1
Bit 8
R1ForcedOn
Software Control Forced On Relay 1
0 or 1
Bit 9
R1ForcedOff
Software Control Forced Off Relay 1
0 or 1
Bit 10
R2Readback
Indicates Output Relay 2 Energized
0 or 1
Bit 11
R2ForcedOn
Software Control Forced On Relay 2
0 or 1
8
2
Units
Range
Bit 12
R2ForcedOff
Software Control Forced Off Relay 2
0 or 1
Bit 13
R3Readback
Indicates Output Relay 3 Energized
0 or 1
Bit 14
R3ForcedOn
Software Control Forced On Relay 3
0 or 1
Bit 15
R3ForcedOff
Software Control Forced Off Relay 3
0 or 1
10
2
Int16
Year
The currrent year
2010
2010…2100
12
2
Int16
Month_Day
The current month and day
101
0101…1231
14
2
Int16
Hour_Minute
The current hour and minute of the day
0
0000…2359
16
2
Uint16
Seconds_Milliseconds
The current seconds and milliseconds
0
00000…59999
18
2
Int16
Reserved
Future Use
20
4
Int32
Metering_Iteration_Num
Metering iteration number
24
2
Int16
PFLeadLag
L1 lead or lag indicator for power factor 1 = leading, -1 = lagging
Rockwell Automation Publication 1426-UM001G-EN-P - November 2014
0
0
0…65535
-1…1
235
Appendix A
PowerMonitor 5000 Unit Data Tables
Table 37 - ScheduledData.Input Data Table
Start
Byte
Size
Type
Tag Name
Description
Units
Range
26
2
Int16
DiscreteInputStatus
Discrete Input status
Bit 0
S1
Indicates Status 1 actuated
0 or 1
Bit 1
S2
Indicates Status 2 actuated
0 or 1
Bit 2
S3
Indicates Status 3 actuated
0 or 1
Bit 3
S4
Indicates Status 4 actuated
0 or 1
Bit 4…15
Reserved
Future Use
0
28
4
Real
V1ToVNVoltage
V1 to N true RMS voltage
V
0…9.999E15
32
4
Real
V2ToVNVoltage
V2 to N true RMS voltage
V
0…9.999E15
36
4
Real
V3ToVNVoltage
V3 to N true RMS voltage
V
0…9.999E15
40
4
Real
VNToVGVoltage
VN to G true RMS voltage
V
0…9.999E15
44
4
Real
AvgVtoVNVoltage
Average of V1, V2 and V3.
V
0…9.999E15
48
4
Real
V1ToV2Voltage
V1 to V2 true RMS voltage
V
0…9.999E15
52
4
Real
V2ToV3Voltage
V2 to V3 true RMS voltage
V
0…9.999E15
56
4
Real
V3ToV1Voltage
V3 to V1 true RMS voltage
V
0…9.999E15
60
4
Real
AvgVToVVoltage
Average of V1_V2, V2_V3 and V3_V1.
V
0…9.999E15
64
4
Real
I1Current
I1 true RMS amps
A
0…9.999E15
68
4
Real
I2Current
I2 true RMS amps
A
0…9.999E15
72
4
Real
I3Current
I3 true RMS amps
A
0…9.999E15
76
4
Real
I4Current
I4 true RMS amps
A
0…9.999E15
80
4
Real
IAvgCurrent
Average I1, I2 and I3 amps.
A
0…9.999E15
84
4
Real
LineFreq
Last Line Frequency Calculated.
Hz
0.0…70.0
88
4
Real
Total_kW
L1, L2 and L3 kW Total.
kW
-9.999E15…9.999E15
92
4
Real
Total_kVAR
L1, L2 and L3 kVAR Total.
kVAR
-9.999E15…9.999E15
96
4
Real
Total_kVA
L1, L2 and L3 kVA Total.
kVA
0…9.999E15
100
4
Real
TotalTruePF
Total L1, L2 and L3 True Power Factor.
%
0.00…100.00
104
4
Real
TotalDisplacementPF
Total of L1, L2 and L3 Displacement Power Factor.
%
0.00…100.00
108
4
Real
AvgTHD_VToVN_IEEE
Average V1/V2/V3 to N IEEE Total Harmonic Distortion
%
0.00…100.00
112
4
Real
AvgTHD_VToV_IEEE
Average IEEE THD for V1-V2, V2-V3, V3-V1
%
0.00…100.00
116
4
Real
AvgTHD_Current_IEEE
Average I1/I2/I3 IEEE Total Harmonic Distortion
%
0.00…100.00
120
4
Real
AvgTHD_VToVN_IEC
Average V1/V2/V3 to N IEC Total Harmonic Distortion
%
0.00…100.00
124
4
Real
AvgTHD_VToV_IEC
Average IEC THD for V1-V2, V2-V3, V3-V1
%
0.00…100.00
128
4
Real
AvgTHD_Current_IEC
Average I1/I2/I3 IEC Total Harmonic Distortion
%
0.00…100.00
132
4
Real
VoltagePercentUnbalance
Voltage percent unbalance
%
0.00…100.00
136
4
Real
CurrentPercentUnbalance
Current percent unbalance
%
0.00…100.00
140
4
Real
S1ScaledCount_xM
Status 1 count times 1000000
xM
0…9,999,999
144
4
Real
S1ScaledCount_x1
Status 1 count times 1
x1
0…999,999
148
4
Real
S2ScaledCount_xM
Status 2 count times 1000000
xM
0…9,999,999
152
4
Real
S2ScaledCount_x1
Status 2 count times 1
x1
0…999,999
156
4
Real
S3ScaledCount_xM
Status 3 count times 1000000
xM
0…9,999,999
236
Rockwell Automation Publication 1426-UM001G-EN-P - November 2014
PowerMonitor 5000 Unit Data Tables
Appendix A
Table 37 - ScheduledData.Input Data Table
Start
Byte
Size
Type
Tag Name
Description
Units
Range
160
4
Real
S3ScaledCount_x1
Status 3 count times 1
x1
0…999,999
164
4
Real
S4ScaledCount_xM
Status 4 count times 1000000
xM
0…9,999,999
168
4
Real
S4ScaledCount_x1
Status 4 count times 1
x1
0…999,999
172
4
Real
GWh
Net gigaWatt hours
GWh
+/- 0…9,999,999
176
4
Real
kWh
Net kiloWatt hours
kWh
+/- 0.000…999,999
180
4
Real
GVARH
Net gigaVAR hours
GVARh
+/- 0…9,999,999
184
4
Real
kVARh
Net kiloVAR hours
kVARh
+/- 0.000…999,999
188
4
Real
GVAh
Total gigaVA hours
GVAh
0.000…9,999,999
192
4
Real
kVAh
Total kiloVA hours
kVAh
0.000…999,999
196
4
Real
GAh
Total giga Ampere hours
GAh
0.000…9,999,999
200
4
Real
kAh
Total kilo Ampere hours
kAh
0.000…999,999
204
4
Real
Demand_kW
The average real power during the last demand period.
kW
+/- 0.000…9,999,999
208
4
Real
Demand_kVAR
The average reactive power during the last demand period.
kVAR
+/- 0.000…9,999,999
212
4
Real
Demand_kVA
The average apparent power during the last demand period.
kVA
0.000…9,999,999
216
4
Real
Demand_PF
The average PF during the last demand period.
%
-100.0…100.0
220
4
Real
Demand_I
The average amperes during the last demand period.
A
0.000…9,999,999
224
4
Real
ProjectedDemand_kW
The projected total real power for the current demand period.
kW
+/- 0.000…9,999,999
228
4
Real
ProjectedDemand_kVAR
The projected total reactive power for the current demand period.
kVAR
+/- 0.000…9,999,999
232
4
Real
ProjectedDemand_kVA
The projected total apparent power for the current demand period.
kVA
0.000…9,999,999
236
4
Real
ProjectedDemand_I
The projected total amperes for the current demand period.
A
0.000…9,999,999
Rockwell Automation Publication 1426-UM001G-EN-P - November 2014
237
Appendix A
PowerMonitor 5000 Unit Data Tables
ScheduledData.Output
Table 38 - Table Properties
CIP Instance Number
101
No. of Elements
1
Length in Words
2
Data Type
DWORD
Data Access
Write Only
Table 39 - ScheduledData.Output Data Table
Start Size
Byte
Type
Tag Name
0
DWORD
RelayOut
Bit 0
Energize KYZ
1 = Energize; 0 = de-energize
0 or 1
Bit 1
R1
1 = Energize; 0 = de-energize
0 or 1
Bit 2
R2
1 = Energize; 0 = de-energize
0 or 1
Bit 3
R3
1 = Energize; 0 = de-energize
0 or 1
Bit 4 …31
Reserved
Future Use
0 or 1
238
4
Description
Range
0…15
Rockwell Automation Publication 1426-UM001G-EN-P - November 2014
PowerMonitor 5000 Unit Data Tables
Appendix A
Configuration.Instance
Table 40 - Table Properties
CIP
102
No. of Elements
44
Length in Words
80
Data Type
Varies
Data Access
Read/Write
Table 41 - Configuration.Instance Data Table
Start
Byte
Size
Type
Tag Name
Description
Units
Range
0
1
SINT
MeterMode
Configures the input wiring for metering.
0 = Demo
1 = Split Phase
2 = Wye
3 = Delta 2 CT
4 = Delta 3 CT
5 = Open Delta 2 CT
6 = Open Delta 3 CT
7 = Delta Gnd B Ph 2 CT
8 = Delta Gnd B Ph 3 CT
9 = Delta High Leg
10=Single Phase
Mode
0…10
1
SINT
Pad01
For alignment purpose
2
INT
Pad02
For alignment purpose
4
4
Real
VLinePTPrimary
The primary voltage value of the PT transformer
V
0…1,000,000
8
4
Real
VLinePTSecondary
The secondary voltage value of the PT transformer
V
0…690
12
4
Real
ILineCTPrimary
The primary ampere value of the CT transformer
A
0…1,000,000
16
1
SINT
ILineCTSecondary
The secondary ampere value of the CT transformer
A
5
1
SINT
Pad03
For alignment purpose
2
INT
Pad04
For alignment purpose
20
4
Real
VNPTPrimary
The primary voltage value of the PT transformer
V
0…1,000,000
24
4
Real
VNPTSecondary
The secondary voltage value of the PT transformer
V
0…690
28
4
Real
I4CTPrimary
The primary ampere value of the CT transformer
A
0…1,000,000
32
1
SINT
I4CTSecondary
The secondary ampere value of the CT transformer
A
5
1
SINT
Pad05
For alignment purpose
2
INT
Pad06
For alignment purpose
36
4
Real
NominalVToVVoltage
Nominal voltage value or voltage rating of the system being metered. V
0…1,000,000
40
4
DINT
Pad07
For alignment purpose
N/A
0…0
44
4
Real
NominalFreq
Nominal frequency of the system.
50=50 Hertz
60=60 Hertz
Hertz
50 or 60
Rockwell Automation Publication 1426-UM001G-EN-P - November 2014
239
Appendix A
PowerMonitor 5000 Unit Data Tables
Table 41 - Configuration.Instance Data Table
Start
Byte
Size
Type
Tag Name
Description
Units
Range
48
1
SINT
RealTimeUpdateRate
Selects the update rate for the realtime table and the setpoint
calculations.
0 = Single cycle averaged over 8 cycles
1 = Single cycle averaged over 4 cycles
2 = 1 cycle with no averaging
Meter
Averaging
0…2
1
SINT
Pad08
For alignment purpose
2
INT
Pad09
For alignment purpose
52
2
Int16
DeviceFaultAction
This parameter determines the action when a unit error occurs.
0 = Halt on error and make status indicator solid red
1 = Reset power monitor hardware
Error Action
0…1
54
2
Int16
EnergyLogInterval
Selects how often a record is logged (minutes). A value of 0 disables
periodic logging of records. A value of -1 causes the logging of records
to be synchronized to the end of the demand Interval.
Energy Interval
(Minutes)
-1…60
56
2
Int16
EnergyLogMode
This parameter sets the action of the log once it has filled to capacity.
0 = Fill and Stop
1 = Overwrite oldest record.
Energy Log
Mode
0…1
58
2
Int16
TOU AutoStoreDay
Automatically stores the current record for the month replacing an
older record if the log is full. The log holds 12 records plus the current
record.
0 = Disable storing records
1 = Store and clear on the first day of the month
2 = 2nd of month
3 = 3rd day of month
…
31 = 31st day of month
If set to 29…31 the last day of every month stores a record.
AutoStore
0…31
60
1
SINT
DemandSource
When item ‘Demand Broadcast Master Select’ of the Ethernet table is
set to a master selection of 0…2 sets the type of master input. In this
case item ‘3’ is ignored. When the ‘Demand Broadcast Master Select’
of the Ethernet table is set to slave, then any of these inputs can set
the end of the demand period.
0 = Internal Timer
1 = Status Input 2
2 = Controller Command
3 = Ethernet Demand Broadcast
Demand Period 0…3
Length
1
SINT
Pad10
For alignment purpose
2
INT
Pad11
For alignment purpose
1
SINT
DemandPeriodLength
Specifies the desired period for demand calculations. When set to 0
there is no projected demand calculations. If the internal timer is
selected a setting of 0 turns the demand function off.
1
SINT
Pad12
For alignment purpose
2
INT
Pad13
For alignment purpose
1
SINT
NumberOfDemandCycles
Specifies the number of demand periods to average for demand
measurement.
1
SINT
Pad14
For alignment purpose
2
INT
Pad15
For alignment purpose
64
68
240
Rockwell Automation Publication 1426-UM001G-EN-P - November 2014
Number
Demand
Periods
0…99
Demand Sync
Delay
1…15
PowerMonitor 5000 Unit Data Tables
Appendix A
Table 41 - Configuration.Instance Data Table
Start
Byte
Size
Type
Tag Name
Description
Units
Range
72
2
Int16
ForcedDemandSyncDelay
When the power monitor is configured for external demand control
the unit delays for xxx seconds after the expected control pulse has
not been received. The demand period starts over and a record is
recorded in the event log
0 = Wait forever
1…900 = Wait this many seconds before starting a new demand
period.
IMPORTANT: This setting becomes active when an external input is
used to end the demand period.
Demand
Broadcast
Mode
0…900
2
INT
Pad16
For alignment purpose
1
SINT
DemandBroadcastMode
Demand Ethernet broadcast selection.
0 = Slave
1 = Master
IMPORTANT: There can be only one master per demand network.
Demand
Broadcast
Mode
0…1
1
SINT
Pad17
For alignment purpose
78
2
Int16
DemandBroadcastPort
The common port for demand broadcast messages.
Demand
Broadcast Port
300…400
80
1
SINT
KYZOutputMode
The parameter selected pulses the KYZ output at a rate that equals the
parameter value divided by KYZ scale.
0 = Setpoint Control
1 = Wh Fwd
2 = Wh Rev
3 = VARh Fwd
4 = VARh Rev
5 = VAh
6 = Ah
KYZ Output
Parameter
0…6
1
SINT
Pad18
For alignment purpose
2
INT
Pad19
For alignment purpose
84
4
Int32
KYZPulseScale
The KYZ output parameter divided by the scale is the output pulse
rate. Example: Wh is selected for the parameter and 1,000 is the
scale value. The output is pulsed every kWh.
KYZ Output
Scale
1…100,000
88
2
Int16
KYZPulseDuration
Set as 50…1000 to indicate the duration of the pulse in milliseconds,
or set to 0 for KYZ-style transition output. (Toggle)
IMPORTANT: The value for delay is rounded off to the nearest 10 ms
internally during this function.
KYZ Output
Duration
0 or 50…1000
2
INT
Pad20
For alignment purpose
1
SINT
R1OutputMode
The parameter selected pulses the relay 1 output at a rate that equals
the parameter value divided by relay 1 scale.
0 = Setpoint Control
1 = Wh Fwd
2 = Wh Rev
3 = VARh Fwd
4 = VARh Rev
5 = VAh
6 = Ah
Relay 1 Output
Parameter
0…6
1
SINT
Pad21
For alignment purpose
2
INT
Pad22
For alignment purpose
4
Int32
R1PulseScale
The relay 1 output parameter divided by the relay 1 scale is the output
pulse rate. Example: Wh is selected for the parameter and 1,000 is the
scale value. The output is pulsed every kWh.
Relay 1 Output
Scale
1…100,000
76
92
96
Rockwell Automation Publication 1426-UM001G-EN-P - November 2014
241
Appendix A
PowerMonitor 5000 Unit Data Tables
Table 41 - Configuration.Instance Data Table
Start
Byte
Size
Type
Tag Name
Description
Units
Range
100
2
Int16
R1PulseDuration
Set as 50…1000 to indicate the duration of the pulse in milliseconds,
or set to 0 for KYZ-style transition output. (Toggle)
IMPORTANT: The value for delay is rounded off to the nearest 10 ms
internally during this function.
Relay 1 Output
Duration
0 or 50…1000
2
INT
Pad23
For alignment purpose
1
SINT
R2OutputMode
The parameter selected pulses the relay 2 output at a rate that equals
the parameter value divided by relay 2 scale.
0 = Setpoint Control
1 = Wh Fwd
2 = Wh Rev
3 = VARh Fwd
4 = VARh Rev
5 = VAh
6 = Ah
Relay 2 Output
Parameter
0…6
1
SINT
Pad24
For alignment purpose
2
INT
Pad25
For alignment purpose
108
4
Int32
R2PulseScale
The relay 2 output parameter divided by the relay 2 scale is the output
pulse rate. Example: Wh is selected for the parameter and 1,000 is the
scale value. The output is pulsed every kWh.
Relay 2 Output
Scale
1…100,000
112
2
Int16
R2PulseDuration
Set as 50…1000 to indicate the duration of the pulse in milliseconds,
or set to 0 for KYZ-style transition output. (Toggle)
IMPORTANT: The value for delay is rounded off to the nearest 10 ms
internally during this function.
Relay 2 Output
Duration
0 or 50…1000
2
INT
Pad26
For alignment purpose
1
SINT
R3OutputMode
The parameter selected pulses the relay 3 output at a rate that equals
the parameter value divided by relay 3 scale.
0 = Setpoint Control
1 = Wh Fwd
2 = Wh Rev
3 = VARh Fwd
4 = VARh Rev
5 = VAh
6 = Ah
Relay 3 Output
Parameter
0…6
1
SINT
Pad27
For alignment purpose
104
116
2
INT
Pad28
For alignment purpose
120
4
Int32
R3PulseScale
The relay 3 output parameter divided by the relay 3 scale is the output
pulse rate. Example: Wh is selected for the parameter and 1,000 is the
scale value. The output is pulsed every kWh.
Relay 3 Output
Scale
1…100,000
124
4
Int16
R3PulseDuration
Set as 50…1000 to indicate the duration of the pulse in milliseconds,
or set to 0 for KYZ-style transition output. (Toggle)
IMPORTANT: The value for delay is rounded off to the nearest 10 ms
internally during this function.
Relay 3 Output
Duration
0 or 50…1000
2
INT
Pad29
For alignment purpose
128
4
Int32
S1ScaleFactor
When a status pulse is received the count is increased by the scale
factor. (Input pulse * input scale) added to total status count.
Status 1 Input
Scaling
1…1,000,000
132
4
Int32
S2ScaleFactor
When a status pulse is received the count is increased by the scale
factor. (Input pulse * input scale) added to total status count.
Status 2 Input
Scaling
1…1,000,000
136
4
Int32
S3ScaleFactor
When a status pulse is received the count is increased by the scale
factor. (Input pulse * input scale) added to total status count.
Status 3 Input
Scaling
1…1,000,000
140
4
Int32
S4ScaleFactor
When a status pulse is received the count is increased by the scale
factor. (Input pulse * input scale) added to total status count.
Status 4 Input
Scaling
1…1,000,000
242
Rockwell Automation Publication 1426-UM001G-EN-P - November 2014
PowerMonitor 5000 Unit Data Tables
Appendix A
Table 41 - Configuration.Instance Data Table
Start
Byte
Size
Type
Tag Name
Description
Units
Range
144
1
SINT
KYZCommFaultMode
The Default output state on communication loss defines the behavior
of the output if the power monitor experiences a loss of
communication.
0 = Last state/resume
1 = Last state/freeze
2 = De-energize/resume
3 = De-energize/freeze
4 = Local Control
N/A
0…4
1
SINT
Pad30
For alignment purpose
2
INT
Pad31
For alignment purpose
1
SINT
R1CommFaultMode
The Default output state on communication loss defines the behavior
of the output if the power monitor experiences a loss of
communication.
0 = Last state/resume
1 = Last state/freeze
2 = De-energize/resume
3 = De-energize/freeze
4 = Local Control
N/A
0…4
1
SINT
Pad32
For alignment purpose
2
INT
Pad33
For alignment purpose
1
SINT
R2CommFaultMode
The Default output state on communication loss defines the behavior
of the output if the power monitor experiences a loss of
communication.
0 = Last state/resume
1 = Last state/freeze
2 = De-energize/resume
3 = De-energize/freeze
4 = Local Control
N/A
0…4
1
SINT
Pad34
For alignment purpose
2
INT
Pad35
For alignment purpose
148
152
Rockwell Automation Publication 1426-UM001G-EN-P - November 2014
243
Appendix A
PowerMonitor 5000 Unit Data Tables
Table 41 - Configuration.Instance Data Table
Start
Byte
Size
Type
Tag Name
Description
Units
Range
156
1
SINT
R3CommFaultMode
The Default output state on communication loss defines the behavior
of the output if the power monitor experiences a loss of
communication.
0 = Last state/resume
1 = Last state/freeze
2 = De-energize/resume
3 = De-energize/freeze
4 = Local Control
N/A
0…4
1
SINT
Pad36
For alignment purpose
2
Int16
CmdWordOne
These commands can be sent to the power monitor. When using the
optional elements the command table must be sent complete with all
elements present. If the single password table is used to gain access to
configuration items then the command can be sent alone without
optional settings. The command options are:
0 = No Action
1 = Set kWh Register
2 = Set kVARh Register
3 = Set kVAh Register
4 = Set kAh Register
5 = Clear All Energy Registers
6 = Set Status 1 Count
7 = Set Status 2 Count
8 = Set Status 3 Count
9 = Set Status 4 Count
10 = Force KYZ Output On
11 = Force KYZ Output Off
12 = Remove Force from KYZ
13 = Force Relay 1 Output On
14 = Force Relay 1 Output Off
15 = Remove Force from Relay 1
16 = Force Relay 2 Output On
17 = Force Relay 2 Output Off
18 = Remove Force from Relay 2
19 = Force Relay 3 Output On
20 = Force Relay 3 Output Off
21 = Remove Force from Relay 3
22 = Restore Factory Defaults
23 = Reset Powermonitor System
24 = Reserved for future use.
IMPORTANT: If a command is received that is not supported by your
catalog number, the command is ignored.
N/A
0…23
244
Rockwell Automation Publication 1426-UM001G-EN-P - November 2014
PowerMonitor 5000 Unit Data Tables
Appendix A
Configuration Parameter Object Table
Table 42 - Table Properties
CIP Class Code
0x0F
No. of Parameters
52
Data Type
Varies
Data Access
Read/Write
TIP
Refer to Table 41 Configuration.Instance Data Table for descriptions of each
parameter.
Table 43 - Configuration Parameter Object Table
Instance Number
Parameter Object Name
Type
Units
Range
Default Value
1
Metering_Mode
SINT
N/A
0…10
2
2
V1_V2_V3_PT_Primary
Real
V
0…1,000,000
480
3
V1_V2_V3_PT_Secondary
Real
V
0…690
480
4
I1_I2_I3_CT_Primary
Real
A
0…1,000,000
5
5
I1_I2_I3_CT_Secondary
SINT
A
5
5
6
VN_PT_Primary
Real
V
0…1,000,000
480
7
VN_PT_Secondary
Real
V
0…690
480
8
I4_CT_Primary
Real
A
0…1,000,000
5
9
I4_CT_Secondary
SINT
A
5
5
10
Nominal_System_LL_Voltage
Real
V
0…1,000,000
480
11
Reserved
Real
N/A
0
0
12
Nominal_System_Frequency
Real
Hz
50 or 60
60
13
Realtime_Update_Rate
SINT
N/A
0…2
0
14
Date_Year
Int16
Year
2010…2100
2010
15
Date_Month
Int16
Mon
1…12
1
16
Date_Day
Int16
Day
1…31
1
17
Time_Hour
Int16
Hour
0…23
0
18
Time_Minute
Int16
Min
0…59
0
19
Time_Seconds
Int16
Sec
0…59
0
20
Time_Milliseconds
Int16
Mise
0…999
0
21
Unit_Error_Action
Int16
N/A
0…1
1
22
Energy_Log_Interval
Int16
N/A
-1…60
15
23
Energy_Log_Mode
Int16
N/A
0…1
1
24
Time_Of_Use_AutoStore
Int16
N/A
0…31
31
25
Demand_Source
SINT
N/A
0…3
0
26
Demand_Period_Length
SINT
N/A
0…99
15
27
Number_Demand_Periods
SINT
N/A
1…15
1
28
Forced_Demand_Sync_Delay
Int16
N/A
0…900
10
Rockwell Automation Publication 1426-UM001G-EN-P - November 2014
245
Appendix A
PowerMonitor 5000 Unit Data Tables
Table 43 - Configuration Parameter Object Table
Instance Number
Parameter Object Name
Type
Units
Range
Default Value
29
Demand_Broadcast_Mode_Select
SINT
N/A
0…1
0
30
Demand_Broadcast_Port
Int16
N/A
300…400
300
31
KYZ_Solid_State_Output_Parameter
SINT
N/A
0…6
0
32
KYZ_Solid_State_Output_Scale
Int32
N/A
1…100,000
1000
33
KYZ_Pulse_Duration_Setting
Int16
N/A
0 or 50…1000
250
34
Output_Relay_1_Output_Parameter
SINT
N/A
0…6
0
35
Output_Relay_1_Output_Scale
Int32
N/A
1…100,000
1000
36
Output_Relay_1_Pulse_Duration_Setting
Int16
N/A
0 or 50…1000
250
37
Output_Relay_2_Output_Parameter
SINT
N/A
0…6
0
38
Output_Relay_2_Output_Scale
Int32
N/A
1…100,000
1000
39
Output_Relay_2_Pulse_Duration_Setting
Int16
N/A
0 or 50…1000
250
40
Output_Relay_3_Output_Parameter
SINT
N/A
0…6
0
41
Output_Relay_3_Output_Scale
Int32
N/A
1…100,000
1000
42
Output_Relay_3_Pulse_Duration_Setting
Int16
N/A
0 or 50…1000
250
43
Status_Input_1_Input_Scale
Int32
N/A
1…1,000,000
1
44
Status_Input_2_Input_Scale
Int32
N/A
1…1,000,000
1
45
Status_Input_3_Input_Scale
Int32
N/A
1…1,000,000
1
46
Status_Input_4_Input_Scale
Int32
N/A
1…1,000,000
1
47
Default_KYZ_State_On_Comm_Loss
SINT
N/A
0…4
0
48
Default_Relay_1_State_On_Comm_Loss
SINT
N/A
0…4
0
49
Default_Relay_2_State_On_Comm_Loss
SINT
N/A
0…4
0
50
Default_Relay_3_State_On_Comm_Loss
SINT
N/A
0…4
0
51
Clear Energy Counters
Int16
N/A
0…1
0
52
Clear Energy log
Int16
N/A
0…1
0
246
Rockwell Automation Publication 1426-UM001G-EN-P - November 2014
PowerMonitor 5000 Unit Data Tables
Appendix A
Display Parameter Object Table
Table 44 - Table Properties
CIP Class Code
0x0F
No. of Parameters
117
Data Type
Varies
Data Access
Read Only
Table 45 - Display Parameter Object Table
Instance
Number
Parameter Object Name
Type
Units
Description
53
V1_N_Volts
Real
V
V1 to N true RMS voltage
54
V2_N_Volts
Real
V
V2 to N true RMS voltage
55
V3_N_Volts
Real
V
V3 to N true RMS voltage
56
VGN_N_Volts
Real
V
VGN to N true RMS voltage
57
Avg_V_N_Volts
Real
V
Average of V1, V2 and V3
58
V1_V2_Volts
Real
V
V1 to V2 true RMS voltage
59
V2_V3_Volts
Real
V
V2 to V3 true RMS voltage
60
V3_V1_Volts
Real
V
V3 to V1 true RMS voltage
61
Avg_VL_VL_Volts
Real
V
Average of V1_V2, V2_V3 and V3_V1
62
I1_Amps
Real
A
I1 true RMS amps
63
I2_Amps
Real
A
I2 true RMS amps
64
I3_Amps
Real
A
I3 true RMS amps
65
I4_Amps
Real
A
I4 true RMS amps
66
Avg_Amps
Real
A
Average I1, I2 and I3 amps
67
Frequency_Hz
Real
Hz
Last Line Frequency Calculated
68
L1_kW
Real
kW
L1 real power
69
L2_kW
Real
kW
L2 real power
70
L3_kW
Real
kW
L3 real power
71
Total_kW
Real
kW
Total real power
72
L1_kVAR
Real
kVAR
L1 reactive power
73
L2_kVAR
Real
kVAR
L2 reactive power
74
L3_kVAR
Real
kVAR
L3 reactive power
75
Total_kVAR
Real
kVAR
Total reactive power
76
L1_kVA
Real
kVA
L1 apparent power
77
L2_kVA
Real
kVA
L2 apparent power
78
L3_kVA
Real
kVA
L3 apparent power
79
Total_kVA
Real
kVA
Total apparent power
80
L1_True_PF_%
Real
%
L1 true power factor (full bandwidth)
81
L2_True_PF_%
Real
%
L2 true power factor (full bandwidth)
82
L3_True_PF_%
Real
%
L3 true power factor (full bandwidth)
83
Total_True_PF
Real
%
Total true power factor
Rockwell Automation Publication 1426-UM001G-EN-P - November 2014
247
Appendix A
PowerMonitor 5000 Unit Data Tables
Table 45 - Display Parameter Object Table
Instance
Number
Parameter Object Name
Type
Units
Description
84
L1_Disp_PF
Real
%
L1 displacement power factor (fundamental only)
85
L2_Disp_PF
Real
%
L2 displacement power factor (fundamental only)
86
L3_Disp_PF
Real
%
L3 displacement power factor (fundamental only)
87
Total_Disp_PF
Real
%
Total displacement power factor (fundamental only)
88
V1_Crest_Factor
Real
-
V1 crest factor
89
V2_Crest_Factor
Real
-
V2 crest factor
90
V3_Crest_Factor
Real
-
V3 crest factor
91
I1_Crest_Factor
Real
-
I1 crest factor
92
I2_Crest_Factor
Real
-
I2 crest factor
93
I3_Crest_Factor
Real
-
I3 crest factor
94
I4_Crest_Factor
Real
-
I4 crest factor
95
V1_IEEE_THD_%
Real
%
V1-N IEEE Total Harmonic Distortion
96
V2_IEEE_THD_%
Real
%
V2-N IEEE Total Harmonic Distortion
97
V3_IEEE_THD_%
Real
%
V3-N IEEE Total Harmonic Distortion
98
VN_G_IEEE_THD_%
Real
%
VN-G IEEE Total Harmonic Distortion
99
Avg_IEEE_THD_V_%
Real
%
Average V1/V2/V3 to N IEEE Total Harmonic Distortion
100
I1_IEEE_THD_%
Real
%
I1 IEEE Total Harmonic Distortion
101
I2_IEEE_THD_%
Real
%
I2 IEEE Total Harmonic Distortion
102
I3_IEEE_THD_%
Real
%
I3 IEEE Total Harmonic Distortion
103
I4_IEEE_THD_%
Real
%
I4 IEEE Total Harmonic Distortion
104
Avg_IEEE_THD_I_%
Real
%
Average I1/I2/I3 IEEE Total Harmonic Distortion
105
V1_IEC_THD_%
Real
%
V1-N IEC Total Harmonic Distortion
106
V2_IEC_THD_%
Real
%
V2-N IEC Total Harmonic Distortion
107
V3_IEC_THD_%
Real
%
V3-N IEC Total Harmonic Distortion
108
VN_G_IEC_THD_%
Real
%
VN-G IEC Total Harmonic Distortion
109
Avg_IEC_THD_V_%
Real
%
Average V1/V2/V3 to N IEC Total Harmonic Distortion
110
I1_IEC_THD_%
Real
%
I1 IEC Total Harmonic Distortion
111
I2_IEC_THD_%
Real
%
I2 IEC Total Harmonic Distortion
112
I3_IEC_THD_%
Real
%
I3 IEC Total Harmonic Distortion
113
I4_IEC_THD_%
Real
%
I4 IEC Total Harmonic Distortion
114
Avg_IEC_THD_I_%
Real
%
Average I1/I2/I3 IEC Total Harmonic Distortion
115
Pos_Seq_Volts
Real
V
Positive Sequence Voltage
116
Neg_Seq_Volts
Real
V
Negative Sequence Voltage
117
Zero_Seq_Volts
Real
V
Zero Sequence Voltage
118
Pos_Seq_Amps
Real
A
Positive Sequence Amps
119
Neg_Seq_Amps
Real
A
Negative Sequence Amps
120
Zero_Seq_Amps
Real
A
Zero Sequence Amps
121
Voltage_Unbalance_%
Real
%
Voltage percent unbalance
122
Current_Unbalance_%
Real
%
Current percent unbalance
248
Rockwell Automation Publication 1426-UM001G-EN-P - November 2014
PowerMonitor 5000 Unit Data Tables
Appendix A
Table 45 - Display Parameter Object Table
Instance
Number
Parameter Object Name
Type
Units
Description
123
Status_1_Count_xM
Real
xM
Status 1 Count times 1,000,000
124
Status_1_Count_x1
Real
x1
Status 1 count times 1
125
Status_2_Count_xM
Real
xM
Status 2 Count times 1,000,000
126
Status_2_Count_x1
Real
x1
Status 2 count times 1
127
Status_3_Count_xM
Real
xM
Status 3 Count times 1,000,000
128
Status_3_Count_x1
Real
x1
Status 3 count times 1
129
Status_4_Count_xM
Real
xM
Status 4 Count times 1,000,000
130
Status_4_Count_x1
Real
x1
Status 4 count times 1
131
GWh_Fwd
Real
GWh
Forward gigawatt hours
132
kWh_Fwd
Real
kWh
Forward kilowatt hours
133
GWh_Rev
Real
GWh
Reverse gigawatt hours
134
kWh_Rev
Real
kWh
Reverse kilowatt hours
135
GWh_Net
Real
GWh
Net gigawatt hours
136
kWh_Net
Real
kWh
Net kilowatt hours
137
GVARH_Fwd
Real
GVARh
Forward gigaVAR hours
138
kVARh_Fwd
Real
kVARh
Forward kiloVAR hours
139
GVARH_Rev
Real
GVARh
Reverse gigaVAR hours
140
kVARh_Rev
Real
kVARh
Reverse kiloVAR hours
141
GVARH_Net
Real
GVARh
Net gigaVAR hours
142
kVARh_Net
Real
kVARh
Net kiloVAR hours
143
GVAh
Real
GVAh
Net gigaVA hours
144
kVAh
Real
kVAh
Net kiloVA hours
145
GAh
Real
GAh
Net giga Amp hours
146
kAh
Real
kAh
Net kilo Amp hours
147
kW_Demand
Real
kW
The average real power during the last demand period
148
kVAR_Demand
Real
kVAR
The average reactive power during the last demand period
149
kVA_Demand
Real
kVA
The average apparent power during the last demand period
150
Demand_PF
Real
PF
The average PF during the last demand period
151
Demand_Amps
Real
A
The average demand for amperes during the last demand period
152
Projected_kW_Demand
Real
kW
The projected total real power for the current demand period
153
Projected_kVAR_Demand
Real
kVAR
The projected total reactive power for the current demand period
154
Projected_kVA_Demand
Real
kVA
The projected total apparent power for the current demand period
155
Projected_Ampere_Demand
Real
A
The projected total amperes for the current demand period
156
Elapsed_Demand_Period_Time Real
Min
The amount of time that has elapsed during the current demand period
157
I1_K_Factor
Real
-
I1 K-factor
158
I2_K_Factor
Real
-
I2 K-factor
159
I3_K_Factor
Real
-
I3 K-factor
160
IEEE_519_TDD_%
Real
%
Total Demand Distortion used for IEEE 519 Pass/Fail Status
161
Setpoints_1_10_Active
Int16
N/A
Actuation Status of Setpoints 1…10
Rockwell Automation Publication 1426-UM001G-EN-P - November 2014
249
Appendix A
PowerMonitor 5000 Unit Data Tables
Table 45 - Display Parameter Object Table
Instance
Number
Parameter Object Name
Type
Units
Description
162
Setpoints_11_20_Active
Int16
N/A
Actuation Status of Setpoints 11…20
163
Logic_Level_1_Gates_Active
Int16
N/A
Actuation Status of Level 1 Gates
166
Metering_Status
Int16
N/A
Metering Conditions Status
167
Over_Range_Information
Int16
N/A
Indicates which input is over range
168
PowerQuality_Status
Int16
N/A
Power Quality Conditions Status
169
Logs_Status
Int16
N/A
Logs Condition Status
Configuration.DateTime
Table 46 - Table Properties
CIP Instance Number
800
PCCC File Number
N9
No. of Elements
15
Length in Words
15
Data Type
Int16
Data Access
Read/Write
Table 47 - Configuration.DateTime Data Table
Element
Number
Type
Tag Name
Description
Default
Range
0
Int16
Date_Year
The current year
2010
1970 …2100
1
Int16
Date_Month
The current month
1
1…12
2
Int16
Date_Day
The current day
1
1…31
3
Int16
Time_Hour
The current hour
0
0…23
4
Int16
Time_Minute
The current minute of the day
0
0…59
5
Int16
Time_Seconds
The current seconds
0
0…59
6
Int16
Time_Milliseconds
The current milliseconds
0
0…999
7…14
Int16
Reserved
0
0
250
Rockwell Automation Publication 1426-UM001G-EN-P - November 2014
PowerMonitor 5000 Unit Data Tables
Appendix A
Configuration.Logging
Table 48 - Table Properties
CIP Instance Number
801
PCCC File Number
N10
No. of Elements
40
Length in Words
40
Data Type
Int16
Data Access
Read/Write
Table 49 - Configuration.Logging Data Table
Element Type
Number
Tag Name
Description
Default
Range
0
Int16
Energy_Log_Interval
Selects how often a record is logged (minutes). A value of 0 disables periodic
logging of records. A value of -1 causes the logging of records to be synchronized to
the end of the demand Interval.
15
-1…60
1
Int16
Energy_Log_Mode
This parameter sets the action of the log once it has filled to capacity.
0 = Fill and Stop
1 = Overwrite oldest record
1
0…1
2
Int16
Setpoint_Log_Mode
This parameter sets the action of the log once it has filled to capacity.
0 = Fill and Stop
1 = Overwrite oldest record
1
0…1
3
Int16
Time_Of_Use_AutoStore
Automatically stores the current record for the month replacing an older record if
the log is full. The log holds 12 records plus the current record.
0 = Disable storing records
1 = Store and clear on the first day of the month
2 = 2nd of month
3 = 3rd day of month…to 31st day
If set to 29…31 the last day of every month stores a record.
31
0…31
4
Int16
Off_Peak_Days
This bit map field selects the off peak days. OFF-PEAK days have only one rate for
billing.
Bit0 = Sunday
Bit1 = Monday
Bit2 = Tuesday
Bit3 = Wednesday
Bit4 = Thursday
Bit5 = Friday
Bit 6 = Saturday
Important: Saturday and Sunday are default days.
65
0…127
5
Int16
MID_Peak_AM_Hours
This bit map selects any a.m. hours that are designated as MID Peak.
Bit0 = 12 a.m. to 1 a.m.
Bit1 = 1 a.m. to 2 a.m.
Bit2 = 2 a.m. to 3 a.m.
Bit 3 = 3 a.m. to 4 a.m.
…
Bit11 = 11 a.m. to 12 a.m.
Example: The hours from 8 a.m. to 11 a.m. is designated as
Bit 8 through Bit 10 = 1792d.
1792
0…4095
Rockwell Automation Publication 1426-UM001G-EN-P - November 2014
251
Appendix A
PowerMonitor 5000 Unit Data Tables
Table 49 - Configuration.Logging Data Table
Element Type
Number
Tag Name
Description
Default
Range
6
Int16
MID_Peak_PM_Hours
This bit map selects any p.m. hours that are designated as MID Peak.
Bit0 = 12 p.m. to 1 p.m.
Bit1 = 1 p.m. to 2 p.m.
Bit2 = 2 p.m. to 3 p.m.
Bit 3 = 3 p.m. to 4 p.m.
…
Bit11 = 11 p.m. to 12 p.m.
Example: The hours from 3 p.m. to 7 p.m. is designated as Bit 3 through
Bit 6 = 120d.
120
0…4095
7
Int16
ON_Peak_AM_Hours
This bit map selects any a.m. hours that are designated as ON Peak.
Bit0 = 12 a.m. to 1 a.m.
Bit1 = 1 a.m. to 2 a.m.
Bit2 = 2 a.m. to 3 a.m.
Bit 3 = 3 a.m. to 4 a.m.
…
Bit11 = 11 a.m. to 12 a.m.
Example: The hours from 11 a.m. to 12 p.m. is designated as Bit 11 = 2048d.
2048
0…4095
8
Int16
ON_Peak_PM_Hours
This bit map selects any p.m. hours that are designated as ON Peak.
Bit0 = 12 p.m. to 1 p.m.
Bit1 = 1 p.m. to 2 p.m.
Bit2 = 2 p.m. to 3 p.m.
Bit 3 = 3 p.m. to 4 p.m.
…
Bit11 = 11 p.m. to 12 p.m.
Example: The hours from 12 p.m. to 3 p.m. is designated as Bit 0 through Bit 2 = 7d
.
7
0…4095
9
Int16
Load_Factor_Auto_Log_Setting
Automatically stores the current peak, average and load factor results as a record in 31
the non volatile load factor log and resets the log at the specified day of the month.
0 = Disable storing records
1 = Store and clear on the first day of the month
2 = 2nd of month
3 = 3rd day of month…to 31st day
If set to 29…31 the last day of every month stores a record.
0…31
10
Int16
PowerQuality_Log_Mode
This parameter sets the action of the log once it has filled to capacity.
0 = Fill and Stop
1 = Overwrite oldest record
1
0…1
11
Int16
Event_Log_Mode
This parameter sets the action of the log once it has filled to capacity.
0 = Fill and Stop
1 = Overwrite oldest record
1
0…1
12…39
Int16
Reserved
0
0
252
Rockwell Automation Publication 1426-UM001G-EN-P - November 2014
PowerMonitor 5000 Unit Data Tables
Appendix A
Configuration.Metering.Basic
Table 50 - Table Properties
CIP Instance Number
802
PCCC File Number
F11
No. of Elements
33
Length in Words
66
Data Type
Real
Data Access
Read/Write
Table 51 - Configuration.Metering.Basic Data Table
Element Type
Number
Tag Name
Description
Default
Range
0
Real
Metering_Mode
Configures the input wiring for metering.
0 = Demo
1 = Split-phase
2 = Wye
3 = Delta 2 CT
4 = Delta 3 CT
5 = Open Delta 2 CT
6 = Open Delta 3 CT
7 = Delta Gnd B Ph 2 CT
8 = Delta Gnd B Ph 3 CT
9 = Delta High Leg
10 = Single Phase
2
0…10
1
Real
V1_V2_V3_PT_Primary
The primary voltage value of the PT transformer.
480
0…1,000,000
2
Real
V1_V2_V3_PT_Secondary
The secondary voltage value of the PT transformer.
480
0…690
3
Real
I1_I2_I3_CT_Primary
The primary ampere value of the CT transformer.
5
0…1,000,000
4
Real
I1_I2_I3_CT_Secondary
The secondary ampere value of the CT transformer.
5
5
5
Real
VN_PT_Primary
The primary voltage value of the PT transformer.
480
0…1,000,000
6
Real
VN_PT_Secondary
The secondary voltage value of the PT transformer.
480
0…690
7
Real
I4_CT_Primary
The primary ampere value of the CT transformer.
5
0…1,000,000
8
Real
I4_CT_Secondary
The secondary ampere value of the CT transformer.
5
5
9
Real
Nominal_System_LL_Voltage
Nominal line to line voltage value or line to line voltage rating of the system being
metered.
480
0…1,000,000
10
Real
Nominal_System_Frequency
Nominal frequency of the system.
60
50 …60
11
Real
Realtime_Update_Rate
Selects the update rate for the realtime table and the setpoint calculations.
0 = Single cycle averaged over 8 cycles
1 = Single cycle averaged over 4 cycles
2 = 1 cycle with no averaging
0
0…2
12
Real
Demand_Source
When item ‘Demand Broadcast Master Select’ of the Ethernet table is set to master a
selection of 0…2 and 4 sets the type of master input. In this case item 3 is ignored.
When the ‘Demand Broadcast Master Select’ of the Ethernet table is set to slave then
any of these inputs can set the end of the demand period.
0 = Internal Timer
1 = Status Input 2
2 = Controller Command
3 = Ethernet Demand Broadcast
0
0…3
Rockwell Automation Publication 1426-UM001G-EN-P - November 2014
253
Appendix A
PowerMonitor 5000 Unit Data Tables
Table 51 - Configuration.Metering.Basic Data Table
Element Type
Number
Tag Name
Description
Default
Range
13
Real
Demand_Period_Length
(Minutes)
Specifies the desired period for demand calculations. When set to 0 there is no
projected demand calculations. If the internal timer is selected a setting of 0 turns the
demand function off.
15
0…99
14
Real
Number_Demand_Periods
Specifies the number of demand periods to average for demand measurement.
1
1…15
15
Real
Forced_Demand_Sync_Delay
When the power monitor is configured for external demand control the unit delays for
xxx seconds after the expected control pulse has not been received. The demand
period starts over and a record is recorded in the event log.
0 = Wait forever
1…900 = Wait this many seconds before starting a new demand period
Important: This setting becomes active when an external input is used to end the
demand period.
10
0…900
16…32
Real
Reserved
0
0
254
Rockwell Automation Publication 1426-UM001G-EN-P - November 2014
PowerMonitor 5000 Unit Data Tables
Appendix A
Configuration.System.General
Table 52 - Table Properties
CIP Instance Number
803
PCCC File Number
F12
No. of Elements
50
Length in Words
100
Data Type
Real
Data Access
Read/Write
Table 53 - Configuration.System.General Data Table
Element Type
Number
Tag Name
Description
Default
Range
0
Real
Log_Status_Input_Changes
0=Disable recording of status input changes into the event log
1=Enable recording of event input changes into the event log
0
0…1
1
Real
Use_Daylight_Savings_Correction
0 = Disable Daylight Savings
1 = Enable Daylight Savings
0
0…1
2
Real
Daylight_Savings_Month/Week/
Day_Start
This is the day that the power monitor adds an hour to the time. This feature also
looks at Ethernet SNTP offset and corrects for Daylight Savings.
Example: 040107 = April/1st week/Saturday
Month Settings:
01 = January…
12 = December
Week Settings:
01 = 1st week…
05 = Last Week
Day of the Week Settings:
01 = Sunday…
07 = Saturday
030201 March,
2nd, Sunday
010101
…
120507
3
Real
Hour_of_Day_Start
The hour of day the daylight savings adjustment is made to add an hour.
2
0…23
4
Real
Return_from_Daylight_Savings_
Month/Week/Day
This is the day that the power monitor subtracts an hour from the time. This feature
also looks at Ethernet SNTP offset and corrects for the return from Daylight Savings.
Month Settings:
01 = January…
12 = December
Week Settings:
01 = 1st week…
05 = Last Week
Day of the Week Settings:
01 = Sunday…
07 = Saturday
110101
November, 1st,
Sunday
010101
…
120507
5
Real
Hour_of_Day_End
The hour of day the daylight savings adjustment is made to subtract an hour.
2
0…23
6
Real
KYZ_Solid_State_Output_
Parameter
The parameter selected pulses the KYZ output at a rate that equals the parameter
value divided by KYZ scale.
0 = Setpoint Control
1 = Wh Fwd
2 = Wh Rev
3 = VARh Fwd
4 = VARh Rev
5 = VAh
6 = Ah
0
0…6
Rockwell Automation Publication 1426-UM001G-EN-P - November 2014
255
Appendix A
PowerMonitor 5000 Unit Data Tables
Table 53 - Configuration.System.General Data Table
Element Type
Number
Tag Name
Description
Default
Range
7
Real
KYZ_Solid_State_Output_Scale
The KYZ output parameter divided by the scale is the output pulse rate.
Example: Wh is selected for the parameter and 1,000 is the scale value. The output is
pulsed every kWh.
1,000
1…
100,000
8
Real
KYZ_Pulse_Duration_Setting
Set as 50…1000 to indicate the duration of the pulse in milliseconds, or set to 0 for
KYZ-style transition output. (Toggle)
Important: The value for delay is rounded off to the nearest 10 ms internally during
this function.
250 (ms)
0 or 50
…1000
9
Real
Output_Relay_1_Output_
Parameter
The parameter selected pulses the relay 1 output at a rate that equals the parameter
value divided by relay 1 scale.
0 = Setpoint Control
1 = Wh Fwd
2 = Wh Rev
3 = VARh Fwd
4 = VARh Rev
5 = VAh
6 = Ah
0
0…6
10
Real
Output_Relay_1_Output_Scale
The relay 1 output parameter divided by the relay 1 scale is the output pulse rate.
Example: Wh is selected for the parameter and 1,000 is the scale value. The output is
pulsed every kWh.
1,000
1…
100,000
11
Real
Output_Relay_1_Pulse_Duration_ Set as 50…1000 to indicate the duration of the pulse in milliseconds, or set to 0 for
Setting
KYZ-style transition output. (Toggle)
Important: The value for delay is rounded off to the nearest 10 ms internally during
this function.
250 (ms)
0 or 50
…1000
12
Real
Output_Relay_2_Output_
Parameter
The parameter selected pulses the relay 2 output at a rate that equals the parameter
value divided by relay 2 scale.
0 = Setpoint Control
1 = Wh Fwd
2 = Wh Rev
3 = VARh Fwd
4 = VARh Rev
5 = VAh
6 = Ah
0
0…6
13
Real
Output_Relay_2_Output_Scale
The relay 2 output parameter divided by the relay 2 scale is the output pulse rate.
Example: Wh is selected for the parameter and 1,000 is the scale value. The output is
pulsed every kWh.
1,000
1…
100,000
14
Real
Output_Relay_2_Pulse_Duration_ Set as 50…1000 to indicate the duration of the pulse in milliseconds, or set to 0 for
Setting
KYZ-style transition output. (Toggle)
Important: the value for delay is rounded off to the nearest 10 ms internally during
this function.
250 (ms)
0 or 50
…1000
15
Real
Output_Relay_3_Output_Paramet
er
The parameter selected pulses the relay 3 output at a rate that equals the parameter
value divided by relay 3 scale.
0 = Setpoint Control
1 = Wh Fwd
2 = Wh Rev
3 = VARh Fwd
4 = VARh Rev
5 = VAh
6 = Ah
0
0…6
16
Real
Output_Relay_3_Output_Scale
The relay 3 output parameter divided by the relay 3 scale is the output pulse rate.
Example: Wh is selected for the parameter and 1,000 is the scale value. The output is
pulsed every kWh.
1,000
1…
100,000
17
Real
Output_Relay_3_Pulse_Duration_ Set as 50…1000 to indicate the duration of the pulse in milliseconds, or set to 0 for
Setting
KYZ-style transition output. (Toggle)
Important: the value for delay is rounded off to the nearest 10ms internally during
this function.
250 (ms)
0 or 50
…1000
256
Rockwell Automation Publication 1426-UM001G-EN-P - November 2014
PowerMonitor 5000 Unit Data Tables
Appendix A
Table 53 - Configuration.System.General Data Table
Element Type
Number
Tag Name
Description
Default
Range
18
Real
Status_Input_1_Input_Scale
When a status pulse is received the count is increased by the scale factor.
(Input pulse * input scale) added to total status count.
1
1…
1,000,000
19
Real
Status_Input_2_Input_Scale
When a status pulse is received the count is increased by the scale factor.
(Input pulse * input scale) added to total status count.
1
1…
1,000,000
20
Real
Status_Input_3_Input_Scale
When a status pulse is received the count is increased by the scale factor.
(Input pulse * input scale) added to total status count.
1
1…
1,000,000
21
Real
Status_Input_4_Input_Scale
When a status pulse is received the count is increased by the scale factor.
(Input pulse * input scale) added to total status count.
1
1…
1,000,000
22
Real
Unit_Error_Action
This parameter determines the action when a unit error occurs.
0 = Safe Mode on error and make status LED solid red
1 = Perform a firmware reset.
1
0…1
23
Real
Software_Error_Log_Full_Action
This parameter determines the action when a firmware failure is detected and the
error log is full.
0 = Safe Mode on error, make status LED solid red and wait for error collection and
clear log command.
1 = Perform a firmware reset.
1
0…1
24
Real
Default_KYZ_State_On_Comm_
Loss
The Default output state on communication loss defines the behavior of the output if
the power monitor experiences a loss of communication.
0 = Last state/resume
1 = Last state/freeze
2 = De-energize/resume
3 = De-energize/freeze
4 = Local control
0
0…4
25
Real
Default_Relay_1_State_On_
Comm_Loss
The Default output state on communication loss defines the behavior of the output if
the power monitor experiences a loss of communication.
0 = Last state/resume
1 = Last state/freeze
2 = De-energize/resume
3 = De-energize/freeze
4 = Local control
0
0…4
26
Real
Default_Relay_2_State_On_
Comm_Loss
The Default output state on communication loss defines the behavior of the output if
the power monitor experiences a loss of communication.
0 = Last state/resume
1 = Last state/freeze
2 = De-energize/resume
3 = De-energize/freeze
4 = Local control
0
0…4
27
Real
Default_Relay_3_State_On_
Comm_Loss
The Default output state on communication loss defines the behavior of the output if
the power monitor experiences a loss of communication.
0 = Last state/resume
1 = Last state/freeze
2 = De-energize/resume
3 = De-energize/freeze
4 = Local control
0
0…4
28…49
Real
Reserved
Future Use
0
0
Rockwell Automation Publication 1426-UM001G-EN-P - November 2014
257
Appendix A
PowerMonitor 5000 Unit Data Tables
Configuration.Communications_Native
Table 54 - Table Properties
CIP Instance Number
804
PCCC File Number
N13
No. of Elements
70
Length in Words
70
Data Type
Int16
Data Access
Read/Write
Table 55 - Configuration.Communications_Native Data Table
Element
Number
Type
Tag Name
Description
Default
Range
0
Int16
IP_Address_Obtain
Selects the IP Address at startup
0 = Static IP
1 = DHCP
1
0…1
1
Int16
IP_Address_A
First Octet of Unit IP Address
192
0…255
2
Int16
IP_Address_B
Second Octet of Unit IP Address
168
0…255
3
Int16
IP_Address_C
Third Octet of Unit IP Address
1
0 …255
4
Int16
IP_Address_D
Fourth Octet of Unit IP Address
100
0…255
5
Int16
Subnet_Mask_A
First Octet of Subnet Mask
255
0…255
6
Int16
Subnet_Mask_B
Second Octet of Subnet Mask
255
0…255
7
Int16
Subnet_Mask_C
Third Octet of Subnet Mask
255
0…255
8
Int16
Subnet_Mask_D
Fourth Octet of Subnet Mask
0
0…255
9
Int16
Gateway_Address_A
First Octet of Gateway Address
192
0…255
10
Int16
Gateway_Address_B
Second Octet of Gateway Address
168
0…255
11
Int16
Gateway_Address_C
Third Octet of Gateway Address
1
0…255
12
Int16
Gateway_Address_D
Fourth Octet of Gateway Address
1
0…255
13
Int16
DNS_Enable
Selects DNS Option 0 = Disable, 1 = Enable
0
0…1
14
Int16
DNS_Server_Address_A
First Octet of DNS Server Address
0
0…255
15
Int16
DNS_Server_Address_B
Second Octet of DNS Server Address
0
0…255
16
Int16
DNS_Server_Address_C
Third Octet of DNS Server Address
0
0…255
17
Int16
DNS_Server_Address_D
Fourth Octet of DNS Server Address
0
0…255
18
Int16
DNS_Server2_Address_A
First Octet of DNS Server Address
0
0 …255
19
Int16
DNS_Server2_Address_B
Second Octet of DNS Server Address
0
0 …255
20
Int16
DNS_Server2_Address_C
Third Octet of DNS Server Address
0
0…255
21
Int16
DNS_Server2_Address_D
Fourth Octet of DNS Server Address
0
0…255
22
Int16
Time_Sync_Source
Selection for Time Sync
0 = Disable
1 = SNTP
2 = PTP_Slave
3 = PTP_Master
2
0…3
258
Rockwell Automation Publication 1426-UM001G-EN-P - November 2014
PowerMonitor 5000 Unit Data Tables
Appendix A
Table 55 - Configuration.Communications_Native Data Table
Element
Number
Type
Tag Name
Description
Default
Range
23
Int16
SNTP_Mode_Select
This selects the operating mode of SNTP
0 = Unicast - The server address is used to point to a unicast server
1 = Anycast Mode - The SNTP address is a broadcast address of an anycast
group
0
0…1
24
Int16
SNTP_Time_Update_Interval
Number of seconds before next update
300
1…32,766
25
Int16
SNTP_Time_Zone
International Time Zone Selection
6
0…32
26
Int16
SNTP_Time_Server_IP_Address_A
First Octet of SNTP Server
0
0…255
27
Int16
SNTP_Time_Server_IP_Address_B
Second Octet of SNTP Server
0
0 …255
28
Int16
SNTP_Time_Server_IP_Address_C
Third Octet of SNTP Server
0
0…255
29
Int16
SNTP_Time_Server_IP_Address_D
Fourth Octet of SNTP Server
0
0…255
30
Int16
Demand_Broadcast_Mode_Select
Demand Ethernet broadcast selection
0 = Slave
1 = Master
Important: Have only one master per demand network.
0
0…1
31
Int16
Demand_Broadcast_Port
The common port for demand broadcast messages.
300
300…400
32
Int16
Auto_Negotiate_Enable
Enables or disables the hardware auto negotiation for the link connection
0 = Disable
1 = Enable
1
0…1
33
Int16
Force_Ethernet_Speed
When Auto Negotiate is disabled this selects the connection speed
0 = 100 MHz
1 = 10 MHz
1
0…1
34
Int16
Force_Ethernet_Duplex
When Auto Negotiate is disabled this selects the connection duplex
0 = Half
1 = Full
1
0 …1
35
Int16
QOS_DSCP_Enable
0 = Disable
1 = Enable
1
0…1
36
Int16
QOS_DSCP_PTP_Event
QOS DSCP PTP Event Setting
59
0… 63
37
Int16
QOS_DSCP_PTP_General
QOS DSCP PTP General Setting
47
0… 63
38
Int16
QOS_DSCP_Urgent
QOS DSCP Urgent Setting
55
0…63
39
Int16
QOS_DSCP_Scheduled
QOS DSCP Scheduled Setting
47
0…63
40
Int16
QOS_DSCP_High
QOS DSCP High Setting
43
0…63
41
Int16
QOS_DSCP_Low
QOS DSCP Low Setting
31
0…63
42
Int16
QOS_DSCP_Explicit
QOS DSCP Explicit Setting
27
0…63
43
Int16
PTP_Priority1
Used in the execution of the best master clock algorithm. Lower value takes
precedence.
128
0…255
44
Int16
PTP_Priority2
Used in the execution of the best master clock algorithm. Lower value takes
precedence.
128
0…255
45
Int16
WSB_Mode
Waveform synchronization broadcast mode
0 = Disable;
1 = Enable;
0
0…1
46
Int16
WSB_Port
UDP port for WSB feature
1001
1001…1009
47…69
Int16
Reserved
0
0
Rockwell Automation Publication 1426-UM001G-EN-P - November 2014
259
Appendix A
PowerMonitor 5000 Unit Data Tables
Configuration.Network.Text
Table 56 - Table Properties
CIP Instance Number
805
PCCC File Number
ST14
No. of Elements
5
Length in Bytes
208
Data Type
String
Data Access
Read/Write
Table 57 - Configuration.Network.Text Data Table
Element
Number
Size (bytes)
Type
Tag Name
Description
Default
Range
0
48
String 48
Ethernet_Domain_Name
Domain Name for DNS
0
0…255
1
64
String 64
Ethernet_Host_Name
Host Name for DNS
0
0…255
2
32
String 32
Device_Name
A name the user can provide this device
0
0…255
3
32
String 32
Device_Location
The location for this device
0
0…255
4
32
String 32
Reserved
Future Use
0
0…255
IMPORTANT
260
ControlLogix and CompactLogix controllers can get and set this data with the
short integer (SINT) data type. Data can be displayed as decimal/ASCII in
RSLogix 5000 software.
Rockwell Automation Publication 1426-UM001G-EN-P - November 2014
PowerMonitor 5000 Unit Data Tables
Appendix A
Configuration.Setpoints_1_5
Table 58 - Table Properties
CIP Instance Number
807
PCCC File Number
F16
No. of Elements
50
Length in Words
100
Data Type
Real
Data Access
Read/Write
Table 59 - Configuration.Setpoints_1_5 Data Table
Element
Number
Type
Tag Name
Description
Default
Range
0
Real
Parameter
Selection 1
Selection of the input parameter from the Setpoint Parameter Selection List.
0
0…105 (M5, M6)
0…230 (M8)
1
Real
Reference Value
1
Used when Evaluation type is 2 = Percent of Reference
0
-10,000,000
…10,000,000
2
Real
Test Condition 1
0 = Disabled
1 = Less Than
2 = Greater Than
3 = Equals
0
0…3
3
Real
Evaluation Type 1 0 = Magnitude
1 = State
2 = Percent of Reference (not supported in the M5 model)
3 = Percent of Sliding Reference (not supported in the M5 model)
0
0…3
4
Real
Threshold 1
The value, percent, or state that triggers the output action.
0
-10,000,000…
10,000,000
5
Real
Hysteresis 1
The value in magnitude or percent of reference at which the output action is deasserted.
Example: A less than condition deasserts at (threshold + hysteresis), a greater than condition
deasserts at (threshold - hysteresis).
0
0…10,000,000
6
Real
Assert Delay
Seconds 1
The amount of time to delay the output action after a setpoint trigger occurs. Minimum equals
realtime update rate setting.
0
0.000…3600
7
Real
Deassert Delay
Seconds 1
The amount of time to delay deassertion after the setpoint trigger releases. Minimum equals
realtime update rate setting.
0
0.000…3600
8
Real
Parameter
Selection 2
Selection of the input parameter from the Setpoint Parameter Selection List.
0
0…105 (M5, M6)
0…230 (M8)
9
Real
Reference Value
2
Used when Evaluation type is 2 = Percent of Reference
0
-10,000,000
…10,000,000
10
Real
Test Condition 2
0 = Disabled
1 = Less Than
2 = Greater Than
3 = Equals
0
0…3
11
Real
Evaluation Type 2 0 = Magnitude
1 = State
2 = Percent of Reference (not supported in the M5 model)
3 = Percent of Sliding Reference (not supported in the M5 model)
0
0…3
12
Real
Threshold 2
0
-10,000,000…
10,000,000
The value, percent, or state that triggers the output action.
Rockwell Automation Publication 1426-UM001G-EN-P - November 2014
261
Appendix A
PowerMonitor 5000 Unit Data Tables
Table 59 - Configuration.Setpoints_1_5 Data Table
Element
Number
Type
Tag Name
Description
Default
Range
13
Real
Hysteresis 2
The value in magnitude or percent of reference at which the output action is deasserted.
Example: A less than condition deasserts at (threshold + hysteresis), a greater than condition
deasserts at (threshold - hysteresis).
0
0…10,000,000
14
Real
Assert Delay
Seconds 2
The amount of time to delay the output action after a setpoint trigger occurs. Minimum equals
realtime update rate setting.
0
0.000…3600
15
Real
Deassert Delay
Seconds 2
The amount of time to delay deassertion after the setpoint trigger releases. Minimum equals
realtime update rate setting.
0
0.000…3600
16
Real
Parameter
Selection 3
Selection of the input parameter from the Setpoint Parameter Selection List.
0
0…105 (M5, M6)
0…230 (M8)
17
Real
Reference Value
3
Used when Evaluation type is 2 = Percent of Reference
0
-10,000,000
…10,000,000
18
Real
Test Condition 3
0 = Disabled
1 = Less Than
2 = Greater Than
3 = Equals
0
0…3
19
Real
Evaluation Type 3 0 = Magnitude
1 = State
2 = Percent of Reference (not supported in the M5 model)
3 = Percent of Sliding Reference (not supported in the M5 model)
0
0…3
20
Real
Threshold 3
The value, percent, or state that triggers the output action.
0
-10,000,000…
10,000,000
21
Real
Hysteresis 3
The value in magnitude or percent of reference at which the output action is deasserted.
Example: A less than condition deasserts at (threshold + hysteresis), a greater than condition
deasserts at (threshold - hysteresis).
0
0…10,000,000
22
Real
Assert Delay
Seconds 3
The amount of time to delay the output action after a setpoint trigger occurs. Minimum equals
realtime update rate setting.
0
0.000…3600
23
Real
Deassert Delay
Seconds 3
The amount of time to delay deassertion after the setpoint trigger releases. Minimum equals
realtime update rate setting.
0
0.000…3600
24
Real
Parameter
Selection 4
Selection of the input parameter from the Setpoint Parameter Selection List.
0
0…105 (M5, M6)
0…230 (M8)
25
Real
Reference Value
4
Used when Evaluation type is 2 = Percent of Reference
0
-10,000,000
…10,000,000
26
Real
Test Condition 4
0 = Disabled
1 = Less Than
2 = Greater Than
3 = Equals
0
0…3
27
Real
Evaluation Type 4 0 = Magnitude
1 = State
2 = Percent of Reference (not supported in the M5 model)
3 = Percent of Sliding Reference (not supported in the M5 model)
0
0…3
28
Real
Threshold 4
The value, percent, or state that triggers the output action.
0
-10,000,000…
10,000,000
29
Real
Hysteresis 4
The value in magnitude or percent of reference at which the output action is deasserted.
Example: A less than condition deasserts at (threshold + hysteresis), a greater than condition
deasserts at (threshold - hysteresis).
0
0…10,000,000
30
Real
Assert Delay
Seconds 4
The amount of time to delay the output action after a setpoint trigger occurs. Minimum equals
realtime update rate setting.
0
0.000…3600
31
Real
Deassert Delay
Seconds 4
The amount of time to delay deassertion after the setpoint trigger releases. Minimum equals
realtime update rate setting.
0
0.000…3600
262
Rockwell Automation Publication 1426-UM001G-EN-P - November 2014
PowerMonitor 5000 Unit Data Tables
Appendix A
Table 59 - Configuration.Setpoints_1_5 Data Table
Element
Number
Type
Tag Name
Description
Default
Range
32
Real
Parameter
Selection 5
Selection of the input parameter from the Setpoint Parameter Selection List.
0
0…105 (M5, M6)
0…230 (M8)
33
Real
Reference Value
5
Used when Evaluation type is 2 = Percent of Reference
0
-10,000,000
…10,000,000
34
Real
Test Condition 5
0 = Disabled
1 = Less Than
2 = Greater Than
3 = Equals
0
0…3
35
Real
Evaluation Type 5 0 = Magnitude
1 = State
2 = Percent of Reference (not supported in the M5 model)
3 = Percent of Sliding Reference (not supported in the M5 model)
0
0…3
36
Real
Threshold 5
The value, percent, or state that triggers the output action.
0
-10,000,000…
10,000,000
37
Real
Hysteresis 5
The value in magnitude or percent of reference at which the output action is deasserted.
Example: A less than condition deasserts at (threshold + hysteresis), a greater than condition
deasserts at (threshold - hysteresis).
0
0…10,000,000
38
Real
Assert Delay
Seconds 5
The amount of time to delay the output action after a setpoint trigger occurs. Minimum equals
realtime update rate setting.
0
0.000…3600
39
Real
Deassert Delay
Seconds 5
The amount of time to delay deassertion after the setpoint trigger releases. Minimum equals
realtime update rate setting.
0
0.000…3600
40…49
Real
Reserved
Future Use
0
0
Rockwell Automation Publication 1426-UM001G-EN-P - November 2014
263
Appendix A
PowerMonitor 5000 Unit Data Tables
Configuration.Setpoints_6_10
Table 60 - Table Properties
CIP Instance Number
808
PCCC File Number
F17
No. of Elements
50
Length in Words
100
Data Type
Real
Data Access
Read/Write
Table 61 - Configuration.Setpoints_6_10 Data Table
Element Type
Number
Tag Name
Description
Default
Range
0
Real
Parameter
Selection 6
Selection of the input parameter from the Setpoint Parameter Selection List.
0
0…105 (M5, M6)
0…230 (M8)
1
Real
Reference Value
6
Used when Evaluation type is 2 = Percent of Reference
0
-10,000,000
…10,000,000
2
Real
Test Condition 6
0 = Disabled
1 = Less Than
2 = Greater Than
3 = Equals
0
0…3
3
Real
Evaluation Type 6 0 = Magnitude
1 = State
2 = Percent of Reference (not supported in the M5 model)
3 = Percent of Sliding Reference (not supported in the M5 model)
0
0…3
4
Real
Threshold 6
The value, percent or state that triggers the output action.
0
-10,000,000…
10,000,000
5
Real
Hysteresis 6
The value in magnitude or percent of reference at which the output action is deasserted.
Example: A less than condition deasserts at (threshold + hysteresis), a greater than condition
deasserts at (threshold - hysteresis).
0
0…10,000,000
6
Real
Assert Delay
Seconds 6
The amount of time to delay the output action after a setpoint trigger occurs. Minimum equals
realtime update rate setting.
0
0.000…3600
7
Real
Deassert Delay
Seconds 6
The amount of time to delay deassertion after the setpoint trigger releases. Minimum equals
realtime update rate setting.
0
0.000…3600
8
Real
Parameter
Selection 7
Selection of the input parameter from the Setpoint Parameter Selection List.
0
0…105 (M5, M6)
0…230 (M8)
9
Real
Reference Value
7
Used when Evaluation type is 2 = Percent of Reference
0
-10,000,000
…10,000,000
10
Real
Test Condition 7
0 = Disabled
1 = Less Than
2 = Greater Than
3 = Equals
0
0…3
11
Real
Evaluation Type 7 0 = Magnitude
1 = State
2 = Percent of Reference (not supported in the M5 model)
3 = Percent of Sliding Reference (not supported in the M5 model)
0
0…3
12
Real
Threshold 7
0
-10,000,000…
10,000,000
264
The value, percent, or state that triggers the output action.
Rockwell Automation Publication 1426-UM001G-EN-P - November 2014
PowerMonitor 5000 Unit Data Tables
Appendix A
Table 61 - Configuration.Setpoints_6_10 Data Table
Element Type
Number
Tag Name
Description
Default
Range
13
Real
Hysteresis 7
The value in magnitude or percent of reference at which the output action is deasserted.
Example: A less than condition deasserts at (threshold + hysteresis), a greater than condition
deasserts at (threshold - hysteresis).
0
0…10,000,000
14
Real
Assert Delay
Seconds 7
The amount of time to delay the output action after a setpoint trigger occurs. Minimum equals
realtime update rate setting.
0
0.000…3600
15
Real
Deassert Delay
Seconds 7
The amount of time to delay deassertion after the setpoint trigger releases. Minimum equals
realtime update rate setting.
0
0.000…3600
16
Real
Parameter
Selection 8
Selection of the input parameter from the Setpoint Parameter Selection List.
0
0…105 (M5, M6)
0…230 (M8)
17
Real
Reference Value
8
Used when Evaluation type is 2 = Percent of Reference
0
-10,000,000
…10,000,000
18
Real
Test Condition 8
0 = Disabled
1 = Less Than
2 = Greater Than
3 = Equals
0
0…3
19
Real
Evaluation Type 8 0 = Magnitude
1 = State
2 = Percent of Reference (not supported in the M5 model)
3 = Percent of Sliding Reference (not supported in the M5 model)
0
0…3
20
Real
Threshold 8
The value, percent, or state that triggers the output action.
0
-10,000,000…
10,000,000
21
Real
Hysteresis 8
The value in magnitude or percent of reference at which the output action is deasserted.
Example: A less than condition deasserts at (threshold + hysteresis), a greater than condition
deasserts at (threshold - hysteresis).
0
0…10,000,000
22
Real
Assert Delay
Seconds 8
The amount of time to delay the output action after a setpoint trigger occurs. Minimum equals
realtime update rate setting.
0
0.000…3600
23
Real
Deassert Delay
Seconds 8
The amount of time to delay deassertion after the setpoint trigger releases. Minimum equals
realtime update rate setting.
0
0.000…3600
24
Real
Parameter
Selection 9
Selection of the input parameter from the Setpoint Parameter Selection List.
0
0…105 (M5, M6)
0…230 (M8)
25
Real
Reference Value
9
Used when Evaluation type is 2 = Percent of Reference
0
-10,000,000
…10,000,000
26
Real
Test Condition 9
0 = Disabled
1 = Less Than
2 = Greater Than
3 = Equals
0
0…3
27
Real
Evaluation Type 9 0 = Magnitude
1 = State
2 = Percent of Reference (not supported in the M5 model)
3 = Percent of Sliding Reference (not supported in the M5 model)
0
0…3
28
Real
Threshold 9
The value, percent, or state that triggers the output action.
0
-10,000,000…
10,000,000
29
Real
Hysteresis 9
The value in magnitude or percent of reference at which the output action is deasserted.
Example: A less than condition deasserts at (threshold + hysteresis), a greater than condition
deasserts at (threshold - hysteresis).
0
0…10,000,000
30
Real
Assert Delay
Seconds 9
The amount of time to delay the output action after a setpoint trigger occurs. Minimum equals
realtime update rate setting.
0
0.000…3600
31
Real
Deassert Delay
Seconds 9
The amount of time to delay deassertion after the setpoint trigger releases. Minimum equals
realtime update rate setting.
0
0.000…3600
Rockwell Automation Publication 1426-UM001G-EN-P - November 2014
265
Appendix A
PowerMonitor 5000 Unit Data Tables
Table 61 - Configuration.Setpoints_6_10 Data Table
Element Type
Number
Tag Name
Description
Default
Range
32
Real
Parameter
Selection 10
Selection of the input parameter from the Setpoint Parameter Selection List.
0
0…105 (M5, M6)
0…230 (M8)
33
Real
Reference Value
10
Used when Evaluation type is 2 = Percent of Reference
0
-10,000,000
…10,000,000
34
Real
Test Condition 10 0 = Disabled
1 = Less Than
2 = Greater Than
3 = Equals
0
0…3
35
Real
Evaluation Type
10
0 = Magnitude
1 = State
2 = Percent of Reference (not supported in the M5 model)
3 = Percent of Sliding Reference (not supported in the M5 model)
0
0…3
36
Real
Threshold 10
The value, percent, or state that triggers the output action.
0
-10,000,000…
10,000,000
37
Real
Hysteresis 10
The value in magnitude or percent of reference at which the output action is deasserted.
Example: A less than condition deasserts at (threshold + hysteresis), a greater than condition
deasserts at (threshold - hysteresis).
0
0…10,000,000
38
Real
Assert Delay
Seconds 10
The amount of time to delay the output action after a setpoint trigger occurs. Minimum equals
realtime update rate setting.
0
0.000…3600
39
Real
Deassert Delay
Seconds 10
The amount of time to delay deassertion after the setpoint trigger releases. Minimum equals
realtime update rate setting.
0
0.000…3600
40…49
Real
Reserved
Future Use
0
0
266
Rockwell Automation Publication 1426-UM001G-EN-P - November 2014
PowerMonitor 5000 Unit Data Tables
Appendix A
Configuration.Setpoints_11_15 (M6 and M8 model)
Table 62 - Table Properties
CIP Instance Number
809
PCCC File Number
F18
No. of Elements
50
Length in Words
100
Data Type
Real
Data Access
Read/Write
Table 63 - Configuration.Setpoints_11_15 Data Table
Element Type
Number
Tag Name
Description
Default
Range
0
Real
Parameter
Selection 11
Selection of the input parameter from the Setpoint Parameter Selection List.
0
0…105 (M5, M6)
0…230 (M8)
1
Real
Reference Value
11
Used when Evaluation type is 2 = Percent of Reference
0
-10,000,000
…10,000,000
2
Real
Test Condition 11 0 = Disabled
1 = Less Than
2 = Greater Than
3 = Equals
0
0…3
3
Real
Evaluation Type
11
0 = Magnitude
1 = State
2 = Percent of Reference (not supported in the M5 model)
3 = Percent of Sliding Reference (not supported in the M5 model)
0
0…3
4
Real
Threshold 11
The value, percent, or state that triggers the output action.
0
-10,000,000…
10,000,000
5
Real
Hysteresis 11
The value in magnitude or percent of reference at which the output action is deasserted.
Example: A less than condition deasserts at (threshold + hysteresis), a greater than condition
deasserts at (threshold - hysteresis).
0
0…10,000,000
6
Real
Assert Delay
Seconds 11
The amount of time to delay the output action after a setpoint trigger occurs. Minimum equals
realtime update rate setting.
0
0.000…3600
7
Real
Deassert Delay
Seconds 11
The amount of time to delay deassertion after the setpoint trigger releases. Minimum equals
realtime update rate setting.
0
0.000…3600
8
Real
Parameter
Selection 12
Selection of the input parameter from the Setpoint Parameter Selection List.
0
0…105 (M5, M6)
0…230 (M8)
9
Real
Reference Value
12
Used when Evaluation type is 2 = Percent of Reference
0
-10,000,000
…10,000,000
10
Real
Test Condition 12 0 = Disabled
1 = Less Than
2 = Greater Than
3 = Equals
0
0…3
11
Real
Evaluation Type
12
0 = Magnitude
1 = State
2 = Percent of Reference (not supported in the M5 model)
3 = Percent of Sliding Reference (not supported in the M5 model)
0
0…3
12
Real
Threshold 12
The value, percent, or state that triggers the output action.
0
-10,000,000…
10,000,000
Rockwell Automation Publication 1426-UM001G-EN-P - November 2014
267
Appendix A
PowerMonitor 5000 Unit Data Tables
Table 63 - Configuration.Setpoints_11_15 Data Table
Element Type
Number
Tag Name
Description
Default
Range
13
Real
Hysteresis 12
The value in magnitude or percent of reference at which the output action is deasserted.
Example: A less than condition deasserts at (threshold + hysteresis), a greater than condition
deasserts at (threshold - hysteresis).
0
0…10,000,000
14
Real
Assert Delay
Seconds 12
The amount of time to delay the output action after a setpoint trigger occurs. Minimum equals
realtime update rate setting.
0
0.000…3600
15
Real
Deassert Delay
Seconds 12
The amount of time to delay deassertion after the setpoint trigger releases. Minimum equals
realtime update rate setting.
0
0.000…3600
16
Real
Parameter
Selection 13
Selection of the input parameter from the Setpoint Parameter Selection List.
0
0…105 (M5, M6)
0…230 (M8)
17
Real
Reference Value
13
Used when Evaluation type is 2 = Percent of Reference
0
-10,000,000
…10,000,000
18
Real
Test Condition 13 0 = Disabled
1 = Less Than
2 = Greater Than
3 = Equals
0
0…3
19
Real
Evaluation Type
13
0 = Magnitude
1 = State
2 = Percent of Reference (not supported in the M5 model)
3 = Percent of Sliding Reference (not supported in the M5 model)
0
0…3
20
Real
Threshold 13
The value, percent, or state that triggers the output action.
0
-10,000,000…
10,000,000
21
Real
Hysteresis 13
The value in magnitude or percent of reference at which the output action is deasserted.
Example: A less than condition deasserts at (threshold + hysteresis), a greater than condition
deasserts at (threshold - hysteresis).
0
0…10,000,000
22
Real
Assert Delay
Seconds 13
The amount of time to delay the output action after a setpoint trigger occurs. Minimum equals
realtime update rate setting.
0
0.000…3600
23
Real
Deassert Delay
Seconds 13
The amount of time to delay deassertion after the setpoint trigger releases. Minimum equals
realtime update rate setting.
0
0.000…3600
24
Real
Parameter
Selection 14
Selection of the input parameter from the Setpoint Parameter Selection List.
0
0…105 (M5, M6)
0…230 (M8)
25
Real
Reference Value
14
Used when Evaluation type is 2 = Percent of Reference
0
-10,000,000
…10,000,000
26
Real
Test Condition 14 0 = Disabled
1 = Less Than
2 = Greater Than
3 = Equals
0
0…3
27
Real
Evaluation Type
14
0 = Magnitude
1 = State
2 = Percent of Reference (not supported in the M5 model)
3 = Percent of Sliding Reference (not supported in the M5 model)
0
0…3
28
Real
Threshold 14
The value, percent, or state that triggers the output action.
0
-10,000,000…
10,000,000
29
Real
Hysteresis 14
The value in magnitude or percent of reference at which the output action is deasserted.
Example: A less than condition deasserts at (threshold + hysteresis), a greater than condition
deasserts at (threshold - hysteresis).
0
0…10,000,000
30
Real
Assert Delay
Seconds 14
The amount of time to delay the output action after a setpoint trigger occurs. Minimum equals
realtime update rate setting.
0
0.000…3600
31
Real
Deassert Delay
Seconds 14
The amount of time to delay deassertion after the setpoint trigger releases. Minimum equals
realtime update rate setting.
0
0.000…3600
268
Rockwell Automation Publication 1426-UM001G-EN-P - November 2014
PowerMonitor 5000 Unit Data Tables
Appendix A
Table 63 - Configuration.Setpoints_11_15 Data Table
Element Type
Number
Tag Name
Description
Default
Range
32
Real
Parameter
Selection 15
Selection of the input parameter from the Setpoint Parameter Selection List.
0
0…105 (M5, M6)
0…230 (M8)
33
Real
Reference Value
15
Used when Evaluation type is 2 = Percent of Reference
0
-10,000,000
…10,000,000
34
Real
Test Condition 15 0 = Disabled
1 = Less Than
2 = Greater Than
3 = Equals
0
0…3
35
Real
Evaluation Type
15
0 = Magnitude
1 = State
2 = Percent of Reference (not supported in the M5 model)
3 = Percent of Sliding Reference (not supported in the M5 model)
0
0…3
36
Real
Threshold 15
The value, percent, or state that triggers the output action.
0
-10,000,000…
10,000,000
37
Real
Hysteresis 15
The value in magnitude or percent of reference at which the output action is deasserted.
Example: A less than condition deasserts at (threshold + hysteresis), a greater than condition
deasserts at (threshold - hysteresis).
0
0…10,000,000
38
Real
Assert Delay
Seconds 15
The amount of time to delay the output action after a setpoint trigger occurs. Minimum equals
realtime update rate setting.
0
0.000…3600
39
Real
Deassert Delay
Seconds 15
The amount of time to delay deassertion after the setpoint trigger releases. Minimum equals
realtime update rate setting.
0
0.000…3600
40…49
Real
Reserved
Future Use
0
0
Rockwell Automation Publication 1426-UM001G-EN-P - November 2014
269
Appendix A
PowerMonitor 5000 Unit Data Tables
Configuration.Setpoints_16_20 (M6 and M8 model)
Table 64 - Table Properties
CIP Instance Number
810
PCCC File Number
F19
No. of Elements
50
Length in Words
100
Data Type
Real
Data Access
Read/Write
Table 65 - Configuration.Setpoints_16_20 Data Table
Element Type
Number
Tag Name
Description
Default
Range
0
Real
Parameter
Selection 16
Selection of the input parameter from the Setpoint Parameter Selection List.
0
0…105 (M5, M6)
0…230 (M8)
1
Real
Reference Value
16
Used when Evaluation type is 2 = Percent of Reference
0
-10,000,000
…10,000,000
2
Real
Test Condition 16 0 = Disabled
1 = Less Than
2 = Greater Than
3 = Equals
0
0…3
3
Real
Evaluation Type
16
0 = Magnitude
1 = State
2 = Percent of Reference (not supported in the M5 model)
3 = Percent of Sliding Reference (not supported in the M5 model)
0
0…3
4
Real
Threshold 16
The value, percent or state that triggers the output action.
0
-10,000,000…
10,000,000
5
Real
Hysteresis 16
The value in magnitude or percent of reference at which the output action is deasserted.
Example: A less than condition deasserts at (threshold + hysteresis), a greater than condition
deasserts at (threshold - hysteresis).
0
0…10,000,000
6
Real
Assert Delay
Seconds 16
The amount of time to delay the output action after a setpoint trigger occurs. Minimum equals
realtime update rate setting.
0
0.000…3600
7
Real
Deassert Delay
Seconds 16
The amount of time to delay deassertion after the setpoint trigger releases. Minimum equals
realtime update rate setting.
0
0.000…3600
8
Real
Parameter
Selection 17
Selection of the input parameter from the Setpoint Parameter Selection List.
0
0…105 (M5, M6)
0…230 (M8)
9
Real
Reference Value
17
Used when Evaluation type is 2 = Percent of Reference
0
-10,000,000
…10,000,000
10
Real
Test Condition 17 0 = Disabled
1 = Less Than
2 = Greater Than
3 = Equals
0
0…3
11
Real
Evaluation Type
17
0 = Magnitude
1 = State
2 = Percent of Reference (not supported in the M5 model)
3 = Percent of Sliding Reference (not supported in the M5 model)
0
0…3
12
Real
Threshold 17
The value, percent, or state that triggers the output action.
0
-10,000,000…
10,000,000
270
Rockwell Automation Publication 1426-UM001G-EN-P - November 2014
PowerMonitor 5000 Unit Data Tables
Appendix A
Table 65 - Configuration.Setpoints_16_20 Data Table
Element Type
Number
Tag Name
Description
Default
Range
13
Real
Hysteresis 17
The value in magnitude or percent of reference at which the output action is deasserted.
Example: A less than condition deasserts at (threshold + hysteresis), a greater than condition
deasserts at (threshold - hysteresis).
0
0…10,000,000
14
Real
Assert Delay
Seconds 17
The amount of time to delay the output action after a setpoint trigger occurs. Minimum equals
realtime update rate setting.
0
0.000…3600
15
Real
Deassert Delay
Seconds 17
The amount of time to delay deassertion after the setpoint trigger releases. Minimum equals
realtime update rate setting.
0
0.000…3600
16
Real
Parameter
Selection 18
Selection of the input parameter from the Setpoint Parameter Selection List.
0
0…105 (M5, M6)
0…230 (M8)
17
Real
Reference Value
18
Used when Evaluation type is 2 = Percent of Reference
0
-10,000,000
…10,000,000
18
Real
Test Condition 18 0 = Disabled
1 = Less Than
2 = Greater Than
3 = Equals
0
0…3
19
Real
Evaluation Type
18
0 = Magnitude
1 = State
2 = Percent of Reference (not supported in the M5 model)
3 = Percent of Sliding Reference (not supported in the M5 model)
0
0…3
20
Real
Threshold 18
The value, percent, or state that triggers the output action.
0
-10,000,000…
10,000,000
21
Real
Hysteresis 18
The value in magnitude or percent of reference at which the output action is deasserted.
Example: A less than condition deasserts at (threshold + hysteresis), a greater than condition
deasserts at (threshold - hysteresis).
0
0…10,000,000
22
Real
Assert Delay
Seconds 18
The amount of time to delay the output action after a setpoint trigger occurs. Minimum equals
realtime update rate setting.
0
0.000…3600
23
Real
Deassert Delay
Seconds 18
The amount of time to delay deassertion after the setpoint trigger releases. Minimum equals
realtime update rate setting.
0
0.000…3600
24
Real
Parameter
Selection 19
Selection of the input parameter from the Setpoint Parameter Selection List.
0
0…105 (M5, M6)
0…230 (M8)
25
Real
Reference Value
19
Used when Evaluation type is 2 = Percent of Reference
0
-10,000,000
…10,000,000
26
Real
Test Condition 19 0 = Disabled
1 = Less Than
2 = Greater Than
3 = Equals
0
0…3
27
Real
Evaluation Type
19
0 = Magnitude
1 = State
2 = Percent of Reference (not supported in the M5 model)
3 = Percent of Sliding Reference (not supported in the M5 model)
0
0…3
28
Real
Threshold 19
The value, percent, or state that triggers the output action.
0
-10,000,000…
10,000,000
29
Real
Hysteresis 19
The value in magnitude or percent of reference at which the output action is deasserted.
Example: A less than condition deasserts at (threshold + hysteresis), a greater than condition
deasserts at (threshold - hysteresis).
0
0…10,000,000
30
Real
Assert Delay
Seconds 19
The amount of time to delay the output action after a setpoint trigger occurs. Minimum equals
realtime update rate setting.
0
0.000…3600
31
Real
Deassert Delay
Seconds 19
The amount of time to delay deassertion after the setpoint trigger releases. Minimum equals
realtime update rate setting.
0
0.000…3600
Rockwell Automation Publication 1426-UM001G-EN-P - November 2014
271
Appendix A
PowerMonitor 5000 Unit Data Tables
Table 65 - Configuration.Setpoints_16_20 Data Table
Element Type
Number
Tag Name
Description
Default
Range
32
Real
Parameter
Selection 20
Selection of the input parameter from the Setpoint Parameter Selection List.
0
0…105 (M5, M6)
0…230 (M8)
33
Real
Reference Value
20
Used when Evaluation type is 2 = Percent of Reference
0
-10,000,000
…10,000,000
34
Real
Test Condition 20 0 = Disabled
1 = Less Than
2 = Greater Than
3 = Equals
0
0…3
35
Real
Evaluation Type
20
0 = Magnitude
1 = State
2 = Percent of Reference (not supported in the M5 model)
3 = Percent of Sliding Reference (not supported in the M5 model)
0
0…3
36
Real
Threshold 20
The value, percent, or state that triggers the output action.
0
-10,000,000…
10,000,000
37
Real
Hysteresis 20
The value in magnitude or percent of reference at which the output action is deasserted.
Example: A less than condition deasserts at (threshold + hysteresis), a greater than condition
deasserts at (threshold - hysteresis).
0
0…10,000,000
38
Real
Assert Delay
Seconds 20
The amount of time to delay the output action after a setpoint trigger occurs. Minimum equals
realtime update rate setting.
0
0.000…3600
39
Real
Deassert Delay
Seconds 20
The amount of time to delay deassertion after the setpoint trigger releases. Minimum equals
realtime update rate setting.
0
0.000…3600
40…49
Real
Reserved
Future Use
0
0
272
Rockwell Automation Publication 1426-UM001G-EN-P - November 2014
PowerMonitor 5000 Unit Data Tables
Appendix A
Configuration.Setpoint_Logic (M6 and M8 Model)
Table 66 - Table Properties
CIP Instance Number
811
PCCC File Number
N20
No. of Elements
100
Length in Words
100
Data Type
Int16
Data Access
Read/Write
Table 67 - Configuration.Setpoint_Logic Data Table
Element Type
Number
Tag Name
Description
Default
Range
0
Int16
Logic Level 1
Gate 1 Function
Selects the logic type
0 = disabled
1 = AND
2 = NAND
3 = OR
4 = NOR
5 = XOR
6 = XNOR
IMPORTANT: XOR and XNOR use Inputs 1 and 2 only.
0
0…6
1
Int16
L1_G1 Input 1
Selects the first input parameter for the gate. Each gate has four inputs.
0 = Disabled
1 = Setpoint 1
2 = Setpoint 2
3 = Setpoint 3
…
20 = Setpoint 20
IMPORTANT: Negative numbers invert the input.
0
-20…20
2
Int16
L1_G1 Input 2
Selects the second input parameter for the gate. Each gate has four inputs.
0 = Disabled
1 = Setpoint 1
2 = Setpoint 2
3 = Setpoint 3
…
20 = Setpoint 20
IMPORTANT: Negative numbers invert the input.
0
-20…20
3
Int16
L1_G1 Input 3
Selects the third input parameter for the gate. Each gate has four inputs.
0 = Disabled
1 = Setpoint 1
2 = Setpoint 2
3 = Setpoint 3
…
20 = Setpoint 20
IMPORTANT: Negative numbers invert the input.
0
-20…20
4
Int16
L1_G1 Input 4
Selects the fourth input parameter for the gate. Each gate has four inputs.
0 = Disabled
1= Setpoint 1
2 = Setpoint 2
3 = Setpoint 3
…
20 = Setpoint 20 IMPORTANT: Negative numbers invert the input.
0
-20…20
Rockwell Automation Publication 1426-UM001G-EN-P - November 2014
273
Appendix A
PowerMonitor 5000 Unit Data Tables
Table 67 - Configuration.Setpoint_Logic Data Table
Element Type
Number
Tag Name
Description
Default
Range
5
Int16
Logic Level 1
Gate 2 Function
Selects the logic type
0 = disabled
1 = AND
2 = NAND
3 = OR
4 = NOR
5 = XOR
6 = XNOR
IMPORTANT: XOR and XNOR use Inputs 1 and 2 only.
0
0…6
6
Int16
L1_G2 Input 1
Selects the first input parameter for the gate. Each gate has four inputs.
0 = Disabled
1 = Setpoint 1
2 = Setpoint 2
3 = Setpoint 3
…
20 = Setpoint 20
IMPORTANT: Negative numbers invert the input.
0
-20…20
7
Int16
L1_G2 Input 2
Selects the second input parameter for the gate. Each gate has four inputs.
0 = Disabled
1 = Setpoint 1
2 = Setpoint 2
3 = Setpoint 3
…
20 = Setpoint 20
IMPORTANT: Negative numbers invert the input.
0
-20…20
8
Int16
L1_G2 Input 3
Selects the third input parameter for the gate. Each gate has four inputs.
0 = Disabled
1 = Setpoint 1
2 = Setpoint 2
3 = Setpoint 3
…
20 = Setpoint 20
IMPORTANT: Negative numbers invert the input.
0
-20…20
9
Int16
L1_G2 Input 4
Selects the fourth input parameter for the gate. Each gate has four inputs.
0 = Disabled
1 = Setpoint 1
2 = Setpoint 2
3 = Setpoint 3
…
20 = Setpoint 20
IMPORTANT: Negative numbers invert the input.
0
-20…20
10
Int16
Logic Level 1
Gate 3 Function
Selects the logic type
0 = disabled
1 = AND
2 = NAND
3 = OR
4 = NOR
5 = XOR
6 = XNOR
IMPORTANT: XOR and XNOR use Inputs 1 and 2 only.
0
0…6
274
Rockwell Automation Publication 1426-UM001G-EN-P - November 2014
PowerMonitor 5000 Unit Data Tables
Appendix A
Table 67 - Configuration.Setpoint_Logic Data Table
Element Type
Number
Tag Name
Description
Default
Range
11
Int16
L1_G3 Input 1
Selects the first input parameter for the gate. Each gate has four inputs.
0 = Disabled
1 = Setpoint 1
2 = Setpoint 2
3 = Setpoint 3
…
20 = Setpoint 20
IMPORTANT: Negative numbers invert the input.
0
-20…20
12
Int16
L1_G3 Input 2
Selects the second input parameter for the gate. Each gate has four inputs.
0 = Disabled
1 = Setpoint 1
2 = Setpoint 2
3 = Setpoint 3
…
20 = Setpoint 20
IMPORTANT: Negative numbers invert the input.
0
-20…20
13
Int16
L1_G3 Input 3
Selects the third input parameter for the gate. Each gate has four inputs.
0 = Disabled
1 = Setpoint 1
2 = Setpoint 2
3 = Setpoint 3
…
20 = Setpoint 20
IMPORTANT: Negative numbers invert the input.
0
-20…20
14
Int16
L1_G3 Input 4
Selects the fourth input parameter for the gate. Each gate has four inputs.
0 = Disabled
1 = Setpoint 1
2 = Setpoint 2
3 = Setpoint 3
…
20 = Setpoint 20
IMPORTANT: Negative numbers invert the input.
0
-20…20
15
Int16
Logic Level 1
Gate 4 Function
Selects the logic type
0 = disabled,
1 = AND
2 = NAND
3 = OR
4 = NOR
5 = XOR
6 = XNOR
IMPORTANT: XOR and XNOR use Inputs 1 and 2 only.
0
0…6
16
Int16
L1_G4 Input 1
Selects the first input parameter for the gate. Each gate has four inputs.
0 = Disabled
1 = Setpoint 1
2 = Setpoint 2
3 = Setpoint 3
…
20 = Setpoint 20
IMPORTANT: Negative numbers invert the input.
0
-20…20
Rockwell Automation Publication 1426-UM001G-EN-P - November 2014
275
Appendix A
PowerMonitor 5000 Unit Data Tables
Table 67 - Configuration.Setpoint_Logic Data Table
Element Type
Number
Tag Name
Description
Default
Range
17
Int16
L1_G4 Input 2
Selects the second input parameter for the gate. Each gate has four inputs.
0 = Disabled
1 = Setpoint 1
2 = Setpoint 2
3 = Setpoint 3
…
20 = Setpoint 20
IMPORTANT: Negative numbers invert the input.
0
-20…20
18
Int16
L1_G4 Input 3
Selects the third input parameter for the gate. Each gate has four inputs.
0 = Disabled
1 = Setpoint 1
2 = Setpoint 2
3 = Setpoint 3
…
20 = Setpoint 20
IMPORTANT: Negative numbers invert the input.
0
-20…20
19
Int16
L1_G4 Input 4
Selects the fourth input parameter for the gate. Each gate has four inputs.
0 = Disabled
1 = Setpoint 1
2 = Setpoint 2
3 = Setpoint 3
…
20 = Setpoint 20
IMPORTANT: Negative numbers invert the input.
0
-20…20
20
Int16
Logic Level 1
Gate 5 Function
Selects the logic type
0 = disabled
1 = AND
2 = NAND
3 = OR
4 = NOR
5 = XOR
6 = XNOR
IMPORTANT: XOR and XNOR use Inputs 1 and 2 only.
0
0…6
21
Int16
L1_G5 Input 1
Selects the first input parameter for the gate. Each gate has four inputs.
0 = Disabled
1 = Setpoint 1
2 = Setpoint 2
3 = Setpoint 3
…
20 = Setpoint 20
IMPORTANT: Negative numbers invert the input.
0
-20…20
22
Int16
L1_G5 Input 2
Selects the second input parameter for the gate. Each gate has four inputs.
0 = Disabled
1 = Setpoint 1
2 = Setpoint 2
3 = Setpoint 3
…
20 = Setpoint 20
IMPORTANT: Negative numbers invert the input.
0
-20…20
276
Rockwell Automation Publication 1426-UM001G-EN-P - November 2014
PowerMonitor 5000 Unit Data Tables
Appendix A
Table 67 - Configuration.Setpoint_Logic Data Table
Element Type
Number
Tag Name
Description
Default
Range
23
Int16
L1_G5 Input 3
Selects the third input parameter for the gate. Each gate has four inputs.
0 = Disabled
1 = Setpoint 1
2 = Setpoint 2
3 = Setpoint 3
…
20 = Setpoint 20
IMPORTANT: Negative numbers invert the input.
0
-20…20
24
Int16
L1_G5 Input 4
Selects the fourth input parameter for the gate. Each gate has four inputs.
0 = Disabled
1 = Setpoint 1
2 = Setpoint 2
3 = Setpoint 3
…
20 = Setpoint 20
IMPORTANT: Negative numbers invert the input.
0
-20…20
25
Int16
Logic Level 1
Gate 6 Function
Selects the logic type
0 = disabled
1 = AND
2 = NAND
3 = OR
4 = NOR
5 = XOR
6 = XNOR
IMPORTANT: XOR and XNOR use Inputs 1 and 2 only.
0
0…6
26
Int16
L1_G6 Input 1
Selects the first input parameter for the gate. Each gate has four inputs.
0 = Disabled
1 = Setpoint 1
2 = Setpoint 2
3 = Setpoint 3
…
20 = Setpoint 20
IMPORTANT: Negative numbers invert the input.
0
-20…20
27
Int16
L1_G6 Input 2
Selects the second input parameter for the gate. Each gate has four inputs.
0 = Disabled
1 = Setpoint 1
2 = Setpoint 2
3 = Setpoint 3
…
20 = Setpoint 20 IMPORTANT: Negative numbers invert the input.
0
-20…20
28
Int16
L1_G6 Input 3
Selects the third input parameter for the gate. Each gate has four inputs.
0 = Disabled,
1 = Setpoint 1,
2 = Setpoint 2,
3 = Setpoint 3
…
20 = Setpoint 20
IMPORTANT: Negative numbers invert the input.
0
-20…20
Rockwell Automation Publication 1426-UM001G-EN-P - November 2014
277
Appendix A
PowerMonitor 5000 Unit Data Tables
Table 67 - Configuration.Setpoint_Logic Data Table
Element Type
Number
Tag Name
Description
Default
Range
29
Int16
L1_G6 Input 4
Selects the fourth input parameter for the gate. Each gate has four inputs.
0 = Disabled
1 = Setpoint 1
2 = Setpoint 2
3 = Setpoint 3
…
20 = Setpoint 20
IMPORTANT: Negative numbers invert the input.
0
-20…20
30
Int16
Logic Level 1
Gate 7 Function
Selects the logic type
0 = disabled
1 = AND
2 = NAND
3 = OR
4 = NOR
5 = XOR
6 = XNOR
IMPORTANT: XOR and XNOR use Inputs 1 and 2 only.
0
0…6
31
Int16
L1_G7 Input 1
Selects the first input parameter for the gate. Each gate has four inputs.
0 = Disabled
1 = Setpoint 1
2 = Setpoint 2
3 = Setpoint 3
…
20 = Setpoint 20
IMPORTANT: Negative numbers invert the input.
0
-20…20
32
Int16
L1_G7 Input 2
Selects the second input parameter for the gate. Each gate has four inputs.
0 = Disabled
1 = Setpoint 1
2 = Setpoint 2
3 = Setpoint 3
…
20 = Setpoint 20
IMPORTANT: Negative numbers invert the input.
0
-20…20
33
Int16
L1_G7 Input 3
Selects the third input parameter for the gate. Each gate has four inputs.
0 = Disabled
1 = Setpoint 1
2 = Setpoint 2
3 = Setpoint 3
…
20 = Setpoint 20
IMPORTANT: Negative numbers invert the input.
0
-20…20
34
Int16
L1_G7 Input 4
Selects the fourth input parameter for the gate. Each gate has four inputs.
0 = Disabled
1 = Setpoint 1
2 = Setpoint 2
3 = Setpoint 3
…
20 = Setpoint 20
IMPORTANT: Negative numbers invert the input.
0
-20…20
278
Rockwell Automation Publication 1426-UM001G-EN-P - November 2014
PowerMonitor 5000 Unit Data Tables
Appendix A
Table 67 - Configuration.Setpoint_Logic Data Table
Element Type
Number
Tag Name
Description
Default
Range
35
Int16
Logic Level 1
Gate 8 Function
Selects the logic type
0 = disabled
1 = AND
2 = NAND
3 = OR
4 = NOR
5 = XOR
6 = XNOR
IMPORTANT: XOR and XNOR use Inputs 1 and 2 only.
0
0…6
36
Int16
L1_G8 Input 1
Selects the first input parameter for the gate. Each gate has four inputs.
0 = Disabled
1 = Setpoint 1
2 = Setpoint 2
3 = Setpoint 3
…
20 = Setpoint 20
IMPORTANT: Negative numbers invert the input.
0
-20…20
37
Int16
L1_G8 Input 2
Selects the second input parameter for the gate. Each gate has four inputs.
0 = Disabled
1 = Setpoint 1
2 = Setpoint 2
3 = Setpoint 3
…
20 = Setpoint 20
IMPORTANT: Negative numbers invert the input.
0
-20…20
38
Int16
L1_G8 Input 3
Selects the third input parameter for the gate. Each gate has four inputs.
0 = Disabled
1 = Setpoint 1
2 = Setpoint 2
3 = Setpoint 3
…
20 = Setpoint 20
IMPORTANT: Negative numbers invert the input.
0
-20…20
39
Int16
L1_G8 Input 4
Selects the fourth input parameter for the gate. Each gate has four inputs.
0 = Disabled
1 = Setpoint 1
2 = Setpoint 2
3 = Setpoint 3
…
20 = Setpoint 20
IMPORTANT: Negative numbers invert the input.
0
-20…20
40
Int16
Logic Level 1
Gate 9 Function
Selects the logic type
0 = disabled
1 = AND
2 = NAND
3 = OR
4 = NOR
5 = XOR
6 = XNOR
IMPORTANT: XOR and XNOR use Inputs 1 and 2 only.
0
0…6
Rockwell Automation Publication 1426-UM001G-EN-P - November 2014
279
Appendix A
PowerMonitor 5000 Unit Data Tables
Table 67 - Configuration.Setpoint_Logic Data Table
Element Type
Number
Tag Name
Description
Default
Range
41
Int16
L1_G9 Input 1
Selects the first input parameter for the gate. Each gate has four inputs.
0 = Disabled
1 = Setpoint 1
2 = Setpoint 2
3 = Setpoint 3
…
20 = Setpoint 20
IMPORTANT: Negative numbers invert the input.
0
-20…20
42
Int16
L1_G9 Input 2
Selects the second input parameter for the gate. Each gate has four inputs.
0 = Disabled
1 = Setpoint 1
2 = Setpoint 2
3 = Setpoint 3
…
20 = Setpoint 20
IMPORTANT: Negative numbers invert the input.
0
-20…20
43
Int16
L1_G9 Input 3
Selects the third input parameter for the gate. Each gate has four inputs.
0 = Disabled
1 = Setpoint 1
2 = Setpoint 2
3 = Setpoint 3
…
20 = Setpoint 20
IMPORTANT: Negative numbers invert the input.
0
-20…20
44
Int16
L1_G9 Input 4
Selects the fourth input parameter for the gate. Each gate has four inputs.
0 = Disabled
1 = Setpoint 1
2 = Setpoint 2
3 = Setpoint 3
…
20 = Setpoint 20
IMPORTANT: Negative numbers invert the input.
0
-20…20
45
Int16
Logic Level 1
Gate 10 Function
Selects the logic type
0 = disabled
1 = AND
2 = NAND
3 = OR
4 = NOR
5 = XOR
6 = XNOR
IMPORTANT: XOR and XNOR use Inputs 1 and 2 only.
0
0…6
46
Int16
L1_G10 Input 1
Selects the first input parameter for the gate. Each gate has four inputs.
0 = Disabled
1 = Setpoint 1
2 = Setpoint 2
3 = Setpoint 3
…
20 = Setpoint 20 IMPORTANT: Negative numbers invert the input.
0
-20…20
280
Rockwell Automation Publication 1426-UM001G-EN-P - November 2014
PowerMonitor 5000 Unit Data Tables
Appendix A
Table 67 - Configuration.Setpoint_Logic Data Table
Element Type
Number
Tag Name
Description
Default
Range
47
Int16
L1_G10 Input 2
Selects the second input parameter for the gate. Each gate has four inputs.
0 = Disabled
1 = Setpoint 1
2 = Setpoint 2
3 = Setpoint 3
…
20 = Setpoint 20 IMPORTANT: Negative numbers invert the input.
0
-20…20
48
Int16
L1_G10 Input 3
Selects the third input parameter for the gate. Each gate has four inputs.
0 = Disabled
1 = Setpoint 1
2 = Setpoint 2
3 = Setpoint 3
…
20 = Setpoint 20
IMPORTANT: Negative numbers invert the input.
0
-20…20
49
Int16
L1_G10 Input 4
Selects the fourth input parameter for the gate. Each gate has four inputs.
0 = Disabled
1 = Setpoint 1
2 = Setpoint 2
3 = Setpoint 3
…
20 = Setpoint 20
IMPORTANT: Negative numbers invert the input.
0
-20…20
Reserved
Future Use
0
0
50 … 99 Int16
Rockwell Automation Publication 1426-UM001G-EN-P - November 2014
281
Appendix A
PowerMonitor 5000 Unit Data Tables
Configuration.Setpoint_Outputs
Table 68 - Table Properties
CIP Instance Number
812
PCCC File Number
N21
No. of Elements
100
Length in Words
100
Data Type
Int16
Data Access
Read/Write
Table 69 - Configuration.Setpoint_Outputs Data Table
Element
Number
Type
Tag Name
Description
Default
Range
0
Int16
Setpoint Output
1 Input Source
Selects the source for output. Setpoint or gate output state.
0 = No source
1 = Setpoint 1
2 = Setpoint 2…
20 = Setpoint 20
21 = Level1_G1 …
30 = Level1_G10
1
0…10 (M5)
0…30 (M6, M8)
1
Int16
Setpoint Output
1 Action
Selects the output action to perform when setpoint is asserted. See the Setpoint Output Action List. 0
0…19 (M5)
0…30 (M6, M8)
2
Int16
Setpoint Output
2 Input Source
Selects the source for output. Setpoint or gate output state.
0 = No source
1 = Setpoint1
2 = Setpoint 2…
20 = Setpoint 20
21 = Level1_G1 …
30 = Level1_G10
2
0…10 (M5)
0…30 (M6, M8)
3
Int16
Setpoint Output
2 Action
Selects the output action to perform when setpoint is asserted. See the Setpoint Output Action List. 0
0…19 (M5)
0…30 (M6, M8)
4
Int16
Setpoint Output
3 Input Source
Selects the source for output. Setpoint or gate output state.
0 = No source
1 = Setpoint1
2 = Setpoint 2…
20 = Setpoint 20
21 = Level1_G1 …
30 = Level1_G10
3
0…10 (M5)
0…30 (M6, M8)
5
Int16
Setpoint Output
3 Action
Selects the output action to perform when setpoint is asserted. See the Setpoint Output Action List. 0
0…19 (M5)
0…30 (M6, M8)
6
Int16
Setpoint Output
4 Input Source
Selects the source for output. Setpoint or gate output state.
0 = No source
1 = Setpoint1
2 = Setpoint 2…
20 = Setpoint 20
21 = Level1_G1 …
30 = Level1_G10
4
0…10 (M5)
0…30 (M6, M8)
7
Int16
Setpoint Output
4 Action
Selects the output action to perform when setpoint is asserted. See the Setpoint Output Action List. 0
0…19 (M5)
0…30 (M6, M8)
282
Rockwell Automation Publication 1426-UM001G-EN-P - November 2014
PowerMonitor 5000 Unit Data Tables
Appendix A
Table 69 - Configuration.Setpoint_Outputs Data Table
Element
Number
Type
Tag Name
Description
Default
Range
8
Int16
Setpoint Output
5 Input Source
Selects the source for output. Setpoint or gate output state.
0 = No source
1 = Setpoint1
2 = Setpoint 2…
20 = Setpoint 20
21 = Level1_G1 …
30 = Level1_G10
5
0…10 (M5)
0…30 (M6, M8)
9
Int16
Setpoint Output
5 Action
Selects the output action to perform when setpoint is asserted. See the Setpoint Output Action List. 0
0…19 (M5)
0…30 (M6, M8)
10
Int16
Setpoint Output
6 Input Source
Selects the source for output. Setpoint or gate output state.
0 = No source
1 = Setpoint1
2 = Setpoint 2…
20 = Setpoint 20
21 = Level1_G1 …
30 = Level1_G10
6
0…10 (M5)
0…30 (M6, M8)
11
Int16
Setpoint Output
6 Action
Selects the output action to perform when setpoint is asserted. See the Setpoint Output Action List. 0
0…19 (M5)
0…30 (M6, M8)
12
Int16
Setpoint Output
7 Input Source
Selects the source for output. Setpoint or gate output state.
0 = No source
1 = Setpoint1
2 = Setpoint 2…
20 = Setpoint 20
21 = Level1_G1 …
30 = Level1_G10
7
0…10 (M5)
0…30 (M6, M8)
13
Int16
Setpoint Output
7 Action
Selects the output action to perform when setpoint is asserted. See the Setpoint Output Action List. 0
0…19 (M5)
0…30 (M6, M8)
14
Int16
Setpoint Output
8 Input Source
Selects the source for output. Setpoint or gate output state.
0 = No source
1 = Setpoint1
2 = Setpoint 2…
20 = Setpoint 20
21 = Level1_G1 …
30 = Level1_G10
8
0…10 (M5)
0…30 (M6, M8)
15
Int16
Setpoint Output
8 Action
Selects the output action to perform when setpoint is asserted. See the Setpoint Output Action List. 0
0…19 (M5)
0…30 (M6, M8)
16
Int16
Setpoint Output
9 Input Source
Selects the source for output. Setpoint or gate output state.
0 = No source
1 = Setpoint1
2 = Setpoint 2…
20 = Setpoint 20
21 = Level1_G1 …
30 = Level1_G10
9
0…10 (M5)
0…30 (M6, M8)
17
Int16
Setpoint Output
9 Action
Selects the output action to perform when setpoint is asserted. See the Setpoint Output Action List. 0
0…19 (M5)
0…30 (M6, M8)
Rockwell Automation Publication 1426-UM001G-EN-P - November 2014
283
Appendix A
PowerMonitor 5000 Unit Data Tables
Table 69 - Configuration.Setpoint_Outputs Data Table
Element
Number
Type
Tag Name
Description
Default
Range
18
Int16
Setpoint Output
10 Input Source
Selects the source for output. Setpoint or gate output state.
0 = No source
1 = Setpoint1
2 = Setpoint 2…
20 = Setpoint 20
21 = Level1_G1 …
30 = Level1_G10
10
0…10 (M5)
0…30 (M6, M8)
19
Int16
Setpoint Output
10 Action
Selects the output action to perform when setpoint is asserted. See the Setpoint Output Action List. 0
0…19 (M5)
0…30 (M6, M8)
20
Int16
Setpoint Output
11 Input Source
Selects the source for output. Setpoint or gate output state.
0 = No source
1 = Setpoint 1
2 = Setpoint 2…
20 = Setpoint 20
21 = Level1_G1 …
30 = Level1_G10
0…30 (M6, M8)
21
Int16
Setpoint Output
11 Action
Selects the output action to perform when setpoint is asserted. See the Setpoint Output Action List. 0
0…30 (M6, M8)
22
Int16
Setpoint Output
12 Input Source
Selects the source for output. Setpoint or gate output state.
0 = No source
1 = Setpoint 1
2 = Setpoint 2…
20 = Setpoint 20
21 = Level1_G1 …
30 = Level1_G10
0…30 (M6, M8)
23
Int16
Setpoint Output
12 Action
Selects the output action to perform when setpoint is asserted. See the Setpoint Output Action List. 0
0…30 (M6, M8)
24
Int16
Setpoint Output
13 Input Source
Selects the source for output. Setpoint or gate output state.
0 = No source
1 = Setpoint 1
2 = Setpoint 2…
20 = Setpoint 20
21 = Level1_G1 …
30 = Level1_G10
0…30 (M6, M8)
25
Int16
Setpoint Output
13 Action
Selects the output action to perform when setpoint is asserted. See the Setpoint Output Action List. 0
0…30 (M6, M8)
26
Int16
Setpoint Output
14 Input Source
Selects the source for output. Setpoint or gate output state.
0 = No source
1 = Setpoint 1
2 = Setpoint 2…
20 = Setpoint 20
21 = Level1_G1 …
30 = Level1_G10
0…30 (M6, M8)
27
Int16
Setpoint Output
14 Action
Selects the output action to perform when setpoint is asserted. See the Setpoint Output Action List. 0
0…30 (M6, M8)
28
Int16
Setpoint Output
15 Input Source
Selects the source for output. Setpoint or gate output state.
0 = No source
1 = Setpoint 1
2 = Setpoint 2…
20 = Setpoint 20
21 = Level1_G1 …
30 = Level1_G10
0…30 (M6, M8)
284
Rockwell Automation Publication 1426-UM001G-EN-P - November 2014
11
12
13
14
15
PowerMonitor 5000 Unit Data Tables
Appendix A
Table 69 - Configuration.Setpoint_Outputs Data Table
Element
Number
Type
Tag Name
Description
29
Int16
Setpoint Output
15 Action
Selects the output action to perform when setpoint is asserted. See the Setpoint Output Action List. 0
0…30 (M6, M8)
30
Int16
Setpoint Output
16 Input Source
Selects the source for output. Setpoint or gate output state.
0 = No source
1 = Setpoint 1
2 = Setpoint 2…
20 = Setpoint 20
21 = Level1_G1 …
30 = Level1_G10
0…30 (M6, M8)
31
Int16
Setpoint Output
16 Action
Selects the output action to perform when setpoint is asserted. See the Setpoint Output Action List. 0
0…30 (M6, M8)
32
Int16
Setpoint Output
17 Input Source
Selects the source for output. Setpoint or gate output state.
0 = No source
1 = Setpoint 1
2 = Setpoint 2…
20 = Setpoint 20
21 = Level1_G1 …
30 = Level1_G10
0…30 (M6, M8)
33
Int16
Setpoint Output
17 Action
Selects the output action to perform when setpoint is asserted. See the Setpoint Output Action List. 0
0…30 (M6, M8)
34
Int16
Setpoint Output
18 Input Source
Selects the source for output. Setpoint or gate output state.
0 = No source
1 = Setpoint 1
2 = Setpoint 2…
20 = Setpoint 20
21 = Level1_G1 …
30 = Level1_G10
0…30 (M6, M8)
35
Int16
Setpoint Output
18 Action
Selects the output action to perform when setpoint is asserted. See the Setpoint Output Action List. 0
0…30 (M6, M8)
36
Int16
Setpoint Output
19 Input Source
Selects the source for output. Setpoint or gate output state.
0 = No source
1 = Setpoint 1
2 = Setpoint 2…
20 = Setpoint 20
21 = Level1_G1 …
30 = Level1_G10
0…30 (M6, M8)
37
Int16
Setpoint Output
19 Action
Selects the output action to perform when setpoint is asserted. See the Setpoint Output Action List. 0
0…30 (M6, M8)
38
Int16
Setpoint Output
20 Input Source
Selects the source for output. Setpoint or gate output state.
0 = No source
1 = Setpoint 1
2 = Setpoint 2…
20 = Setpoint 20
21 = Level1_G1 …
30 = Level1_G10
0…30 (M6, M8)
39
Int16
Setpoint Output
20 Action
Selects the output action to perform when setpoint is asserted. See the Setpoint Output Action List. 0
0…30 (M6, M8)
40…99
Int16
Reserved
Future Use
0
Rockwell Automation Publication 1426-UM001G-EN-P - November 2014
Default
16
17
18
19
20
0
Range
285
Appendix A
PowerMonitor 5000 Unit Data Tables
Configuration.Data_Log
Table 70 - Table Properties
CIP Instance Number
813
PCCC File Number
N22
No. of Elements
34
Length in Words
34
Data Type
Int16
Data Access
Read/Write
Table 71 - Configuration.Data_Log Data Table
Element Type
Number
Tag Name
(default tag name)
Description
Default
Range
0
Int16
Data_Logging_Interval
Logging Interval in seconds.
0=Disables data logging
-1= synchronize log with demand period
900 (15 min)
-1…3600
1
Int16
Logging Mode
Selects how records are saved.
0= Fill and stop recording when log is full
1= Overwrite when log is full starting with the earliest record.
1
0…1
2
Int16
DataLog_Parameter_1
(Avg_V_N_Volts)
Selection of parameter or default to be logged in the data log.
5
0…88 (M5)
1…184 (M6, M8)
3
Int16
DataLog_Parameter_2
(Avg_VL_VL_Volts)
Selection of parameter or default to be logged in the data log.
9
0…88 (M5)
1…184 (M6, M8)
4
Int16
DataLog_Parameter_3
(Avg_Amps)
Selection of parameter or default to be logged in the data log.
14
0…88 (M5)
1…184 (M6, M8)
5
Int16
DataLog_Parameter_4
(Frequency_Hz)
Selection of parameter or default to be logged in the data log.
15
0…88 (M5)
1…184 (M6, M8)
6
Int16
DataLog_Parameter_5
(Total_kW)
Selection of parameter or default to be logged in the data log.
19
0…88 (M5)
1…184 (M6, M8)
7
Int16
DataLog_Parameter_6
(Total_kVAR)
Selection of parameter or default to be logged in the data log.
23
0…88 (M5)
1…184 (M6, M8)
8
Int16
DataLog_Parameter_7
(Total_kVA)
Selection of parameter or default to be logged in the data log.
27
0…88 (M5)
1…184 (M6, M8)
9
Int16
DataLog_Parameter_8
(Total_PF_Lead_Lag_Indicator)
Selection of parameter or default to be logged in the data log.
39
0…88 (M5)
1…184 (M6, M8)
10
Int16
DataLog_Parameter_9
(Avg_True_PF)
Selection of parameter or default to be logged in the data log.
31
0…88 (M5)
1…184 (M6, M8)
11
Int16
DataLog_Parameter_10
(Avg_Disp_PF)
Selection of parameter or default to be logged in the data log.
35
0…88 (M5)
1…184 (M6, M8)
12
Int16
DataLog_Parameter_11
(Avg_IEEE_THD_V_%)
Selection of parameter or default to be logged in the data log.
54
0…88 (M5)
1…184 (M6, M8)
13
Int16
DataLog_Parameter_12
(Avg_IEEE_THD_V_V_%)
Selection of parameter or default to be logged in the data log.
58
0…88 (M5)
1…184 (M6, M8)
14
Int16
DataLog_Parameter_13
(Avg_IEEE_THD_I_%)
Selection of parameter or default to be logged in the data log.
63
0…88 (M5)
1…184 (M6, M8)
15
Int16
DataLog_Parameter_14
(Avg_IEC_THD_V_%)
Selection of parameter or default to be logged in the data log.
68
0…88 (M5)
1…184 (M6, M8)
286
Rockwell Automation Publication 1426-UM001G-EN-P - November 2014
PowerMonitor 5000 Unit Data Tables
Appendix A
Table 71 - Configuration.Data_Log Data Table
Element Type
Number
Tag Name
(default tag name)
Description
Default
Range
16
Int16
DataLog_Parameter_15
(Avg_IEC_THD_V_V_%)
Selection of parameter or default to be logged in the data log.
72
0…88 (M5)
1…184 (M6, M8)
17
Int16
DataLog_Parameter_16
(Avg_IEC_THD_I_%)
Selection of parameter or default to be logged in the data log.
77
0…88 (M5)
1…184 (M6, M8)
18
Int16
DataLog_Parameter_17
(Voltage_Unbalance_%)
Selection of parameter or default to be logged in the data log.
87
0…88 (M5)
1…184 (M6, M8)
19
Int16
DataLog_Parameter_18
(Current_Unbalance_%)
Selection of parameter or default to be logged in the data log.
88
0…88 (M5)
1…184 (M6, M8)
20
Int16
DataLog_Parameter_19
Selection of parameter or default to be logged in the data log.
0
0…88 (M5)
1…184 (M6, M8)
21
Int16
DataLog_Parameter_20
Selection of parameter or default to be logged in the data log.
0
0…88 (M5)
1…184 (M6, M8)
22
Int16
DataLog_Parameter_21
Selection of parameter or default to be logged in the data log.
0
0…88 (M5)
1…184 (M6, M8)
23
Int16
DataLog_Parameter_22
Selection of parameter or default to be logged in the data log.
0
0…88 (M5)
1…184 (M6, M8)
24
Int16
DataLog_Parameter_23
Selection of parameter or default to be logged in the data log.
0
0…88 (M5)
1…184 (M6, M8)
25
Int16
DataLog_Parameter_24
Selection of parameter or default to be logged in the data log.
0
0…88 (M5)
1…184 (M6, M8)
26
Int16
DataLog_Parameter_25
Selection of parameter or default to be logged in the data log.
0
0…88 (M5)
1…184 (M6, M8)
27
Int16
DataLog_Parameter_26
Selection of parameter or default to be logged in the data log.
0
0…88 (M5)
1…184 (M6, M8)
28
Int16
DataLog_Parameter_27
Selection of parameter or default to be logged in the data log.
0
0…88 (M5)
1…184 (M6, M8)
29
Int16
DataLog_Parameter_28
Selection of parameter or default to be logged in the data log.
0
0…88 (M5)
1…184 (M6, M8)
30
Int16
DataLog_Parameter_29
Selection of parameter or default to be logged in the data log.
0
0…88 (M5)
1…184 (M6, M8)
31
Int16
DataLog_Parameter_30
Selection of parameter or default to be logged in the data log.
0
0…88 (M5)
1…184 (M6, M8)
32
Int16
DataLog_Parameter_31
Selection of parameter or default to be logged in the data log.
0
0…88 (M5)
1…184 (M6, M8)
33
Int16
DataLog_Parameter_32
Selection of parameter or default to be logged in the data log.
0
0…88 (M5)
1…184 (M6, M8)
Rockwell Automation Publication 1426-UM001G-EN-P - November 2014
287
Appendix A
PowerMonitor 5000 Unit Data Tables
Configuration.Log_Read
Table 72 - Table Properties
CIP Instance Number
814
PCCC File Number
N23
No. of Elements
15
Length in Words
15
Data Type
Int16
Data Access
Read/Write
Table 73 - Configuration.Log_Read Data Table
Element
Number
Type
Tag Name
Description
Default
Range
0
Int16
Selected Log
Selects the log that information is returned from. Once a single request has
been made the auto return feature brings back successive records each time the
log is read. Some logs support individual record requests.
1 = Unit Event Log
2 = Min/Max Log
3 = Load Factor Log
4 = Time of Use Log
5 = Setpoint Log
6 = Alarm Log
7 = Data Log File List
8 = Energy Log File List
9 = Snapshot Log File
10 = Power Quality Log
11 = Waveform Log File
12 = Trigger Data File
13 = Trigger Header File
14 = EN50160 Weekly Log
15 = EN50160 Yearly Log
Important: If your catalog number does not support the requested log item,
the power monitor ignores the request. Check the Write Status Table.
Initial value = 0
1…15
1
Int16
Chronology of
The date chronology of the returned records.
Auto Return Data 0 = Reverse direction
1 = Forward direction.
1
0…1
2
Int16
The Min/Max
record to be
returned
Selects the Min/Max record number to be returned. See the table for Min/Max
record list.
0
0….82 (M5,M6)
0….207 (M8)
3
Int16
Load Factor or
TOU record to be
returned.
Selects the Load Factor or TOU record number to be returned.
0 = Use incremental return and the chronology selected.
1…13 selects an individual record.
1 = Current record being calculated.
0
0…13
4
Int16
EN50160 weekly
record to be
returned
Selects the EN50160 weekly record number to be returned.
0 = Use incremental return and the chronology selected.
1…8 selects an individual record.
1 = Current record being calculated.
0
0…8
5
Int16
EN50160 yearly
record to be
returned
Selects the EN50160 yearly record number to be returned.
0 = Use incremental return and the chronology selected.
1…13 selects an individual record.
1 = Current record being calculated.
0
0…13
6…14
Int16
Reserved
Reserved for future use.
0
0
288
Rockwell Automation Publication 1426-UM001G-EN-P - November 2014
PowerMonitor 5000 Unit Data Tables
Appendix A
Configuration.PowerQuality
Table 74 - Table Properties
CIP Instance Number
815
PCCC File Number
F24
No. of Elements
50
Length in Words
100
Data Type
Real
Data Access
Read/Write
Table 75 - Configuration.PowerQuality Data Table
Element Type
Number
Tag Name
Description
Default Range
0
Real
Sag1_Trip_Point_%
The percent of Nominal System Voltage that creates a level 1 sag
condition.
0
0.00…100.00
1
Real
Sag1_Hysteresis_%
The percent of hysteresis for sag 1 condition.
2
0.00…10.00
2
Real
Sag2_Trip_Point_%
The percent of Nominal System Voltage that creates a level 2 sag
condition.
0
0.00…100.00
3
Real
Sag2_Hysteresis_%
The percent of hysteresis for sag 2 condition.
2
0.00…10.00
4
Real
Sag3_Trip_Point_%
The percent of Nominal System Voltage that creates a level 3 sag
condition.
0
0.00…100.00
5
Real
Sag3_Hysteresis_%
The percent of hysteresis for sag 3 condition.
2
0.00…10.00
6
Real
Sag4_Trip_Point_%
The percent of Nominal System Voltage that creates a level 4 sag
condition.
0
0.00…100.00
7
Real
Sag4_Hysteresis_%
The percent of hysteresis for sag 4 condition.
2
0.00…10.00
8
Real
Sag5_Trip_Point_%
The percent of Nominal System Voltage that creates a level 5 sag
condition.
0
0.00…100.00
9
Real
Sag5_Hysteresis_%
The percent of hysteresis for sag 5 condition.
2
0.00…10.00
10
Real
Swell1_Trip_Point_%
The percent of Nominal System Voltage that creates a level 1 swell
condition.
200
100.00…200.00
11
Real
Swell1_Hysteresis_%
The percent of hysteresis for swell 1 condition.
2
0.00…10.00
12
Real
Swell2_Trip_Point_%
The percent of Nominal System Voltage that creates a level 2 swell
condition.
200
100.00…200.00
13
Real
Swell2_Hysteresis_%
The percent of hysteresis for swell 2 condition.
2
0.00…10.00
14
Real
Swell3_Trip_Point_%
The percent of Nominal System Voltage that creates a level 3 swell
condition.
200
100.00…200.00
15
Real
Swell3_Hysteresis_%
The percent of hysteresis for swell 3 condition.
2
0.00…10.00
16
Real
Swell4_Trip_Point_%
The percent of Nominal System Voltage that creates a level 4 swell
condition.
200
100.00…200.00
17
Real
Swell4_Hysteresis_%
The percent of hysteresis for swell 4 condition.
2
0.00…10.00
18
Real
Capture_Pre_Event_Cycles
The pre-event cycles for waveform capture
5
5…10
19
Real
Capture_Post_Event_Cycles
The post-event cycles for waveform capture
15
2…30
20
Real
Relative_Setpoint_Intvl_m
The interval setting in minutes for the rolling average of all relative
setpoints.
60
1…1440
21
Real
IEEE1159_Parameter_Hysteresis_%
The percent of hysteresis for IEEE1159 output parameters.
2
0.00…10.00
22
Real
IEEE1159_Imbalance_Averaging_Intvl_m
The rolling average interval for Imbalance in minutes
15
15…60
Rockwell Automation Publication 1426-UM001G-EN-P - November 2014
289
Appendix A
PowerMonitor 5000 Unit Data Tables
Table 75 - Configuration.PowerQuality Data Table
Element Type
Number
Tag Name
Description
Default Range
23
Real
IEEE1159_Voltage_Imbalance_Limit_%
The percent of voltage Imbalance to create an imbalance event
3
1.00…10.00
24
Real
IEEE1159_Current_Imbalance_Limit_%
The percent of current Imbalance to create an imbalance event
25
1.00…50.00
25
Real
IEEE1159_DCOffset_Harmonic_Avg_Intvl_m
The rolling average interval for DC offset and Harmonics in minutes
5
1…15
26
Real
IEEE1159_Voltage_DCOffset_Limit_%
The percent of DC offset limitation
0.1
0.00…1.00
27
Real
IEEE1159_Voltage_THD_Limit_%
The percent of voltage THD limitation
5
0.00…20.00
28
Real
IEEE1159_Current_THD_Limit_%
The percent of current THD limitation
10
0.00…20.00
29
Real
IEEE1159_PowerFrequency_Avg_Intvl_s
The rolling average interval for power frequency in seconds.
1
1…10
30
Real
IEEE1159_PowerFrequency_Limit_Hz
The limitation on power frequency variation in Hz.
0.1
0.1…0.2
31
Real
IEEE1159_PowerFrequency_Hysteresis_Hz
Hysteresis of power frequency
0.02
0.01…0.05
32
Real
IEEE519_Compliance_Parameter
IEEE 519 Compliance Parameter
0 = Current
1= Voltage
0
0…1
33
Real
IEEE519_MAX_Isc_Amps
Short circuit current available at the point of common coupling.
(PCC) IMPORTANT: When Isc is ‘0’ or IL is ‘0’, the first row in IEEE 519
Current Distortion Limits table is selected for compliance.
0
0.00…1,000,000.0
0
34
Real
IEEE 519 MAX_IL_Amps
Average maximum demand for current for the preceding 12
months. IMPORTANT: When IL is ‘0’ the current THD instead of TDD is
used for compliance.
0
0.00…1,000,000.0
0
35
Real
IEEE1159_Voltage_TID_Limit_%
The percent of Voltage TID limitation
5
0.00…20.00
(M8_Only)
36
Real
IEEE1159_Current_TID_Limit_%
The percent of Current TID limitation
10
0.00…20.00
(M8_Only)
37
Real
IEEE1159_Short_Term_Perceptability_Limit_Pst The Pst limit configuration for Voltage Fluctuations
1
0.2…4.0
(M8_Only)
38
Real
Metering_Snapshot_Parameter_Selection
This option configures what set of parameters is used when the
metering snapshot command is issued:
0 = Single cycle parameters
1 = Harmonics voltage and current HDS and IHDS parameters
2 = 5 Hz harmonic results through the 50th harmonic
0
0…2 (M8_Only)
39
Real
Transient_Detection_Threshold_%
The threshold setting for the percent of transient detection.
0% = disable function
0.1…50% sets the threshold for transient recording.
4
0.0…50.0
(M8_Only)
40
Real
Mains_Signaling_Frequency_Hz
The monitoring frequency of the control signal in Hz
500
5…3000
(M8_Only)
41
Real
Mains_Signaling_Recording_Length
The maximum recording length in seconds.
120
1…120 (M8_Only)
42
Real
Mains_Signaling_Threshold_%
The threshold in percent of signal level to the mains voltage. A
value of 0% disables the mains signal recording.
0
0…15 (M8_Only)
43
Real
Under_Over_Voltage_Deviation_Threshold_%
The percent under voltage or overvoltage of the mains connection
to start recording deviation.
0% disables.
5
0…15 (M8_Only)
44
Real
PowerFrequency_Synchronization
Sets the environment of the metering system.
0 = Synchronous connection to an interconnected system
1 = Not synchronous to an interconnected system. (Islanded).
0
0…1 (M8_Only)
45…49
Real
Reserved
Reserved for future use.
0
0
290
Rockwell Automation Publication 1426-UM001G-EN-P - November 2014
PowerMonitor 5000 Unit Data Tables
Appendix A
Configuration.OptionalComm.DNT
Table 76 - Table Properties
CIP Instance Number
816
PCCC File Number
N25
No. of Elements
30
Length in Words
30
Data Type
Int16
Data Access
Read/Write
Table 77 - Configuration.OptionalComm.DNT Data Table
Element Number
Type
Tag Name
Description
Default
Range
0
Int16
DeviceNet_Address
DeviceNet optional card device address
63
0…63
1
Int16
DeviceNet_Baudrate
DeviceNet optional card communication rate.
0 - 125k
1 - 250k
2 - 500k
3 - AutoBaud
3
0…3
2…29
Int16
Reserved
Future Use
0
0
Rockwell Automation Publication 1426-UM001G-EN-P - November 2014
291
Appendix A
PowerMonitor 5000 Unit Data Tables
Configuration.OptionalComm.CNT
Table 78 - Table Properties (instance and file #s the same as DNT because only 1 can be present)
CIP Instance Number
816
PCCC File Number
N25
No. of Elements
30
Length in Words
30
Data Type
Int16
Data Access
Read/Write
Table 79 - Configuration.OptionalComm.CNT Data Table
Element Number
Type
Tag Name
Description
Default
Range
0
Int16
ControlNet_Address
ControlNet optional card device address. (Valid values 1…99;
Invalid values: 0, 100…255)
255
0…255
1…29
Int16
Reserved
Future Use
0
0
Configuration.DataLogFile
Table 80 - Table Properties
CIP Instance Number
817
PCCC File Number
ST26
No. of Elements
1
Length in Words
32
Data Type
String
Data Access
Write Only
Table 81 - Configuration.DataLogFile Data Table
Element Number
Type
Tag Name
Description
Default
Range
0
String
Data_Log_File_Name
A single entry table for a 64 character Filename entry
0
64 bytes
292
Rockwell Automation Publication 1426-UM001G-EN-P - November 2014
PowerMonitor 5000 Unit Data Tables
Appendix A
Configuration.EnergyLogFile
Table 82 - Table Properties
CIP Instance Number
818
PCCC File Number
ST27
No. of Elements
1
Length in Words
32
Data Type
String
Data Access
Write
Table 83 - Configuration.EnergyLogFile Data Table
Element Number
Type
Tag Name
Description
Default
Range
0
String
Energy_Log_File_
Name
A single entry table for a 64 character Filename entry
0
64 bytes
Configuration.TriggerDataLogFile (M6 and M8 model)
Table 84 - Table Properties
CIP Instance Number
868
PCCC File Number
ST77
No. of Elements
1
Length in Words
32
Data Type
String
Data Access
Write Only
Table 85 - Configuration.TriggerDataLogFile Data Table
Element Type
Number
Tag Name
0
Trigger_Log_File A single entry table for a 64 character Filename entry
String
Description
Rockwell Automation Publication 1426-UM001G-EN-P - November 2014
Default
Range
0
64 bytes
293
Appendix A
PowerMonitor 5000 Unit Data Tables
Configuration.TriggerSetpointInfoFile (M6 and M8 model)
Table 86 - Table Properties
CIP Instance Number
867
PCCC File Number
ST76
No. of Elements
1
Length in Words
32
Data Type
String
Data Access
Write Only
Table 87 - Configuration.TriggerSetpointInfoFile Data Table
Element Type
Number
Tag Name
0
Trigger_Setpoint A single entry table for a 64 character Filename entry
_Log_File
String
Description
Default
Range
0
64 bytes
Configuration.TriggerData_Log (M6 and M8 model)
Table 88 - Table Properties
CIP Instance Number
822
PCCC File Number
N31
No. of Elements
10
Length in Words
10
Data Type
Int16
Data Access
Read/Write
Table 89 - Configuration.TriggerData_Log Data Table
Element Type
Number
Tag Name
Description
Default
Range
0
Int16
Trigger_Mode
Selects how records are saved. 0= Fill and stop recording when log is full. 1= Overwrite
when log is full starting with the earliest record.
1
0…1
1
Int16
TriggerData_Length_s
TriggerData log length from 1s to 10s
1s
1…10s
2
Int16
TriggerData_Parameter_1
Selection of parameter or default to be logged in the trigger data log.
5
1…184
3
Int16
TriggerData_Parameter_2
9
0…184
4
Int16
TriggerData_Parameter_3
14
0…184
5
Int16
TriggerData_Parameter_4
15
0…184
6
Int16
TriggerData_Parameter_5
19
0…184
7
Int16
TriggerData_Parameter_6
23
0…184
8
Int16
TriggerData_Parameter_7
27
0…184
9
Int16
TriggerData_Parameter_8
39
0…184
294
Rockwell Automation Publication 1426-UM001G-EN-P - November 2014
PowerMonitor 5000 Unit Data Tables
Appendix A
Configuration.Harmonics_Optional_Read
Table 90 - Table Properties
CIP Instance Number
819
PCCC File Number
N28
No. of Elements
15
Length in Words
15
Data Type
Int16
Data Access
Write
Table 91 - Configuration.Harmonics_Optional_Read Data Table
Element Number
Type
Tag Name
Description
Default
Range
0
Int16
Channel_Parameter
Selects the channel associated with the data returned in a
subsequent read of Table PowerQuality.Harmonics_Results.
0 = No Selection
1 = V1-N RMS,
2 = V2-N RMS
3 = V3-N,
4 = VN-G RMS
5 = V1-V2 RMS,
6 = V2-V3 RMS
7 = V3-V1 RMS
8 = I1 RMS
9 = I2 RMS
10 = I3 RMS
11 = I4 RMS
12 = L1 kW RMS
13 = L2 kW RMS
14 = L3 kW RMS
15 = L1 kVAR RMS
16 = L2 kVAR RMS
17 = L3 kVAR RMS
18 = L1 kVA RMS
19 = L2 kVA RMS
20 = L3 kVA RMS
21 = Total kW RMS
22 = Total kVAR RMS
23 = Total kVA RMS
24 = V1-N Angle
25 = V2-N Angle
26 = V3-N Angle
27 = VN-G Angle
28 = V1-V2 Angle
29 = V2-V3 Angle
30 = V3-V1 Angle
31 = I1 Angle
32 = I2 Angle
33 = I3 Angle
34 = I4 Angle
0
0…34
1
Int16
Harmonics Order
Range Selection
Selects harmonics order range.
0 = DC…31st
1 = 32nd…63rd
2 = 64th…95th
3 = 96th…127th
0
0…1 (M6)
0…3 (M8)
2…14
Int16
Reserved
Reserved for future use.
0
0
Rockwell Automation Publication 1426-UM001G-EN-P - November 2014
295
Appendix A
PowerMonitor 5000 Unit Data Tables
Configuration.WaveformFileName (M6 and M8 model)
Table 92 - Table Properties
CIP Instance Number
870
PCCC File Number
ST79
No. of Elements
1
Length in Words
32
Data Type
String
Data Access
Write Only
Table 93 - Configuration.WaveformFileName Data Table
Element Type
Number
Tag Name
Description
Default
Range
0
Waveform_File_
Name
A single entry table for a 64 character Filename entry
‘Waveform_ID_YYYYMMDD_HHMMSS_MicroS_hh/cycle/ magorang/channel/iorder’
Where, YYYYMMDD_HHMMS is local date_time; hh is GMT hour;
cycle = current cycle offset returned (range is from 0 to total cycles - 1 in the waveform)
magorang = 0 is mag and 1 is angle
channel = the current channel returned (range is from 0 to 7)
iorder = 0 is DC to 31st, 1 is 32nd to 63rd, 2 is 64th to 95th and 3 is 96th to 127th
if only the file name is written, the retrieval is returned from the start of waveform;
0
64 bytes
String
Security.Username
Table 94 - Table Properties
CIP Instance Number
820
PCCC File Number
ST29
No. of Elements
1
Length in Words
16
Data Type
String
Data Access
Write Only
Table 95 - Security.Username Data Table
Element
Number
Size
Type
Tag Name
Description
Default
Range
0
32
String
Username
A single entry
table for a 32
character
Username entry
0
32 bytes
296
Rockwell Automation Publication 1426-UM001G-EN-P - November 2014
PowerMonitor 5000 Unit Data Tables
Appendix A
Security.Password
Table 96 - Table Properties
CIP Instance Number
821
PCCC File Number
ST30
No. of Elements
1
Length in Words
16
Data Type
String
Data Access
Write Only
Table 97 - Security.Password Data Table
Element
Number
Size
Type
Tag Name
Description
Default
Range
0
32
String
Password
A single entry
table for a 32
character
Username entry
0
32 bytes
Rockwell Automation Publication 1426-UM001G-EN-P - November 2014
297
Appendix A
PowerMonitor 5000 Unit Data Tables
Status.General
Table 98 - Table Properties
CIP Instance Number
823
PCCC File Number
N32
No. of Elements
55
Length in Words
55
Data Type
Int16
Data Access
Read Only
Table 99 - Status.General Data Table
Element
Number
Type
Tag Name
Description
Range
0
Int16
Bulletin_Number
1426
0 or 1426
1
Int16
Device_Class
Describes the product device type.
5 = PM_PowerMonitor 5000
5
2
Int16
Model
Indicates the feature set included in the catalog number.
1 = M5
2 = M6
4 = M8
1, 2, or 4
3
Int16
Communication_Options
Displays the communication hardware options.
0 = NAT (Native Ethernet)
1 = CNT (Optional ControlNet)
3 = DNT (Optional DeviceNet)
0, 1, 3
4
Int16
Nominal_Input_Current
5 = 5 Ampere
5
5
Int16
Metering_Class_Designation
Designation for the metering accuracy.
2 = Class Designation 0.2
2
6
Int16
Series_Letter
The current hardware revision. A…Z.
0…26
7
Int16
Manufacture_Month
Month the Unit was manufactured.
1…12
8
Int16
Manufacture_Day
Day the Unit was manufactured.
1…31
9
Int16
Manufacture_Year
Year the Unit was manufactured.
2010…2100
10
Int16
Overall_System_Status
Reports the overall system status of each system assembly.
0 = Status PASS
Bit 0 = 1: Assembly_Slot_0_inst_1_Error
Bit 1 = 1: Assembly_Slot_0_inst_2_Error
Bit 2 = 1: Assembly_Slot_1_inst_1_Error
Bit 3 = 1: Assembly_Slot_1_inst_2_Error
Bit 4 = 1: Assembly_Slot_2_inst_1_Error
Bit 5 = 1: Assembly_Slot_2_inst_2_Error
Bit 6 = 1: Assembly_Slot_3_inst_1_Error
Bit 7 = 1: Assembly_Slot_3_inst_2_Error
For the detailed error code, please refer to Status_RunTime Table.
0…65,535
11
Int16
Error_Log_Contents
Number of records in the Error Log.
0…65,535
298
Rockwell Automation Publication 1426-UM001G-EN-P - November 2014
PowerMonitor 5000 Unit Data Tables
Appendix A
Table 99 - Status.General Data Table
Element
Number
Type
Tag Name
Description
Range
12
Int16
Metering_Configuration_Locked
The hardware switch for configuration is locked.
0…1
13
Int16
PTP_Status
Indicates PTP status
0 = PTP Listening
1 = PTP Slave
2 = PTP Master
0…2
14…54
Int16
Reserved
Future Use.
0
Rockwell Automation Publication 1426-UM001G-EN-P - November 2014
299
Appendix A
PowerMonitor 5000 Unit Data Tables
Status.Communications
Table 100 - Table Properties
CIP Instance Number
824
PCCC File Number
N33
No. of Elements
61
Length in Words
61
Data Type
Int16
Data Access
Read Only
Table 101 - Status.Communications Data Table
Element
Number
Type
Tag Name
Description
Range
0
Int16
Ethernet_Overall_Status
Ethernet Communication Overall Status
0 = Pass
1…32766 = Fail
0…32,766
bit 0
IP_and_Subnet
Invalid IP Address or Subnet Mask
0 = PASS
1 = FAIL
0 or 1
bit 1
Gateway_Address
Invalid Gateway Address
0 = PASS
1 = FAIL
0 or 1
bit 2
DNS_Server_Address
Invalid DNS server Address
0 = PASS
1 = FAIL
0 or 1
bit 3
DNS_Server2_Address
Invalid DNS server2 Address
0 = PASS
1 = FAIL
0 or 1
bit 4
SNTP_Server_Address
Invalid Timer Server Address
0 = PASS
1 = FAIL
0 or 1
bit 5
DHCP_Server_Timeout_Test
DHCP Server Timeout
0 = PASS
1 = FAIL
0 or 1
bit 6
Duplicate_IP_Address_Test
Duplicate IP Address
0 = PASS
1 = FAIL
0 or 1
bit 7
Time_Server_Timeout_Test
Time Server Timeout
0 = PASS
1 = FAIL
0 or 1
bit 8
DNS_Server_Timeout_Test
DNS Server Timeout
0 = PASS
1 = FAIL
0 or 1
bit 9…15
Reserved
Future Use
0
Int16
Reserved
Future Use
0
1…60
300
Rockwell Automation Publication 1426-UM001G-EN-P - November 2014
PowerMonitor 5000 Unit Data Tables
Appendix A
Status.RunTime
Table 102 - Table Properties
CIP Instance Number
825
PCCC File Number
N34
No. of Elements
74
Length in Words
74
Data Type
Int16
Data Access
Read Only
Table 103 - Status.RunTime Data Table
Element
Number
Type
Tag Name
Description
Range
0
Int16
Assembly_Slot_0_Status_inst_1
Backplane Processor (BF518) Status MPC
0 = Status PASS
0…65,535
Bit0
Nor Flash
BF518 Nor flash read write failure
Bit1
SDRAM Memory
BF518 SDRAM memory failure
Bit2
Ethernet MAC
BF518 Ethernet MAC failure
Bit3
SPORT Interface
BF518 SPORT communication failure
Bit4
ARM9 Heartbeat message Timeout
ARM9 Heartbeat message Timeout
Bit5
Backplane info. message Timeout
Backplane info. message Timeout
Bit6
Create Connection Message Not Received
MPC BF518 did not receive create connection
Bit7
Backplane Connection Status
Backplane connection status
0 = OK
1 = Fail
Bit8
SPORT HandShake Not Received
MPC BF518 did not get ARM9 Handshake Signal
Int16
Assembly_Slot_0_Status_Inst_2
ARM Processor Status MPC
0 = Status PASS
Bit0
Nor Flash
ARM9 Nor flash read write failure
Bit1
Nand Flash
ARM9 Nand flash read write failure
Bit2
SDRAM Memory
ARM9 SDRAM memory failure
Bit3
FRAM Memory
ARM9 EEPROM storage failure
Bit4
Synchronous Serial Controller (SSC)
ARM9 serial intercommunication failure
Bit5
Real Time Clock
ARM9 Real time clock failure
Bit6
Ethernet MAC
ARM9 Arm9 Ethernet MAC failure
Bit7
Anybus Interface
ARM9 HMS Anybus interface failure
Bit8
SPI Serial Interface
ARM9 SPI Intercommunications failure
Bit9
USB Memory Stick Failure
ARM9 USB Memory Stick read write failure
Bit10
MPC BF518 Heartbeat message Timeout
MPC BF518 Heartbeat message Timeout
Bit11
Create Connection Message Not Send
ARM9 did not send create connection to MPC BF518
Bit12
SPORT HandShake Not Received
ARM9 did not get MPC BF518 Handshake Signal
Bit13
No Production Test Data
Production test data not programmed or corrupted
1
Rockwell Automation Publication 1426-UM001G-EN-P - November 2014
0…65,535
301
Appendix A
PowerMonitor 5000 Unit Data Tables
Table 103 - Status.RunTime Data Table
Element
Number
Type
Tag Name
Description
Range
2
Int16
Assembly_Slot_1_Status_Inst1
Backplane Processor(BF518) of Assembly in slot 1 Status 0 =
Status PASS
0…65,535
Bit0
NOR Flash
BF518 Nor flash read write failure
Bit1
SDRAM Memory
BF518 SDRAM memory failure
Bit2
Ethernet MAC
BF518 Ethernet MAC failure
Bit3
SPORT Communication
BF518 SPORT communication failure
Bit4
Sharc Heartbeat message Timeout
Sharc Heartbeat message Timeout
Bit5
Backplane info. message Timeout
Backplane info. message Timeout
Bit6
ForwardOpen Message Not Received
PDA BF518 did not receive forward open message
Bit7
Real Time Data Not Received
PDA BF518 did not receive SHARC message
Int16
Assembly_Slot_1_Status_Inst2
Host Processor(Sharc) of Assembly in slot 1 Status
0 = Status PASS
Bit0
SDRAM Memory
Sharc SDRAM Memory failure
Bit1
AD7606
AD7606 failure
Bit2
SPORT Communication
Sharc SPORT communication failure
Bit3
MAN_CODE
Bit4
DEV_CODE
Bit5
NORFLASH
Sharc Nor flash read write failure
Bit6
RESET
Sharc Reset failure
4
Int16
Assembly_Slot_2_Status_Inst1
Backplane Processor of Assembly in slot 2 Status
0 = Status PASS
0…65,535
5
Int16
Assembly_Slot_2_Status_Inst2
Host Processor of Assembly in slot 2 Status
0 = Status PASS
0…65,535
6
Int16
Assembly_Slot_3_Status_Inst1
Backplane Processor of Assembly in slot 3 Status
0 = Status PASS
0…65,535
7
Int16
Assembly_Slot_3_Status_Inst2
Host Processor of Assembly in slot 3 Status
0 = Status PASS
0…65,535
8
Int16
Bootloader_FRN_Slot_0_Inst_1
MPC BF518 bootloader image revision number
0…65,535
9
Int16
Application_FRN_Slot_0_Inst_1
MPC BF518 application image revision number, if the system is
running the boot loader image because of application image
checksum error, this number is zero
0…65,535
10
Int16
Upgrader_FRN_Slot_0_Inst_1
MPC BF518 boot kernel image revision number
0…65,535
11
Int16
Bootloader_FRN_Slot_0_Inst_2
ARM9 boot level 0 image revision number
0…65,535
12
Int16
Application_FRN_Slot_0_Inst_2
ARM9 application image revision number
0…65,535
13
Int16
Upgrader_FRN_Slot_0_Inst_2
ARM9 boot level 1 image revision number
0…65,535
14
Int16
Bootloader_FRN_Slot_1_Inst_1
PDA BF518 bootloader image revision number
0…65,535
15
Int16
Application_FRN_Slot_1_Inst_1
PDA BF518 application image revision number, if the system is
running the boot loader image because of application image
checksum error, this number is zero
0…65,535
16
Int16
Upgrader_FRN_Slot_1_Inst_1
PDA BF518 boot kernel image revision number
0…65,535
17
Int16
Bootloader_FRN_Slot_1_Inst_2
SHARC boot loader image revision number
0…65,535
18
Int16
Application_FRN_Slot_1_Inst_2
SHARC application image revision number
0…65,535
3
302
Rockwell Automation Publication 1426-UM001G-EN-P - November 2014
0…65,535
PowerMonitor 5000 Unit Data Tables
Appendix A
Table 103 - Status.RunTime Data Table
Element
Number
Type
Tag Name
Description
Range
19
Int16
Upgrader_FRN_Slot_1_Inst_2
SHARC upgrader image revision number
0…65,535
20
Int16
Bootloader_FRN_Slot_2_Inst_1
Current revision level for the slot and instance of processor
0…65,535
21
Int16
Application_FRN_Slot_2_Inst_1
Current revision level for the slot and instance of processor
0…65,535
22
Int16
Upgrader_FRN_Slot_2_Inst_1
Current revision level for the slot and instance of processor
0…65,535
23
Int16
Bootloader_FRN_Slot_2_Inst_2
Current revision level for the slot and instance of processor
0…65,535
24
Int16
Application_FRN_Slot_2_Inst_2
Current revision level for the slot and instance of processor
0…65,535
25
Int16
Upgrader_FRN_Slot_2_Inst_2
Current revision level for the slot and instance of processor
0…65,535
26
Int16
Bootloader_FRN_Slot_3_Inst_1
Current revision level for the slot and instance of processor
0…65,535
27
Int16
Application_FRN_Slot_3_Inst_1
Current revision level for the slot and instance of processor
0…65,535
28
Int16
Upgrader_FRN_Slot_3_Inst_1
Current revision level for the slot and instance of processor
0…65,535
29
Int16
Bootloader_FRN_Slot_3_Inst_2
Current revision level for the slot and instance of processor
0…65,535
30
Int16
Application_FRN_Slot_3_Inst_2
Current revision level for the slot and instance of processor
0…65,535
31
Int16
Upgrader_FRN_Slot_3_Inst_2
Current revision level for the slot and instance of processor
0…65,535
32…73
Int16
Reserved
Future Use.
0
Rockwell Automation Publication 1426-UM001G-EN-P - November 2014
303
Appendix A
PowerMonitor 5000 Unit Data Tables
Status.DiscreteIO
Table 104 - Table Properties
CIP Instance Number
826
PCCC File Number
N35
No. of Elements
112
Length in Words
112
Data Type
Int16
Data Access
Read Only
Table 105 - Status.DiscreteIO Data Table
Element
Number
Type
Tag Name
Description
Range
0
Int16
Status_Input_States
Indicates the overall Status Input Condition
65,535
Bit 0
Status_Input_1_Actuated
Indicates Status 1 actuated
0 or 1
Bit 1
Status_Input_2_Actuated
Indicates Status 2 actuated
0 or 1
Bit 2
Status_Input_3_Actuated
Indicates Status 3 actuated
0 or 1
Bit 3
Status_Input_4_Actuated
Indicates Status 4 actuated
0 or 1
Bit 4
KYZ _Output_Energized
Indicates Output KYZ Energized
0 or 1
Bit 5
KYZ_Forced_On
Software Control Forced On KYZ
0 or 1
Bit 6
KYZ_Forced_Off
Software Control Forced Off KYZ
0 or 1
Bit 7
Relay_1_Output_Energized
Indicates Output Relay 1 Energized
0 or 1
Bit 8
Relay_1_Forced_On
Software Control Forced On Relay 1
0 or 1
Bit 9
Relay_1_Forced_Off
Software Control Forced Off Relay 1
0 or 1
Bit 10
Relay_2_Output_Energized
Indicates Output Relay 2 Energized
0 or 1
Bit 11
Relay_2_Forced_On
Software Control Forced On Relay 2
0 or 1
Bit 12
Relay_2_Forced_Off
Software Control Forced Off Relay 2
0 or 1
Bit 13
Relay_3_Output_Energized
Indicates Output Relay 3 Energized
0 or 1
Bit 14
Relay_3_Forced_On
Software Control Forced On Relay 3
0 or 1
Bit 15
Relay_3_Forced_Off
Software Control Forced Off Relay 3
0 or 1
Int16
Reserved
Future Use
0
1…111
304
Rockwell Automation Publication 1426-UM001G-EN-P - November 2014
PowerMonitor 5000 Unit Data Tables
Appendix A
Status.Wiring_Diagnostics
Table 106 - Table Properties
CIP Instance Number
829
PCCC File Number
F38
No. of Elements
33
Length in Words
66
Data Type
Real
Data Access
Read Only
Table 107 - Status.Wiring_Diagnostics Data Table
Element
Number
Type
Tag Name
Description
Range
0
Real
Command_Status
This is the wiring diagnostics command status.
0 = Command Active
1 = Input Level Low
2 = Disabled
3 = Waiting Command
0…3
1
Real
Voltage_Input_Missing
Reports on all three phases.
-1 = Test not run
0 = Test passed
1 = Phase 1 missing
2 = Phase 2 missing
3 = Phase 3 missing
12 = Phase 1 and 2 missing
13 = Phase 1 and 3 missing
23 = Phase 2 and 3 missing
123 = All phases missing
-1…123
2
Real
Current_Input_Missing
Reports on all three phases.
-1 = Test not run
0 = Test passed
1 = Phase 1 missing
2 = Phase 2 missing
3 = Phase 3 missing
12 = Phase 1 and 2 missing
13 = Phase 1 and 3 missing
23 = Phase 2 and 3 missing
123 = All phases missing
-1…123
3
Real
Range1_L97_C89_Status
This is the pass fail status for Range 1 diagnostics.
0 = Pass
1 = Failed
0 or 1
4
Real
Range1_Voltage_Input_Inverted
Reports on all three phases.
-1 = Test not run
0 = Test passed
1 = Phase 1 inverted
2 = Phase 2 inverted
3 = Phase 3 inverted
12 = Phase 1 and 2 inverted
13 = Phase 1 and 3 inverted
23 = Phase 2 and 3 inverted
123 = All phases inverted
-1…123
Rockwell Automation Publication 1426-UM001G-EN-P - November 2014
305
Appendix A
PowerMonitor 5000 Unit Data Tables
Table 107 - Status.Wiring_Diagnostics Data Table
Element
Number
Type
Tag Name
Description
Range
5
Real
Range1_Current_Input_Inverted
Reports on all three phases.
-1 = Test not run
0 = Test passed
1 = Phase 1 inverted
2 = Phase 2 inverted
3 = Phase 3 inverted
12 = Phase 1 and 2 inverted
13 = Phase 1 and 3 inverted
23 = Phase 2 and 3 inverted
123 = All phases inverted
-1…123
6
Real
Range1_Voltage_Rotation
Reports on all three phases. The reported sequence represents each phase.
1…321 designating phase and rotation.
Example: 123 = Phase 1 then phase 2 then phase 3
-1 = Test not run
4 = Invalid Rotation
5 = Out of range
-1…132
7
Real
Range1_Current_Rotation
Reports on all three phases. The reported sequence represents each phase.
1…321 designating phase and rotation.
Example: 123 = Phase 1 then phase 2 then phase 3
-1 = Test not run
4 = Invalid Rotation
5 = Out of range
-1…321
8
Real
Range2_L85_C98_Status
This is the pass fail status for Range 2 diagnostics.
0 = Pass
1 = Failed
0 or 1
9
Real
Range2_Voltage_Input_Inverted
Reports on all three phases.
-1 = Test not run
0 = Test passed
1 = Phase 1 inverted
2 = Phase 2 inverted
3 = Phase 3 inverted
12 = Phase 1 and 2 inverted
13 = Phase 1 and 3 inverted
23 = Phase 2 and 3 inverted
123 = All phases inverted
-1…123
10
Real
Range2_Current_Input_Inverted
Reports on all three phases.
-1 = Test not run
0 = Test passed
1 = Phase 1 inverted
2 = Phase 2 inverted
3 = Phase 3 inverted
12 = Phase 1 and 2 inverted
13 = Phase 1 and 3 inverted
23 = Phase 2 and 3 inverted
123 = All phases inverted
-1…123
11
Real
Range2_Voltage_Rotation
Reports on all three phases. The reported sequence represents each phase.
1…321 designating phase and rotation.
Example: 123 = Phase 1 then phase 2 then phase 3
-1 = Test not run
4 = Invalid Rotation
5 = Out of range
-1…132
306
Rockwell Automation Publication 1426-UM001G-EN-P - November 2014
PowerMonitor 5000 Unit Data Tables
Appendix A
Table 107 - Status.Wiring_Diagnostics Data Table
Element
Number
Type
Tag Name
Description
Range
12
Real
Range2_Current_Rotation
Reports on all three phases. The reported sequence represents each phase.
1…321 designating phase and rotation.
Example: 123 = Phase 1 then phase 2 then phase 3
-1 = Test not run
4 = Invalid Rotation
5 = Out of range
-1…321
13
Real
Range3_L52_L95_Status
This is the pass fail status for Range 3 diagnostics.
0 = Pass
1 = Failed
0 or 1
14
Real
Range3_Voltage_Input_Inverted
Reports on all three phases.
-1 = Test not run
0 = Test passed
1 = Phase 1 inverted
2 = Phase 2 inverted
3 = Phase 3 inverted
12 = Phase 1 and 2 inverted
13 = Phase 1 and 3 inverted
23 = Phase 2 and 3 inverted
123 = All phases inverted
-1…123
15
Real
Range3_Current_Input_Inverted
Reports on all three phases.
-1 = Test not run
0 = Test passed
1 = Phase 1 inverted
2 = Phase 2 inverted
3 = Phase 3 inverted
12 = Phase 1 and 2 inverted
13 = Phase 1 and 3 inverted
23 = Phase 2 and 3 inverted
123 = All phases inverted
-1…123
16
Real
Range3_Voltage_Rotation
Reports on all three phases. The reported sequence represents each phase.
1…321 designating phase and rotation.
Example: 123 = Phase 1 then phase 2 then phase 3
-1 = Test not run
4 = Invalid Rotation
5 = Out of range
-1…132
17
Real
Range3_Current_Rotation
Reports on all three phases. The reported sequence represents each phase.
1…321 designating phase and rotation.
Example: 123 = Phase 1 then phase 2 then phase 3
-1 = Test not run
4 = Invalid Rotation
5 = Out of range
-1…321
18
Real
Voltage_Phase_1_Angle
Shows the present phase angle of this channel. Always 0 degrees for voltage phase 1.
0…359.99
19
Real
Voltage_Phase_1_Magnitude
Shows the present magnitude of this phase.
0…9,999,999
20
Real
Voltage_Phase_2_Angle
Shows the present phase angle of this channel.
0…359.99
21
Real
Voltage_Phase_2_Magnitude
Shows the present magnitude of this phase.
0 …9,999,999
22
Real
Voltage_Phase_3_Angle
Shows the present phase angle of this channel.
0…359.99
23
Real
Voltage_Phase_3_Magnitude
Shows the present magnitude of this phase.
0…9,999,999
24
Real
Current_Phase_1_Angle
Shows the present phase angle of this channel.
0…359.99
25
Real
Current_Phase_1_Magnitude
Shows the present magnitude of this phase.
0…9,999,999
26
Real
Current_Phase_2_Angle
Shows the present phase angle of this channel.
0…359.99
Rockwell Automation Publication 1426-UM001G-EN-P - November 2014
307
Appendix A
PowerMonitor 5000 Unit Data Tables
Table 107 - Status.Wiring_Diagnostics Data Table
Element
Number
Type
Tag Name
Description
Range
27
Real
Current_Phase_2_Magnitude
Shows the present magnitude of this phase.
0…9,999,999
28
Real
Current_Phase_3_Angle
Shows the present phase angle of this channel.
0…359.99
29
Real
Current_Phase_3_Magnitude
Shows the present magnitude of this phase.
0…9,999,999
30…32
Real
Reserved
Reserved for future use.
0
Status.TableWrite
Table 108 - Table Properties
CIP Instance Number
830
PCCC File Number
N39
No. of Elements
13
Length in Words
13
Data Type
Int16
Data Access
Read Only
Table 109 - Status.TableWrite Data Table
Element
Number
Type
Tag Name
Description
Range
0
Int16
Table_Number_or_Instance
Indicates the last table that was written.
0…1136
1
Int16
Offending_Element
If the most recent write was successful this returns a ( -1).
If the write was unsuccessful this is the first rejected
element in the table write.
-1…256
2
Int16
Configuration_Lock_On
If a write was made to a table that has elements that are
locked this value is 1.
0 or 1
3
Int16
Password_is_not_validated
A write to a table could not be performed because the
password is not validated or active.
0 or 1
4
Int16
Password_Activated
The password is active by user.
Bit 0 set: AdminType Activated
Bit 1 set: ApplicationType Activated
Bit 2 set: UserType Activated
0…7
5
Int16
Admin_Name_Or_Password_Rejected
Admin type account rejected.
0 or 1
6
Int16
Admin_Password_Active
Admin type account active.
0 or 1
7
Int16
Application_Name_Or_Password_Rejected
Application type account rejected.
0 or 1
8
Int16
Application_Password_Active
Application type account active.
0 or 1
9
Int16
UserType_Name_Or_Password_Rejected
User type account rejected.
0 or 1
10
Int16
User_Password_Active
User type account active.
0 or 1
11
Int16
Security Status
0 = disabled
1 = enabled
0 or 1
12
Int16
Exclusive Ownership Conflict
Bit 0 = 0: No Exclusive ownership conflict
Bit 0 = 1: Exclusive ownership conflict, IO configuration
only controlled by logix controller
Bit 1: File deletion conflict
0…3
308
Rockwell Automation Publication 1426-UM001G-EN-P - November 2014
PowerMonitor 5000 Unit Data Tables
Appendix A
Status.InformationTable
Table 110 - Table Properties
CIP Instance Number
831
PCCC File Number
ST40
No. of Elements
10
Length in Words
112
Data Type
String
Data Access
Read Only
Table 111 - Status.InformationTable Data Table
Element
Number
Size Bytes
Type
Tag Name
Description
Range
0
20
String
Catalog Number
The unit catalog number example.
0…255
1
20
String
Serial Number
The serial number for warranty information.
0…255
2
32
String
Device Name
A name the user can provide this device.
0…255
3
32
String
Device Location
The location for this device.
0…255
4
20
String
Original_Catalog_Number The unit catalog number in production
0…255
5…9
20
String
Reserved
0
Reserved for future use
Rockwell Automation Publication 1426-UM001G-EN-P - November 2014
309
Appendix A
PowerMonitor 5000 Unit Data Tables
Status.Alarms
Table 112 - Table Properties
CIP Instance Number
832
PCCC File Number
N41
No. of Elements
32
Length in Words
32
Data Type
Int16
Data Access
Read Only
Table 113 - Status.Alarms Data Table
Element
Number
Type
Tag Name
Description
Range
0
Int16
Setpoints_1_10_Active
Actuation Status of Setpoints 1…10
0…65,535
Bit 0
Setpoint1_Active
1 Indicates the setpoint 1 is Active
0 or 1
Bit 1
Setpoint2_Active
1 Indicates the setpoint 2 is Active
0 or 1
Bit 2
Setpoint3_Active
1 Indicates the setpoint 3 is Active
0 or 1
Bit 3
Setpoint4_Active
1 Indicates the setpoint 4 is Active
0 or 1
Bit 4
Setpoint5_Active
1 Indicates the setpoint 5 is Active
0 or 1
Bit 5
Setpoint6_Active
1 Indicates the setpoint 6 is Active
0 or 1
Bit 6
Setpoint7_Active
1 Indicates the setpoint 7 is Active
0 or 1
Bit 7
Setpoint8_Active
1 Indicates the setpoint 8 is Active
0 or 1
Bit 8
Setpoint9_Active
1 Indicates the setpoint 9 is Active
0 or 1
Bit 9
Setpoint10_Active
1 Indicates the setpoint 10 is Active
0 or 1
Bit 10…15
Reserved
Reserved for future use
0
Int16
Setpoints_11_20_Active (M6 and M8)
Actuation Status of Setpoints 11 … 20
0 … 65535
1
310
Bit 0
Setpoint11_Active
1 Indicates the setpoint 11 is Active
0 or 1
Bit 1
Setpoint12_Active
1 Indicates the setpoint 12 is Active
0 or 1
Bit 2
Setpoint13_Active
1 Indicates the setpoint 13 is Active
0 or 1
Bit 3
Setpoint14_Active
1 Indicates the setpoint 14 is Active
0 or 1
Bit 4
Setpoint15_Active
1 Indicates the setpoint 15 is Active
0 or 1
Bit 5
Setpoint16_Active
1 Indicates the setpoint 16 is Active
0 or 1
Bit 6
Setpoint17_Active
1 Indicates the setpoint 17 is Active
0 or 1
Bit 7
Setpoint18_Active
1 Indicates the setpoint 18 is Active
0 or 1
Bit 8
Setpoint19_Active
1 Indicates the setpoint 19 is Active
0 or 1
Bit 9
Setpoint20_Active
1 Indicates the setpoint 20 is Active
0 or 1
Bit 10…15
Reserved
Future Use
0
Rockwell Automation Publication 1426-UM001G-EN-P - November 2014
PowerMonitor 5000 Unit Data Tables
Appendix A
Table 113 - Status.Alarms Data Table
Element
Number
Type
Tag Name
Description
Range
2
Int16
Logic_Level_1_Gates_Active (M6 and M8)
Actuation Status of Level 1 Gates
0 … 65535
Bit 0
Level1_Gate1_Output
1 Indicates gate logic output is true
0 or 1
Bit 1
Level1_Gate2_Output
1 Indicates gate logic output is true
0 or 1
Bit 2
Level1_Gate3_Output
1 Indicates gate logic output is true
0 or 1
Bit 3
Level1_Gate4_Output
1 Indicates gate logic output is true
0 or 1
Bit 4
Level1_Gate5_Output
1 Indicates gate logic output is true
0 or 1
Bit 5
Level1_Gate6_Output
1 Indicates gate logic output is true
0 or 1
Bit 6
Level1_Gate7_Output
1 Indicates gate logic output is true
0 or 1
Bit 7
Level1_Gate8_Output
1 Indicates gate logic output is true
0 or 1
Bit 8
Level1_Gate9_Output
1 Indicates gate logic output is true
0 or 1
Bit 9
Level1_Gate10_Output
1 Indicates gate logic output is true
0 or 1
Bit 10 … 15
Reserved
Future Use
0
Int16
Metering_Status
Metering Conditions Status
0…65,535
Bit 0
Virtual_Wiring_Correction
1 = Virtual Wiring Correction ON
0…1
Bit 1
Volts_Loss_V1
1 = Loss of V1 metering voltage
0…1
Bit 2
Volts_Loss_V2
1 = Loss of V2 metering voltage
0…1
Bit 3
Volts_Loss_V3
1 = Loss of V3 metering voltage
0…1
Bit 4
Volts_Over_Range_Indication
1 = A Voltage over range status condition exists
0…1
Bit 5
Amps_Over_Range_Indication
1 = An Amperage over range status condition exists
0…1
Bit 6
Wiring_Diagnostics_Active
1 = The wiring diagnostics is currently calculating wiring condition
0…1
Bit 7…15
Reserved
Reserved for future use
0
Int16
Over_Range_Information
Indicates which input is over range
0…65,535
Bit 0
V1G_Over_Range
1 = V1G input is over input range
0…1
Bit 1
V2G_Over_Range
1 = V2G input is over input range
0…1
Bit 2
V3G_Over_Range
1 = V3G input is over input range
0…1
3
4
Bit 3
VNG_Over_Range
1 = VNG input is over input range
0…1
Bit 4
I1_Over_Range
1 = I1 input is over input range
0…1
Bit 5
I2_Over_Range
1 = I2 input is over input range
0…1
Bit 6
I3_Over_Range
1 = I3 input is over input range
0…1
Bit 7
I4_Over_Range
1 = I4 input is over input range
0…1
Bit 8…15
Reserved
Reserved for future use
0
Rockwell Automation Publication 1426-UM001G-EN-P - November 2014
311
Appendix A
PowerMonitor 5000 Unit Data Tables
Table 113 - Status.Alarms Data Table
Element
Number
Type
Tag Name
Description
Range
5
Int16
PowerQuality_Status
Power Quality Conditions Status
0…65,535
Bit 0
Sag_Indication_Detected
1 = A sag event was detected in the last metering cycle
0…1
Bit 1
Swell_Indication_Detected
1 = A Swell event was detected in the last metering cycle
0…1
Bit 2
Transient_Indication
A transient occurred
0…1
Bit 3
200mS_Sag_Swell_Status_Flag
A flag indicating 200ms result has been calculated during a Sag,
Swell or Interruption
0…1
Bit 4
3s_Sag_Swell_Status_Flag
A flag indicating the 3s result has been calculated during a Sag,
Swell or Interruption
0…1
Bit 5
10m_Sag_Swell_Status_Flag
A flag indicating the 10min result has been calculated during a Sag,
Swell or Interruption
0…1
Bit 6
2h_Sag_Swell_Status_Flag
A flag indicating the 2h result has been calculated during a Sag,
Swell or Interruption
0…1
Bit 7…15
Reserved
Reserved for future use
0
Int16
Logs_Status
Logs Condition Status
0… 65,535
Bit 0
Data_Log_Full_Fill_And_Stop
Is Set when fill and stop is configured and log is at least 80% filled
0…1
Bit 1
Event_Log_Full_Fill_And_Stop
Is Set when fill and stop is configured and log is at least 80% filled
0…1
Bit 2
Setpoint_Log_Full_Fill_And_Stop
Is Set when fill and stop is configured and log is at least 80% filled
0…1
Bit 3
PowerQuality_Log_Full_Fill_And_Stop
Is Set when fill and stop is configured and log is at least 80% filled
0…1
6
7
8
9
312
Bit 4
Energy_Log_Full_Fill_And_Stop
Is Set when fill and stop is configured and log is at least 80% filled
0…1
Bit 5
Waveform_Full
Is Set when log is at least 80% filled
0…1
Bit 6
TriggerData_Full_Fill_And_Stop
Is Set when fill and stop is configured and log is at least 80% filled
0…1
Bit 7…15
Reserved
Reserved for future use
0
Int16
Output_Pulse_Overrun
The output pulse rate exceeds the configured capability
0…65535
Bit 0
KYZ_Pulse_Overrun
The KYZ output pulse rate exceeds the configured capability
0…1
Bit 1
Relay1_Pulse_Overrun
The Relay 1 output pulse rate exceeds the configured capability
Bit 2
Relay2_Pulse_Overrun
The Relay 2 output pulse rate exceeds the configured capability
Bit 3
Relay3_Pulse_Overrun
The Relay 3 output pulse rate exceeds the configured capability
Bit 4…15
Reserved
Reserved for future use
0
Int16
IEEE1159_Over_Voltage
Over Voltage Condition
0…65535
Bit 0
IEEE1159_Over_Voltage_V1
1 = An over voltage is detected on V1
0…1
Bit 1
IEEE1159_Over_Voltage_V2
1 = An over voltage is detected on V2
0…1
Bit 2
IEEE1159_Over_Voltage_V3
1 = An over voltage is detected on V3
0…1
Bit 3…15
Reserved
Reserved for future use
0
Int16
IEEE1159_Under_Voltage
Under Voltage Condition
0…65535
Bit 0
IEEE1159_Under_Voltage_V1
1 = An under voltage is detected on V1
0…1
Bit 1
IEEE1159_Under_Voltage_V2
1 = An under voltage is detected on V2
0…1
Bit 2
IEEE1159_Under_Voltage_V3
1 = An under voltage is detected on V3
0…1
Bit 3…15
Reserved
Reserved for future use
0
Rockwell Automation Publication 1426-UM001G-EN-P - November 2014
PowerMonitor 5000 Unit Data Tables
Appendix A
Table 113 - Status.Alarms Data Table
Element
Number
Type
Tag Name
Description
Range
10
Int16
IEEE1159_Imbalance_Condition
IEEE1159 Imbalance
0…65535
Bit 0
IEEE1159_Imbalance_Condition_Volts
1 = An Imbalance is detected on Voltage
0…1
Bit 1
IEEE1159_Imbalance_Condition_Current
1 = An Imbalance is detected on Current
0…1
Bit 2…15
Reserved
Reserved for future use
0
Int16
IEEE1159_DCOffset_Condition
IEEE1159 DC Offset Condition
0…65535
Bit 0
IEEE1159_DCOffset_Condition_V1
1 = A DC offset exceed limitation is detected on V1
0…1
Bit 1
IEEE1159_DCOffset_Condition_V2
1 = A DC offset exceed limitation is detected on V2
0…1
Bit 2
IEEE1159_DCOffset_Condition_V3
1 = A DC offset exceed limitation is detected on V3
0…1
Bit 3…15
Reserved
Reserved for future use
0
Int16
IEEE1159_Voltage_THD_Condition
IEEE1159 Voltage THD Condition
0…65535
Bit 0
IEEE1159_Voltage_THD_Condition_V1
1 = A THD exceed limitation is detected on V1
0…1
Bit 1
IEEE1159_Voltage_THD_Condition_V2
1 = A THD exceed limitation is detected on V2
0…1
Bit 2
IEEE1159_Voltage_THD_Condition_V3
1 = A THD exceed limitation is detected on V3
0…1
Bit 3
IEEE1159_Voltage_TID_Condition_V1
1 = A TID exceed limitation is detected on V1
0…1
Bit 4
IEEE1159_Voltage_TID_Condition_V2
1 = A TID exceed limitation is detected on V2
0…1
Bit 5
IEEE1159_Voltage_TID_Condition_V3
1 = A TID exceed limitation is detected on V3
0…1
11
12
13
14
15
Bit 6…15
Reserved
Reserved for future use
0
Int16
IEEE1159_Current_THD_Condition
IEEE1159 Current THD Condition
0…65535
Bit 0
IEEE1159_Current_THD_Condition_ I1
1 = A THD exceed limitation is detected on I1
0…1
Bit 1
IEEE1159_Current_THD_Condition_ I2
1 = A THD exceed limitation is detected on I2
0…1
Bit 2
IEEE1159_Current_THD_Condition_ I3
1 = A THD exceed limitation is detected on I3
0…1
Bit 3
IEEE1159_Current_THD_Condition_I4
1 = A THD exceed limitation is detected on I4
0…1
Bit 4
IEEE1159_Current_TID_Condition_I1
1 = A TID exceed limitation is detected on I1
0…1
Bit 5
IEEE1159_Current_TID_Condition_I2
1 = A TID exceed limitation is detected on I2
0…1
Bit 6
IEEE1159_Current_TID_Condition_I3
1 = A TID exceed limitation is detected on I3
0…1
Bit 7
IEEE1159_Current_TID_Condition_I4
1 = A TID exceed limitation is detected on I4
0…1
Bit 8…15
Reserved
Reserved for future use
0
Int16
IEEE1159_PowerFrequency_Condition
IEEE1159 Power Frequency Condition
0…65535
Bit 0
IEEE1159_PowerFrequency_Condition
1 = Frequency exceed limitation is detected
0…1
Bit 1…15
Reserved
Reserved for future use
0
Int16
IEEE519_Overall_Status
IEEE519 Overall Status
0…65535
Bit 0
ShortTerm_TDD_THD_PASS_FAIL
1= Fail, 0=Pass
0…1
Bit 1
LongTerm_TDD_THD_PASS_FAIL
1= Fail, 0=Pass
0…1
Bit 2
ShortTerm_Individual_Harmonic_PASS_FAIL
1= Fail, 0=Pass
0…1
Bit 3
LongTerm_Individual_Harmonic_PASS_FAIL
1= Fail, 0=Pass
0…1
Bit 4…15
Reserved
Reserved for future use
0
Rockwell Automation Publication 1426-UM001G-EN-P - November 2014
313
Appendix A
PowerMonitor 5000 Unit Data Tables
Table 113 - Status.Alarms Data Table
Element
Number
Type
Tag Name
Description
Range
16
Int16
ShortTerm_2nd_To_17th_Harmonic_Status
ShortTerm 2nd To 17th Harmonic Status
0…65535
Bit 0
2nd_Harmonic_PASS_FAIL
1= Fail, 0=Pass
0…1
Bit 1
3rd_Harmonic_PASS_FAIL
1= Fail, 0=Pass
0…1
Bit 2
4th_Harmonic_PASS_FAIL
1= Fail, 0=Pass
0…1
Bit 3
5th_Harmonic_PASS_FAIL
1= Fail, 0=Pass
0…1
Bit 4
6th_Harmonic_PASS_FAIL
1= Fail, 0=Pass
0…1
Bit 5
7th_Harmonic_PASS_FAIL
1= Fail, 0=Pass
0…1
17
314
Bit 6
8th_Harmonic_PASS_FAIL
1= Fail, 0=Pass
0…1
Bit 7
9th_Harmonic_PASS_FAIL
1= Fail, 0=Pass
0…1
Bit 8
10th_Harmonic_PASS_FAIL
1= Fail, 0=Pass
0…1
Bit 9
11th_Harmonic_PASS_FAIL
1= Fail, 0=Pass
0…1
Bit 10
12th_Harmonic_PASS_FAIL
1= Fail, 0=Pass
0…1
Bit 11
13th_Harmonic_PASS_FAIL
1= Fail, 0=Pass
0…1
Bit 12
14th_Harmonic_PASS_FAIL
1= Fail, 0=Pass
0…1
Bit 13
15th_Harmonic_PASS_FAIL
1= Fail, 0=Pass
0…1
Bit 14
16th_Harmonic_PASS_FAIL
1= Fail, 0=Pass
0…1
Bit 15
17th_Harmonic_PASS_FAIL
1= Fail, 0=Pass
0…1
Int16
ShortTerm_18th_To_33rd_Harmonic_Status
ShortTerm 18th To 33rd Harmonic Status
0…65535
Bit 0
18th_Harmonic_PASS_FAIL
1= Fail, 0=Pass
0…1
Bit 1
19th_Harmonic_PASS_FAIL
1= Fail, 0=Pass
0…1
Bit 2
20th_Harmonic_PASS_FAIL
1= Fail, 0=Pass
0…1
Bit 3
21st_Harmonic_PASS_FAIL
1= Fail, 0=Pass
0…1
Bit 4
22nd_Harmonic_PASS_FAIL
1= Fail, 0=Pass
0…1
Bit 5
23rd_Harmonic_PASS_FAIL
1= Fail, 0=Pass
0…1
Bit 6
24th_Harmonic_PASS_FAIL
1= Fail, 0=Pass
0…1
Bit 7
25th_Harmonic_PASS_FAIL
1= Fail, 0=Pass
0…1
Bit 8
26th_Harmonic_PASS_FAIL
1= Fail, 0=Pass
0…1
Bit 9
27th_Harmonic_PASS_FAIL
1= Fail, 0=Pass
0…1
Bit 10
28th_Harmonic_PASS_FAIL
1= Fail, 0=Pass
0…1
Bit 11
29th_Harmonic_PASS_FAIL
1= Fail, 0=Pass
0…1
Bit 12
30th_Harmonic_PASS_FAIL
1= Fail, 0=Pass
0…1
Bit 13
31st_Harmonic_PASS_FAIL
1= Fail, 0=Pass
0…1
Bit 14
32nd_Harmonic_PASS_FAIL
1= Fail, 0=Pass
0…1
Bit 15
33rd_Harmonic_PASS_FAIL
1= Fail, 0=Pass
0…1
Rockwell Automation Publication 1426-UM001G-EN-P - November 2014
PowerMonitor 5000 Unit Data Tables
Appendix A
Table 113 - Status.Alarms Data Table
Element
Number
Type
Tag Name
Description
Range
18
Int16
ShortTerm_34th_To_40th_Harmonic_Status
ShortTerm 34th To 40th Harmonic Status
0…65535
Bit 0
34th_Harmonic_PASS_FAIL
1= Fail, 0=Pass
0…1
Bit 1
35th_Harmonic_PASS_FAIL
1= Fail, 0=Pass
0…1
Bit 2
36th_Harmonic_PASS_FAIL
1= Fail, 0=Pass
0…1
Bit 3
37th_Harmonic_PASS_FAIL
1= Fail, 0=Pass
0…1
Bit 4
38th_Harmonic_PASS_FAIL
1= Fail, 0=Pass
0…1
Bit 5
39th_Harmonic_PASS_FAIL
1= Fail, 0=Pass
0…1
Bit 6
40th_Harmonic_PASS_FAIL
1= Fail, 0=Pass
0…1
Bit 7…15
Reserved
Reserved for future use
0
Int16
LongTerm_2nd_To_17th_Harmonic_Status
LongTerm 2nd To 17th Harmonic Status
0…65535
Bit 0
2nd_Harmonic_PASS_FAIL
1= Fail, 0=Pass
0…1
Bit 1
3rd_Harmonic_PASS_FAIL
1= Fail, 0=Pass
0…1
Bit 2
4th_Harmonic_PASS_FAIL
1= Fail, 0=Pass
0…1
Bit 3
5th_Harmonic_PASS_FAIL
1= Fail, 0=Pass
0…1
Bit 4
6th_Harmonic_PASS_FAIL
1= Fail, 0=Pass
0…1
Bit 5
7th_Harmonic_PASS_FAIL
1= Fail, 0=Pass
0…1
19
Bit 6
8th_Harmonic_PASS_FAIL
1= Fail, 0=Pass
0…1
Bit 7
9th_Harmonic_PASS_FAIL
1= Fail, 0=Pass
0…1
Bit 8
10th_Harmonic_PASS_FAIL
1= Fail, 0=Pass
0…1
Bit 9
11th_Harmonic_PASS_FAIL
1= Fail, 0=Pass
0…1
Bit 10
12th_Harmonic_PASS_FAIL
1= Fail, 0=Pass
0…1
Bit 11
13th_Harmonic_PASS_FAIL
1= Fail, 0=Pass
0…1
Bit 12
14th_Harmonic_PASS_FAIL
1= Fail, 0=Pass
0…1
Bit 13
15th_Harmonic_PASS_FAIL
1= Fail, 0=Pass
0…1
Bit 14
16th_Harmonic_PASS_FAIL
1= Fail, 0=Pass
0…1
Bit 15
17th_Harmonic_PASS_FAIL
1= Fail, 0=Pass
0…1
Rockwell Automation Publication 1426-UM001G-EN-P - November 2014
315
Appendix A
PowerMonitor 5000 Unit Data Tables
Table 113 - Status.Alarms Data Table
Element
Number
Type
Tag Name
Description
Range
20
Int16
LongTerm_18th_To_33rd_Harmonic_Status
LongTerm 18th To 33rd Harmonic Status
0…65535
Bit 0
18th_Harmonic_PASS_FAIL
1= Fail, 0=Pass
0…1
Bit 1
19th_Harmonic_PASS_FAIL
1= Fail, 0=Pass
0…1
Bit 2
20th_Harmonic_PASS_FAIL
1= Fail, 0=Pass
0…1
Bit 3
21st_Harmonic_PASS_FAIL
1= Fail, 0=Pass
0…1
Bit 4
22nd_Harmonic_PASS_FAIL
1= Fail, 0=Pass
0…1
Bit 5
23rd_Harmonic_PASS_FAIL
1= Fail, 0=Pass
0…1
Bit 6
24th_Harmonic_PASS_FAIL
1= Fail, 0=Pass
0…1
Bit 7
25th_Harmonic_PASS_FAIL
1= Fail, 0=Pass
0…1
Bit 8
26th_Harmonic_PASS_FAIL
1= Fail, 0=Pass
0…1
Bit 9
27th_Harmonic_PASS_FAIL
1= Fail, 0=Pass
0…1
Bit 10
28th_Harmonic_PASS_FAIL
1= Fail, 0=Pass
0…1
Bit 11
29th_Harmonic_PASS_FAIL
1= Fail, 0=Pass
0…1
Bit 12
30th_Harmonic_PASS_FAIL
1= Fail, 0=Pass
0…1
Bit 13
31st_Harmonic_PASS_FAIL
1= Fail, 0=Pass
0…1
Bit 14
32nd_Harmonic_PASS_FAIL
1= Fail, 0=Pass
0…1
Bit 15
33rd_Harmonic_PASS_FAIL
1= Fail, 0=Pass
0…1
Int16
LongTerm_34th_To_40th_Harmonic_Status
LongTerm 34th To 40th Harmonic Status
0…65535
Bit 0
34th_Harmonic_PASS_FAIL
1= Fail, 0=Pass
0…1
Bit 1
35th_Harmonic_PASS_FAIL
1= Fail, 0=Pass
0…1
Bit 2
36th_Harmonic_PASS_FAIL
1= Fail, 0=Pass
0…1
Bit 3
37th_Harmonic_PASS_FAIL
1= Fail, 0=Pass
0…1
Bit 4
38th_Harmonic_PASS_FAIL
1= Fail, 0=Pass
0…1
Bit 5
39th_Harmonic_PASS_FAIL
1= Fail, 0=Pass
0…1
Bit 6
40th_Harmonic_PASS_FAIL
1= Fail, 0=Pass
0…1
21
22
23
316
Bit 7…15
Reserved
Reserved for future use
0
Int16
IEEE1159_Voltage_Fluctuation_Condition
Voltage fluctuation for short term exceeds Pst limit
0…65535
Bit 0
IEEE1159_Voltage_Fluctuation_V1
1 = Pst limit exceeded on V1
0…1
Bit 1
IEEE1159_Voltage_Fluctuation_V2
1 = Pst limit exceeded on V2
0…1
Bit 2
IEEE1159_Voltage_Fluctuation_V3
1 = Pst limit exceeded on V3
0…1
Bit 3…15
Reserved
Reserved for future use
0
Int16
EN61000_4_30_Mains_Signaling_Condition
The mains signaling voltage exceeds the set limit
0…65535
Bit 0
EN61000_4_30_Mains_Signaling_V1
1 = Mains signaling voltage exceeded on V1
0…1
Bit 1
EN61000_4_30_Mains_Signaling_V2
1 = Mains signaling voltage exceeded on V2
0…1
Bit 2
EN61000_4_30_Mains_Signaling_V3
1 = Mains signaling voltage exceeded on V3
0…1
Bit 3…15
Reserved
Reserved for future use
0
Rockwell Automation Publication 1426-UM001G-EN-P - November 2014
PowerMonitor 5000 Unit Data Tables
Appendix A
Table 113 - Status.Alarms Data Table
Element
Number
Type
Tag Name
Description
Range
24
Int16
EN61000_4_30_Under_Deviation_Condition
Deviation is under the configured limit
0…65535
Bit 0
EN61000_4_30_Under_Deviation_V1
1 = An under deviation is detected on V1
0…1
Bit 1
EN61000_4_30_Under_Deviation_V2
1 = An under deviation is detected on V2
0…1
Bit 2
EN61000_4_30_Under_Deviation_V3
1 = An under deviation is detected on V3
0…1
Bit 3…15
Reserved
Reserved for future use
0
Int 16
EN61000_4_30_Over_Deviation_Condition
Deviation is over the configured limit
0…65535
Bit 0
EN61000_4_30_Over_Deviation_V1
1 = An over deviation is detected on V1
0…1
Bit 1
EN61000_4_30_Over_Deviation_V2
1 = An over deviation is detected on V2
0…1
Bit 2
EN61000_4_30_Over_Deviation_V3
1 = An over deviation is detected on V3
0…1
Bit 3…15
Reserved
Reserved for future use
0
Int16
Reserved
Reserved for future use
0
25
26…31
Rockwell Automation Publication 1426-UM001G-EN-P - November 2014
317
Appendix A
PowerMonitor 5000 Unit Data Tables
Status.OptionalComm
Table 114 - Table Properties
CIP Instance Number
835
PCCC File Number
N44
No. of Elements
30
Length in Words
30
Data Type
Int16
Data Access
Read Only
Table 115 - Status.OptionalComm Data Table
Element Type
Number
Tag Name
Description
Units
Range
0
Int16
Network_Type
0x25 = DeviceNet
0x65 = ControlNet
0x85 = Ethernet/IP
-
0 …255
1
Int16
Firmware_Version
Optional communication firmware version
Network_ 0…255
Type
dependent
2
Int16
Firmware_Build
Optional communication firmware build
Network_ 0
Type
dependent
3
Int16
Serial_Low_Word
Low 16-bit serial number
-
0
4
Int16
Serial_High_Word
High 16-bit serial number
-
0
5
Int16
Optional_Port_Status
Bit 0…2: Current status of Anybus module
000: SETUP
001: NW_INIT
010: WAIT_PROCESS
011: IDLE
100: PROCESS_ACTIVE
101: ERROR
110: reserved
111: EXCEPTION
-
0…7
6
318
Int16
Exception_Code
Bit 3: SUP bit
0: Module is not supervised
1: Module is supervised
0 or 1
Bit 4…14 reserved for future use
0
Bit 15: Watchdog Timeout indicator
0: The application and ABCC communicate normally
1: The application lost the communication with ABCC module
0 or 1
Last exception
0 = No exception
1 = Application timeout
2 = Invalid device address
3 = Invalid communication setting
4 = Major unrecoverable app event
5 = wait for reset
6 = Invalid process data config
7 = Invalid application response
8 = Non-volatile memory checksum error
Other value = reserved
Rockwell Automation Publication 1426-UM001G-EN-P - November 2014
-
0…8
PowerMonitor 5000 Unit Data Tables
Appendix A
Table 115 - Status.OptionalComm Data Table
Element Type
Number
Tag Name
Description
Units
Range
7
Int16
Event 1 Severity
Severity data for Events 1…6:
0x00 = Minor, recoverable
0x10 = Minor, unrecoverable
0x20 = Major, recoverable
0x30 = Major, unrecoverable
-
0x00…0x30
8
Int16
Event 1 Code
-
0x10…0xF0
9
Int16
Event 2 Severity
-
0x00…0x30
10
Int16
Event 2 Code
-
0x10…0xF0
11
Int16
Event 3 Severity
Event code for Events 1…6:
10h Generic Error
20h Current
21h Current, device input side
22h Current, inside the device
23h Current, device output side
30h Voltage
31h Mains Voltage 32h Voltage inside the device
33h Output Voltage
40h Temperature
41h Ambient Temperature
42h Device Temperature
50h Device Hardware
60h Device Software
61h Internal Software
62h User Software
63h Data Set 70h Additional Modules
80h Monitoring
81h Communication
82h Protocol Error
90h External Error
F0h Additional Functions
-
0x00…0x30
Future Use
12
Int16
Event 3 Code
13
Int16
Event 4 Severity
14
Int16
Event 4 Code
15
Int16
Event 5 Severity
16
Int16
Event 5 Code
17
Int16
Event 6 Severity
18
Int16
Event 6 Code
19 … 29 Int16
Reserved
Rockwell Automation Publication 1426-UM001G-EN-P - November 2014
-
0x10…0xF0
-
0x00…0x30
-
0x10…0xF0
-
0x00…0x30
-
0x10…0xF0
-
0x00…0x30
-
0x10…0xF0
0
0
319
Appendix A
PowerMonitor 5000 Unit Data Tables
Status.Wiring_Corrections
Table 116 - Table Properties
CIP Instance Number
834
PCCC File Number
N43
No. of Elements
14
Length in Words
14
Data Type
Int16
Data Access
Read Only
Table 117 - Status.Wiring_Corrections Data Table
Element
Number
Type
Tag Name
Description
Default
Range
0
Int16
Wiring_Correction_Commands
0 = No command
1 = Correct wiring by using Range 1 results, Lagging 97 PF to Leading 89 PF
2 = Correct wiring by using Range 2 results, Lagging 85 PF to leading 98 PF
3 = Correct wiring by using Range 3 results, Lagging 52 PF to lagging 95 PF
4 = Correct wiring by using manual input parameters
5 = Remove all wiring corrections
0
0…5
1
Int16
Input_V1_Mapping
This parameter logically maps a physical voltage channel to V1.
1 = V1
2 = V2
3 = V3
-1 = V1 inverted
-2 = V2 inverted
-3 = V3 inverted
1
-3…-1
1…3
2
Int16
Input_V2_Mapping
This parameter logically maps a physical voltage channel to V2.
1 = V1
2 = V2
3 = V3
-1 = V1 inverted
-2 = V2 inverted
-3 = V3 inverted
2
-3… -1
1…3
3
Int16
Input_V3_Mapping
This parameter logically maps a physical voltage channel to V3.
1 = V1
2 = V2
3 = V3
-1 = V1 inverted
-2 = V2 inverted
-3 = V3 inverted
3
-3…-1
1 …3
4
Int16
Input_I1_Mapping
This parameter logically maps a physical current channel to I1.
1 = I1
2 = I2
3 = I3
-1 = I1 inverted
-2 = I2 inverted
-3 = I3 inverted
1
-3…-1
1…3
320
Rockwell Automation Publication 1426-UM001G-EN-P - November 2014
PowerMonitor 5000 Unit Data Tables
Appendix A
Table 117 - Status.Wiring_Corrections Data Table
Element
Number
Type
Tag Name
Description
Default
Range
5
Int16
Input_I2_Mapping
This parameter logically maps a physical current channel to I2.
1 = I1
2 = I2
3 = I3
-1 = I1 inverted
-2 = I2 inverted
-3 = I3 inverted
2
-3…-1
1…3
6
Int16
Input_I3_Mapping
This parameter logically maps a physical current channel to I3.
1 = I1
2 = I2
3 = I3
-1 = I1 inverted
-2 = I2 inverted
-3 = I3 inverted
3
-3…-1
1…3
7
Int16
Last_Cmd_Rejection_Status
0 = No rejection
1 = Rejected see rejection status
0
0…1
8
Int16
Rejection_Information
0 = No information
1 = Selected range is incomplete
2 = Command is already active. Please use command 5 to start over.
3 = Two like inputs wired to one terminal
4 = Invalid Input parameter
0
0…4
9…13
Int16
Reserved
Future Use
0
0
Rockwell Automation Publication 1426-UM001G-EN-P - November 2014
321
Appendix A
PowerMonitor 5000 Unit Data Tables
Status.IEEE1588 (M6 and M8 model)
Table 118 - Table Properties
CIP Instance Number
873
PCCC File Number
N82
No. of Elements
45
Length in Words
45
Data Type
INT16
Data Access
Read Only
Table 119 - Status.IEEE1588 Data Table (M6 and M8 model)
Element Type
Number
Tag Name
Description
Range
0
Int16
IEEE1588_Version
IEEE1588 Version 2
2
1
Int16
PTPEnable
PTPEnable specifies the enable status for the Precision Time Protocol on the device.
0,1
2
Int16
IsSynchronized
IsSynchronized specifies whether the local clock is synchronized with a master reference clock. The
value is 1 if the local clock is synchronized and 0 if the local clock is not synchronized. A clock is
synchronized if it has one port in the slave state and is receiving updates from the time master.
0,1
3
Int16
SystemTimeNanoseconds_A
SystemTimeNanoseconds specifies a 64-bit value of the current system time in units of
nanoseconds. (Bit 0 to bit 15)
0…0xffff
4
Int16
SystemTimeNanoseconds_B
SystemTimeNanoseconds specifies a 64-bit value of the current system time in units of
nanoseconds. (Bit 16 to bit 31)
0…0xffff
5
Int16
SystemTimeNanoseconds_C
SystemTimeNanoseconds specifies a 64-bit value of the current system time in units of
nanoseconds. (Bit 32 to bit 47)
0…0xffff
6
Int16
SystemTimeNanoseconds_D
SystemTimeNanoseconds specifies a 64-bit value of the current system time in units of
nanoseconds. (Bit 48 to bit 63)
0…0xffff
7
Int16
OffsetFromMaster_A
OffsetFromMaster specifies the amount of deviation between the local clock and its master clock in
nanoseconds.(Bit 0 to bit 15)
0…0xffff
8
Int16
OffsetFromMaster_B
OffsetFromMaster specifies the amount of deviation between the local clock and its master clock in
nanoseconds. (Bit 16 to bit 31)
0…0xffff
9
Int16
OffsetFromMaster_C
OffsetFromMaster specifies the amount of deviation between the local clock and its master clock in
nanoseconds. (Bit 32 to bit 47)
0…0xffff
10
Int16
OffsetFromMaster_D
OffsetFromMaster specifies the amount of deviation between the local clock and its master clock in
nanoseconds. (Bit 48 to bit 63)
0…0xffff
11
Int16
MaxOffsetFromMaster_A
MaxOffsetFromMaster specifies the absolute value of the maximum amount of deviation between
the local clock and the master clock in nanoseconds since last set. (Bit 0 to bit 15)
0…0xffff
12
Int16
MaxOffsetFromMaster_B
MaxOffsetFromMaster specifies the absolute value of the maximum amount of deviation between
the local clock and the master clock in nanoseconds since last set. (Bit 16 to bit 31)
0…0xffff
13
Int16
MaxOffsetFromMaster_C
MaxOffsetFromMaster specifies the absolute value of the maximum amount of deviation between
the local clock and the master clock in nanoseconds since last set. (Bit 32 to bit 47)
0…0xffff
14
Int16
MaxOffsetFromMaster_D
MaxOffsetFromMaster specifies the absolute value of the maximum amount of deviation between
the local clock and the master clock in nanoseconds since last set. (Bit 48 to bit 63)
0…0xffff
15
Int16
MeanPathDelayToMaster_A
MeanPathDelayToMaster specifies the average path delay between the local clock and master clock
in nanoseconds. (Bit 0 to bit 15)
0…0xffff
16
Int16
MeanPathDelayToMaster_B
MeanPathDelayToMaster specifies the average path delay between the local clock and master clock
in nanoseconds. (Bit 16 to bit 31)
0…0xffff
17
Int16
MeanPathDelayToMaster_C
MeanPathDelayToMaster specifies the average path delay between the local clock and master clock
in nanoseconds. (Bit 32 to bit 47)
0…0xffff
18
Int16
MeanPathDelayToMaster_D
MeanPathDelayToMaster specifies the average path delay between the local clock and master clock
in nanoseconds. (Bit 48 to bit 63)
0…0xffff
322
Rockwell Automation Publication 1426-UM001G-EN-P - November 2014
PowerMonitor 5000 Unit Data Tables
Appendix A
Table 119 - Status.IEEE1588 Data Table (M6 and M8 model)
Element Type
Number
Tag Name
Description
Range
19
Int16
MasterClockIdentity_AB
MAC address 0xA:0xB:0xC:0xD:0xE:0xF for the Master Clock.
0…0xffff
20
Int16
MasterClockIdentity_CD
MAC address 0xA:0xB:0xC:0xD:0xE:0xF for the Master Clock.
0…0xffff
21
Int16
MasterClockIdentity_EF
MAC address 0xA:0xB:0xC:0xD:0xE:0xF for the Master Clock.
0…0xffff
22
Int16
LocalClockIdentity_AB
MAC address 0xA:0xB:0xC:0xD:0xE:0xF for the Local Clock.
0…0xffff
23
Int16
LocalClockIdentity_CD
MAC address 0xA:0xB:0xC:0xD:0xE:0xF for the Local Clock.
0…0xffff
24
Int16
LocalClockIdentity_EF
MAC address 0xA:0xB:0xC:0xD:0xE:0xF for the Local Clock.
0…0xffff
25
Int16
LocalClockClass
An attribute defining a clock's TAI traceability
0…255
26
Int16
LocalTimeAccuracy
An attribute defining the accuracy of a clock
0…255
27
Int16
LocalOffsetScaledLogVariance
An attribute defining the stability of a clock
0…0xffff
28
Int16
NumberOfPorts
NumberOfPorts specifies the number of PTP ports on the device.
1
29
Int16
PortState
PortStateInfo specifies the current state of each PTP port on the device
1…9
30
Int16
DomainNumber
DomainNumber specifies the PTP clock domain.
0…255
31
Int16
ClockType
The value of ClockType shall indicate the type of PTP node as defined in Table 5-47.13 in CIP
specification Volume 1.
0…0xffff
32
Int16
Steps removed
StepsRemoved specifies the number of communication paths traversed between the local clock and
the grandmaster clock.
0…0xffff
33…44
Int16
Reserved
For future use
Rockwell Automation Publication 1426-UM001G-EN-P - November 2014
323
Appendix A
PowerMonitor 5000 Unit Data Tables
Statistics.Setpoint_Output
Table 120 - Table Properties
CIP Instance Number
827
PCCC File Number
N36
No. of Elements
112
Length in Words
112
Data Type
Int16
Data Access
Read Only
Table 121 - Statistics.Setpoint_Output Data Table
Element
Number
Type
Tag Name
Description
Units
Range
0
Int16
Setpoint 1 Seconds
Accumulator
Time accumulator counter for seconds part of total accumulated time.
Sec
0…999
1
Int16
Setpoint 1 Minutes
Accumulator
Time accumulator counter for minutes part of total accumulated time.
Min
0…59
2
Int16
Setpoint 1 Hours
Accumulator
Time accumulator counter for total hours of accumulated time.
Hr
0…9999
3
Int16
Setpoint 1 Transitions
to Active x1
The number of actuations for setpoint times 1.
x1
0…999
4
Int16
Setpoint 1 Transitions
to Active x1000
The number of actuations for setpoint times 1000.
x1000
0… 9999
5
Int16
Setpoint 2 Seconds
Accumulator
Time accumulator counter for seconds part of total accumulated time.
Sec
0…999
6
Int16
Setpoint 2 Minutes
Accumulator
Time accumulator counter for minutes part of total accumulated time.
Min
0…59
7
Int16
Setpoint 2 Hours
Accumulator
Time accumulator counter for total hours of accumulated time.
Hr
0…9999
8
Int16
Setpoint 2 Transitions
to Active x1
The number of actuations for setpoint times 1.
0… 999
9
Int16
Setpoint 2 Transitions
to Active x1000
The number of actuations for setpoint times 1000.
0…9999
10
Int16
Setpoint 3 Seconds
Accumulator
Time accumulator counter for seconds part of total accumulated time.
Sec
0…999
11
Int16
Setpoint 3 Minutes
Accumulator
Time accumulator counter for minutes part of total accumulated time.
Min
0…59
12
Int16
Setpoint 3 Hours
Accumulator
Time accumulator counter for total hours of accumulated time.
Hr
0…9999
13
Int16
Setpoint 3 Transitions
to Active x1
The number of actuations for setpoint times 1.
0…999
14
Int16
Setpoint 3 Transitions
to Active x1000
The number of actuations for setpoint times 1000.
0…9999
15
Int16
Setpoint 4 Seconds
Accumulator
Time accumulator counter for seconds part of total accumulated time.
Sec
0…999
16
Int16
Setpoint 4 Minutes
Accumulator
Time accumulator counter for minutes part of total accumulated time.
Min
0…59
17
Int16
Setpoint 4 Hours
Accumulator
Time accumulator counter for total hours of accumulated time.
Hr
0…9999
324
Rockwell Automation Publication 1426-UM001G-EN-P - November 2014
PowerMonitor 5000 Unit Data Tables
Appendix A
Table 121 - Statistics.Setpoint_Output Data Table
Element
Number
Type
Tag Name
Description
18
Int16
Setpoint 4 Transitions
to Active x1
The number of actuations for setpoint times 1.
0…999
19
Int16
Setpoint 4 Transitions
to Active x1000
The number of actuations for setpoint times 1000.
0…9999
20
Int16
Setpoint 5 Seconds
Accumulator
Time accumulator counter for seconds part of total accumulated time.
Sec
0…999
21
Int16
Setpoint 5 Minutes
Accumulator
Time accumulator counter for minutes part of total accumulated time.
Min
0…59
22
Int16
Setpoint 5 Hours
Accumulator
Time accumulator counter for total hours of accumulated time.
Hr
0…9999
23
Int16
Setpoint 5 Transitions
to Active x1
The number of actuations for setpoint times 1.
0…999
24
Int16
Setpoint 5 Transitions
to Active x1000
The number of actuations for setpoint times 1000.
0…9999
25
Int16
Setpoint 6 Seconds
Accumulator
Time accumulator counter for seconds part of total accumulated time.
Sec
0…999
26
Int16
Setpoint 6 Minutes
Accumulator
Time accumulator counter for minutes part of total accumulated time.
Min
0…59
27
Int16
Setpoint 6 Hours
Accumulator
Time accumulator counter for total hours of accumulated time.
Hr
0…9999
28
Int16
Setpoint 6 Transitions
to Active x1
The number of actuations for setpoint times 1.
0…999
29
Int16
Setpoint 6 Transitions
to Active x1000
The number of actuations for setpoint times 1000.
0…9999
30
Int16
Setpoint 7 Seconds
Accumulator
Time accumulator counter for seconds part of total accumulated time.
Sec
0…999
31
Int16
Setpoint 7 Minutes
Accumulator
Time accumulator counter for minutes part of total accumulated time.
Min
0…59
32
Int16
Setpoint 7 Hours
Accumulator
Time accumulator counter for total hours of accumulated time.
Hr
0…9999
33
Int16
Setpoint 7 Transitions
to Active x1
The number of actuations for setpoint times 1.
0…999
34
Int16
Setpoint 7 Transitions
to Active x1000
The number of actuations for setpoint times 1000.
0…9999
35
Int16
Setpoint 8 Seconds
Accumulator
Time accumulator counter for seconds part of total accumulated time.
Sec
0…999
36
Int16
Setpoint 8 Minutes
Accumulator
Time accumulator counter for minutes part of total accumulated time.
Min
0…59
37
Int16
Setpoint 8 Hours
Accumulator
Time accumulator counter for total hours of accumulated time.
Hr
0…9999
38
Int16
Setpoint 8 Transitions
to Active x1
The number of actuations for setpoint times 1.
0…999
39
Int16
Setpoint 8 Transitions
to Active x1000
The number of actuations for setpoint times 1000.
0…9999
40
Int16
Setpoint 9 Seconds
Accumulator
Time accumulator counter for seconds part of total accumulated time.
Sec
0…999
41
Int16
Setpoint 9 Minutes
Accumulator
Time accumulator counter for minutes part of total accumulated time.
Min
0…59
42
Int16
Setpoint 9 Hours
Accumulator
Time accumulator counter for total hours of accumulated time.
Hr
0…9999
Rockwell Automation Publication 1426-UM001G-EN-P - November 2014
Units
Range
325
Appendix A
PowerMonitor 5000 Unit Data Tables
Table 121 - Statistics.Setpoint_Output Data Table
Element
Number
Type
Tag Name
Description
43
Int16
Setpoint 9 Transitions
to Active x1
Time accumulator counter for total hours of accumulated time.
0…999
44
Int16
Setpoint 9 Transitions
to Active x1000
The number of actuations for setpoint times 1000.
0…9999
45
Int16
Setpoint 10 Seconds
Accumulator
Time accumulator counter for seconds part of total accumulated time.
Sec
0…999
46
Int16
Setpoint 10 Minutes
Accumulator
Time accumulator counter for minutes part of total accumulated time.
Min
0…59
47
Int16
Setpoint 10 Hours
Accumulator
Time accumulator counter for total hours of accumulated time.
Hr
0…9999
48
Int16
Setpoint 10
Transitions to Active
x1
The number of actuations for setpoint times 1.
0…999
49
Int16
Setpoint 10
Transitions to Active
x1000
The number of actuations for setpoint times 1000.
0…9999
50
Int16
Setpoint 11 Seconds
Accumulator
Time accumulator counter for seconds part of total accumulated time.
Sec
0…999
51
Int16
Setpoint 11 Minutes
Accumulator
Time accumulator counter for minutes part of total accumulated time.
Min
0…59
52
Int16
Setpoint 11 Hours
Accumulator
Time accumulator counter for total hours of accumulated time.
Hr
0…9999
53
Int16
Setpoint 11
Transitions to Active
x1
The number of actuations for setpoint times 1
x1
0…999
54
Int16
Setpoint 11
Transitions to Active
x1000
The number of actuations for setpoint times 1000.
x1000
0…9999
55
Int16
Setpoint 12 Seconds
Accumulator
Time accumulator counter for seconds part of total accumulated time.
Sec
0…999
56
Int16
Setpoint 12 Minutes
Accumulator
Time accumulator counter for minutes part of total accumulated time.
Min
0…59
57
Int16
Setpoint 12 Hours
Accumulator
Time accumulator counter for total hours of accumulated time.
Hr
0…9999
58
Int16
Setpoint 12
Transitions to Active
x1
The number of actuations for setpoint times 1
x1
0…999
59
Int16
Setpoint 12
Transitions to Active
x1000
The number of actuations for setpoint times 1000.
x1000
0…9999
60
Int16
Setpoint 13 Seconds
Accumulator
Time accumulator counter for seconds part of total accumulated time.
Sec
0…999
61
Int16
Setpoint 13 Minutes
Accumulator
Time accumulator counter for minutes part of total accumulated time.
Min
0…59
62
Int16
Setpoint 13 Hours
Accumulator
Time accumulator counter for total hours of accumulated time.
Hr
0…9999
63
Int16
Setpoint 13
Transitions to Active
x1
The number of actuations for setpoint times 1
x1
0…999
64
Int16
Setpoint 13
Transitions to Active
x1000
The number of actuations for setpoint times 1000.
x1000
0…9999
326
Rockwell Automation Publication 1426-UM001G-EN-P - November 2014
Units
Range
PowerMonitor 5000 Unit Data Tables
Appendix A
Table 121 - Statistics.Setpoint_Output Data Table
Element
Number
Type
Tag Name
Description
Units
Range
65
Int16
Setpoint 14 Seconds
Accumulator
Time accumulator counter for seconds part of total accumulated time.
Sec
0…999
66
Int16
Setpoint 14 Minutes
Accumulator
Time accumulator counter for minutes part of total accumulated time.
Min
0…59
67
Int16
Setpoint 14 Hours
Accumulator
Time accumulator counter for total hours of accumulated time.
Hr
0…9999
68
Int16
Setpoint 14
Transitions to Active
x1
The number of actuations for setpoint times 1
x1
0…999
69
Int16
Setpoint 14
Transitions to Active
x1000
The number of actuations for setpoint times 1000.
x1000
0…9999
70
Int16
Setpoint 15 Seconds
Accumulator
Time accumulator counter for seconds part of total accumulated time.
Sec
0…999
71
Int16
Setpoint 15 Minutes
Accumulator
Time accumulator counter for minutes part of total accumulated time.
Min
0…59
72
Int16
Setpoint 15 Hours
Accumulator
Time accumulator counter for total hours of accumulated time.
Hr
0…9999
73
Int16
Setpoint 15
Transitions to Active
x1
The number of actuations for setpoint times 1
x1
0…999
74
Int16
Setpoint 15
Transitions to Active
x1000
The number of actuations for setpoint times 1000.
x1000
0…9999
75
Int16
Setpoint 16 Seconds
Accumulator
Time accumulator counter for seconds part of total accumulated time.
Sec
0…999
76
Int16
Setpoint 16 Minutes
Accumulator
Time accumulator counter for minutes part of total accumulated time.
Min
0…59
77
Int16
Setpoint 16 Hours
Accumulator
Time accumulator counter for total hours of accumulated time.
Hr
0…9999
78
Int16
Setpoint 16
Transitions to Active
x1
The number of actuations for setpoint times 1
x1
0…999
79
Int16
Setpoint 16
Transitions to Active
x1000
The number of actuations for setpoint times 1000.
x1000
0…9999
80
Int16
Setpoint 17 Seconds
Accumulator
Time accumulator counter for seconds part of total accumulated time.
Sec
0…999
81
Int16
Setpoint 17 Minutes
Accumulator
Time accumulator counter for minutes part of total accumulated time.
Min
0…59
82
Int16
Setpoint 17 Hours
Accumulator
Time accumulator counter for total hours of accumulated time.
Hr
0…9999
83
Int16
Setpoint 17
Transitions to Active
x1
The number of actuations for setpoint times 1
x1
0…999
84
Int16
Setpoint 17
Transitions to Active
x1000
The number of actuations for setpoint times 1000.
x1000
0…9999
85
Int16
Setpoint 18 Seconds
Accumulator
Time accumulator counter for seconds part of total accumulated time.
Sec
0…999
86
Int16
Setpoint 18 Minutes
Accumulator
Time accumulator counter for minutes part of total accumulated time.
Min
0…59
Rockwell Automation Publication 1426-UM001G-EN-P - November 2014
327
Appendix A
PowerMonitor 5000 Unit Data Tables
Table 121 - Statistics.Setpoint_Output Data Table
Element
Number
Type
Tag Name
Description
Units
Range
87
Int16
Setpoint 18 Hours
Accumulator
Time accumulator counter for total hours of accumulated time.
Hr
0…9999
88
Int16
Setpoint 18
Transitions to Active
x1
The number of actuations for setpoint times 1
x1
0…999
89
Int16
Setpoint 18
Transitions to Active
x1000
The number of actuations for setpoint times 1000.
x1000
0…9999
90
Int16
Setpoint 19 Seconds
Accumulator
Time accumulator counter for seconds part of total accumulated time.
Sec
0…999
91
Int16
Setpoint 19 Minutes
Accumulator
Time accumulator counter for minutes part of total accumulated time.
Min
0…59
92
Int16
Setpoint 19 Hours
Accumulator
Time accumulator counter for total hours of accumulated time.
Hr
0…9999
93
Int16
Setpoint 19
Transitions to Active
x1
The number of actuations for setpoint times 1
x1
0…999
94
Int16
Setpoint 19
Transitions to Active
x1000
The number of actuations for setpoint times 1000.
x1000
0…9999
95
Int16
Setpoint 20 Seconds
Accumulator
Time accumulator counter for seconds part of total accumulated time.
Sec
0…999
96
Int16
Setpoint 20 Minutes
Accumulator
Time accumulator counter for minutes part of total accumulated time.
Min
0…59
97
Int16
Setpoint 20 Hours
Accumulator
Time accumulator counter for total hours of accumulated time.
Hr
0…9999
98
Int16
Setpoint 20
Transitions to Active
x1
The number of actuations for setpoint times 1
x1
0…999
99
Int16
Setpoint 20
Transitions to Active
x1000
The number of actuations for setpoint times 1000.
x1000
0…9999
100…111
Int16
Reserved
Future Use.
328
Rockwell Automation Publication 1426-UM001G-EN-P - November 2014
0
PowerMonitor 5000 Unit Data Tables
Appendix A
Statistics.Logging
Table 122 - Table Properties
CIP Instance Number
833
PCCC File Number
N42
No. of Elements
20
Length in Words
20
Data Type
Int16
Data Access
Read Only
Table 123 - Statistics.Logging Data Table
Element
Number
Type
Tag Name
Description
Range
0
Int16
Number_of_Unit_Event_Log_Records
On a read of this table the value of this parameter is the number of Unit Event Records
available. This log is returned only by using the incremental return method.
0…100
1
Int16
Number_of_Time_of_Use_Log_Records
On a read of this table the value of this parameter is the number of Time of Use Log
Records available. 1 is the current record being updated before logging.
0…13
2
Int16
Number_of_Load_Factor_Log_Records
On a read of this table the value of this parameter is the number of Load Factor Log
Records available. 1 is the current record being updated before logging.
0…13
3
Int16
Number_of_Setpoint_Log_Records
On a read of this table the value of this parameter is the number of setpoint event records
available.
0…100
4
Int16
Number_of_Alarm_Log_Records
On a read of this table the value of this parameter is the number of Alarm event records
available.
0…100
5
Int16
Number_of_Energy_Log_Records_x1000
On a read of this table the value of this parameter is the x1000 number of Energy Log
Records available.
0…30,000
6
Int16
Number_of_Energy_Log_Records_x1
On a read of this table the value of this parameter is the x1 number of Energy Log Records
available.
0…999
7
Int16
Number_of_Data_Log_Records_x1000
On a read of this table the value of this parameter is the x1000 number of data log records
available.
0…30,000
8
Int16
Number_of_Data_Log_Records_x1
On a read of this table the value of this parameter is the x1 number of data log records
available.
0…999
9
Int16
Number_of_Data_Log_Files
Total Data Log files that have been saved
0…256
10
Int16
Number_of_Energy_Log_Files
Total Energy Log files that have been saved
0…256
11
Int16
Number_of_TriggerData_Log_Records
On a read of this table the value of this parameter is the number of Trigger data records
available.
0…3600
12
Int16
Number_of_TriggerData_Log_Files
Total trigger data files have been saved
0…60
13
Int16
Number_of_Waveform_Cycles
On a read of this table the value of this parameter is the number of waveform data cycles
available.
0…21600
14
Int16
Number_of_Waveform_Files
Total waveform files have been saved
0…256
15
Int16
Number_of_Power_Quality_Log_Records
On a read of this table the value of this parameter is the number of power quality records
available.
0…100
16
Int16
Number_of_EN50160_Weekly_Log_Reco
rds
On a read of this table, the value of this parameter is the number of EN50160 Weekly Log
Records available. ‘1’ is the current record being updated before logging.
0…8
17
Int16
Number_of_EN50160_Yearly_Log_Recor
ds
On a read of this table the value of this parameter is the number of EN50160 Yearly Log
Records available. ‘1’ is the current record being updated before logging.
0…13
18…19
Int16
Reserved
Reserved for future use.
0
Rockwell Automation Publication 1426-UM001G-EN-P - November 2014
329
Appendix A
PowerMonitor 5000 Unit Data Tables
Statistics.Setpoint_Logic (M6 and M8 model)
Table 124 - Table Properties
CIP Instance Number
828
PCCC File Number
N37
No. of Elements
112
Length in Words
112
Data Type
Int16
Data Access
Read Only
Table 125 - Statistics.Setpoint_Logic Data Table
Element Type
Number
Tag Name
Description
Units
Range
0
Int16
Level1 Gate1 Seconds
Accumulator
Time accumulator counter for seconds part of total accumulated time.
Sec
0…999
1
Int16
Level1 Gate1 Minutes
Accumulator
Time accumulator counter for minutes part of total accumulated time.
Min
0…59
2
Int16
Level1 Gate1 Hours
Accumulator
Time accumulator counter for total hours of accumulated time.
Hr
0…9999
3
Int16
Level1 Gate1 Transitions to
Active x1
The number of actuations for setpoint times 1
x1
0…999
4
Int16
Level1 Gate1 Transitions to
Active x1000
The number of actuations for setpoint times 1000.
x1000
0…9999
5
Int16
Level1 Gate2 Seconds
Accumulator
Time accumulator counter for seconds part of total accumulated time.
Sec
0…999
6
Int16
Level1 Gate2 Minutes
Accumulator
Time accumulator counter for minutes part of total accumulated time.
Min
0…59
7
Int16
Level1 Gate2 Hours
Accumulator
Time accumulator counter for total hours of accumulated time.
Hr
0…9999
8
Int16
Level1 Gate2 Transitions to
Active x1
The number of actuations for setpoint times 1
x1
0…999
9
Int16
Level1 Gate2 Transitions to
Active x1000
The number of actuations for setpoint times 1000.
x1000
0…9999
10
Int16
Level1 Gate3 Seconds
Accumulator
Time accumulator counter for seconds part of total accumulated time.
Sec
0…999
11
Int16
Level1 Gate3 Minutes
Accumulator
Time accumulator counter for minutes part of total accumulated time.
Min
0…59
12
Int16
Level1 Gate3 Hours
Accumulator
Time accumulator counter for total hours of accumulated time.
Hr
0…9999
13
Int16
Level1 Gate3 Transitions to
Active x1
The number of actuations for setpoint times 1
x1
0…999
14
Int16
Level1 Gate3 Transitions to
Active x1000
The number of actuations for setpoint times 1000.
x1000
0…9999
15
Int16
Level1 Gate4 Seconds
Accumulator
Time accumulator counter for seconds part of total accumulated time.
Sec
0…999
16
Int16
Level1 Gate4 Minutes
Accumulator
Time accumulator counter for minutes part of total accumulated time.
Min
0…59
17
Int16
Level1 Gate4 Hours
Accumulator
Time accumulator counter for total hours of accumulated time.
Hr
0…9999
330
Rockwell Automation Publication 1426-UM001G-EN-P - November 2014
PowerMonitor 5000 Unit Data Tables
Appendix A
Table 125 - Statistics.Setpoint_Logic Data Table
Element Type
Number
Tag Name
Description
Units
Range
18
Int16
Level1 Gate4 Transitions to
Active x1
The number of actuations for setpoint times 1
x1
0…999
19
Int16
Level1 Gate4 Transitions to
Active x1000
The number of actuations for setpoint times 1000.
x1000
0…9999
20
Int16
Level1 Gate5 Seconds
Accumulator
Time accumulator counter for seconds part of total accumulated time.
Sec
0…999
21
Int16
Level1 Gate5 Minutes
Accumulator
Time accumulator counter for minutes part of total accumulated time.
Min
0…59
22
Int16
Level1 Gate5 Hours
Accumulator
Time accumulator counter for total hours of accumulated time.
Hr
0…9999
23
Int16
Level1 Gate5 Transitions to
Active x1
The number of actuations for setpoint times 1
x1
0…999
24
Int16
Level1 Gate5 Transitions to
Active x1000
The number of actuations for setpoint times 1000.
x1000
0…9999
25
Int16
Level1 Gate6 Seconds
Accumulator
Time accumulator counter for seconds part of total accumulated time.
Sec
0…999
26
Int16
Level1 Gate6 Minutes
Accumulator
Time accumulator counter for minutes part of total accumulated time.
Min
0…59
27
Int16
Level1 Gate6 Hours
Accumulator
Time accumulator counter for total hours of accumulated time.
Hr
0…9999
28
Int16
Level1 Gate6 Transitions to
Active x1
The number of actuations for setpoint times 1
x1
0…999
29
Int16
Level1 Gate6 Transitions to
Active x1000
The number of actuations for setpoint times 1000.
x1000
0…9999
30
Int16
Level1 Gate7 Seconds
Accumulator
Time accumulator counter for seconds part of total accumulated time.
Sec
0…999
31
Int16
Level1 Gate7 Minutes
Accumulator
Time accumulator counter for minutes part of total accumulated time.
Min
0…59
32
Int16
Level1 Gate7 Hours
Accumulator
Time accumulator counter for total hours of accumulated time.
Hr
0…9999
33
Int16
Level1 Gate7 Transitions to
Active x1
The number of actuations for setpoint times 1
x1
0…999
34
Int16
Level1 Gate7 Transitions to
Active x1000
The number of actuations for setpoint times 1000.
x1000
0…9999
35
Int16
Level1 Gate8 Seconds
Accumulator
Time accumulator counter for seconds part of total accumulated time.
Sec
0…999
36
Int16
Level1 Gate8 Minutes
Accumulator
Time accumulator counter for minutes part of total accumulated time.
Min
0…59
37
Int16
Level1 Gate8 Hours
Accumulator
Time accumulator counter for total hours of accumulated time.
Hr
0…9999
38
Int16
Level1 Gate8 Transitions to
Active x1
The number of actuations for setpoint times 1
x1
0…999
39
Int16
Level1 Gate8 Transitions to
Active x1000
The number of actuations for setpoint times 1000.
x1000
0…9999
40
Int16
Level1 Gate9 Seconds
Accumulator
Time accumulator counter for seconds part of total accumulated time.
Sec
0…999
41
Int16
Level1 Gate9 Minutes
Accumulator
Time accumulator counter for minutes part of total accumulated time.
Min
0…59
42
Int16
Level1 Gate9 Hours
Accumulator
Time accumulator counter for total hours of accumulated time.
Hr
0…9999
Rockwell Automation Publication 1426-UM001G-EN-P - November 2014
331
Appendix A
PowerMonitor 5000 Unit Data Tables
Table 125 - Statistics.Setpoint_Logic Data Table
Element Type
Number
Tag Name
Description
Units
Range
43
Int16
Level1 Gate9 Transitions to
Active x1
The number of actuations for setpoint times 1
x1
0…999
44
Int16
Level1 Gate9 Transitions to
Active x1000
The number of actuations for setpoint times 1000.
x1000
0…9999
45
Int16
Level1 Gate10 Seconds
Accumulator
Time accumulator counter for seconds part of total accumulated time.
Sec
0…999
46
Int16
Level1 Gate10 Minutes
Accumulator
Time accumulator counter for minutes part of total accumulated time.
Min
0…59
47
Int16
Level1 Gate10 Hours
Accumulator
Time accumulator counter for total hours of accumulated time.
Hr
0…9999
48
Int16
Level1 Gate10 Transitions to
Active x1
The number of actuations for setpoint times 1
x1
0…999
49
Int16
Level1 Gate10 Transitions to
Active x1000
The number of actuations for setpoint times 1000.
x1000
0…9999
Reserved
Future Use
50…111 Int16
332
Rockwell Automation Publication 1426-UM001G-EN-P - November 2014
0
PowerMonitor 5000 Unit Data Tables
Appendix A
Command.System_Registers
Table 126 - Table Properties
CIP Instance Number
838
PCCC File Number
F47
No. of Elements
45
Length in Words
90
Data Type
Real
Data Access
Write Only
Table 127 - Command.System_Registers Data Table
Element
Number
Type
Tag Name
Description
Default
Range
0
Real
Command Word One
These commands can be sent to the power monitor. When using the optional elements the
command table must be sent complete with all elements present. If the single password table
is used to gain access to configuration items then the command can be sent alone without
optional settings. The command options are:
0 = No Action
1=Set kWh Register
2=Set kVARh Register
3=Set kVAh Register
4= Set kAh Register
5= Clear All Energy Registers
6=Set Status 1 Count
7=Set Status 2 Count
8=Set Status 3 Count
9=Set Status 4 Count
10=Force KYZ Output On
11=Force KYZ Output Off
12=Remove Force from KYZ
13=Force Relay 1 Output On
14=Force Relay 1 Output Off
15=Remove Force from Relay 1
16=Force Relay 2 Output On
17=Force Relay 2 Output Off
18=Remove Force from Relay 2
19=Force Relay 3 Output On
20=Force Relay 3 Output Off
21=Remove Force from Relay 3
22=Restore Factory Defaults
23=Reset Power Monitor System.
Important: If a command is received that is not supported by your catalog number the
command is ignored.
Important: Output forcing (command options 10…21) are not permitted if an I/O connection
(for example, Exclusive Owner, Data, or DeviceNet) is active.
0
0…23
1
Real
Command Word Two
0 = No Action
1=Clear Min/Max Records
2=Store and clear current Load Factor Record 3=Clear Load Factor Log
4=Store and clear current TOU Record
5=Clear TOU Log
6= Clear Setpoint Log
7= Clear Setpoint accumulators
8= Clear Error Log
9= Clear Energy Log
10=Clear Data Log
11=Perform Wiring Diagnostics
12=Log Off
13=Clear Trigger Data Log
14 = Trigger Waveform
15 = Clear Waveform
16 = Metering Data Snapshot
17 = Clear Power Quality Log
18 = Clear Setpoint Logic Gate Accumulators
19 = Reserved for future use.
Important: If a command is received that is not supported by your catalog number the
command is ignored.
0
0…18
2
Real
Clear Single Min/Max
Records
When invoking the Min/Max Clear command, this value can be sent to specify a single
parameter. If clearing all values this is not required.
0 = Clear All Parameters
1= Clear the 1st Min/Max Record
2= Clear the 2nd Min/Max Record . . . To the end of the Min/Max Parameters
0
0…82 (M5, M6)
0…207 (M8)
Rockwell Automation Publication 1426-UM001G-EN-P - November 2014
333
Appendix A
PowerMonitor 5000 Unit Data Tables
Table 127 - Command.System_Registers Data Table
Element
Number
Type
Tag Name
Description
Default
Range
3
Real
Clear Single Setpoint or
Logic Gate Accumulator
When invoking the Setpoint or Setpoint Logic Gate Accumulator Clear command this value
can be sent to specify a single parameter. If clearing all values this is not required.
0 = Clear All Accumulators
1= Clear the 1st time accumulator
2= Clear the 2nd time accumulator…
20= Clear the 20th time accumulator
0
0…10 (M5);
0…10,
logic gate
accumulator,
0…20 setpoints
(M6 and M8)
4
Real
Status 1 Count x M
Register Set Value
Status 1 Count Register Start Value x 1,000,000
0
0…9,999,999
5
Real
Status 1 Count X 1
Register Set Value
Status 1 Count Register Start Value x 1
0
0…999,999
6
Real
Status 2 Count x M
Register Set Value
Status 2 Count Register Start Value x 1,000,000
0
0…9,999,999
7
Real
Status 2 Count X 1
Register Set Value
Status 2 Count Register Start Value x 1
0
0…999,999
8
Real
Status 3 Count x M
Register Set Value
Status 3 Count Register Start Value x 1,000,000
0
0…9,999,999
9
Real
Status 3 Count X 1
Register Set Value
Status 3 Count Register Start Value x 1
0
0…999,999
10
Real
Status 4 Count x M
Register Set Value
Status 4 Count Register Start Value x 1,000,000
0
0…9,999,999
11
Real
Status 4 Count X 1
Register Set Value
Status 4 Count Register Start Value x 1
0
0…999,999
12
Real
GWh Fwd Register Set
Value
Sets the GWh Fwd Register to the desired Value
0
0…9,999,999
13
Real
kWh Fwd Register Set
Value
Sets the kWh Fwd Register to the desired Value
0
0…999,999
14
Real
GWh Rev Register Set
Value
Sets the GWh Rev Register to the desired Value
0
0…9,999,999
15
Real
kWh Rev Register Set
Value
Sets the kWh Rev Register to the desired Value
0
0…999,999
16
Real
GVARh Fwd Register Set
Value
Sets the GVARh Fwd Register to the desired Value
0
0…9,999,999
17
Real
kVARh Fwd Register Set
Value
Sets the kVARh Fwd Register to the desired Value
0
0…999,999
18
Real
GVARh Rev Register Set
Value
Sets the GVARh Rev Register to the desired Value
0
0…9,999,999
19
Real
kVARh Rev Register Set
Value
Sets the kVARh Rev Register to the desired Value
0
0…999,999
20
Real
GVAh Register Set Value
Sets the GVAh Register to the desired Value
0
0…9,999,999
21
Real
kVAh Register Set Value
Sets the kVAh Register to the desired Value
0
0…999,999
22
Real
GAh Register Set Value
Sets the GAh Register to the desired Value
0
0…9,999,999
23
Real
kAh Register Set Value
Sets the kAh Register to the desired Value
0
0…999,999
24
Real
Clear Waveform File ID
Waveform file identity
0 = Clear All
If the identity is not known, the command is ignored.
0
0…999
25
Real
GWh Net Register Set
Value
Sets the GWh Net Register to the desired Value.
0
±0…9,999,999
26
Real
kWh Net Register Set
Value
Sets the kWh Net Register to the desired Value.
0
±0…999,999
334
Rockwell Automation Publication 1426-UM001G-EN-P - November 2014
PowerMonitor 5000 Unit Data Tables
Appendix A
Table 127 - Command.System_Registers Data Table
Element
Number
Type
Tag Name
Description
Default
Range
27
Real
GVARh Net Register Set
Value
Sets the GVARh Net Register to the desired Value.
0
±0…9,999,999
28
Real
kVARh Net Register Set
Value
Sets the kVARh Net Register to the desired Value.
0
±0…999,999
29…44
Real
Reserved
For future use.
0
0
Command.Controller_Interface
Table 128 - Table Properties
CIP Instance Number
839
PCCC File Number
N48
No. of Elements
16
Length in Words
16
Data Type
Int16
Data Access
Write Only
Table 129 - Command.Controller_Interface Data Table
Element
Number
Type
Tag Name
Description
Default
Range
0
Int16
Controller_Command_Word
Bit 0 = When this bit is written to the power monitor it signals the end of the demand period.
The power monitor resets the bit to 0 and sends the end of demand broadcast to all of the
slaves configured for the master/slave demand system. The power monitor must be
configured as a ‘Master’ for external demand pulse input.
Bit 1…Bit 15 = Reserved
0
0…1
1…15
Int16
Reserved
Future Use
0
0
Rockwell Automation Publication 1426-UM001G-EN-P - November 2014
335
Appendix A
PowerMonitor 5000 Unit Data Tables
Command.Wiring_Corrections
Table 130 - Table Properties
CIP Instance Number
840
PCCC File Number
N49
No. of Elements
14
Length in Words
14
Data Type
Int16
Data Access
Write Only
Table 131 - Command.Wiring_Corrections Data Table
Element
Number
Type
Tag Name
Description
Default
Range
0
Int16
Wiring_Correction_Commands
0 = No command
1 = Correct wiring by using Range 1 results, Lagging 97 PF to Leading 89 PF
2 = Correct wiring by using Range 2 results, Lagging 85 PF to leading 98 PF
3 = Correct wiring by using Range 3 results, Lagging 52 PF to lagging 95 PF
4 = Correct wiring by using manual input parameters
5 = Remove all wiring corrections.
0
0…5
1
Int16
Input_V1_Mapping
This parameter logically maps a physical voltage channel to V1.
1 = V1
2 = V2
3 = V3
-1 = V1 inverted
-2 = V2 inverted
-3 = V3 inverted
1
-3…-1
1…3
2
Int16
Input_V2_Mapping
This parameter logically maps a physical voltage channel to V2.
1 = V1
2 = V2
3 = V3
-1 = V1 inverted
-2 = V2 inverted
-3 = V3 inverted
2
-3…-1
1…3
3
Int16
Input_V3_Mapping
This parameter logically maps a physical voltage channel to V3.
1 = V1
2 = V2
3 = V3
-1 = V1 inverted
-2 = V2 inverted
-3 = V3 inverted
3
-3… -1
1…3
4
Int16
Input_I1_Mapping
This parameter logically maps a physical current channel to I1.
1 = I1
2 = I2
3 = I3
-1 = I1 inverted
-2 = I2 inverted
-3 = I3 inverted
1
-3…-1
1…3
336
Rockwell Automation Publication 1426-UM001G-EN-P - November 2014
PowerMonitor 5000 Unit Data Tables
Appendix A
Table 131 - Command.Wiring_Corrections Data Table
Element
Number
Type
Tag Name
Description
Default
Range
5
Int16
Input_I2_Mapping
This parameter logically maps a physical current channel to I2.
1 = I1
2 = I2
3 = I3
-1 = I1 inverted
-2 = I2 inverted
-3 = I3 inverted
2
-3… -1
1…3
6
Int16
Input_I3_Mapping
This parameter logically maps a physical current channel to I3.
1 = I1
2 = I2
3 = I3
-1 = I1 inverted
-2 = I2 inverted
-3 = I3 inverted
3
-3… -1
1…3
7…13
Int16
Reserved
Future Use
0
0
Rockwell Automation Publication 1426-UM001G-EN-P - November 2014
337
Appendix A
PowerMonitor 5000 Unit Data Tables
MeteringResults.RealTime_VIF_Power
Table 132 - Table Properties
CIP Instance Number
844
PCCC File Number
F53
No. of Elements
56
Length in Words
112
Data Type
Real
Data Access
Read Only
Table 133 - MeteringResults.RealTime_VIF_Power Data Table
Element
Number
Type
Tag Name
Description
Units
Range
0
Real
Metering Date Stamp
Date of cycle collection MM:DD:YY
MM:DD:YY
0…123199
1
Real
Metering Time Stamp
Time of cycle collection HH:MM:SS
HH:MM:SS
0…235959
2
Real
Metering Microsecond Stamp
Microsecond of cycle collection
uS
0.000…999,999
3
Real
V1_N_Volts
V1 to N true RMS voltage
V
0…9.999E15
4
Real
V2_N_Volts
V2 to N true RMS voltage
V
0…9.999E15
5
Real
V3_N_Volts
V3 to N true RMS voltage
V
0…9.999E15
6
Real
VN_G_Volts
VN to G true RMS voltage
V
0…9.999E15
7
Real
Avg_V_N_Volts
Average of V1, V2 and V3
V
0…9.999E15
8
Real
V1_V2_Volts
V1 to V2 true RMS voltage
V
0…9.999E15
9
Real
V2_V3_Volts
V2 to V3 true RMS voltage
V
0…9.999E15
10
Real
V3_V1_Volts
V3 to V1 true RMS voltage
V
0…9.999E15
11
Real
Avg_VL_VL_Volts
Average of V1_V2, V2_V3 and V3_V1
V
0…9.999E15
12
Real
I1_Amps
I1 true RMS amps
A
0…9.999E15
13
Real
I2_Amps
I2 true RMS amps
A
0…9.999E15
14
Real
I3_Amps
I3 true RMS amps
A
0…9.999E15
15
Real
I4_Amps
I4 true RMS amps
A
0…9.999E15
16
Real
Avg_Amps
Average I1, I2 and I3 amps
A
0…9.999E15
17
Real
Frequency_Hz
Last Line Frequency Calculated
Hz
40.00…70.00
18
Real
Avg_Frequency_Hz
Average Frequency over 6 cycles
Hz
40.00…70.00
19
Real
L1_kW
L1 real power
kW
-9.999E15…9.999E15
20
Real
L2_kW
L2 real power
kW
-9.999E15…9.999E15
21
Real
L3_kW
L3 real power
kW
-9.999E15…9.999E15
22
Real
Total_kW
Total real power
kW
-9.999E15…9.999E15
23
Real
L1_kVAR
L1 reactive power
kVAR
-9.999E15…9.999E15
24
Real
L2_kVAR
L2 reactive power
kVAR
-9.999E15…9.999E15
25
Real
L3_kVAR
L3 reactive power
kVAR
-9.999E15…9.999E15
26
Real
Total_kVAR
Total reactive power
kVAR
-9.999E15…9.999E15
27
Real
L1_kVA
L1 apparent power
kVA
0…9.999E15
28
Real
L2_kVA
L2 apparent power
kVA
0…9.999E15
338
Rockwell Automation Publication 1426-UM001G-EN-P - November 2014
PowerMonitor 5000 Unit Data Tables
Appendix A
Table 133 - MeteringResults.RealTime_VIF_Power Data Table
Element
Number
Type
Tag Name
Description
Units
Range
29
Real
L3_kVA
L3 apparent power
kVA
0…9.999E15
30
Real
Total_kVA
Total apparent power
kVA
0…9.999E15
31
Real
L1_True_PF_%
L1 true power factor (full bandwidth)
%
0.00…100.00
32
Real
L2_True_PF_%
L2 true power factor (full bandwidth)
%
0.00…100.00
33
Real
L3_True_PF_%
L3 true power factor (full bandwidth)
%
0.00…100.00
34
Real
Total_True_PF
Total true power factor
%
0.00…100.00
35
Real
L1_Disp_PF
L1 displacement power factor (fundamental only)
%
0.00…100.00
36
Real
L2_Disp_PF
L2 displacement power factor (fundamental only)
%
0.00…100.00
37
Real
L3_Disp_PF
L3 displacement power factor (fundamental only)
%
0.00…100.00
38
Real
Total_Disp_PF
Total displacement power factor (fundamental only)
%
0.00…100.00
39
Real
L1_PF_Lead_Lag_Indicator
L1 lead or lag indicator for power factor
1 = leading
-1 = lagging
-1…1
40
Real
L2_PF_Lead_Lag_Indicator
L2 lead or lag indicator for power factor
1 = leading
-1 = lagging
-1…1
41
Real
L3_PF_Lead_Lag_Indicator
L3 lead or lag indicator for power factor
1 = leading
-1 = lagging
-1…1
42
Real
Total_PF_Lead_Lag_Indicator
Total lead or lag indicator for power factor
1 = leading
-1 = lagging
-1…1
43
Real
Voltage Rotation
Voltage rotation has the following designations:
0 = Not metering
123 = ABC rotation
132 = ACB rotation
4 = No rotation
0…132
44
Real
Metering_Iteration
A number 0…9,999,999 that indicates that the metering
functions and internal communication are updating
0…9,999,999
45…55
Real
Resvd
Reserved
Rockwell Automation Publication 1426-UM001G-EN-P - November 2014
339
Appendix A
PowerMonitor 5000 Unit Data Tables
MeteringResults.Energy_Demand
Table 134 - Table Properties
CIP Instance Number
846
PCCC File Number
F55
No. of Elements
56
Length in Words
112
Data Type
Real
Data Access
Read Only
Table 135 - MeteringResults.Energy_Demand Data Table
Element
Number
Type
Tag Name
Description
Units
Range
0
Real
Status_1_Count_xM
Status 1 Count times 1,000,000
0…9,999,999
1
Real
Status_1_Count_x1
Status 1 count times 1
0…999,999
2
Real
Status_2_Count_xM
Status 2 Count times 1,000,000
0…9,999,999
3
Real
Status_2_Count_x1
Status 2 count times 1
0…999,999
4
Real
Status_3_Count_xM
Status 3 Count times 1,000,000
0…9,999,999
5
Real
Status_3_Count_x1
Status 3 count times 1
0…999,999
6
Real
Status_4_Count_xM
Status 4 Count times 1,000,000
0…9,999,999
7
Real
Status_4_Count_x1
Status 4 count times 1
0…999,999
8
Real
GWh_Fwd
Forward gigawatt hours
GWh
0…9,999,999
9
Real
kWh_Fwd
Forward kilowatt hours
kWh
0.000…999,999
10
Real
GWh_Rev
Reverse gigawatt hours
GWh
0…9,999,999
11
Real
kWh_Rev
Reverse kilowatt hours
kWh
0.000…999,999
12
Real
GWh_Net
Net gigawatt hours
GWh
±0…9,999,999
13
Real
kWh_Net
Net kilowatt hours
kWh
±0.000…999,999
14
Real
GVARH_Fwd
Forward gigaVAR hours
GVARh
0…9,999,999
15
Real
kVARh_Fwd
Forward kiloVAR hours
kVARh
0.000…999,999
16
Real
GVARH_Rev
Reverse gigaVAR hours
GVARh
0…9,999,999
17
Real
kVARh_Rev
Reverse kiloVAR hours
kVARh
0.000…999,999
18
Real
GVARH_Net
Net gigaVAR hours
GVARh
±0 …9,999,999
19
Real
kVARh_Net
Net kiloVAR hours
kVARh
±0.000…999,999
20
Real
GVAh
Net gigaVA hours
GVAh
0…9,999,999
21
Real
kVAh
Net kiloVA hours
kVAh
0.000…999,999
22
Real
GAh
Net giga Amp hours
GAh
0…9,999,999
23
Real
kAh
Net kilo Amp hours
kAh
0.000…999,999
24
Real
kW_Demand
The average real power during the last demand period
kW
±0.000…9,999,999
25
Real
kVAR_Demand
The average reactive power during the last demand period
kVAR
±0.000…9,999,999
26
Real
kVA_Demand
The average apparent power during the last demand period
kVA
0.000… 9,999,999
27
Real
Demand_PF
The average PF during the last demand period
PF
-100.0…100.0
28
Real
Demand_Amps
The average demand for amperes during the last demand period
A
0.000…9,999,999
340
Rockwell Automation Publication 1426-UM001G-EN-P - November 2014
PowerMonitor 5000 Unit Data Tables
Appendix A
Table 135 - MeteringResults.Energy_Demand Data Table
Element
Number
Type
Tag Name
Description
Units
Range
29
Real
Projected_kW_Demand
The projected total real power for the current demand period
kW
±0.000…9,999,999
30
Real
Projected_kVAR_Demand
The projected total reactive power for the current demand period
kVAR
±0.000…9,999,999
31
Real
Projected_kVA_Demand
The projected total apparent power for the current demand period
kVA
0.000…9,999,999
32
Real
Projected_Ampere_Demand
The projected total amperes for the current demand period
A
0.000…9,999,999
33
Real
Elapsed_Demand_Period_Time
The amount of time that has elapsed during the current demand
period
Min
0.00…59.99
34…55
Real
Reserved
For future use
0
0
MeteringResults.EN61000_4_30_VIP (M8 only)
Table 136 - Table Properties
CIP Instance Number
880
PCCC File Number
F89
No. of Elements
43
Length in Words
86
Data Type
Real
Data Access
Read only
Applies to
M8 only
Table 137 - MeteringResults.EN61000_4_30_VIP
Element
Number
Type
Tag Name
Description
Units
Range
0
Real
200mS_Metering_Date_Stamp
Date of cycle collection MM:DD:YY
MMDDYY
0…123199
1
Real
200mS_Metering_Time_Stamp
Time of cycle collection HH:MM:SS
hhmmss
0…235959
2
Real
200mS_Metering_uSecond_Stamp
Microsecond of cycle collection
uS
0.000…999,999
3
Real
200mS_V1_N_Magnitude
V1 to N true RMS voltage
V
0…9.999E15
4
Real
200mS_V2_N_Magnitude
V2 to N true RMS voltage
V
0…9.999E15
5
Real
200mS_V3_N_Magnitude
V3 to N true RMS voltage
V
0…9.999E15
6
Real
200mS_VN_G_Magnitude
VN to G true RMS voltage
V
0…9.999E15
7
Real
200mS_VN_Ave_Magnitude
Average of V1, V2 and V3.
V
0…9.999E15
8
Real
200mS_V1_V2_Magnitude
V1 to V2 true RMS voltage
V
0…9.999E15
9
Real
200mS_V2_V3_Magnitude
V2 to V3 true RMS voltage
V
0…9.999E15
10
Real
200mS_V3_V1_Magnitude
V3 to V1 true RMS voltage
V
0…9.999E15
11
Real
200mS_VV_Ave_Magnitude
Average of V1_V2, V2_V3 and V3_V1
V
0…9.999E15
12
Real
200mS_I1_Amps_Magnitude
I1 true RMS amps
A
0…9.999E15
13
Real
200mS_I2_Amps_Magnitude
I2 true RMS amps
A
0…9.999E15
14
Real
200mS_I3_Amps_Magnitude
I3 true RMS amps
A
0…9.999E15
15
Real
200mS_I4_Amps_Magnitude
I4 true RMS amps
A
0…9.999E15
16
Real
200mS_Amps_Ave_Magnitude
Average I1, I2 and I3 amps.
A
0…9.999E15
Rockwell Automation Publication 1426-UM001G-EN-P - November 2014
341
Appendix A
PowerMonitor 5000 Unit Data Tables
Table 137 - MeteringResults.EN61000_4_30_VIP
Element
Number
Type
Tag Name
Description
Units
Range
17
Real
200mS_L1_kW
L1 real power
kW
-9.999E15…
9.999E15
18
Real
200mS_L2_kW
L2 real power
kW
-9.999E15…
9.999E15
19
Real
200mS_L3_kW
L3 real power
kW
-9.999E15…
9.999E15
20
Real
200mS_Total_kW
Total real power
kW
-9.999E15…
9.999E15
21
Real
200mS_L1_kVAR
L1 reactive power
kVAR
-9.999E15…
9.999E15
22
Real
200mS_L2_ kVAR
L2 reactive power
kVAR
-9.999E15…
9.999E15
23
Real
200mS_L3_ kVAR
L3 reactive power
kVAR
-9.999E15…
9.999E15
24
Real
200mS_Total_ kVAR
Total reactive power
kVAR
-9.999E15…
9.999E15
25
Real
200mS_L1_kVA
L1 apparent power
kVA
0…9.999E15
26
Real
200mS_L2_ kVA
L2 apparent power
kVA
0…9.999E15
27
Real
200mS_L3_ kVA
L3 apparent power
kVA
0…9.999E15
28
Real
200mS_Total_ kVA
Total apparent power
kVA
0…9.999E15
29
Real
200mS_L1_True_PF
L1 true power factor (full bandwidth)
%
0.00…100.00
30
Real
200mS_L2_True_PF
L2 true power factor (full bandwidth)
%
0.00…100.00
31
Real
200mS_L3_True_PF
L3 true power factor (full bandwidth)
%
0.00…100.00
32
Real
200mS_Total_True_PF
Average true power factor
%
0.00…100.00
33
Real
200mS_L1_Disp_PF
L1 displacement power factor (fundamental only)
%
0.00…100.00
34
Real
200mS_L2_Disp_PF
L2 displacement power factor (fundamental only)
%
0.00…100.00
35
Real
200mS_L3_Disp_PF
L3 displacement power factor (fundamental only)
%
0.00…100.00
36
Real
200mS_Total_Disp_PF
Average displacement power factor (fundamental only)
%
0.00…100.00
37
Real
200mS_L1_PF_LeadLag_Indicator
L1 lead or lag indicator for power factor 1 = leading, -1 =
lagging.
-
-1…1
38
Real
200mS_L2_PF_LeadLag_Indicator
L2 lead or lag indicator for power factor 1 = leading, -1 =
lagging.
-
-1…1
39
Real
200mS_L3_PF_LeadLag_Indicator
L3 lead or lag indicator for power factor 1 = leading, -1 =
lagging.
-
-1…1
40
Real
200mS_Total_PF_LeadLag_Indicator Total lead or lag indicator for power factor 1 = leading, -1
= lagging
-
-1…1
41
Real
200mS_Sag_Swell_Status_Flag
A flag indicating 200ms result has been calculated during
a Sag, Swell or Interruption.
#
0…1
42
Real
200mS_Metering_Iteration
A number 0…9,999,999 that indicates that the metering
functions and internal communications are updating.
#
9,999,999
342
Rockwell Automation Publication 1426-UM001G-EN-P - November 2014
PowerMonitor 5000 Unit Data Tables
Appendix A
LoggingResults.DataLog_FileName
Table 138 - Table Properties
CIP Instance Number
849
PCCC File Number
ST58
No. of Elements
1
Length in Words
32
Data Type
String
Data Access
Read Only
Table 139 - LoggingResults.DataLog_FileName Data Table
Element Number
Type
Tag Name
Description
Default
Range
0
String
Data_Log_File_Name
64 character file name: Datalog_YYYYMMDD_HHMMSS_hh
‘/0’ indicates no more file names to return.
‘/0’
File name or ‘/0’
LoggingResults.EnergyLog_FileName
Table 140 - Table Properties
CIP Instance Number
850
PCCC File Number
ST59
No. of Elements
1
Length in Words
32
Data Type
String
Data Access
Read Only
Table 141 - LoggingResults.EnergyLog_FileName Data Table
Element Number
Type
Tag Name
Description
Default
Range
0
String
Energy_Log_File_Name
64 character file name: Energylog_YYYYMMDD_HHMMSS_hh
‘/0’ indicates no more file names to return.
‘/0’
File name or ‘/0’
Rockwell Automation Publication 1426-UM001G-EN-P - November 2014
343
Appendix A
PowerMonitor 5000 Unit Data Tables
LoggingResults.Data_Log
Table 142 - Table Properties
CIP Instance Number
851
PCCC File Number
F60
No. of Elements
38
Length in Words
76
Data Type
Real
Data Access
Read Only
Table 143 - LoggingResults.Data_Log Data Table
Element
Number
Type
Tag Name
Description
0
Real
Record_Indicator
Indicates the meaning of the data in the record
1
Real
Data_Record_Identifier
If Record_Indicator =1, internal unique record number
If Record_Indicator =2, total records number in the log file
#
±0…9.999E15
2
Real
Data_Timestamp_Year
YYYY
2010…2100
3
Real
Data_Timestamp_Month_Day
If Record_Indicator =1, the date and time when the record was
recorded
otherwise 0
MMDD
0101…1231
4
Real
Data_Timestamp_Hour_Minute
HHMM
0000…2359
5
Real
Data_Timestamp Sec_ms
SSms
00000…59999
6
Real
DataLog_Parameter_1
7
Real
DataLog_Parameter_2
8
Real
DataLog_Parameter_3
±0…9.999E15
9
Real
DataLog_Parameter_4
±0…9.999E15
10
Real
DataLog_Parameter_5
±0…9.999E15
11
Real
DataLog_Parameter_6
±0…9.999E15
12
Real
DataLog_Parameter_7
±0…9.999E15
13
Real
DataLog_Parameter_8
±0…9.999E15
14
Real
DataLog_Parameter_9
±0…9.999E15
15
Real
DataLog_Parameter_10
±0…9.999E15
16
Real
DataLog_Parameter_11
±0…9.999E15
17
Real
DataLog_Parameter_12
±0…9.999E15
18
Real
DataLog_Parameter_13
±0…9.999E15
19
Real
DataLog_Parameter_14
±0…9.999E15
20
Real
DataLog_Parameter_15
±0…9.999E15
21
Real
DataLog_Parameter_16
±0…9.999E15
22
Real
DataLog_Parameter_17
±0…9.999E15
23
Real
DataLog_Parameter_18
±0…9.999E15
344
If Record_Indicator =1, parameter value
If Record_Indicator =2 = parameter index: reference to Data Log
Parameter List table(1)
Rockwell Automation Publication 1426-UM001G-EN-P - November 2014
Unit
Range
0 = No record returned
1 = the record contains
parameter values
2 = the record contains
a reference to the item
description
3 = log file not found.
±0…9.999E15
±0…9.999E15
PowerMonitor 5000 Unit Data Tables
Appendix A
Table 143 - LoggingResults.Data_Log Data Table
Element
Number
Type
Tag Name
Description
Unit
Range
24
Real
DataLog_Parameter_19
25
Real
DataLog_Parameter_20
If Record_Indicator =1, parameter value
If Record_Indicator =2 = parameter index: reference to Data Log
Parameter List table(1)
26
Real
DataLog_Parameter_21
±0…9.999E15
27
Real
DataLog_Parameter_22
±0…9.999E15
28
Real
DataLog_Parameter_23
±0…9.999E15
29
Real
DataLog_Parameter_24
±0…9.999E15
30
Real
DataLog_Parameter_25
±0…9.999E15
31
Real
DataLog_Parameter_26
±0…9.999E15
32
Real
DataLog_Parameter_27
±0…9.999E15
33
Real
DataLog_Parameter_28
±0…9.999E15
34
Real
DataLog_Parameter_29
±0…9.999E15
35
Real
DataLog_Parameter_30
±0…9.999E15
36
Real
DataLog_Parameter_31
±0…9.999E15
37
Real
DataLog_Parameter_32
±0…9.999E15
±0…9.999E15
±0…9.999E15
(1) The selectable Data Log parameters and their indexes are listed in the Data_Log_Parameter_Table .
Rockwell Automation Publication 1426-UM001G-EN-P - November 2014
345
Appendix A
PowerMonitor 5000 Unit Data Tables
LoggingResults.Energy_Log
Table 144 - Table Properties
CIP Instance Number
852
PCCC File Number
F61
No. of Elements
35
Length in Words
70
Data Type
Real
Data Access
Read Only
Table 145 - LoggingResults.Energy_Log Data Table
Element
Number
Type
Tag Name
Description
0
Real
Record_Indicator
Indicate meanings of the data in the record
1
Real
Energy_ Record_Identifier.
Internal unique record number
#
2
Real
Energy_Timestamp_Year
The date and time when the record was recorded
YYYY
2010…2100
3
Real
Energy_Timestamp_Mth_Day
MMDD
0101…1231
4
Real
Energy_Timestamp_Hr_Min
HHMM
0000…2359
5
Real
Energy_Timestamp Sec_ms
SSms
00000…59999
6
Real
Status 1 Count xM
xM
0…9,999,999
7
Real
Status 1 Count x1
x1
0…999,999
8
Real
Status 2 Count xM
xM
0…9,999,999
9
Real
Status 2 Count x1
x1
0…999,999
10
Real
Status 3 Count xM
xM
0…9,999,999
x1
0…999,999
xM
0…9,999,999
x1
0…999,999
Status 1 Count
Status 2 Count
Status 3 Count
Unit
Range
0 = No record returned
1 = the record contains
parameter values
2 = Reserved
3 = log file not found.
±0…9.999E15
11
Real
Status 3 Count x1
12
Real
Status 4 Count xM
13
Real
Status 4 Count x1
14
Real
GWh Fwd
Forward gigawatt hours
GWh
0…9,999,999
15
Real
kWh Fwd
Forward kilowatt hours
kWh
0.000…999,999
16
Real
GWh Rev.
Reverse gigawatt hours
GWh
0…9,999,999
17
Real
kwh Rev.
Reverse kilowatt hours
kWh
0.000…999,999
18
Real
GWh Net
Net gigawatt hours
GWh
±0…9,999,999
19
Real
kWh Net
Net kilowatt hours
kWh
±0.000…999,999
Status 4 Count
20
Real
GVARH Fwd
Forward gigaVAR hours
GVARh
0…9,999,999
21
Real
kVARh Fwd
Forward kiloVAR hours
kVARh
0.000…999.999
22
Real
GVARH Rev.
Reverse gigaVAR hours
GVARh
0…9,999,999
23
Real
kVARh Rev.
Reverse kiloVAR hours
kVARh
0.000…999.1000
24
Real
GVARH Net
Net gigaVAR hours
GVARh
±0…9,999,999
25
Real
kVARh Net
Net kiloVAR hours
kVARh
±0.000…999,999
346
Rockwell Automation Publication 1426-UM001G-EN-P - November 2014
PowerMonitor 5000 Unit Data Tables
Appendix A
Table 145 - LoggingResults.Energy_Log Data Table
Element
Number
Type
Tag Name
Description
Unit
Range
26
Real
GVAh Net
Net gigaVA hours
GVAh
0…9,999,999
27
Real
kVAh
Net kiloVA hours
kVAh
0.000…999,999
28
Real
kW Demand
The average real power during the last demand period
kW
± 0.000…9,999,999
29
Real
kVAR Demand
The average reactive power during the last demand period
kVAR
± 0.000…9,999,999
30
Real
kVA Demand
The average apparent power during the last demand period
kVA
0.000…9,999,999
31
Real
Demand PF
The average PF during the last demand period
PF
-100.0…100.0
32
Real
Projected kW Demand
The projected total real power for the current demand period
kW
± 0.000…9,999,999
33
Real
Projected kVAR Demand
The projected total reactive power for the current demand period
kVAR
± 0.000…9,999,999
34
Real
Projected kVA Demand
The projected total apparent power for the current demand period
kVA
0.000…9,999,999
Rockwell Automation Publication 1426-UM001G-EN-P - November 2014
347
Appendix A
PowerMonitor 5000 Unit Data Tables
LoggingResults.LoadFactor.Log
Table 146 - Table Properties
CIP Instance Number
853
PCCC File Number
F62
No. of Elements
40
Length in Words
80
Data Type
Real
Data Access
Read Only
Table 147 - LoggingResults.LoadFactor.Log Data Table
Element
Number
Type
Tag Name
Description
Units
Range
0
Real
LoadFactor_Record_Number
The record number of this data.
#
1…13
1
Real
LoadFactor_End_Date
The date that this record was stored.
YYMMDD
0…999,999
2
Real
LoadFactor_Elapsed_Time
Amount of time (in hours) that has elapsed since the last clear of the peak and
average values. Updated at the end of each demand interval.
Hr
0.000…
9,999,999
3
Real
Peak_Demand _kW
The largest magnitude demand for kwatts that occurred over all of the
demand intervals since the last clear command or auto-clear day.
kW
±0.000… 9,999,999
4
Real
Average_Demand_kW
A running average of demand for kwatts from the end of each demand period
since the last clear command or auto-clear day.
kW
±0.000… 9,999,999
5
Real
LoadFactor_kW
Average Demand kW/Peak Demand kW. This is a demand management
metric that indicates how ‘spiky’ (or ‘level’) a load is over a period of time
(usually 1 month). A value approaching 100% indicates a constant load.
%
0…100 %
6
Real
Peak_Demand_kVAR
The largest magnitude demand for kVAR that occurred over all of the demand
intervals since the last clear command or auto-clear day.
kVAR
±0.000… 9,999,999
7
Real
Average_Demand_kVAR
A running average of demand for kVAR from the end of each demand period
since the last clear command or auto-clear day.
kVAR
±0.000… 9,999,999
8
Real
LoadFactor_kVAR
Average Demand kVAR/Peak Demand kVAR. This is a demand management
metric that indicates how ‘spiky’ (or ‘level’) a load is over a period of time
(usually 1 month). A value approaching 100% indicates a constant load.
%
0…100 %
9
Real
Peak_Demand_kVA
The largest magnitude demand for kVA that occurred over all of the demand
intervals since the last clear command or auto-clear day.
kVA
0.000… 9,999,999
10
Real
Average_Demand_kVA
A running average of demand for kVA from the end of each demand period
since the last clear command or auto-clear day.
kVA
0.000… 9,999,999
11
Real
LoadFactor_kVA
Average Demand kVA / Peak Demand kVA. This is a demand management
metric that indicates how ‘spiky’ (or ‘level’) a load is over a period of time
(usually 1 month). A value approaching 100% indicates a constant load.
%
0…100 %
12…39
Real
Resvd
Reserved
348
Rockwell Automation Publication 1426-UM001G-EN-P - November 2014
0
PowerMonitor 5000 Unit Data Tables
Appendix A
LoggingResults.TOU.Log
Table 148 - Table Properties
CIP Instance Number
854
PCCC File Number
F63
No. of Elements
38
Length in Words
76
Data Type
Real
Data Access
Read Only
Table 149 - LoggingResults.TOU.Log Data Table
Element
Number
Type
Tag Name
Description
Units
Range
0
Real
TOU_Record_Number
The record number of the log. Record 1 is always the current record
before being logged
1
Real
TOU_ Start_Date
The Date this record was started
YYMMDD
0…999,999
2
Real
TOU_End_Date
The Date this record was ended
YYMMDD
0…999,999
3
Real
Off_Peak_GWh_Net
Net Off Peak gigawatt hours
GWh
±0…9,999,999
4
Real
Off_Peak_kWh_Net
Net Off Peak kilowatt hours
kWh
±0.000…999,999
5
Real
Off_Peak_kW_Demand
Off Peak Demand for kilowatts
kW
±0.000…9,999,999
6
Real
Mid_Peak_GWh_Net
Net Mid Peak gigawatt hours
GWh
±0…9,999,999
7
Real
Mid_Peak_kWh_Net
Net Mid Peak kilowatt hours
kWh
±0.000…999,999
8
Real
Mid_Peak_kW_Demand
Mid Peak Demand for kilowatts
kW
±0.000…9,999,999
9
Real
On_Peak_GWh_Net
Net On Peak gigawatt hours
GWh
±0.000…9,999,999
10
Real
On_Peak_kWh_Net
Net On Peak kilowatt hours
kWh
±0…999,999
11
Real
On_Peak_kW_Demand
On Peak Demand for kilowatts
kW
±0.000…9,999,999
12
Real
Off_Peak_GVARh_Net
Net Off peak gigaVAR hours
GVARh
±0…9,999,999
13
Real
Off_Peak_kVARh_Net
Net Off Peak kiloVAR hours
kVARh
±0.000…999,999
14
Real
Off_Peak_kVAR_Demand
Off Peak Demand for kiloVAR
kVAR
±0.000…9,999,999
1…13
15
Real
Mid_Peak_GVARh_Net
Net Mid Peak gigaVAR hours
GVARh
±0…9,999,999
16
Real
Mid_Peak_kVARh_Net
Net Mid Peak kiloVAR hours
kVARh
±0.000…999,999
17
Real
Mid_Peak_kVAR_Demand
Mid Peak Demand for kiloVAR
kVAR
±0.000…9,999,999
18
Real
On_Peak_GVARh_Net
Net On Peak gigaVAR hours
GVARh
±0.000…9,999,999
19
Real
On_Peak_kVARh_Net
Net On Peak kiloVAR hours
kVARh
±0…999,999
20
Real
On_Peak_kVAR_Demand
On Peak Demand for kiloVAR
kVAR
±0.000…9,999,999
21
Real
Off_Peak _GVAh_Net
Net Off peak gigaVA hours
GVAh
0…9,999,999
22
Real
Off_Peak_kVAh_Net
Net Off Peak kiloVA hours
kVAh
0.000…999,999
23
Real
Off_Peak_kVA_Demand
Off Peak Demand for kiloVA
kVA
0.000…9,999,999
24
Real
Mid_Peak_GVAh_Net
Net Mid Peak gigaVA hours
GVAh
0…9,999,999
25
Real
Mid_Peak_kVAh_Net
Net Mid Peak kiloVA hours
kVAh
0.00…999,999
26
Real
Mid_Peak_kVA_Demand
Mid Peak Demand for kiloVA
kVA
0.000…9,999,999
27
Real
On_Peak_GVAh_Net
Net On Peak gigaVA hours
GVAh
0.000…9,999,999
Rockwell Automation Publication 1426-UM001G-EN-P - November 2014
349
Appendix A
PowerMonitor 5000 Unit Data Tables
Table 149 - LoggingResults.TOU.Log Data Table
Element
Number
Type
Tag Name
Description
Units
Range
28
Real
On_Peak_kVAh_Net
Net On Peak kiloVA hours
kVAh
0…999,999
29
Real
On_Peak_kVA_Demand
On Peak Demand for kiloVA
kVA
0.000…9,999,999
30…37
Real
Resvd
Reserved
0
LoggingResults.MIN_MAX.Log
Table 150 - Table Properties
CIP Instance Number
855
PCCC File Number
F64
No. of Elements
11
Length in Words
22
Data Type
Real
Data Access
Read Only
Table 151 - LoggingResults.MIN_MAX.Log Data Table
Element
Number
Type
Tag Name
Description
Units
Range
0
Real
MinMax_Parameter_Number
The number of the parameter from the MIN_MAX parameter list.
1…82 (M5, M6)
1…207 (M8)
1
Real
MIN_Value
The minimum value recorded since the last MIN_MIX clear.
-9.999E15…9.999E15
2
Real
MAX_Value
The maximum value recorded since the last MIN_MIX clear.
-9.999E15…9.999E15
3
Real
Timestamp_MIN_Year
The year at which this MIN record was logged.
YYYY
0…9999
4
Real
Timestamp_MIN_Mth_Day
The month and day this MIN record was logged.
MMDD
0…1231
5
Real
Timestamp_MIN_Hr_Min
The hour and minute this MIN record was logged.
hhmm
0…2359
6
Real
Timestamp_MIN_Sec_ms
The seconds and milliseconds this MIN record was logged.
SSms
0…59,999
7
Real
Timestamp_MAX_Year
The year at which this MAX record was logged.
YYYY
0…9999
8
Real
Timestamp_MAX_Mth_Day
The month and day this MAX record was logged.
MMDD
0…1231
9
Real
Timestamp_MAX_Hr_Min
The hour and minute this MAX record was logged.
hhmm
0…2359
10
Real
Timestamp_MAX_Sec_ms
The seconds and milliseconds this MAX record was logged.
SSms
0…59,999
350
Rockwell Automation Publication 1426-UM001G-EN-P - November 2014
PowerMonitor 5000 Unit Data Tables
Appendix A
LoggingResults.Alarm_Log
Table 152 - Table Properties
CIP Instance Number
856
PCCC File Number
N65
No. of Elements
7
Length in Words
7
Data Type
Int16
Data Access
Read Only
Table 153 - LoggingResults.Alarm_Log Data Table
Element
Number
Type
Tag Name
Description
0
Int16
Alarm_Record_Identifier
Used to verify record sequence when returning multiple records.
1
Int16
Alarm_Timestamp_Year
The year when the record was recorded.
YYYY
2010…2100
2
Int16
Alarm_Timestamp_Mth_Day
The month and day when the record was recorded.
MMDD
11…1231
3
Int16
Alarm_Timestamp_Hr_Min
The hour and minute when the record was recorded.
HHMM
0…2359
4
Int16
Alarm_Timestamp_Sec_ms
The seconds and milliseconds when the record was recorded.
SSms
0…59,999
5
Int16
Alarm Type
Indicates the type of event that has occurred.
0…65535
6
Int16
Alarm Code
Indicates information about the alarm.
0…65535
Rockwell Automation Publication 1426-UM001G-EN-P - November 2014
Unit
Range
1…100
351
Appendix A
PowerMonitor 5000 Unit Data Tables
LoggingResults.Event_Log
Table 154 - Table Properties
CIP Instance Number
857
PCCC File Number
N66
No. of Elements
9
Length in Words
9
Data Type
Int16
Data Access
Read Only
Table 155 - LoggingResults.Event_Log Data Table
Element
Number
Type
Tag Name
Description
Unit
Range
0
Int16
Event_Record_Identifier
Used to verify record sequence when returning multiple records.
1
Int16
Event_Timestamp_Year
The year when the record was recorded.
YYYY
2010…2100
2
Int16
Event_Timestamp_Mth_Day
The month and day when the record was recorded.
MMDD
11…1231
3
Int16
Event_Timestamp_Hr_Min
The hour and minute when the record was recorded.
HHMM
0…2359
SSms
0…100
4
Int16
Event_Timestamp_Sec_ms
The seconds and milliseconds when the record was recorded.
5
Int16
Event Type
Indicates the type of event that has occurred.
0…65535
6
Int16
General Code
Indicates general information about the status event.
0…65535
7
Int16
Information Code
Indicates specific information about the status event.
0…65535
8
Int16
Reserved
Reserved
0
352
Rockwell Automation Publication 1426-UM001G-EN-P - November 2014
0…59,999
PowerMonitor 5000 Unit Data Tables
Appendix A
LoggingResults.Setpoint_Log
Table 156 - Table Properties
CIP Instance Number
858
PCCC File Number
F67
No. of Elements
18
Length in Words
36
Data Type
Real
Data Access
Read Only
Table 157 - LoggingResults.Setpoint_Log Data Table
Element
Number
Type
Tag Name
Description
0
Real
Setpoint_Record_Identifier
Used to verify record sequence when returning multiple records.
1
Real
Setpoint_Timestamp_Year
The year when the record was recorded.
YYYY
2010…2100
2
Real
Setpoint_Timestamp_Mth_Day
The month and day when the record was recorded.
MMDD
11…1231
3
Real
Setpoint_Timestamp_Hr_Min
The hour and minute when the record was recorded.
HHMM
0…2359
4
Real
Setpoint_Timestamp_Sec_ms
The seconds and milliseconds when the record was recorded.
SSms
5
Real
Setpoint_Number
Setpoint number of record.
0…20
6
Real
Setpoint_Status
Setpoint is active (1) or not active (0).
0…1
7
Real
Input_Parameter
Input test parameter of setpoint.
0…105 (M5, M6)
0…230 (M8)
8
Real
Test_Condition
Test Condition.
0…3
9
Real
Evaluation_Type
Evaluation type for setpoint.
1…3
10
Real
Threshold_Setting
The threshold setting magnitude or percent.
0.000…
10,000,000
11
Real
Hysteresis_Setting
Magnitude or percent
0.000…
10,000,000
12
Real
Assert_Delay
Time delay before actuation.
seconds
0.000…3600
13
Real
Deassert_Delay
Time delay before deassert.
seconds
0.000…3600
14
Real
Output_Source
Output flag or bit.
0…40
15
Real
Output_Action
Configured action when actuated.
0…30
16
Real
Accumulated_Time
Total accumulation in seconds.
17
Real
Number_Of_Transitions
Number of transitions from off to on.
Rockwell Automation Publication 1426-UM001G-EN-P - November 2014
Unit
Range
1…100
seconds
0…59,999
0.000…
10,000,000
0…10,000,000
353
Appendix A
PowerMonitor 5000 Unit Data Tables
LoggingResults.Error_Log
Table 158 - Table Properties
CIP Instance Number
859
PCCC File Number
N68
No. of Elements
24
Length in Words
24
Data Type
Int16
Data Access
Read Only
Table 159 - LoggingResults.Error_Log Data Table
Element
Number
Type
Tag Name
Description
0
Int16
Error_Record_Number
The record number of the log. Record 0 is always the current record
before being logged
1
Int16
Error_Timestamp_Year
The year when the record was recorded
YYYY
2010…2100
2
Int16
Error_Timestamp_Mth_Day
The month and day when the record was recorded
MMDD
11…1231
3
Int16
Error_Timestamp_Hr_Min
The hour and minute when the record was recorded
HHMM
0…2359
4
Int16
Error_Timestamp_Sec_ms
The seconds and milliseconds when the record was recorded
SSms
0…59,999
5
Int16
Error_SlotID_ProcessorID
The slot number and the instance number of the processor
SSII
0…9999
6
Int16
Error_Version_Number
Firmware version
0…65,535
7
Int16
Error_Level_And_BreakSource
The high byte is level:
0 - fatal error
1 - warning
The low bytes is break source:
0 - exception
1 - application
2 - OS kernel
0…65,535
8
Int16
Error_File_Number/ExceptionType
The file number where the error occurs or the exception type if the
break source is exception
0…65,535
9
Int16
Error_Line Number//LR_Word0
The line number where the error occurs or Link register high word
0…65,535
10
Int16
Error_ThreadStatus_0/LR_Word1
The process ID Group 0
Bit 0…Bit 15 or Link register low word
0…65,535
11
Int16
Error_ThreadStatus_1/ExcauseCode
The process ID Group 1
Bit 0…Bit 15 or exception cause if it is an error from BF518
0…65,535
12
Int16
Error_ThreadStatus_2/Reserved1
The process ID Group 2
Bit 0…Bit 15
0…65,535
13
Int16
Error_ThreadStatus_3/Reserved2
The process ID Group 3
Bit 0…Bit 15
0…65,535
14
Int16
Error_ThreadStatus_4/Reserved3
The process ID Group 4
Bit 0…Bit 15
0…65,535
15
Int16
Error_ThreadStatus_5/Reserved4
The process ID Group 5
Bit 0…Bit 15
0…65,535
16
Int16
Error_ThreadStatus_6/Reserved5
The process ID Group 6
Bit 0…Bit 15
0…65,535
17
Int16
Error_ThreadStatus_7/Reserved6
The process ID Group 7
Bit 0…Bit 15
0…65,535
354
Rockwell Automation Publication 1426-UM001G-EN-P - November 2014
Unit
Range
1…20
PowerMonitor 5000 Unit Data Tables
Appendix A
Table 159 - LoggingResults.Error_Log Data Table
Element
Number
Type
Tag Name
Description
18
Int16
Error_Active_Process_ID/Reserved7
The process No. of the error occurred thread
0…65,535
19
Int16
Error_No0/Reserved8
Error code high word
0…65,535
20
Int16
Error_No1/Reserved9
Error code low word
0…65,535
21
Int16
Error_Reserved_10
Reserved
0…65,535
22
Int16
Error_Reserved_11
Reserved
0…65,535
23
Int16
Error_Reserved_12
Reserved
0…65,535
Rockwell Automation Publication 1426-UM001G-EN-P - November 2014
Unit
Range
355
Appendix A
PowerMonitor 5000 Unit Data Tables
LoggingResults.TriggerLogSetpointInfo_FileName
(M6 and M8 model)
Table 160 - Table Properties
CIP Instance Number
866
PCCC File Number
ST75
No. of Elements
1
Length in Words
32
Data Type
String
Data Access
Read Only
Table 161 - LoggingResults. TriggerLog_Setpoint_Info_File_Name Data Table
Element
Number
Type
Tag Name
Description
Default
Range
0
String
TriggerLog_Setpoint_Info
_File_Name
A single entry table for a 64 character Filename entry
0
64 bytes
LoggingResults.TriggerLog_FileName (M6 and M8 model)
Table 162 - Table Properties
CIP Instance Number
865
PCCC File Number
ST74
No. of Elements
1
Length in Words
32
Data Type
String
Data Access
Read Only
Table 163 - LoggingResults.TriggerLog_FileName Data Table
Element
Number
Type
Tag Name
Description
Default
Range
0
String
Trigger_Log_File_Name
A single entry table for a 64 character Filename entry
0
64 bytes
356
Rockwell Automation Publication 1426-UM001G-EN-P - November 2014
PowerMonitor 5000 Unit Data Tables
Appendix A
LoggingResults.TriggerData_Header (M6 and M8 model)
Table 164 - Table Properties
CIP Instance Number
862
PCCC File Number
F71
No. of Elements
15
Length in Words
30
Data Type
Real
Data Access
Read Only
Table 165 - LoggingResults. TriggerData_Header Data Table
Element Type
Number
Tag Name
Description
Unit
Range
0
Real
Record_Indicator
Indicates the significance of data in the record
1
Real
TriggerHeader_Record
_Identifier
Internal unique record number, if Record_Indicator = 1
Total records number in the log file, if Record_Indicator = 2.
#
+/- 0…9.999E15
2
Real
TriggerAction_
Timestamp_Year
The year when the trigger action occurred.
YYYY
2010…2100
3
Real
TriggerAction_
Timestamp_Month_
Day
The month and day when the trigger action occurred.
MMDD
0101…1231
4
Real
TriggerAction_
Timestamp_Hour_
Minute
The hour and minute when the trigger action occurred.
hhmm
0000…2359
5
Real
TriggerAction_
Timestamp_Sec_mS
The seconds and milliseconds when the trigger action occurred.
ssmS
00000…59999
6
Real
SetpointNumber
Setpoint number of trigger
#
1…30
7
Real
ParameterSelection or
Logic_Gate_Type
ParameterSelection if SetpointNumber = (1…20)
Logic_Gate_Type if SetpointNumber = (21 …30)
#
See description
8
Real
ReferenceValue or
Logic_Input_1
ReferenceValue if SetpointNumber = (1…20)
Logic_Input_1 if SetpointNumber = (21… 30)
#
See description
9
Real
TestCondition or
Logic_Input_2
TestCondition if SetpointNumber = (1…20)
Logic_Input_2 if SetpointNumber = (21 …30)
#
See description
10
Real
EvaluationType or
Logic_Input_3
EvaluationType if SetpointNumber = (1…20)
Logic_Input_3 if SetpointNumber = (21…30)
#
See description
11
Real
Threshold or
Logic_Input_4
Threshold if SetpointNumber = (1… 20)
Logic_Input_4 if SetpointNumber = (21… 30)
#
See description
12
Real
Hysteresis
Hysteresis for setpoint
#
0…10,000,000
0 = No record returned
1= the record contains
parameter values
2 = the record contains general
information of the log file being
retrieved, reference to each item
description in the data table
3= log file not found
13
Real
AssertDelay_s
AssertDelay for setpoint
s
0.000…3600
14
Real
DeassertDelay_s
DeassertDelay for setpoint
s
0.000…3600
Rockwell Automation Publication 1426-UM001G-EN-P - November 2014
357
Appendix A
PowerMonitor 5000 Unit Data Tables
LoggingResults.TriggerData_Log (M6 and M8 model)
Table 166 - Table Properties
CIP Instance Number
861
PCCC File Number
F70
No. of Elements
14
Length in Words
28
Data Type
Real
Data Access
Read Only
Table 167 - LoggingResults. TriggerData_Log Data Table
Element Type
Number
Tag Name
Description
0
Real
Record_Indicator
Indicates the significance of data in the record
1
Real
TriggerData_Record_
Identifier
Internal unique record number, if Record_Indicator = 1
Total records number in the log file, if Record_Indicator = 2.
#
0 … 3600
2
Real
TriggerData_
Timestamp_Year
The year when the record was recorded if Record_Indicator = 1.
YYYY
2010…2100
3
Real
TriggerData_
Timestamp_Month_D
ay
The month and day when the record was recorded Record_Indicator = 1.
MMDD
0101…1231
4
Real
TriggerData_
Timestamp_Hour_
Minute
The hour and minute when the record was recorded Record_Indicator = 1.
hhmm
0000…2359
5
Real
TriggerData_
Timestamp Sec_mS
The seconds and milliseconds when the record was recorded Record_Indicator = 1.
ssmS
00000…59999
6
Real
TriggerDataLog_P
arameter_1
#
+/- 0…9.999E15
7
Real
TriggerDataLog_
Parameter_2
Parameter value if Record_Indicator = 1
Parameter index (reference to Trigger Data Log Parameter List table) if
Record_Indicator = 2;
#
+/- 0…9.999E15
8
Real
TriggerDataLog_
Parameter_3
#
+/- 0…9.999E15
9
Real
TriggerDataLog_
Parameter_4
#
+/- 0…9.999E15
10
Real
TriggerDataLog_
Parameter_5
#
+/- 0…9.999E15
11
Real
TriggerDataLog_
Parameter_6
#
+/- 0…9.999E15
12
Real
TriggerDataLog_
Parameter_7
#
+/- 0…9.999E15
13
Real
TriggerDataLog_
Parameter_8
#
+/- 0…9.999E15
358
Rockwell Automation Publication 1426-UM001G-EN-P - November 2014
Unit
Range
0 = No record returned
1 = the record contains
parameter values
2 = the record contains general
information of the log file being
retrieved, reference to each item
description in the data table
3 = log file not found
PowerMonitor 5000 Unit Data Tables
Appendix A
LoggingResults.Power_Quality_Log (M6 and M8 model)
Table 168 - Table Properties
CIP Instance Number
864
PCCC File Number
F73
No. of Elements
32
Length in Words
64
Data Type
Real
Data Access
Read Only
Table 169 - LoggingResults. Power_Quality_Log Data Table
Element Type
Number
Tag Name
Description
Unit
Range
0
Real
Record_Identifier
Used to verify record sequence when returning multiple records
#
1…100
1
Real
Event_Type
Power quality event type, see ‘Power Quality Event List’ data table of the document
#
1…24
2
Real
Sub_Event_Code
Indicate the sub event of the event type. For example, a sag event can happen in V1, V2 or V3. see
‘Power Quality Event List’ data table of the document
#
1…4
3
Real
Local_Timestamp_
Year
Year of the local time when the record was recorded
YYYY
2010…2100
4
Real
Local_Timestamp_
Mth_Day
Month and Day of the local time when the record was recorded
MMDD
0101…1231
5
Real
Local_Timestamp_
Hr_Min
Hour and Minute of the local time when the record was recorded
hhmm
0000…2359
6
Real
Local_Timestamp_
Sec_mS
Second and Millisecond of the local time when the record was recorded.
ssmS
00000…59999
7
Real
Local_Timestamp_
uS
Microsecond when the record was recorded
uS
000 … 999
8
Real
UTC_Timestamp_
Year
Year of the UTC when the record was recorded
YYYY
2010…2100
9
Real
UTC_Timestamp_
Mth_Day
Month and Day of the UTC when the record was recorded
MMDD
0101…1231
10
Real
UTC_Timestamp_Hr
_Min
Hour and Minute of the UTC when the record was recorded.
hhmm
0000…2359
11
Real
UTC_Timestamp_
Sec_mS
Second and Millisecond of UTC when the record was recorded.
ssmS
00000…59999
12
Real
UTC_Timestamp_uS
Microsecond of UTC when the record was recorded.
uS
000…999
13
Real
Association_
Timestamp_Year
Year of the timestamp associated with waveform file if the event can trigger a waveform capture
YYYY
2010…2100
14
Real
Association_
Timestamp_Mth_
Day
Month and Day of the timestamp associated with waveform file if the event can trigger a waveform
capture
MMDD
0101…1231
15
Real
Association_Timesta
mp_Hr_Min
Hour and Minute of the timestamp associated with waveform file if the event can trigger a
waveform capture
hhmm
0000…2359
16
Real
Association_
Second and Millisecond of the timestamp associated with waveform file if the event can trigger a
Timestamp_Sec_mS waveform capture
ssmS
00000…59999
17
Real
Association_
Timestamp_uS
uS
000…999
Microsecond of the timestamp associated with waveform file
Rockwell Automation Publication 1426-UM001G-EN-P - November 2014
359
Appendix A
PowerMonitor 5000 Unit Data Tables
Table 169 - LoggingResults. Power_Quality_Log Data Table
Element Type
Number
Tag Name
Description
Unit
Range
18
Real
Event_Duration_mS
Event duration in millisecond.
mS
0…60000
19
Real
Min_or_Max
Min value of the event or Max value of the event.
Volts
+/0…9.999e15
20
Real
Trip_Point
The trip point that triggered the event
#
+/0…9.999e15
21
Real
WSB_Originator
ID of the WSB message generator, the 3 least significant bytes of MAC ID.
#
0…16777215
(0x0…0xFFFFFF)
22…31
Real
Reserved
Future Use
0
LoggingResults.Snapshot_Log (M6 and M8 model)
Table 170 - Table Properties
CIP Instance Number
872
PCCC File Number
F81
No. of Elements
2
Length in Words
4
Data Type
Real
Data Access
Read Only
Table 171 - LoggingResults. Snapshot_Log Data Table
Element
Number
Type
Tag Name
Description
Unit Range
0
Real
Parameter_Number
The number of the parameter from the metering snapshot parameter list.
#
1
Real
Parameter_Value
The value recorded when metering data snapshot
360
Rockwell Automation Publication 1426-UM001G-EN-P - November 2014
1…2270 (M6)
1…4447 (M8, Group 0)
1…1233 (M8, Group 1)
1…20,439 (M8, Group 2)
-9.999E15…9.999E15
PowerMonitor 5000 Unit Data Tables
Appendix A
LoggingResults.WaveformFileName (M6 and M8 model)
Table 172 - Table Properties
CIP Instance Number
869
PCCC File Number
ST78
No. of Elements
1
Length in Words
32
Data Type
String
Data Access
Read Only
Table 173 - LoggingResults. WaveformFileName Data Table
Element
Number
Type
Tag Name
Description
Default
Range
0
String
Waveform_File_Name
A single entry table for a 64 character Filename entry
0
64 bytes
LoggingResults.Waveform_Log (M6 and M8 model)
Table 174 - Table Properties
CIP Instance Number
871
PCCC File Number
F80
No. of Elements
43
Length in Words
86
Data Type
Real
Data Access
Read Only
Table 175 - LoggingResults. Waveform_Log Data Table
Element
Number
Type
Tag Name
Description
0
Real
Record_Indicator
Indicates the significance of the data in the record
1
Real
Timestamp_Date
Date of cycle collection MMDDYY
MMDDYY
0…123199
2
Real
Timestamp_Time
Time of cycle collection hhmmss
hhmmss
0…235959
3
Real
Microsecond_Stamp
Microsecond of cycle collection
uS
0.000…999,999
4
Real
File_ID
The selected file ID
#
1…256
5
Real
Total_Cycles
Total cycles of the waveform file
#
0…3640
6
Real
Cycle_Returned
The current returned cycle
#
0…(Total cycles - 1)
7
Real
Frequency
The frequency of average cycle
Hz
50 or 60
8
Real
Mag_Angle
The returned value is mag or angle
#
0 = Mag, 1 = Angle
Rockwell Automation Publication 1426-UM001G-EN-P - November 2014
Unit
Range
0 = No record returned 1= the
record contains parameter
values
2 = the record contains
general information of the log
file being retrieved, reference
to each item description in the
data table
3 = log file not found.
361
Appendix A
PowerMonitor 5000 Unit Data Tables
Table 175 - LoggingResults. Waveform_Log Data Table
Element
Number
Type
Tag Name
Description
Unit
Range
9
Real
Channel
The channel returned
#
0 = V1
1 = V2
2 = V3
3 = V4
4 = I1
5 = I2
6 = I3
7 = I4
10
Real
Order
The range of harmonic orders of returned values
#
0 = DC.…31st
1 = 32nd…63rd
2 = 64th…95th (M8 only)
3 = 96th…127th (M8 only)
362
Rockwell Automation Publication 1426-UM001G-EN-P - November 2014
PowerMonitor 5000 Unit Data Tables
Appendix A
Table 175 - LoggingResults. Waveform_Log Data Table
Element
Number
Type
Tag Name
Description
Unit
Range
11
Real
X_(0 + Order * 32)
The returned value X_(h) for the spectral component specified by Channel at
harmonic h
X_(h) = RMS magnitude if Mag_Angle = 0
X_(h) = Angle if Mag_Angle = 1
V, A, or degrees,
depending on
value of Channel
and Mag_Angle
+/- 0…9.999E15
12
Real
X_(1 + Order * 32)
+/- 0…9.999E15
13
Real
X_(2 + Order * 32)
+/- 0…9.999E15
14
Real
X_(3 + Order * 32)
+/- 0…9.999E15
15
Real
X_(4 + Order * 32)
+/- 0…9.999E15
16
Real
X_(5 + Order * 32)
+/- 0…9.999E15
17
Real
X_(6 + Order * 32)
+/- 0…9.999E15
18
Real
X_(7 + Order * 32)
+/- 0…9.999E15
19
Real
X_(8 + Order * 32)
+/- 0…9.999E15
20
Real
X_(9 + Order * 32)
+/- 0…9.999E15
21
Real
X_(10 + Order * 32)
+/- 0…9.999E15
22
Real
X_(11 + Order * 32)
+/- 0…9.999E15
23
Real
X_(12 + Order * 32)
+/- 0…9.999E15
24
Real
X_(13 + Order * 32)
+/- 0…9.999E15
25
Real
X_(14 + Order * 32)
+/- 0…9.999E15
26
Real
X_(15 + Order * 32)
+/- 0…9.999E15
27
Real
X_(16 + Order * 32)
+/- 0…9.999E15
28
Real
X_(17 + Order * 32)
+/- 0…9.999E15
29
Real
X_(18 + Order * 32)
+/- 0…9.999E15
30
Real
X_(19 + Order * 32)
+/- 0…9.999E15
31
Real
X_(20 + Order * 32)
+/- 0…9.999E15
32
Real
X_(21 + Order * 32)
+/- 0…9.999E15
33
Real
X_(22 + Order * 32)
+/- 0…9.999E15
34
Real
X_(23 + Order * 32)
+/- 0…9.999E15
35
Real
X_(24 + Order * 32)
+/- 0…9.999E15
36
Real
X_(25 + Order * 32)
+/- 0…9.999E15
37
Real
X_(26 + Order * 32)
+/- 0…9.999E15
38
Real
X_(27 + Order * 32)
+/- 0…9.999E15
39
Real
X_(28 + Order * 32)
+/- 0…9.999E15
40
Real
X_(29 + Order * 32)
+/- 0…9.999E15
41
Real
X_(30 + Order * 32)
+/- 0…9.999E15
42
Real
X_(31 + Order * 32)
+/- 0…9.999E15
Rockwell Automation Publication 1426-UM001G-EN-P - November 2014
363
Appendix A
PowerMonitor 5000 Unit Data Tables
LoggingResults.EN50160_Weekly_Log (M8 only)
Table 176 - Table Properties
CIP Instance Number
874
PCCC File Number
F83
No. of Elements
13
Length in Words
26
Data Type
Real
Data Access
Read only
Applies to
M8 only
Table 177 - LoggingResults.EN50160_Weekly_Log Data Table
Element
Number
Type
Tag Name
Description
Units
Range
0
Real
Record_Number
The record number of the log. Record 1 is always the current record before
being logged.
#
1….8
1
Real
Log_Date
The Date this record was started.
YYMMDD
0….999,999
2
Real
Supply Voltage Range 1
Metering interval is 10 minutes; Conformance limit is +10% / - 10%;
Conformance recommendation is 95%
%
0.00….100.00
3
Real
Supply Voltage Range 2
Metering interval is 10 minutes; Conformance limit is +10% / - 15%;
Conformance recommendation is 100%
%
0.00….100.00
4
Real
Flicker Severity Plt
Metering interval is 2 hours; Conformance limit is 1 or less; Conformance
recommendation is 95%
%
0.00….100.00
5
Real
Supply Voltage Unbalance
Metering interval is 10 minutes; Conformance limit is 0% to 2%;
Conformance recommendation is 95%
%
0.00….100.00
6
Real
Individual Harmonic Voltage
Metering interval is 10 minutes; Conformance limit is the table 1 of the
EN50160 standard; Conformance recommendation is 95%
%
0.00….100.00
7
Real
Voltage THD
Metering interval is 10 minutes; Conformance limit is 8% or less;
Conformance recommendation is 100%
%
0.00….100.00
8
Real
Non Synchronous Power Freq. Range 1 Metering interval is 10 seconds; Conformance limit is +2% / -2%;
Conformance recommendation is 95%
%
0.00….100.00
9
Real
Non Synchronous Power Freq. Range 2
Metering interval is 10 seconds; Conformance limit is +15% / -15%;
Conformance recommendation is 100%
%
0.00….100.00
10
Real
10_Minutes_Valid_Data_Counts
Number of 10 minutes intervals without interruption flag set during 1 day
#
0….999,999
11
Real
2_Hours_Valid_Data_Counts
Number of 2 hours intervals without interruption flag set during 1 day
#
0….999,999
12
Real
10_Seconds_Valid_Data_Counts
Number of 10 seconds intervals without interruption flag set during 1 day
#
0….999,999
364
Rockwell Automation Publication 1426-UM001G-EN-P - November 2014
PowerMonitor 5000 Unit Data Tables
Appendix A
LoggingResults.EN50160_Yearly_Log (M8 only)
Table 178 - Table Properties
CIP Instance Number
875
PCCC File Number
F84
No. of Elements
37
Length in Words
74
Data Type
Real
Data Access
Read only
Applies to
M8 only
Table 179 - LoggingResults.EN50160_Yearly_Log Data Table
Element
Number
Type
Tag Name
Description
Units
Range
0
Real
Record_Number
The record number of the log. Record 1 is always the current record
before being logged.
#
1….13
1
Real
Log_Start_Date
The Date this record was started.
YYMMDD
0…999,999
2
Real
Log_End_Date
The Date this record was completed.
YYMMDD
0….999,999
3
Real
Synchronous Power Frequency Range 1
Metering interval is 10 seconds; Conformance limit is +1% / - 1%;
Conformance recommendation is 99.5%
%
0.00….100.00
4
Real
Synchronous Power Frequency Range 2
Metering interval is 10 seconds; Conformance limit is +4% / - 6%;
Conformance recommendation is 100%
%
0.00….100.00
5
Real
Sag 90…80% u, 10…200 mS Duration
Number of sag incidence in the assigned cell. Aggregated result
from yearly log.
#
0…
9,999,999
6
Real
Sag 90…80% u, 200…500 mS Duration
Number of sag incidence in the assigned cell. Aggregated result
from yearly log.
#
0…
9,999,999
7
Real
Sag 90…80% u , 500…1000 mS Duration
Number of sag incidence in the assigned cell. Aggregated result
from yearly log.
#
0…
9,999,999
8
Real
Sag 90…80% u, 1000…5000 mS Duration
Number of sag incidence in the assigned cell. Aggregated result
from yearly log.
#
0…
9,999,999
9
Real
Sag 90…80%u,5000…60,000mS Duration
Number of sag incidence in the assigned cell. Aggregated result
from yearly log.
#
0…
9,999,999
10
Real
Sag 80…70% u, 10…200 mS Duration
Number of sag incidence in the assigned cell. Aggregated result
from yearly log.
#
0…
9,999,999
11
Real
Sag 80…70% u, 200…500 mS Duration
Number of sag incidence in the assigned cell. Aggregated result
from yearly log.
#
0…
9,999,999
12
Real
Sag 80…70% u, 500…1000 mS Duration
Number of sag incidence in the assigned cell. Aggregated result
from yearly log.
#
0…
9,999,999
13
Real
Sag 80…70% u, 1000…5000 mS Duration
Number of sag incidence in the assigned cell. Aggregated result
from yearly log.
#
0…
9,999,999
14
Real
Sag 80…70% u, 5000…60,000 mS Duration
Number of sag incidence in the assigned cell. Aggregated result
from yearly log.
#
0…
9,999,999
15
Real
Sag 70…40% u, 10…200 mS Duration
Number of sag incidence in the assigned cell. Aggregated result
from yearly log.
#
0…
9,999,999
16
Real
Sag 70…40% u, 200…500 mS Duration
Number of sag incidence in the assigned cell. Aggregated result
from yearly log.
#
0…
9,999,999
Rockwell Automation Publication 1426-UM001G-EN-P - November 2014
365
Appendix A
PowerMonitor 5000 Unit Data Tables
Table 179 - LoggingResults.EN50160_Yearly_Log Data Table
Element
Number
Type
Tag Name
Description
Units
Range
17
Real
Sag 70…40% u, 500…1000 mS Duration
Number of sag incidence in the assigned cell. Aggregated result
from yearly log.
#
0…
9,999,999
18
Real
Sag 70…40% u, 1000… 5000 mS Duration
Number of sag incidence in the assigned cell. Aggregated result
from yearly log.
#
0…
9,999,999
19
Real
Sag 70…40% u, 5000…60,000 mS Duration
Number of sag incidence in the assigned cell. Aggregated result
from yearly log.
#
0…
9,999,999
20
Real
Sag 40…5% u, 10…200 mS Duration
Number of sag incidence in the assigned cell. Aggregated result
from yearly log.
#
0…
9,999,999
21
Real
Sag 40…5% u, 200…500 mS Duration
Number of sag incidence in the assigned cell. Aggregated result
from yearly log.
#
0…
9,999,999
22
Real
Sag 40…5% u, 500…1000 mS Duration
Number of sag incidence in the assigned cell. Aggregated result
from yearly log.
#
0…
9,999,999
23
Real
Sag 40…5% u, 1000…5000 mS Duration
Number of sag incidence in the assigned cell. Aggregated result
from yearly log.
#
0…
9,999,999
24
Real
Sag 40…5% u, 5000…60,000 mS Duration
Number of sag incidence in the assigned cell. Aggregated result
from yearly log.
#
0…
9,999,999
25
Real
Sag less than 5% u, 10…200 mS Duration
Number of sag incidence in the assigned cell. Aggregated result
from yearly log.
#
0…
9,999,999
26
Real
Sag less than 5% u, 200…500 mS Duration
Number of sag incidence in the assigned cell. Aggregated result
from yearly log.
#
0…
9,999,999
27
Real
Sag less than 5% u, 500…1000 mS Duration
Number of sag incidence in the assigned cell. Aggregated result
from yearly log.
#
0…
9,999,999
28
Real
Sag less than 5% u, 1000…5000 mS Duration
Number of sag incidence in the assigned cell. Aggregated result
from yearly log.
#
0…
9,999,999
29
Real
Sag less than 5% u, 5000…60 ,000 mS Duration
Number of sag incidence in the assigned cell. Aggregated result
from yearly log.
#
0…
9,999,999
30
Real
Swell 120% u or greater, 10…500 mS Duration
Number of swell incidence in the assigned cell. Aggregated result
from yearly log.
#
0…
9,999,999
31
Real
Swell 120% u or greater, 500…5000 mS Duration
Number of swell incidence in the assigned cell. Aggregated result
from yearly log.
#
0…
9,999,999
32
Real
Swell 120% u or greater, 5000…60,000 mS Duration
Number of swell incidence in the assigned cell. Aggregated result
from yearly log.
#
0…
9,999,999
33
Real
Swell 120…110% u, 10…500 mS Duration
Number of swell incidence in the assigned cell. Aggregated result
from yearly log.
#
0…
9,999,999
34
Real
Swell 120…110% u, 500…5000 mS Duration
Number of swell incidence in the assigned cell. Aggregated result
from yearly log.
#
0…
9,999,999
35
Real
Swell 120…110% u, 5000…60,000 mS Duration
Number of swell incidence in the assigned cell. Aggregated result
from yearly log.
#
0…
9,999,999
36
Real
10_Seconds_Valid_Data_Counts
Number of 10 seconds intervals without interruption flag set during
1 month.
#
0…
9,999,999
366
Rockwell Automation Publication 1426-UM001G-EN-P - November 2014
PowerMonitor 5000 Unit Data Tables
Appendix A
PowerQuality.RealTime_PowerQuality
Table 180 - Table Properties
CIP Instance Number
845
PCCC File Number
F54
No. of Elements
56
Length in Words
112
Data Type
Real
Data Access
Read Only
Table 181 - PowerQuality.RealTime_PowerQuality Data Table
Element Type
Number
Tag Name
Description
Units
Range
0
Real
Metering Date Stamp
Date of cycle collection MM:DD:YY
MM:DD:YY
0…123,199
1
Real
Metering Time Stamp
Time of cycle collection HH:MM:SS
HH:MM:SS
0…235,959
2
Real
Metering Microsecond Stamp
Microsecond of cycle collection
uS
0.000…999,999
3
Real
V1_Crest_Factor
V1 crest factor
0…9.999E15
4
Real
V2_Crest_Factor
V2 crest factor
0…9.999E15
5
Real
V3_Crest_Factor
V3 crest factor
0…9.999E15
6
Real
V1_V2_Crest_Factor
V1 V2 crest factor
0…9.999E15
7
Real
V2_V3_Crest_Factor
V2 V3 crest factor
0…9.999E15
8
Real
V3_V1_Crest_Factor
V3 V1 crest factor
0…9.999E15
9
Real
I1_Crest_Factor
I1 crest factor
0…9.999E15
10
Real
I2_Crest_Factor
I2 crest factor
0…9.999E15
11
Real
I3_Crest_Factor
I3 crest factor
0…9.999E15
12
Real
I4_Crest_Factor
I4 crest factor
0…9.999E15
13
Real
V1_IEEE_THD_%
V1-N IEEE Total Harmonic Distortion
%
0.00…100.00
14
Real
V2_IEEE_THD_%
V2-N IEEE Total Harmonic Distortion
%
0.00…100.00
15
Real
V3_IEEE_THD_%
V3-N IEEE Total Harmonic Distortion
%
0.00…100.00
16
Real
VN_G_IEEE_THD_%
VGN-N IEEE Total Harmonic Distortion
%
0.00…100.00
17
Real
Avg_IEEE_THD_V_%
Average V1/V2/V3 to N IEEE Total Harmonic Distortion
%
0.00…100.00
18
Real
V1_V2_IEEE_THD_%
V1-V2 IEEE Total Harmonic Distortion
%
0.00…100.00
19
Real
V2_V3_IEEE_THD_%
V2-V3 IEEE Total Harmonic Distortion
%
0.00…100.00
20
Real
V3_V1_IEEE_THD_%
V3-V1 IEEE Total Harmonic Distortion
%
0.00…100.00
21
Real
Avg_IEEE_THD_V_V_%
Average IEEE THD for V1-V2, V2-V3, V3-V1
%
0.00…100.00
22
Real
I1_IEEE_THD_%
I1 IEEE Total Harmonic Distortion
%
0.00…100.00
23
Real
I2_IEEE_THD_%
I2 IEEE Total Harmonic Distortion
%
0.00…100.00
24
Real
I3_IEEE_THD_%
I3 IEEE Harmonic Distortion
%
0.00…100.00
25
Real
I4_IEEE_THD_%
I4 IEEE Harmonic Distortion
%
0.00…100.00
26
Real
Avg_IEEE_THD_I_%
Average I1/I2/I3 IEEE Total Harmonic Distortion
%
0.00…100.00
27
Real
V1_IEC_THD_%
V1-N IEC Total Harmonic Distortion
%
0.00…100.00
28
Real
V2_IEC_THD_%
V2-N IEC Total Harmonic Distortion
%
0.00…100.00
Rockwell Automation Publication 1426-UM001G-EN-P - November 2014
367
Appendix A
PowerMonitor 5000 Unit Data Tables
Table 181 - PowerQuality.RealTime_PowerQuality Data Table
Element Type
Number
Tag Name
Description
Units
Range
29
Real
V3_IEC_THD_%
V3-N IEC Total Harmonic Distortion
%
0.00…100.00
30
Real
VN_G_IEC_THD_%
VGN-N IEC Total Harmonic Distortion
%
0.00…100.00
31
Real
Avg_IEC_THD_V_%
Average V1/V2/V3 to N IEC Total Harmonic Distortion
%
0.00…100.00
32
Real
V1_V2_IEC_THD_%
V1-V2 IEC Total Harmonic Distortion
%
0.00…100.00
33
Real
V2_V3_IEC_THD_%
V2-V3 IEC Total Harmonic Distortion
%
0.00…100.00
34
Real
V3_V1_IEC_THD_%
V3-V1 IEC Total Harmonic Distortion
%
0.00…100.00
35
Real
Avg_IEC_THD_V_V_%
Average IEC THD for V1-V2, V2-V3, V3-V1
%
0.00…100.00
36
Real
I1_IEC_THD_%
I1 IEC Total Harmonic Distortion
%
0.00…100.00
37
Real
I2_IEC_THD_%
I2 IEC Total Harmonic Distortion
%
0.00…100.00
38
Real
I3_IEC_THD_%
I3 IEC Total Harmonic Distortion
%
0.00…100.00
39
Real
I4_IEC_THD_%
I4 IEC Total Harmonic Distortion
%
0.00…100.00
40
Real
Avg_IEC_THD_I_%
Average I1/I2/I3 IEC Total Harmonic Distortion
%
0.00…100.00
41
Real
Pos_Seq_Volts
Positive Sequence Voltage
V
0…9.999E15
42
Real
Neg_Seq_Volts
Negative Sequence Voltage
V
0…9.999E15
43
Real
Zero_Seq_Volts
Zero Sequence Voltage
V
0…9.999E15
44
Real
Pos_Seq_Amps
Positive Sequence Amps
A
0…9.999E15
45
Real
Neg_Seq_Amps
Negative Sequence Amps
A
0…9.999E15
46
Real
Zero_Seq_Amps
Zero Sequence Amps
A
0…9.999E15
47
Real
Voltage_Unbalance_%
Voltage percent unbalance
%
0.00…100.00
48
Real
Current_Unbalance_%
Current percent unbalance
%
0.00…100.00
49
Real
I1_K_Factor
I1 K-factor
-
1.00…
25,000.00
50
Real
I2_K_Factor
I2 K-factor
-
1.00…
25,000.00
51
Real
I3_K_Factor
I3 K-factor
-
1.00…
25,000.00
52…55
Real
Resvd
Reserved
368
Rockwell Automation Publication 1426-UM001G-EN-P - November 2014
PowerMonitor 5000 Unit Data Tables
Appendix A
PowerQuality.EN61000_4_30_HSG (M8 only)
Table 182 - Table Properties
CIP Instance Number
879
PCCC File Number
F88
No. of Elements
23
Length in Words
46
Data Type
Real
Data Access
Read only
Applies to
M8 only
Table 183 - PowerQuality.EN61000_4_30_HSG Data Tables
Element Type
Number
Tag Name
Description
Units
Range
0
Real
200mS_Metering_Date_Stamp
Date of cycle collection MM:DD:YY
MMDDYY
0…123199
1
Real
200mS_Metering_Time_Stamp
Time of cycle collection HH:MM:SS
hhmmss
0…235959
2
Real
200mS_Metering_uSecond_Stamp Microsecond of cycle collection
uS
0.000…999,999
3
Real
200mS_V1_N_THDS_%
Total distortion of the EN61000-4-30 harmonic distortion subgroups.
%
0.00…100.00
4
Real
200mS_V2_N_THDS_%
Total distortion of the EN61000-4-30 harmonic distortion subgroups.
%
0.00…100.00
5
Real
200mS_V3_N_THDS_%
Total distortion of the EN61000-4-30 harmonic distortion subgroups.
%
0.00…100.00
6
Real
200mS_VN_G_THDS_%
Total distortion of the EN61000-4-30 harmonic distortion subgroups.
%
0.00…100.00
7
Real
200mS_AVE_VN_THDS_%
Total distortion of the EN61000-4-30 harmonic distortion subgroups.
%
0.00…100.00
8
Real
200mS_V1_V2_THDS_%
Total distortion of the EN61000-4-30 harmonic distortion subgroups.
%
0.00…100.00
9
Real
200mS_V2_V3_THDS_%
Total distortion of the EN61000-4-30 harmonic distortion subgroups.
%
0.00…100.00
10
Real
200mS_V3_V1_THDS_%
Total distortion of the EN61000-4-30 harmonic distortion subgroups.
%
0.00…100.00
11
Real
200mS_AVE_LL_THDS_%
Total distortion of the EN61000-4-30 harmonic distortion subgroups.
%
0.00…100.00
12
Real
200mS_V1_N_TIHDS_%
Total distortion of the EN61000-4-30 harmonic distortion subgroups.
%
0.00…100.00
13
Real
200mS_V2_N_TIHDS_%
Total distortion of the EN61000-4-30 harmonic distortion subgroups.
%
0.00…100.00
14
Real
200mS_V3_N_TIHDS_%
Total distortion of the EN61000-4-30 harmonic distortion subgroups.
%
0.00…100.00
15
Real
200mS_VN_G_TIHDS_%
Total distortion of the EN61000-4-30 harmonic distortion subgroups.
%
0.00…100.00
16
Real
200mS_AVE_VN_TIHDS_%
Total distortion of the EN61000-4-30 harmonic distortion subgroups.
%
0.00…100.00
17
Real
200mS_V1_V2_TIHDS_%
Total distortion of the EN61000-4-30 harmonic distortion subgroups.
%
0.00…100.00
18
Real
200mS_V2_V3_TIHDS_%
Total distortion of the EN61000-4-30 harmonic distortion subgroups.
%
0.00…100.00
19
Real
200mS_V3_V1_TIHDS_%
Total distortion of the EN61000-4-30 harmonic distortion subgroups.
%
0.00…100.00
20
Real
200mS_AVE_LL_TIHDS_%
Total distortion of the EN61000-4-30 harmonic distortion subgroups.
%
0.00…100.00
21
Real
200mS_Sag_Swell_Status_Flag
A flag indicating 200 ms result has been calculated during a Sag, Swell or
Interruption.
#
0…1
22
Real
200mS_Metering_Iteration
A number 0…9,999,999 that indicates that the metering functions and
internal communications are updating.
#
0…9,999,999
Rockwell Automation Publication 1426-UM001G-EN-P - November 2014
369
Appendix A
PowerMonitor 5000 Unit Data Tables
PowerQuality.EN61000_4_30_THD (M8 only)
Table 184 - Table Properties
CIP Instance Number
881
PCCC File Number
F90
No. of Elements
46
Length in Words
92
Data Type
Real
Data Access
Read only
Applies to
M8 only
Table 185 - PowerQuality.EN61000_4_30_THD
Element
Number
Type
Tag Name
Description
Units
Range
0
Real
200mS_Metering_Date_Stamp
Date of cycle collection MM:DD:YY
MMDDYY
0…123,199
1
Real
200mS_Metering_Time_Stamp
Time of cycle collection HH:MM:SS
hhmmss
0…235,959
2
Real
200mS_Metering_uSecond_Stamp Microsecond of cycle collection
uS
0.000…999,999
3
Real
200mS_V1_Crest_Factor
V1 crest factor
-
0…9.999E15
4
Real
200mS_V2_Crest_Factor
V2 crest factor
-
0…9.999E15
5
Real
200mS_V3_Crest_Factor
V3 crest factor
-
0…9.999E15
6
Real
200mS_V1_V2_Crest_Factor
V1 V2 crest factor
-
0…9.999E15
7
Real
200mS_V2_V3_Crest_Factor
V2 V3 crest factor
-
0…9.999E15
8
Real
200mS_V3_V1_Crest_Factor
V3 V1 crest factor
-
0…9.999E15
9
Real
200mS_I1_Crest_Factor
I1 crest factor
-
0…9.999E15
10
Real
200mS_I2_Crest_Factor
I2 crest factor
-
0…9.999E15
11
Real
200mS_I3_Crest_Factor
I3 crest factor
-
0…9.999E15
12
Real
200mS_I4_Crest_Factor
I4 crest factor
-
0…9.999E15
13
Real
200mS_V1_N_IEEE_THD_%
V1-N IEEE Total Harmonic Distortion
%
0.00…100.00
14
Real
200mS_V2_N_IEEE_THD_%
V2-N IEEE Total Harmonic Distortion
%
0.00…100.00
15
Real
200mS_V3_N_IEEE_THD_%
V3-N IEEE Total Harmonic Distortion
%
0.00…100.00
16
Real
200mS_VN_G_IEEE_THD_%
VN-G IEEE Total Harmonic Distortion
%
0.00…100.00
17
Real
200mS_Avg_IEEE_THD_V_%
Average V1/V2/V3 to N IEEE Total Harmonic Distortion
%
0.00…100.00
18
Real
200mS_V1_V2_IEEE_THD_%
V1-V2 IEEE Total Harmonic Distortion
%
0.00…100.00
19
Real
200mS_V2_V3_IEEE_THD_%
V2-V3 IEEE Total Harmonic Distortion
%
0.00…100.00
20
Real
200mS_V3_V1_IEEE_THD_%
V3-V1 IEEE Total Harmonic Distortion
%
0.00…100.00
21
Real
200mS_Avg_IEEE_THD_V_V_%
Average IEEE THD for V1-V2, V2-V3, V3-V1
%
0.00…100.00
22
Real
200mS_I1_IEEE_THD_%
I1 IEEE Total Harmonic Distortion
%
0.00…100.00
23
Real
200mS_I2_IEEE_THD_%
I2 IEEE Total Harmonic Distortion
%
0.00…100.00
24
Real
200mS_I3_IEEE_THD_%
I3 IEEE Total Harmonic Distortion
%
0.00…100.00
25
Real
200mS_I4_IEEE_THD_%
I4 IEEE Total Harmonic Distortion
%
0.00…100.00
26
Real
200mS_Avg_IEEE_THD_I_%
Average I1/I2/I3 IEEE Total Harmonic Distortion
%
0.00…100.00
27
Real
200mS_V1_N_IEC_THD_%
V1-N IEC Total Harmonic Distortion
%
0.00…100.00
370
Rockwell Automation Publication 1426-UM001G-EN-P - November 2014
PowerMonitor 5000 Unit Data Tables
Appendix A
Table 185 - PowerQuality.EN61000_4_30_THD
Element
Number
Type
Tag Name
Description
Units
Range
28
Real
200mS_V2_N_IEC_THD_%
V2-N IEC Total Harmonic Distortion
%
0.00…100.00
29
Real
200mS_V3_N_IEC_THD_%
V3-N IEC Total Harmonic Distortion
%
0.00…100.00
30
Real
200mS_VN_G_IEC_THD_%
VN-G IEC Total Harmonic Distortion
%
0.00…100.00
31
Real
200mS_Avg_IEC_THD_V_%
Average V1/V2/V3 to N IEC Total Harmonic Distortion
%
0.00…100.00
32
Real
200mS_V1_V2_IEC_THD_%
V1-V2 IEC Total Harmonic Distortion
%
0.00…100.00
33
Real
200mS_V2_V3_IEC_THD_%
V2-V3 IEC Total Harmonic Distortion
%
0.00…100.00
34
Real
200mS_V3_V1_IEC_THD_%
V3-V1 IEC Total Harmonic Distortion
%
0.00…100.00
35
Real
200mS_Avg_IEC_THD_V_V_%
Average IEC THD for V1-V2, V2-V3, V3-V1
%
0.00…100.00
36
Real
200mS_I1_IEC_THD_%
I1 IEC Total Harmonic Distortion
%
0.00…100.00
37
Real
200mS_I2_IEC_THD_%
I2 IEC Total Harmonic Distortion
%
0.00…100.00
38
Real
200mS_I3_IEC_THD_%
I3 IEC Total Harmonic Distortion
%
0.00…100.00
39
Real
200mS_I4_IEC_THD_%
I4 IEC Total Harmonic Distortion
%
0.00…100.00
40
Real
200mS_Avg_IEC_THD_I_%
Average I1/I2/I3 IEC Total Harmonic Distortion
%
0.00…100.00
41
Real
200mS_I1_K_Factor
I1 K-factor
-
1.00…25,000.00
42
Real
200mS_I2_K_Factor
I2 K-factor
-
1.00…25,000
43
Real
200mS_I3_K_Factor
I3 K-factor
-
1.00…25,000.00
44
Real
200mS_Sag_Swell_Status_Flag
A flag indicating 200 ms result has been calculated during a Sag, Swell, or
Interruption.
#
0…1
45
Real
200mS_Metering_Iteration
A number 0…9,999,999 that indicates that the metering functions and
internal communications are updating.
#
0…9,999,999
Rockwell Automation Publication 1426-UM001G-EN-P - November 2014
371
Appendix A
PowerMonitor 5000 Unit Data Tables
PowerQuality.EN61000_4_30_Sequence (M8 only)
Table 186 - Table Properties
CIP Instance Number
882
PCCC File Number
F91
No. of Elements
13
Length in Words
26
Data Type
Real
Data Access
Read only
Applies to
M8 only
Table 187 - PowerQuality.EN61000_4_30_Sequence Data Table
Element
Number
Type
Tag Name
Description
Units
Range
0
Real
200mS_Metering_Date_Stamp
Date of cycle collection MM:DD:YY
MMDDYY
0…123,199
1
Real
200mS_Metering_Time_Stamp
Time of cycle collection HH:MM:SS
hhmmss
0…235,959
2
Real
200mS_Metering_uSecond_Stamp
Microsecond of cycle collection
uS
0.000…999,999
3
Real
200mS_Pos_Seq_Volts
Positive Sequence Voltage
V
0…9.999E15
4
Real
200mS_Neg_Seq_Volts
Negative Sequence Voltage
V
0…9.999E15
5
Real
200mS_Zero_Seq_Volts
Zero Sequence Voltage
V
0…9.999E15
6
Real
200mS_Pos_Seq_Amps
Positive Sequence Amps
A
0…9.999E15
7
Real
200mS_Neg_Seq_Amps
Negative Sequence Amps
A
0…9.999E15
8
Real
200mS_Zero_Seq_Amps
Zero Sequence Amps
A
0…9.999E15
9
Real
200mS_Voltage_Unbalance_%
Voltage percent unbalance
%
0.00…100.00
10
Real
200mS_Current_Unbalance_%
Current percent unbalance
%
0.00…100.00
11
Real
200mS_Sag_Swell_Status_Flag
A flag indicating 200 ms result has been calculated during a Sag, Swell or
Interruption.
%
0…1
12
Real
200mS_Metering_Iteration
A number 0…9,999,999 that indicates that the metering functions and
internal communications are updating.
%
0…9,999,999
372
Rockwell Automation Publication 1426-UM001G-EN-P - November 2014
PowerMonitor 5000 Unit Data Tables
Appendix A
PowerQuality.EN61000_4_30_Aggregation (M8 only)
Table 188 - Table Properties
CIP Instance Number
883
PCCC File Number
F92
No. of Elements
46
Length in Words
92
Data Type
Real
Data Access
Read only
Applies to
M8 only
Table 189 - PowerQuality.EN61000_4_30_Aggregation Data Table
Element
Number
Type
Tag Name
Description
Units
Range
0
Real
3s_Metering_Date_Stamp
Date of interval collection MM:DD:YY
MMDDYY
0…123199
1
Real
3s_Metering_Time_Stamp
Time of interval collection HH:MM:SS
hhmmss
0…235959
2
Real
3s_Metering_uSecond_Stamp
Microsecond of interval collection
uS
0.000…999999
3
Real
10m_Metering_Date_Stamp
Date of interval collection MM:DD:YY
MMDDYY
0…123199
4
Real
10m_Metering_Time_Stamp
Time of interval collection HH:MM:SS
hhmmss
0…235959
5
Real
10m_Metering_uSecond_Stamp
Microsecond of interval collection
uS
0.000…999999
6
Real
2h_Metering_Date_Stamp
Date of interval collection MM:DD:YY
MMDDYY
0…123199
7
Real
2h_Metering_Time_Stamp
Time of interval collection HH:MM:SS
hhmmss
0…235959
8
Real
2h_Metering_uSecond_Stamp
Microsecond of interval collection
uS
0.000…999999
9
Real
10s_Power_Frequency
10 second frequency update
Hz
40.00…70.00
10
Real
3s_V1_N_Magnitude
Aggregated 3 second result
V
0…9.999E15
11
Real
10m_V1_N_Magnitude
Aggregated 10 minute result
V
0…9.999E15
12
Real
2h_V1_N_Magnitude
Aggregated 2 hour result
V
0…9.999E15
13
Real
3s_V2_N_Magnitude
Aggregated 3 second result
V
0…9.999E15
14
Real
10m_V2_N_Magnitude
Aggregated 10 minute result
V
0…9.999E15
15
Real
2h_V2_N_Magnitude
Aggregated 2 hour result
V
0…9.999E15
16
Real
3s_V3_N_Magnitude
Aggregated 3 second result
V
0…9.999E15
17
Real
10m_V3_N_Magnitude
Aggregated 10 minute result
V
0…9.999E15
18
Real
2h_V3_N_Magnitude
Aggregated 2 hour result
V
0…9.999E15
19
Real
3s_VN_G_Magnitude
Aggregated 3 second result
V
0…9.999E15
20
Real
10m_VN_G_Magnitude
Aggregated 10 minute result
V
0…9.999E15
21
Real
2h_VN_G_Magnitude
Aggregated 2 hour result
V
0…9.999E15
22
Real
3s_V1_V2_Magnitude
Aggregated 3 second result
V
0…9.999E15
23
Real
10m_V1_V2_Magnitude
Aggregated 10 minute result
V
0…9.999E15
24
Real
2h_V1_V2_Magnitude
Aggregated 2 hour result
V
0…9.999E15
25
Real
3s_V2_V3_Magnitude
Aggregated 3 second result
V
0…9.999E15
26
Real
10m_V2_V3_Magnitude
Aggregated 10 minute result
V
0…9.999E15
27
Real
2h_V2_V3_Magnitude
Aggregated 2 hour result
V
0…9.999E15
Rockwell Automation Publication 1426-UM001G-EN-P - November 2014
373
Appendix A
PowerMonitor 5000 Unit Data Tables
Table 189 - PowerQuality.EN61000_4_30_Aggregation Data Table
Element
Number
Type
Tag Name
Description
Units
Range
28
Real
3s_V3_V1_Magnitude
Aggregated 3 second result
V
0…9.999E15
29
Real
10m_V3_V1_Magnitude
Aggregated 10 minute result
V
0…9.999E15
30
Real
2h_V3_V1_Magnitude
Aggregated 2 hour result
V
0…9.999E15
31
Real
CH1_Short_Term_Flicker_Pst
Flicker short term result
Pst
0.00…100.00
32
Real
CH1_Long_Term_Flicker_Plt
Flicker long term result
Plt
0.00…100.00
33
Real
CH2_Short_Term_Flicker_Pst
Flicker short term result
Pst
0.00…100.00
34
Real
CH2_Long_Term_Flicker_Plt
Flicker long term result
Plt
0.00…100.00
35
Real
CH3_Short_Term_Flicker_Pst
Flicker short term result
Pst
0.00…100.00
36
Real
CH3_Long_Term_Flicker_Plt
Flicker long term result
Plt
0.00…100.00
37
Real
CH1_Mains_Signaling_Voltage
3 second aggregation used for EN50160
V
0…9.999E15
38
Real
CH2_Mains_Signaling_Voltage
3 second aggregation used for EN50160
V
0…9.999E15
39
Real
CH3_Mains_Signaling_Voltage
3 second aggregation used for EN50160
V
0…9.999E15
40
Real
3s_Voltage_Unbalance
Aggregated 3 second result
%
0.00…100.00
41
Real
10m_Voltage_Unbalance
Aggregated 10 minute result
%
0.00…100.00
42
Real
2h_Voltage_Unbalance
Aggregated 2 hour result
%
0.00…100.00
43
Real
3s_Sag_Swell_Status_Flag
A flag indicating the 3s result has been calculated during a Sag, Swell, or
Interruption.
#
0…1
44
Real
10m_Sag_Swell_Status_Flag
A flag indicating the 10min result has been calculated during a Sag, Swell,
or Interruption.
#
0…1
45
Real
2h_Sag_Swell_Status_Flag
A flag indicating the 2hr result has been calculated during a Sag, Swell, or
Interruption.
#
0…1
374
Rockwell Automation Publication 1426-UM001G-EN-P - November 2014
PowerMonitor 5000 Unit Data Tables
Appendix A
PowerQuality.EN50160_Compliance_Results (M8 only)
Table 190 - Table Properties
CIP Instance Number
884
PCCC File Number
F93
No. of Elements
40
Length in Words
80
Data Type
Real
Data Access
Read only
Applies to
M8 only
Table 191 - PowerQuality.EN50160_Compliance_Results Data Table
Element
Number
Type
Tag Name
Description
Units
Range
0
Real
Mains Signaling Voltage
(Not logged and updated once per day.) 3 Sec. Interval, this parameter is
the percentage of compliance for the day calculated from the 3 second
aggregation values during the day
%
0.00…100.00
1
Real
Supply Voltage Range 1
Aggregated result from weekly log
%
0.00…100.00
2
Real
Supply Voltage Range 2
Aggregated result from weekly log
%
0.00…100.00
3
Real
Flicker Severity Plt
Aggregated result from weekly log
Plt
0.00…100.00
4
Real
Supply Voltage Unbalance
Aggregated result from weekly log
%
0.00…100.00
5
Real
Individual Harmonic Voltage
Aggregated result from weekly log
%
0.00…100.00
6
Real
Voltage THD
Aggregated result from weekly log
%
0.00…100.00
7
Real
Power Frequency Range 1
Synchronous is yearly aggregation, Non-synchronous is weekly
aggregation
%
0.00…100.00
8
Real
Power Frequency Range 2
Synchronous is yearly aggregation, Non-synchronous is weekly
aggregation
%
0.00…100.00
9
Real
Sag 90%u to 80%u,10mS to 200mS Duration
Number of sag incidence in the assigned cell. Aggregated result from
yearly log.
#
0…9,999,999
10
Real
Sag 90%u to 80%u,200mS to 500mS Duration
Number of sag incidence in the assigned cell. Aggregated result from
yearly log.
#
0…9,999,999
11
Real
Sag 90%u to 80%u,500mS to 1000mS Duration
Number of sag incidence in the assigned cell. Aggregated result from
yearly log.
#
0…9,999,999
12
Real
Sag 90%u to 80%u,1000mS to 5000mS Duration Number of sag incidence in the assigned cell. Aggregated result from
yearly log.
#
0…9,999,999
13
Real
Sag 90%u to 80%u,5000mS to 60000mS
Duration
Number of sag incidence in the assigned cell. Aggregated result from
yearly log.
#
0…9,999,999
14
Real
Sag 80%u to 70%u,10mS to 200mS Duration
Number of sag incidence in the assigned cell. Aggregated result from
yearly log.
#
0…9,999,999
15
Real
Sag 80%u to 70%u,200mS to 500mS Duration
Number of sag incidence in the assigned cell. Aggregated result from
yearly log.
#
0…9,999,999
16
Real
Sag 80%u to 70%u,500mS to 1000mS Duration
Number of sag incidence in the assigned cell. Aggregated result from
yearly log.
#
0…9,999,999
17
Real
Sag 80%u to 70%u,1000mS to 5000mS Duration Number of sag incidence in the assigned cell. Aggregated result from
yearly log.
#
0…9,999,999
18
Real
Sag 80%u to 70%u,5000mS to 60000mS
Duration
#
0…9,999,999
Number of sag incidence in the assigned cell. Aggregated result from
yearly log.
Rockwell Automation Publication 1426-UM001G-EN-P - November 2014
375
Appendix A
PowerMonitor 5000 Unit Data Tables
Table 191 - PowerQuality.EN50160_Compliance_Results Data Table
Element
Number
Type
Tag Name
Description
Units
Range
19
Real
Sag 70%u to 40%u,10mS to 200mS Duration
Number of sag incidence in the assigned cell. Aggregated result from
yearly log.
#
0…9,999,999
20
Real
Sag 70%u to 40%u,200mS to 500mS Duration
Number of sag incidence in the assigned cell. Aggregated result from
yearly log.
#
0…9,999,999
21
Real
Sag 70%u to 40%u,500mS to 1000mS Duration
Number of sag incidence in the assigned cell. Aggregated result from
yearly log.
#
0…9,999,999
22
Real
Sag 70%u to 40%u,1000mS to 5000mS Duration Number of sag incidence in the assigned cell. Aggregated result from
yearly log.
#
0…9,999,999
23
Real
Sag 70%u to 40%u,5000mS to 60000mS
Duration
Number of sag incidence in the assigned cell. Aggregated result from
yearly log.
#
0…9,999,999
24
Real
Sag 40%u to 5%u,10mS to 200mS Duration
Number of sag incidence in the assigned cell. Aggregated result from
yearly log.
#
0…9,999,999
25
Real
Sag 40%u to 5%u,200mS to 500mS Duration
Number of sag incidence in the assigned cell. Aggregated result from
yearly log.
#
0…9,999,999
26
Real
Sag 40%u to 5%u,500mS to 1000mS Duration
Number of sag incidence in the assigned cell. Aggregated result from
yearly log.
#
0…9,999,999
27
Real
Sag 40%u to 5%u,1000mS to 5000mS Duration
Number of sag incidence in the assigned cell. Aggregated result from
yearly log.
#
0…9,999,999
28
Real
Sag 40%u to 5%u,5000mS to 60000mS Duration Number of sag incidence in the assigned cell. Aggregated result from
yearly log.
#
0…9,999,999
29
Real
Sag less than 5%u,10mS to 200mS Duration
Number of sag incidence in the assigned cell. Aggregated result from
yearly log.
#
0…9,999,999
30
Real
Sag less than 5%u,200mS to 500mS Duration
Number of sag incidence in the assigned cell. Aggregated result from
yearly log.
#
0…9,999,999
31
Real
Sag less than 5%u,500mS to1000mS Duration
Number of sag incidence in the assigned cell. Aggregated result from
yearly log.
#
0…9,999,999
32
Real
Sag less than 5%u,1000mS to 5000mS Duration
Number of sag incidence in the assigned cell. Aggregated result from
yearly log.
#
0…9,999,999
33
Real
Sag less than 5%u,5000mS to 60000mS
Duration
Number of sag incidence in the assigned cell. Aggregated result from
yearly log.
#
0…9,999,999
34
Real
Swell 120%u or greater, 10mS to 500mS
Duration
Number of swell incidence in the assigned cell. Aggregated result from
yearly log.
#
0…9,999,999
35
Real
Swell 120%u or greater, 500mS to 5000mS
Duration
Number of swell incidence in the assigned cell. Aggregated result from
yearly log.
#
0…9,999,999
36
Real
Swell 120%u or greater, 5000mS to 60000mS
Duration
Number of swell incidence in the assigned cell. Aggregated result from
yearly log.
#
0…9,999,999
37
Real
Swell 120%u to 110%u, 10mS to 500mS
Duration
Number of swell incidence in the assigned cell. Aggregated result from
yearly log.
#
0…9,999,999
38
Real
Swell 120%u to 110%u, 500mS to 5000mS
Duration
Number of swell incidence in the assigned cell. Aggregated result from
yearly log.
#
0…9,999,999
39
Real
Swell 120%u to 110%u, 5000mS to 60000mS
Duration
Number of swell incidence in the assigned cell. Aggregated result from
yearly log.
#
0…9,999,999
376
Rockwell Automation Publication 1426-UM001G-EN-P - November 2014
PowerMonitor 5000 Unit Data Tables
Appendix A
PowerQuality.Harmonics_Results (M6 and M8 model)
Table 192 - Table Properties
CIP Instance Number
860
PCCC File Number
F69
No. of Elements
37
Length in Words
74
Data Type
Real
Data Access
Read Only
Table 193 - PowerQuality.Harmonics_Results Data Table
Element Type
Number
Tag Name
Description
Units
Range
0
Real
Metering_Date_Stamp
Date of cycle collection MM:DD:YY
MMDDYY
0…123199
1
Real
Metering_Time_Stamp
Time of cycle collection hhmmss
hhmmss
0…235959
2
Real
Metering_Microsecond_Stamp Microsecond of cycle collection
uS
0.000…999,999
3
Real
Channel_Parameter
Indicates the channel selected in the most recent write of Table
Configuration.Harmonics_Optional_Read
0 = No Selection
1 = V1-N RMS
2 = V2-N RMS
3 = V3-N RMS
4 = VN-G RMS
5 = V1-V2 RMS
6 = V2-V3 RMS
7 = V3-V1 RMS
8 = I1 RMS
9 = I2 RMS
10 = I3 RMS
11 = I4 RMS
12 = L1 kW RMS
13 = L2 kW RMS
14 = L3 kW RMS
15 = L1 kVAR RMS
16 = L2 kVAR RMS
17 = L3 kVAR RMS
18 = L1 kVA RMS
19 = L2 kVA RMS
20 = L3 kVA RMS
21 = Total kW RMS
22 = Total kVAR RMS
23 = Total kVA RMS
24 = V1-N Angle
25 = V2-N Angle
26 = V3-N Angle
27 = VN-G Angle
28 = V1-V2 Angle
29 = V2-V3 Angle
30 = V3-V1 Angle
31 = I1 Angle
32 = I2 Angle
33 = I3 Angle
34 = I4 Angle
1…34
4
Real
Order
Selected harmonics order range.
0 = DC…31st
1 = 32nd…63rd
2 = 64th…95th
3 = 96th…127th
0…1 (M6)
0…3 (M8)
Rockwell Automation Publication 1426-UM001G-EN-P - November 2014
377
Appendix A
PowerMonitor 5000 Unit Data Tables
Table 193 - PowerQuality.Harmonics_Results Data Table
Element Type
Number
Tag Name
Description
Units
Range
5
Real
X_(0 + Order * 32)
Real
X_(1 + Order * 32)
7
Real
X_(2 + Order * 32)
8
Real
X_(3 + Order * 32)
V, A, kW,
kVAR, kVA,
or degrees,
depending
on value of
Channel
-9.999E15…9.999E15
6
The returned value X_(h) (RMS magnitude or angle) for the spectral component
specified by Channel at harmonic h
9
Real
X_(4 + Order * 32)
-9.999E15…9.999E15
10
Real
X_(5 + Order * 32)
-9.999E15…9.999E15
11
Real
X_(6 + Order * 32)
-9.999E15…9.999E15
12
Real
X_(7 + Order * 32)
-9.999E15…9.999E15
13
Real
X_(8 + Order * 32)
-9.999E15…9.999E15
14
Real
X_(9 + Order * 32)
-9.999E15…9.999E15
15
Real
X_(10 + Order * 32)
-9.999E15…9.999E15
16
Real
X_(11 + Order * 32)
-9.999E15…9.999E15
17
Real
X_(12 + Order * 32)
-9.999E15…9.999E15
18
Real
X_(13 + Order * 32)
-9.999E15…9.999E15
19
Real
X_(14 + Order * 32)
-9.999E15…9.999E15
20
Real
X_(15 + Order * 32)
-9.999E15…9.999E15
21
Real
X_(16 + Order * 32)
-9.999E15…9.999E15
22
Real
X_(17 + Order * 32)
-9.999E15…9.999E15
23
Real
X_(18 + Order * 32)
-9.999E15…9.999E15
24
Real
X_(19 + Order * 32)
-9.999E15…9.999E15
25
Real
X_(20 + Order * 32)
-9.999E15…9.999E15
26
Real
X_(21 + Order * 32)
-9.999E15…9.999E15
27
Real
X_(22 + Order * 32)
-9.999E15…9.999E15
28
Real
X_(23 + Order * 32)
-9.999E15…9.999E15
29
Real
X_(24 + Order * 32)
-9.999E15…9.999E15
30
Real
X_(25 + Order * 32)
-9.999E15…9.999E15
31
Real
X_(26 + Order * 32)
-9.999E15…9.999E15
32
Real
X_(27 + Order * 32)
-9.999E15…9.999E15
33
Real
X_(28 + Order * 32)
-9.999E15…9.999E15
34
Real
X_(29 + Order * 32)
-9.999E15…9.999E15
35
Real
X_(30 + Order * 32)
-9.999E15…9.999E15
36
Real
X_(31 + Order * 32)
-9.999E15…9.999E15
378
Rockwell Automation Publication 1426-UM001G-EN-P - November 2014
-9.999E15…9.999E15
-9.999E15…9.999E15
-9.999E15…9.999E15
PowerMonitor 5000 Unit Data Tables
Appendix A
PowerQuality.IEEE1159_Results (M6 and M8 model)
Table 194 - Table Properties
CIP Instance Number
863
PCCC File Number
F72
No. of Elements
26
Length in Words
52
Data Type
Real
Data Access
Read Only
Table 195 - PowerQuality.IEEE1159_Results Data Table
Element Type
Number
Tag Name
Description
Units
Range
0
Real
Metering_Date_Stamp
Date of cycle collection MMDDYY
MMDDYY
0…123199
1
Real
Metering_Time_Stamp
Time of cycle collection hhmmss
hhmmss
0…235959
2
Real
Metering Microsecond Stamp
Microsecond of cycle collection
uS
0.000…999,999
3
Real
IEEE1159_Volts_Imbalance_%
The rolling average for IEEE1159 voltage imbalance
%
0.0…100.00
4
Real
IEEE1159_Current_Imbalance_%
The rolling average for IEEE1159 current imbalance
%
0.0…100.00
5
Real
IEEE1159_Power_Frequency_Hz
The rolling variation from nominal frequency setting.
Hz
0.0…70.00
6
Real
IEEE1159_V1_DC_Offset_%
The rolling average for V1 voltage dc offset
%
0.0…100.00
7
Real
IEEE1159_V2_DC_Offset_%
The rolling average for V2 voltage dc offset
%
0.0…100.00
8
Real
IEEE1159_V3_DC_Offset_%
The rolling average for V3 voltage dc offset
%
0.0…100.00
9
Real
IEEE1159_V1_THD_%
The rolling average for V1 Voltage THD
%
0.0…100.00
10
Real
IEEE1159_V2_THD_%
The rolling average for V2 Voltage THD
%
0.0…100.00
11
Real
IEEE1159_V3_THD_%
The rolling average for V3 Voltage THD
%
0.0…100.00
12
Real
IEEE1159_I1_THD_%
The rolling average for I1 Current THD
%
0.0…100.00
13
Real
IEEE1159_I2_THD_%
The rolling average for I2 Current THD
%
0.0…100.00
14
Real
IEEE1159_I3_THD_%
The rolling average for I3 Current THD
%
0.0…100.00
15
Real
IEEE1159_I4_THD_%
The rolling average for I4 Current THD
%
0.0…100.00
16
Real
IEEE1159_V1_TID_%
The rolling average for V1 Interharmonic Voltage TID
%
0.0…100.00
(M8 Only)
17
Real
IEEE1159_V2_TID_%
The rolling average for V2 Interharmonic Voltage TID
%
0.0…100.00
(M8 Only)
18
Real
IEEE1159_V3_TID_%
The rolling average for V3 Interharmonic Voltage TID
%
0.0…100.00
(M8 Only)
19
Real
IEEE1159_I1_TID_%
The rolling average for I1 Interharmonic Current TID
%
0.0…100.00
(M8 Only)
20
Real
IEEE1159_I2_TID_%
The rolling average for I2 Interharmonic Current TID
%
0.0…100.00
(M8 Only)
21
Real
IEEE1159_I3_TID_%
The rolling average for I3 Interharmonic Current TID
%
0.0…100.00
(M8 Only)
22
Real
IEEE1159_I4_TID_%
The rolling average for I4 Interharmonic Current TID
%
0.0…100.00
(M8 Only)
Rockwell Automation Publication 1426-UM001G-EN-P - November 2014
379
Appendix A
PowerMonitor 5000 Unit Data Tables
Table 195 - PowerQuality.IEEE1159_Results Data Table
Element Type
Number
Tag Name
Description
Units
Range
23
Real
IEEE1159_V1_Fluctuation_Pst
The index value for V1 short term duration flicker.
Pst
0.0…100.00
(M8 Only)
24
Real
IEEE1159_V2_Fluctuation_Pst
The index value for V2 short term duration flicker.
Pst
0.0…100.00
(M8 Only)
25
Real
IEEE1159_V3_Fluctuation_Pst
The index value for V3 short term duration flicker.
Pst
0.0…100.00
(M8 Only)
380
Rockwell Automation Publication 1426-UM001G-EN-P - November 2014
PowerMonitor 5000 Unit Data Tables
Appendix A
PowerQuality.Synchro_Phasor_Results
Table 196 - Table Properties
CIP Instance Number
894
PCCC File Number
F103
No. of Elements
26
Length in Words
52
Data Type
Real
Data Access
Read Only
Table 197 - PowerQuality.Synchro_Phasor_Results Data Table
Element Type
Number
Tag Name
Description
Units
Range
0
Real
Metering_Date_Stamp
Date of cycle collection MMDDYY
MMDDYY
0…123199
1
Real
Metering_Time_Stamp
Time of cycle collection hhmmss
hhmmss
0…235959
2
Real
Metering_Microsecond_Stamp
Microsecond of cycle collection
uS
0.000…999,999
3
Real
Frequency_Hz
Last Line Frequency Calculated.
Hz
40.00…70.00
4
Real
V1_N_Volts_Fundamental_RMS
Volts to neutral fundamental magnitude.
V
0…9.999E15
5
Real
V1_N_Volts_Fundamental_Ang
Volts to neutral fundamental angle.
Degrees
0…9.999E15
6
Real
V2_N_Volts_Fundamental_RMS
Volts to neutral fundamental magnitude.
V
0…9.999E15
7
Real
V2_N_Volts_Fundamental_Ang
Volts to neutral fundamental angle.
Degrees
0…9.999E15
8
Real
V3_N_Volts_Fundamental_RMS
Volts to neutral fundamental magnitude.
V
0…9.999E15
9
Real
V3_N_Volts_Fundamental_Ang
Volts to neutral fundamental angle.
Degrees
0…9.999E15
10
Real
VN_G_Volts_Fundamental_RMS
VN to G fundamental magnitude.
V
0…9.999E15
11
Real
VN_G_Volts_Fundamental_Ang
VN to G fundamental angle.
Degrees
0…9.999E15
12
Real
V1_V2_Volts_Fundamental_RMS
Line to Line fundamental magnitude.
V
0…9.999E15
13
Real
V1_V2_Volts_Fundamental_Ang
Line to Line fundamental angle.
Degrees
0…9.999E15
14
Real
V2_V3_Volts_Fundamental_RMS
Line to Line fundamental magnitude.
V
0…9.999E15
15
Real
V2_V3_Volts_Fundamental_Ang
Line to Line fundamental angle.
Degrees
0…9.999E15
16
Real
V3_V1_Volts_Fundamental_RMS
Line to Line fundamental magnitude.
V
0…9.999E15
17
Real
V3_V1_Volts_Fundamental_Ang
Line to Line fundamental angle.
Degrees
0…9.999E15
18
Real
I1_Amps_Fundamental_RMS
I1 current fundamental magnitude.
A
0…9.999E15
19
Real
I1_Amps_Fundamental_Ang
I1 current fundamental angle.
Degrees
0…9.999E15
20
Real
I2_Amps_Fundamental_RMS
I2 current fundamental magnitude.
A
0…9.999E15
21
Real
I2_Amps_Fundamental_Ang
I2 current fundamental angle.
Degrees
0…9.999E15
22
Real
I3_Amps_Fundamental_RMS
I3 current fundamental magnitude.
A
0…9.999E15
23
Real
I3_Amps_Fundamental_Ang
I3 current fundamental angle.
Degrees
0…9.999E15
24
Real
I4_Amps_Fundamental_RMS
I4 current fundamental magnitude.
A
0…9.999E15
25
Real
I4_Amps_Fundamental_Ang
I4 current fundamental angle.
Degrees
0…9.999E15
Rockwell Automation Publication 1426-UM001G-EN-P - November 2014
381
Appendix A
PowerMonitor 5000 Unit Data Tables
PowerQuality.IEEE519_ Results (M6 and M8 model)
The PowerMonitor 5000 M6 and M8 models return short- and long-term rolling
average harmonic distortion data for the fundamental and the first 40 harmonic
frequencies. These results are presented in six similar data tables.
Table 198 - Table Properties
Data Table Name
CIP Instance
Number
PCCC File No.
PowerQuality.IEEE519_CH1_ShortTerm_Results
895
F104
PowerQuality.IEEE519_CH2_ShortTerm_Results
896
F105
PowerQuality.IEEE519_CH3_ShortTerm_Results
897
F106
PowerQuality.IEEE519_CH1_LongTerm_Results
898
F107
PowerQuality.IEEE519_CH2_LongTerm_Results
899
F108
PowerQuality.IEEE519_CH3_LongTerm_Results
900
F109
These tables share the following properties.
No. of Elements
44
Length in Words
88
Data Type
Real
Data Access
Read Only
IMPORTANT
Channel assignments are based on the value of the tag
IEEE519_Compliance_Parameter found in the Configuration.PowerQuality
table.
IEEE519_Compliance_Parameter
Channel 1
Channel 2
Channel 3
0 = Current
I1
I2
I3
1 = Voltage (Wye, Split Phase, and
Single Phase)
V1-N
V2-N
V3-N
1 = Voltage (Delta)
V1-V2
V2-V3
V3-V1
The IEEE519 Results data tables share a common structure. In the data table
template shown, substitute the following into the Data Table Name and Tag
Name strings to obtain the specific names:
• For ‘<CH>’, substitute ‘CH1’, ‘CH2’, or ‘CH3’.
• For ‘<Term>’, substitute ‘ShortTerm’ or ‘LongTerm’.
For example, the tag CH3_5th_Harmonic_IEEE519_ShortTerm in the
PowerQuality.IEEE519_CH3 _ShortTerm_Results table returns the short-term
5th harmonic value for Channel 3.
382
Rockwell Automation Publication 1426-UM001G-EN-P - November 2014
PowerMonitor 5000 Unit Data Tables
Appendix A
Table 199 - PowerQuality.IEEE519 Results Data Table Template
Element Type
Number
Tag Name
Description
Units
Range
0
Real
Metering_Date_Stamp
Date of cycle collection MMDDYY
MMDDYY
0…123199
1
Real
Metering_Time_Stamp
Time of cycle collection hhmmss
hhmmss
0…235959
2
Real
Metering_Microsecond_Stamp
Microsecond of cycle collection
uS
0.000…999,999
3
Real
<CH>_Fundamental_IEEE519_<Term>_RMS
The fundamental RMS magnitude.
Volts or Amps RMS
0…9.999E15
4
Real
<CH>_2nd_Harmonic_IEEE519_<Term>_%
Percent of Fundamental or Maximum Demand Current
%
0.000…100.000
5
Real
<CH>_3rd_Harmonic_IEEE519_<Term>_%
6
Real
<CH>_4th_Harmonic_IEEE519_<Term>_%
7
Real
<CH>_5th_Harmonic_IEEE519_<Term>_%
8
Real
<CH>_6th_Harmonic_IEEE519_<Term>_%
9
Real
<CH>_7th_Harmonic_IEEE519_<Term>_%
10
Real
<CH>_8th_Harmonic_IEEE519_<Term>_%
11
Real
<CH>_9th_Harmonic_IEEE519_<Term>_%
12
Real
<CH>_10th_Harmonic_IEEE519_<Term>_%
13
Real
<CH>_11th_Harmonic_IEEE519_<Term>_%
14
Real
<CH>_12th_Harmonic_IEEE519_<Term>_%
15
Real
<CH>_13th_Harmonic_IEEE519_<Term>_%
16
Real
<CH>_14th_Harmonic_IEEE519_<Term>_%
17
Real
<CH>_15th_Harmonic_IEEE519_<Term>_%
18
Real
<CH>_16th_Harmonic_IEEE519_<Term>_%
19
Real
<CH>_17th_Harmonic_IEEE519_<Term>_%
20
Real
<CH>_18th_Harmonic_IEEE519_<Term>_%
21
Real
<CH>_19th_Harmonic_IEEE519_<Term>_%
22
Real
<CH>_20th_Harmonic_IEEE519_<Term>_%
23
Real
<CH>_21st_Harmonic_IEEE519_<Term>_%
24
Real
<CH>_22nd_Harmonic_IEEE519_<Term>_%
25
Real
<CH>_23rd_Harmonic_IEEE519_<Term>_%
26
Real
<CH>_24th_Harmonic_IEEE519_<Term>_%
27
Real
<CH>_25th_Harmonic_IEEE519_<Term>_%
28
Real
<CH>_26th_Harmonic_IEEE519_<Term>_%
29
Real
<CH>_27th_Harmonic_IEEE519_<Term>_%
30
Real
<CH>_28th_Harmonic_IEEE519_<Term>_%
31
Real
<CH>_29th_Harmonic_IEEE519_<Term>_%
32
Real
<CH>_30th_Harmonic_IEEE519_<Term>_%
33
Real
<CH>_31st_Harmonic_IEEE519_<Term>_%
34
Real
<CH>_32nd_Harmonic_IEEE519_<Term>_%
35
Real
<CH>_33rd_Harmonic_IEEE519_<Term>_%
36
Real
<CH>_34th_Harmonic_IEEE519_<Term>_%
37
Real
<CH>_35th_Harmonic_IEEE519_<Term>_%
Rockwell Automation Publication 1426-UM001G-EN-P - November 2014
383
Appendix A
PowerMonitor 5000 Unit Data Tables
Table 199 - PowerQuality.IEEE519 Results Data Table Template
Element Type
Number
Tag Name
Description
Units
Range
38
Real
<CH>_36th_Harmonic_IEEE519_<Term>_%
Percent of Fundamental
%
0.000…100.000
39
Real
<CH>_37th_Harmonic_IEEE519_<Term>_%
40
Real
<CH>_38th_Harmonic_IEEE519_<Term>_%
41
Real
<CH>_39th_Harmonic_IEEE519_<Term>_%
42
Real
<CH>_40th_Harmonic_IEEE519_<Term>_%
43
Real
<CH>_IEEE519_Total_Distortion_<Term>_%
Percent of Fundamental
IMPORTANT: Value reported is THD or TDD based on
configuration setting of IEEE_519_MAX_Isc and
IEEE_519_MAX_IL on the Configuration.PowerQuality
table for Current. The value is always THD for Voltage.
IMPORTANT
Data Table Name: PowerQuality.IEEE519_<CH>_<Term>_Results
PowerQuality.Harmonics Results (M6 and M8 model)
These tables share the following properties.
Table 200 - Table Properties
No. of Elements
35
Length in Words
70
Data Type
Real
Data Access
Read Only
Applies to
M6 and M8
only
The individual harmonic results are not assigned PCCC file numbers.
The Harmonics Results data tables share a common structure. Four data table
templates are shown below, one for DC through the 31st order, the second for
the 32nd through the 63rd order, the third for the 64th through the 95th, and
the fourth for the 96th through the 127th order. The data table name and tag
name structures are:
• Data Table Name:
– PowerQuality.<CH>_<Units>_H1 _<Mag/Angle> (DC…31)
– PowerQuality.<CH>_<Units>_H2 _<Mag/Angle> (32…63)
– PowerQuality.<CH>_<Units>_H3_<Mag/Angle>(64…95)
– PowerQuality.<CH>_<Units>_H4_<Mag/Angle>(96…127)
• Tag Name: <CH>_<Units>_h#_H_<Mag/Angle>
Substitute the following into the Data Table Name and Tag Name strings to
obtain the specific names.
384
Rockwell Automation Publication 1426-UM001G-EN-P - November 2014
PowerMonitor 5000 Unit Data Tables
Appendix A
Table 201 - Substitution Table
For:
Substitute:
To return these harmonic results:
<CH>
Total
Total (3-phase) power
L1
Line (Phase) 1 power
L2
Line (Phase) 2 power
L3
Line (Phase) 3 power
V1_N
Line 1 to Neutral voltage
V2_N
Line 2 to Neutral voltage
V3_N
Line 3 to Neutral voltage
VN_G
Neutral to Ground voltage
V1_V2
Line 1 to Line 2 voltage
V2_V3
Line 2 to Line 3 voltage
V3_V1
Line 3 to Line 1 voltage
I1
Line 1 current
I2
Line 2 current
I3
Line 3 current
<Units>
<Mag/Angle>
I4
Line 4 current
kW
Real power
kVAR
Reactive power
kVA
Apparent power
Volts
Voltage
Amps
Current
RMS
RMS magnitude
Ang
Angle referenced to the metering time
stamp
For example, the tag I1_Amps_h5_H_RMS in the
PowerQuality.I1_Amps_H1_RMS (DC…31) table returns the RMS magnitude
of the 5th harmonic for Line 1 current.
Rockwell Automation Publication 1426-UM001G-EN-P - November 2014
385
Appendix A
PowerMonitor 5000 Unit Data Tables
Table 202 - Harmonics Results Assembly Instance Lookup Table
PowerQuality. Harmonics Results
Results table assembly instance ID:
DC…31st
Magnitude
32nd…63rd
Magnitude
64th…95th
Magnitude
96th…127th DC…31st 32nd…63rd
Magnitude
Angle
Angle
Total (3-phase) real power, kW
1001
1002
1003
1004
Total (3-phase) reactive power, kVAR
1005
1006
1007
1008
Total (3-phase) apparent power, kVA
1009
1010
1011
1012
Line 1 (Phase) real power, kW
1057
1058
1059
1060
Line 1 (Phase) reactive power, kVAR
1069
1070
1071
1072
Line 1 (Phase) apparent power, kVA
1081
1082
1083
1084
64th…95th
Angle
96th…127th
Angle
n/a
n/a
n/a
n/a
Line 2 (Phase) real power, kW
1061
1062
1063
1064
Line 2 (Phase) reactive power, kVAR
1073
1074
1075
1076
Line 2 (Phase) apparent power, kVA
1085
1086
1087
1088
Line 3 (Phase) real power, kW
1065
1066
1067
1068
Line 3 (Phase) reactive power, kVAR
1077
1078
1079
1080
Line 3 (Phase) apparent power, kVA
1089
1090
1091
1092
Line 1 to Neutral voltage
1013
1014
1015
1016
1093
1094
1095
1096
Line 2 to Neutral voltage
1017
1018
1019
1020
1097
1098
1099
1100
Line 3 to Neutral voltage
1021
1022
1023
1024
1101
1102
1103
1104
Neutral to Ground voltage
1025
1026
1027
1028
1105
1106
1107
1108
Line 1 to Line 2 voltage
1029
1030
1031
1032
1109
1110
1111
1112
Line 2 to Line 3 voltage
1033
1034
1035
1036
1113
1114
1115
1116
Line 3 to Line 1 voltage
1037
1038
1039
1040
1117
1118
1119
1120
Line 1 current
1041
1042
1043
1044
1121
1122
1123
1124
Line 2 current
1045
1046
1047
1048
1125
1126
1127
1128
Line 3 current
1049
1050
1051
1052
1129
1130
1131
1132
Line 4 current
1053
1054
1055
1056
1133
1134
1135
1136
386
Rockwell Automation Publication 1426-UM001G-EN-P - November 2014
PowerMonitor 5000 Unit Data Tables
Appendix A
Table 203 - PowerQuality.Harmonic Results Data Table template, H1 Order Range (DC …31)
Element
Number
Type
Tag Name
Description
Units
Range
0
Real
Metering_Date_Stamp
Date of cycle collection MMDDYY
MMDDYY
0…123199
1
Real
Metering_Time_Stamp
Time of cycle collection hhmmss
hhmmss
0…235959
2
Real
Metering_Microsecond_Stamp
Microsecond of cycle collection
uS
0.000…999,999
3
Real
<CH>_<Units>_DC_H_<Mag/Angle>
Real
<CH>_<Units>_h1_H_<Mag/Angle>
5
Real
<CH>_<Units>_h2_H_<Mag/Angle>
Same as <Units> string in
Tag Name: kW kVAR kVA
Volts Amps;
if Angle, Degrees.
-9.999E15…9.999E15
4
The value of the specified harmonic
component: RMS magnitude or Angle
6
Real
<CH>_<Units>_h3_H_<Mag/Angle>
-9.999E15…9.999E15
7
Real
<CH>_<Units>_h4_H_<Mag/Angle>
-9.999E15…9.999E15
8
Real
<CH>_<Units>_h5_H_<Mag/Angle>
-9.999E15…9.999E15
9
Real
<CH>_<Units>_h6_H_<Mag/Angle>
-9.999E15…9.999E15
10
Real
<CH>_<Units>_h7_H_<Mag/Angle>
-9.999E15…9.999E15
11
Real
<CH>_<Units>_h8_H_<Mag/Angle>
-9.999E15…9.999E15
12
Real
<CH>_<Units>_h9_H_<Mag/Angle>
-9.999E15…9.999E15
13
Real
<CH>_<Units>_h10_H_<Mag/Angle>
-9.999E15…9.999E15
14
Real
<CH>_<Units>_h11_H_<Mag/Angle>
-9.999E15…9.999E15
15
Real
<CH>_<Units>_h12_H_<Mag/Angle>
-9.999E15…9.999E15
16
Real
<CH>_<Units>_h13_H_<Mag/Angle>
-9.999E15…9.999E15
17
Real
<CH>_<Units>_h14_H_<Mag/Angle>
-9.999E15…9.999E15
18
Real
<CH>_<Units>_h15_H_<Mag/Angle>
-9.999E15…9.999E15
19
Real
<CH>_<Units>_h16_H_<Mag/Angle>
-9.999E15…9.999E15
20
Real
<CH>_<Units>_h17_H_<Mag/Angle>
-9.999E15…9.999E15
21
Real
<CH>_<Units>_h18_H_<Mag/Angle>
-9.999E15…9.999E15
22
Real
<CH>_<Units>_h19_H_<Mag/Angle>
-9.999E15…9.999E15
23
Real
<CH>_<Units>_h20_H_<Mag/Angle>
-9.999E15…9.999E15
24
Real
<CH>_<Units>_h21_H_<Mag/Angle>
-9.999E15…9.999E15
25
Real
<CH>_<Units>_h22_H_<Mag/Angle>
-9.999E15…9.999E15
26
Real
<CH>_<Units>_h23_H_<Mag/Angle>
-9.999E15…9.999E15
27
Real
<CH>_<Units>_h24_H_<Mag/Angle>
-9.999E15…9.999E15
28
Real
<CH>_<Units>_h25_H_<Mag/Angle>
-9.999E15…9.999E15
29
Real
<CH>_<Units>_h26_H_<Mag/Angle>
-9.999E15…9.999E15
30
Real
<CH>_<Units>_h27_H_<Mag/Angle>
-9.999E15…9.999E15
31
Real
<CH>_<Units>_h28_H_<Mag/Angle>
-9.999E15…9.999E15
32
Real
<CH>_<Units>_h29_H_<Mag/Angle>
-9.999E15…9.999E15
33
Real
<CH>_<Units>_h30_H_<Mag/Angle>
-9.999E15…9.999E15
34
Real
<CH>_<Units>_h31_H_<Mag/Angle>
-9.999E15…9.999E15
IMPORTANT
-9.999E15…9.999E15
-9.999E15…9.999E15
Data Table Name: PowerQuality.<CH>_<Units>_H1_<Mag/Angle>
(DC…31)
Rockwell Automation Publication 1426-UM001G-EN-P - November 2014
387
Appendix A
PowerMonitor 5000 Unit Data Tables
Table 204 - PowerQuality.Harmonic Results Data Table template, H2 Order Range (32…63)
Element
Number
Type Tag Name
Description
Units
Range
0
Real
Metering_Date_Stamp
Date of cycle collection MMDDYY
MM:DD:YY
0…123199
1
Real
Metering_Time_Stamp
Time of cycle collection hhmmss
hhmmss
0…235959
2
Real
Metering_Microsecond_Stamp
Microsecond of cycle collection
uS
0.000…999,999
3
Real
<CH>_<Units>_h32_H_<Mag/Angle>
Real
<CH>_<Units>_h33_H_<Mag/Angle>
Same as <Units> string in
Tag Name: kW kVAR kVA
Volts Amps
-9.999E15…9.999E15
4
The value of the specified harmonic
component: RMS magnitude or Angle
5
Real
<CH>_<Units>_h34_H_<Mag/Angle>
-9.999E15…9.999E15
6
Real
<CH>_<Units>_h35_H_<Mag/Angle>
-9.999E15…9.999E15
7
Real
<CH>_<Units>_h36_H_<Mag/Angle>
-9.999E15…9.999E15
8
Real
<CH>_<Units>_h37_H_<Mag/Angle>
-9.999E15…9.999E15
9
Real
<CH>_<Units>_h38_H_<Mag/Angle>
-9.999E15…9.999E15
10
Real
<CH>_<Units>_h39_H_<Mag/Angle>
-9.999E15…9.999E15
11
Real
<CH>_<Units>_h40_H_<Mag/Angle>
-9.999E15…9.999E15
12
Real
<CH>_<Units>_h41_H_<Mag/Angle>
-9.999E15…9.999E15
13
Real
<CH>_<Units>_h42_H_<Mag/Angle>
-9.999E15…9.999E15
14
Real
<CH>_<Units>_h43_H_<Mag/Angle>
-9.999E15…9.999E15
15
Real
<CH>_<Units>_h44_H_<Mag/Angle>
-9.999E15…9.999E15
16
Real
<CH>_<Units>_h45_H_<Mag/Angle>
-9.999E15…9.999E15
17
Real
<CH>_<Units>_h46_H_<Mag/Angle>
-9.999E15…9.999E15
18
Real
<CH>_<Units>_h47_H_<Mag/Angle>
-9.999E15…9.999E15
19
Real
<CH>_<Units>_h48_H_<Mag/Angle>
-9.999E15…9.999E15
20
Real
<CH>_<Units>_h49_H_<Mag/Angle>
-9.999E15…9.999E15
21
Real
<CH>_<Units>_h50_H_<Mag/Angle>
-9.999E15…9.999E15
22
Real
<CH>_<Units>_h51_H_<Mag/Angle>
-9.999E15…9.999E15
23
Real
<CH>_<Units>_h52_H_<Mag/Angle>
-9.999E15…9.999E15
24
Real
<CH>_<Units>_h53_H_<Mag/Angle>
-9.999E15…9.999E15
25
Real
<CH>_<Units>_h54_H_<Mag/Angle>
-9.999E15…9.999E15
26
Real
<CH>_<Units>_h55_H_<Mag/Angle>
-9.999E15…9.999E15
27
Real
<CH>_<Units>_h56_H_<Mag/Angle>
-9.999E15…9.999E15
28
Real
<CH>_<Units>_h57_H_<Mag/Angle>
-9.999E15…9.999E15
29
Real
<CH>_<Units>_h58_H_<Mag/Angle>
-9.999E15…9.999E15
30
Real
<CH>_<Units>_h59_H_<Mag/Angle>
-9.999E15…9.999E15
31
Real
<CH>_<Units>_h60_H_<Mag/Angle>
-9.999E15…9.999E15
32
Real
<CH>_<Units>_h61_H_<Mag/Angle>
-9.999E15…9.999E15
33
Real
<CH>_<Units>_h62_H_<Mag/Angle>
-9.999E15…9.999E15
34
Real
<CH>_<Units>_h63_H_<Mag/Angle>
-9.999E15…9.999E15
IMPORTANT
388
-9.999E15…9.999E15
Data Table Name: PowerQuality.<CH>_<Units>_H2_<Mag/
Angle> (32…63)
Rockwell Automation Publication 1426-UM001G-EN-P - November 2014
PowerMonitor 5000 Unit Data Tables
Appendix A
Table 205 - PowerQuality.Harmonic Results Data Table template, H3 Order Range (64…95) (M8 only)
Element
Number
Type
Tag Name
Description
Units
Range
0
Real
Metering_Date_Stamp
Date of cycle collection MMDDYY
MMDDYY
0…123199
1
Real
Metering_Time_Stamp
Time of cycle collection hhmmss
hhmmss
0…235959
2
Real
Metering_Microsecond_Stamp
Microsecond of cycle collection
uS
0.000…999,999
3
Real
<CH>_<Units>_h64_H_<Mag/Angle>
Real
<CH>_<Units>_h65_H_<Mag/Angle>
Same as <Units> string in
Tag Name: kW kVAR kVA
Volts Amps
-9.999E15…9.999E15
4
The value of the specified harmonic
component: RMS magnitude or Angle.
5
Real
<CH>_<Units>_h66_H_<Mag/Angle>
-9.999E15…9.999E15
6
Real
<CH>_<Units>_h67_H_<Mag/Angle>
-9.999E15…9.999E15
7
Real
<CH>_<Units>_h68_H_<Mag/Angle>
-9.999E15…9.999E15
8
Real
<CH>_<Units>_h69_H_<Mag/Angle>
-9.999E15…9.999E15
9
Real
<CH>_<Units>_h70_H_<Mag/Angle>
-9.999E15…9.999E15
10
Real
<CH>_<Units>_h71_H_<Mag/Angle>
-9.999E15…9.999E15
11
Real
<CH>_<Units>_h72_H_<Mag/Angle>
-9.999E15…9.999E15
12
Real
<CH>_<Units>_h73_H_<Mag/Angle>
-9.999E15…9.999E15
13
Real
<CH>_<Units>_h74_H_<Mag/Angle>
-9.999E15…9.999E15
14
Real
<CH>_<Units>_h75_H_<Mag/Angle>
-9.999E15…9.999E15
15
Real
<CH>_<Units>_h76_H_<Mag/Angle>
-9.999E15…9.999E15
16
Real
<CH>_<Units>_h77_H_<Mag/Angle>
-9.999E15…9.999E15
17
Real
<CH>_<Units>_h78_H_<Mag/Angle>
-9.999E15…9.999E15
18
Real
<CH>_<Units>_h79_H_<Mag/Angle>
-9.999E15…9.999E15
19
Real
<CH>_<Units>_h80_H_<Mag/Angle>
-9.999E15…9.999E15
20
Real
<CH>_<Units>_h81_H_<Mag/Angle>
-9.999E15…9.999E15
21
Real
<CH>_<Units>_h82_H_<Mag/Angle>
-9.999E15…9.999E15
22
Real
<CH>_<Units>_h83_H_<Mag/Angle>
-9.999E15…9.999E15
23
Real
<CH>_<Units>_h84_H_<Mag/Angle>
-9.999E15…9.999E15
24
Real
<CH>_<Units>_h85_H_<Mag/Angle>
-9.999E15…9.999E15
25
Real
<CH>_<Units>_h86_H_<Mag/Angle>
-9.999E15…9.999E15
26
Real
<CH>_<Units>_h87_H_<Mag/Angle>
-9.999E15…9.999E15
27
Real
<CH>_<Units>_h88_H_<Mag/Angle>
-9.999E15…9.999E15
28
Real
<CH>_<Units>_h89_H_<Mag/Angle>
-9.999E15…9.999E15
29
Real
<CH>_<Units>_h90_H_<Mag/Angle>
-9.999E15…9.999E15
30
Real
<CH>_<Units>_h91_H_<Mag/Angle>
-9.999E15…9.999E15
31
Real
<CH>_<Units>_h92_H_<Mag/Angle>
-9.999E15…9.999E15
32
Real
<CH>_<Units>_h93_H_<Mag/Angle>
-9.999E15…9.999E15
33
Real
<CH>_<Units>_h94_H_<Mag/Angle>
-9.999E15…9.999E15
34
Real
<CH>_<Units>_h95_H_<Mag/Angle>
-9.999E15…9.999E15
Rockwell Automation Publication 1426-UM001G-EN-P - November 2014
-9.999E15…9.999E15
389
Appendix A
PowerMonitor 5000 Unit Data Tables
Table 206 - PowerQuality.Harmonic Results Data Table template, H4 order range (96…127) (M8 only)
Element
Number
Type
Tag Name
Description
Units
Range
0
Real
Metering_Date_Stamp
Date of cycle collection MMDDYY
MMDDYY
0…123199
1
Real
Metering_Time_Stamp
Time of cycle collection hhmmss
hhmmss
0…235959
2
Real
Metering_Microsecond_Stamp
Microsecond of cycle collection
uS
0.000…999,999
3
Real
<CH>_<Units>_h96_H_<Mag/Angle>
Real
<CH>_<Units>_h97_H_<Mag/Angle>
Same as <Units> string in
Tag Name: kW kVAR kVA
Volts Amps
-9.999E15…9.999E15
4
The value of the specified harmonic
component: RMS magnitude or Angle
5
Real
<CH>_<Units>_h98_H_<Mag/Angle>
-9.999E15…9.999E15
6
Real
<CH>_<Units>_h99_H_<Mag/Angle>
-9.999E15…9.999E15
7
Real
<CH>_<Units>_h100_H_<Mag/Angle>
-9.999E15…9.999E15
8
Real
<CH>_<Units>_h101_H_<Mag/Angle>
-9.999E15…9.999E15
9
Real
<CH>_<Units>_h102_H_<Mag/Angle>
-9.999E15…9.999E15
10
Real
<CH>_<Units>_h103_H_<Mag/Angle>
-9.999E15…9.999E15
11
Real
<CH>_<Units>_h104_H_<Mag/Angle>
-9.999E15…9.999E15
12
Real
<CH>_<Units>_h105_H_<Mag/Angle>
-9.999E15…9.999E15
13
Real
<CH>_<Units>_h106_H_<Mag/Angle>
-9.999E15…9.999E15
14
Real
<CH>_<Units>_h107_H_<Mag/Angle>
-9.999E15…9.999E15
15
Real
<CH>_<Units>_h108_H_<Mag/Angle>
-9.999E15…9.999E15
16
Real
<CH>_<Units>_h109_H_<Mag/Angle>
-9.999E15…9.999E15
17
Real
<CH>_<Units>_h110_H_<Mag/Angle>
-9.999E15…9.999E15
18
Real
<CH>_<Units>_h111_H_<Mag/Angle>
-9.999E15…9.999E15
19
Real
<CH>_<Units>_h112_H_<Mag/Angle>
-9.999E15…9.999E15
20
Real
<CH>_<Units>_h113_H_<Mag/Angle>
-9.999E15…9.999E15
21
Real
<CH>_<Units>_h114_H_<Mag/Angle>
-9.999E15…9.999E15
22
Real
<CH>_<Units>_h115_H_<Mag/Angle>
-9.999E15…9.999E15
23
Real
<CH>_<Units>_h116_H_<Mag/Angle>
-9.999E15…9.999E15
24
Real
<CH>_<Units>_h117_H_<Mag/Angle>
-9.999E15…9.999E15
25
Real
<CH>_<Units>_h118_H_<Mag/Angle>
-9.999E15…9.999E15
26
Real
<CH>_<Units>_h119_H_<Mag/Angle>
-9.999E15…9.999E15
27
Real
<CH>_<Units>_h120_H_<Mag/Angle>
-9.999E15…9.999E15
28
Real
<CH>_<Units>_h121_H_<Mag/Angle>
-9.999E15…9.999E15
29
Real
<CH>_<Units>_h122_H_<Mag/Angle>
-9.999E15…9.999E15
30
Real
<CH>_<Units>_h123_H_<Mag/Angle>
-9.999E15…9.999E15
31
Real
<CH>_<Units>_h124_H_<Mag/Angle>
-9.999E15…9.999E15
32
Real
<CH>_<Units>_h125_H_<Mag/Angle>
-9.999E15…9.999E15
33
Real
<CH>_<Units>_h126_H_<Mag/Angle>
-9.999E15…9.999E15
34
Real
<CH>_<Units>_h127_H_<Mag/Angle>
-9.999E15…9.999E15
390
Rockwell Automation Publication 1426-UM001G-EN-P - November 2014
-9.999E15…9.999E15
PowerMonitor 5000 Unit Data Tables
Appendix A
PowerQuality.EN61000_4_30 Harmonic and Interharmonic Group
Results (M8 only)
These tables share the following properties.
Table 207 - Table Properties
No. of Elements
54
Length in Words
108
Data Type
Real
Data Access
Read only
Applies to
M8 only
The EN61000-4-30 Harmonic and Interharmonic Results data tables share a
common structure.
• Data Table Name:
PowerQuality.<Interval>_<CH>_<Units>_RMS_<HDS/IHDS>
• Tag Name: <Interval>_<CH>_<Units>_RMS_<HDS/IHDS>
(DC…50)
Table 208 - Substitution Table
For:
Substitute:
To return these EN61000_4_30 results:
<Interval>
200mS
200mS interval group
3s
3 second interval group
10m
10 minute interval group
2h
2 hour interval group
V1_N
Line 1 to Neutral voltage
V2_N
Line 2 to Neutral voltage
V3_N
Line 3 to Neutral voltage
VN_G
Neutral to Ground voltage
V1_V2
Line 1 to Line 2 voltage
V2_V3
Line 2 to Line 3 voltage
V3_V1
Line 3 to Line 1 voltage
I1
Line 1 current
I2
Line 2 current
I3
Line 3 current
I4
Line 4 current
Volts
Voltage
Amps
Current
HDS
Harmonic distortion subgroup
IHDS
Interharmonic distortion subgroup
<CH>
<Units>
<HDS/IHDS>
Rockwell Automation Publication 1426-UM001G-EN-P - November 2014
391
Appendix A
PowerMonitor 5000 Unit Data Tables
Table 209 - EN61000-4-30 Harmonic and Interharmonic Group Results Instance Lookup Table
392
Data Table Name
CIP Assembly Instance
Number
PCCC File No.
PowerQuality.200mS_V1_N_Volts_RMS_HDS
901
F110
PowerQuality.200mS_V2_N_Volts_RMS_HDS
902
F111
PowerQuality.200mS_V3_N_Volts_RMS_HDS
903
F112
PowerQuality.200mS_VN_G_Volts_RMS_HDS
904
F113
PowerQuality.200mS_V1_V2_Volts_RMS_HDS
905
F114
PowerQuality.200mS_V2_V3_Volts_RMS_HDS
906
F115
PowerQuality.200mS_V3_V1_Volts_RMS_HDS
907
F116
PowerQuality.200mS_I1_Amps_RMS_HDS
908
F117
PowerQuality.200mS_I2_Amps_RMS_HDS
909
F118
PowerQuality.200mS_I3_Amps_RMS_HDS
910
F119
PowerQuality.200mS_I4_Amps_RMS_HDS
911
F120
PowerQuality.200mS_V1_N_Volts_RMS_IHDS
912
F121
PowerQuality.200mS_V2_N_Volts_RMS_IHDS
913
F122
PowerQuality.200mS_V3_N_Volts_RMS_IHDS
914
F123
PowerQuality.200mS_VN_G_Volts_RMS_IHDS
915
F124
PowerQuality.200mS_V1_V2_Volts_RMS_IHDS
916
F125
PowerQuality.200mS_V2_V3_Volts_RMS_IHDS
917
F126
PowerQuality.200mS_V3_V1_Volts_RMS_IHDS
918
F127
PowerQuality.200mS_I1_Amps_RMS_IHDS
919
F128
PowerQuality.200mS_I2_Amps_RMS_IHDS
920
F129
PowerQuality.200mS_I3_Amps_RMS_IHDS
921
F130
PowerQuality.200mS_I4_Amps_RMS_IHDS
922
F131
PowerQuality.3s_V1_N_Volts_RMS_HDS
923
F132
PowerQuality.3s_V2_N_Volts_RMS_HDS
924
F133
PowerQuality.3s_V3_N_Volts_RMS_HDS
925
F134
PowerQuality.3s_VN_G_Volts_RMS_HDS
926
F135
PowerQuality.3s_V1_V2_Volts_RMS_HDS
927
F136
PowerQuality.3s_V2_V3_Volts_RMS_HDS
928
F137
PowerQuality.3s_V3_V1_Volts_RMS_HDS
929
F138
PowerQuality.3s_V1_N_Volts_RMS_IHDS
930
F139
PowerQuality.3s_V2_N_Volts_RMS_IHDS
931
F140
PowerQuality.3s_V3_N_Volts_RMS_IHDS
932
F141
PowerQuality.3s_VN_G_Volts_RMS_IHDS
933
F142
PowerQuality.3s_V1_V2_Volts_RMS_IHDS
934
F143
PowerQuality.3s_V2_V3_Volts_RMS_IHDS
935
F144
PowerQuality.3s_V3_V1_Volts_RMS_IHDS
936
F145
PowerQuality.10m_V1_N_Volts_RMS_HDS
937
F146
PowerQuality.10m_V2_N_Volts_RMS_HDS
938
F147
Rockwell Automation Publication 1426-UM001G-EN-P - November 2014
PowerMonitor 5000 Unit Data Tables
Appendix A
Table 209 - EN61000-4-30 Harmonic and Interharmonic Group Results Instance Lookup Table
Data Table Name
CIP Assembly Instance
Number
PCCC File No.
PowerQuality.10m_V3_N_Volts_RMS_HDS
939
F148
PowerQuality.10m_VN_G_Volts_RMS_HDS
940
F149
PowerQuality.10m_V1_V2_Volts_RMS_HDS
941
F150
PowerQuality.10m_V2_V3_Volts_RMS_HDS
942
F151
PowerQuality.10m_V3_V1_Volts_RMS_HDS
943
F152
PowerQuality.10m_V1_N_Volts_RMS_IHDS
944
F153
PowerQuality.10m_V2_N_Volts_RMS_IHDS
945
F154
PowerQuality.10m_V3_N_Volts_RMS_IHDS
946
F155
PowerQuality.10m_VN_G_Volts_RMS_IHDS
947
F156
PowerQuality.10m_V1_V2_Volts_RMS_IHDS
948
F157
PowerQuality.10m_V2_V3_Volts_RMS_IHDS
949
F158
PowerQuality.10m_V3_V1_Volts_RMS_IHDS
950
F159
PowerQuality.2h_V1_N_Volts_RMS_HDS
951
F160
PowerQuality.2h_V2_N_Volts_RMS_HDS
952
F161
PowerQuality.2h_V3_N_Volts_RMS_HDS
953
F162
PowerQuality.2h_VN_G_Volts_RMS_HDS
954
F163
PowerQuality.2h_V1_V2_Volts_RMS_HDS
955
F164
PowerQuality.2h_V2_V3_Volts_RMS_HDS
956
F165
PowerQuality.2h_V3_V1_Volts_RMS_HDS
957
F166
PowerQuality.2h_V1_N_Volts_RMS_IHDS
958
F167
PowerQuality.2h_V2_N_Volts_RMS_IHDS
959
F168
PowerQuality.2h_V3_N_Volts_RMS_IHDS
960
F169
PowerQuality.2h_VN_G_Volts_RMS_IHDS
961
F170
PowerQuality.2h_V1_V2_Volts_RMS_IHDS
962
F171
PowerQuality.2h_V2_V3_Volts_RMS_IHDS
963
F172
PowerQuality.2h_V3_V1_Volts_RMS_IHDS
964
F173
Rockwell Automation Publication 1426-UM001G-EN-P - November 2014
393
Appendix A
PowerMonitor 5000 Unit Data Tables
Table 210 - PowerQuality.EN61000_4_30 HDS and IHDS Results Data Table template (DC…50)
Element
Number
Type
Tag Name
Description
Units
Range
0
Real
<Interval>_Metering_Date_Stamp
Date of cycle collection MM:DD:YY
MMDDYY
0…123199
1
Real
<Interval>_Metering_Time_Stamp
Time of cycle collection HH:MM:SS
hhmmss
0…235959
2
Real
<Interval>_Metering_uSecond_Stamp
Microsecond of cycle collection
uS
0.000…999,999
3
Real
<Interval>_<CH>_<Units>_DC_RMS
The individual RMS magnitude
0…9.999E15
4
Real
<Interval>_<CH>_<Units>_RMS_<HDS/IHDS>1
5
Real
<Interval>_<CH>_<Units>_RMS_<HDS/IHDS>2
Same as
<Units> string
in Tag Name:
Volts Amps
6
Real
<Interval>_<CH>_<Units>_RMS_<HDS/IHDS>3
0…9.999E15
7
Real
<Interval>_<CH>_<Units>_RMS_<HDS/IHDS>4
0…9.999E15
8
Real
<Interval>_<CH>_<Units>_RMS_<HDS/IHDS>5
0…9.999E15
9
Real
<Interval>_<CH>_<Units>_RMS_<HDS/IHDS>6
0…9.999E15
10
Real
<Interval>_<CH>_<Units>_RMS_<HDS/IHDS>7
0…9.999E15
11
Real
<Interval>_<CH>_<Units>_RMS_<HDS/IHDS>8
0…9.999E15
12
Real
<Interval>_<CH>_<Units>_RMS_<HDS/IHDS>9
0…9.999E15
13
Real
<Interval>_<CH>_<Units>_RMS_<HDS/IHDS>10
0…9.999E15
14
Real
<Interval>_<CH>_<Units>_RMS_<HDS/IHDS>11
0…9.999E15
15
Real
<Interval>_<CH>_<Units>_RMS_<HDS/IHDS>12
0…9.999E15
16
Real
<Interval>_<CH>_<Units>_RMS_<HDS/IHDS>13
0…9.999E15
17
Real
<Interval>_<CH>_<Units>_RMS_<HDS/IHDS>14
0…9.999E15
18
Real
<Interval>_<CH>_<Units>_RMS_<HDS/IHDS>15
0…9.999E15
19
Real
<Interval>_<CH>_<Units>_RMS_<HDS/IHDS>16
0…9.999E15
20
Real
<Interval>_<CH>_<Units>_RMS_<HDS/IHDS>17
0…9.999E15
21
Real
<Interval>_<CH>_<Units>_RMS_<HDS/IHDS>18
0…9.999E15
22
Real
<Interval>_<CH>_<Units>_RMS_<HDS/IHDS>19
0…9.999E15
23
Real
<Interval>_<CH>_<Units>_RMS_<HDS/IHDS>20
0…9.999E15
24
Real
<Interval>_<CH>_<Units>_RMS_<HDS/IHDS>21
0…9.999E15
25
Real
<Interval>_<CH>_<Units>_RMS_<HDS/IHDS>22
0…9.999E15
26
Real
<Interval>_<CH>_<Units>_RMS_<HDS/IHDS>23
0…9.999E15
27
Real
<Interval>_<CH>_<Units>_RMS_<HDS/IHDS>24
0…9.999E15
28
Real
<Interval>_<CH>_<Units>_RMS_<HDS/IHDS>25
0…9.999E15
29
Real
<Interval>_<CH>_<Units>_RMS_<HDS/IHDS>26
0…9.999E15
30
Real
<Interval>_<CH>_<Units>_RMS_<HDS/IHDS>27
0…9.999E15
31
Real
<Interval>_<CH>_<Units>_RMS_<HDS/IHDS>28
0…9.999E15
32
Real
<Interval>_<CH>_<Units>_RMS_<HDS/IHDS>29
0…9.999E15
33
Real
<Interval>_<CH>_<Units>_RMS_<HDS/IHDS>30
0…9.999E15
34
Real
<Interval>_<CH>_<Units>_RMS_<HDS/IHDS>31
0…9.999E15
35
Real
<Interval>_<CH>_<Units>_RMS_<HDS/IHDS>32
0…9.999E15
394
Rockwell Automation Publication 1426-UM001G-EN-P - November 2014
0…9.999E15
0…9.999E15
PowerMonitor 5000 Unit Data Tables
Appendix A
Table 210 - PowerQuality.EN61000_4_30 HDS and IHDS Results Data Table template (DC…50)
Element
Number
Type
Tag Name
Description
Units
Range
36
Real
<Interval>_<CH>_<Units>_RMS_<HDS/IHDS>33
The individual RMS magnitude
0…9.999E15
37
Real
<Interval>_<CH>_<Units>_RMS_<HDS/IHDS>34
38
Real
<Interval>_<CH>_<Units>_RMS_<HDS/IHDS>35
Same as
<Units> string
in Tag Name:
Volts Amps
39
Real
<Interval>_<CH>_<Units>_RMS_<HDS/IHDS>36
0…9.999E15
40
Real
<Interval>_<CH>_<Units>_RMS_<HDS/IHDS>37
0…9.999E15
41
Real
<Interval>_<CH>_<Units>_RMS_<HDS/IHDS>38
0…9.999E15
42
Real
<Interval>_<CH>_<Units>_RMS_<HDS/IHDS>39
0…9.999E15
43
Real
<Interval>_<CH>_<Units>_RMS_<HDS/IHDS>40
0…9.999E15
44
Real
<Interval>_<CH>_<Units>_RMS_<HDS/IHDS>41
0…9.999E15
45
Real
<Interval>_<CH>_<Units>_RMS_<HDS/IHDS>42
0…9.999E15
46
Real
<Interval>_<CH>_<Units>_RMS_<HDS/IHDS>43
0…9.999E15
47
Real
<Interval>_<CH>_<Units>_RMS_<HDS/IHDS>44
0…9.999E15
48
Real
<Interval>_<CH>_<Units>_RMS_<HDS/IHDS>45
0…9.999E15
49
Real
<Interval>_<CH>_<Units>_RMS_<HDS/IHDS>46
0…9.999E15
50
Real
<Interval>_<CH>_<Units>_RMS_<HDS/IHDS>47
0…9.999E15
51
Real
<Interval>_<CH>_<Units>_RMS_<HDS/IHDS>48
0…9.999E15
52
Real
<Interval>_<CH>_<Units>_RMS_<HDS/IHDS>49
0…9.999E15
53
Real
<Interval>_<CH>_<Units>_RMS_<HDS/IHDS>50
0…9.999E15
Information Tables
0…9.999E15
0…9.999E15
Refer to Time Zone Information on page 182 .
Refer to Min/Max Log on page 120.
Refer to Setpoint Parameter Selection List on page 166.
Refer to Setpoint Output Action List on page 173.
Rockwell Automation Publication 1426-UM001G-EN-P - November 2014
395
Appendix A
PowerMonitor 5000 Unit Data Tables
Notes:
396
Rockwell Automation Publication 1426-UM001G-EN-P - November 2014
Appendix
B
Technical Specifications
Table 211 - Accuracy and Range
Parameter
Accuracy in % of Reading at 25 °C (77 °F) 50/60 Hz
Unity Power Factor
Nom Metering Value/Metering range, min…max
Voltage Sense Inputs: V1, V2, V3, VN
±0.1%
Line-neutral RMS: 398V AC/15…660V AC Line-line RMS:
690V AC /26…1144V AC
VG
Connect to power system earth ground only. This is a
functional ground.
Current Sense Input: I1, I2, I3, I4
±0.1%
5 A / 0.05 - 15.6 A RMS
Frequency
±0.05 Hz
50 or 60 Hz / 40…70 Hz
Power Functions: kW, kVA, kVAR
Demand Functions: kW, kVA, kVAR
Energy Functions: kWh, kVAh, kVARh
• ANSI C12.20 -2010
Class 0.2(1)
Clause 5.5.4
• EN 62053-22 -2003
Class 0.2 Accuracy(1)
Clause 8
Metering Update Rates
One update per line cycle;
1024 samples per cycle per channel
(1) For catalog number 1426-M5E (PN-54351) units manufactured from July 2012…January 2013, the accuracy is Class 0.5 not Class 0.2. All other characteristics and products are not impacted. The
impacted units are those with manufacturing date codes of 0712, 0812, 0912, 1012, 1112, 1212, 0113.
Table 212 - Power Quality
Standard
Category
IEEE 519
Pass/Fail, TDD
IEEE 1159
1.0 Transients
Remarks
M5
M8
•
•
1.1.3 and 1.2.1 only
•
2.0 Short-duration root-mean-square (rms) variations
3.0 Long duration rms variations
4.0 Imbalance
5.0 Waveform distortion
THD, K-factor, crest factor Individual harmonic results
6.0 Voltage fluctuations
Calculated per IEC 61000-4-15:2003
7.0 Power frequency variations
EN 50160
M6
•
•
•
•
•
•
•
•
•
•
•
•
•
4 - Low Voltage Supply Characteristics
< 1kV
•
5 - Medium Voltage Supply Characteristics
1kV … 36 kV
•
6 - High Voltage Supply Characteristics
> 36 kV, not supported
Rockwell Automation Publication 1426-UM001G-EN-P - November 2014
397
Appendix B
Technical Specifications
Table 213 - EN 61000-4-30 Class Designations (M8 model only)
61000-4-30 Section Power Quality
Parameter
PowerMonitor 5000 Class Designation
Metering
Remarks
Aggregation
5.1 Power frequency
A
S
5.2 Magnitude of the supply voltage
A
S
5.3 Flicker
A
S
5.4 Supply voltage dips and swells
A
5.5 Voltage interruptions
A
5.7 Supply voltage unbalance
A
S
5.8 Voltage harmonics
A
S
5.9 Voltage interharmonics
A
S
5.10 Mains signaling voltage
A
5.12 Underdeviation and overdeviation
A
S
4.4 Measurement aggregation intervals
4.6 Real-time-clock uncertainty
Pst range 0.1 to 12
S
A w/external sync,
S with internal RTC
4.7 Flagging
Yes
6.1 Transient influence quantities
Yes
Table 214 - Input and Output Ratings
Parameter
Rating, nom
Range, max
Control Power (L1, L2)
120/240V AC 50/60 Hz (38VA)
Or
120/240V DC (26VA)
85…264V AC 47…63 Hz
Or
106…275V DC
Control Power (24V DC)
24V DC (12 VA)
22.8…25.2V DC
398
Rockwell Automation Publication 1426-UM001G-EN-P - November 2014
Technical Specifications
Appendix B
Table 215 - Input and Output Ratings
Parameter
Rating
Voltage Sense Inputs: V1, V2, V3, VN
Input Impedance: 5M ohm min
Input current: 1 mA max
Current Sense Inputs: I1, I2, I3, I4
Overload Withstand: 22 A Continuous, 200 A for one
second
Burden: Negligible
Impedance: Negligible
Maximum Crest Factor at 5 A is 4.0
Starting Current: 5 mA
Status Inputs
Contact Closure (Internal 24V DC)
KYZ Output
Solid State KYZ: 80 mA at 240V AC/V DC
Control Relay
ANSI C37.90 trip duty: 2005
Table 216 - Control Relay
Rating
50/60 Hz AC RMS
DC
Max Resistive Load Switching
10 A at 240V
(2400VA)
10 A at 24V and
0.25 A at 125V
Min Load Switching
100 mA at 5V
10 mA at 5V
UL 508, CSA 22.2, IC Rating Class
B300
Q300
Max Make Values (Inductive Load)
30 A at 120V
15 A at 240V (3600VA)
0.55 A at 125V
0.27 A at 240V (69VA)
Max Break Values (Inductive Load)
3 A at 120V
1.5 A at 240V (360VA)
0.55 A at 125V
0.27 A at 240V (69VA)
Max Motor Load Switching
1/3 HP at 125V
1/2 HP at 240V
Rockwell Automation Publication 1426-UM001G-EN-P - November 2014
399
Appendix B
Technical Specifications
Table 217 - General Specifications
Certifications
Parameter
Maximum Rating
Voltage Terminal Blocks
18…14 AWG (0.75…2.5 mm2), 75 °C Minimum Copper
Wire only Recommended torque 1.5 N•m (13.3 lb•in)
Current Sensing Input
12 AWG (4 mm2), 75 °C Minimum Copper Wire only
Recommended torque: N/A
Control Power Terminal Block
22…14 AWG (0.25…2.5 mm2), 75 °C Minimum Copper
Wire only Recommended torque 0.63 N•m (5.6 lb•in)
Input/Output (I/O) Terminal Block
20…14 AWG (0.5…2.5 mm2), 75 °C Minimum Copper
Wire only Recommended torque 0.63 N•m (5.6 lb•in)
Temperature, Operating
-20…70 °C (4…158 °F)
Temperature, Storage
-40…85 °C (-40…185 °F)
Humidity
5…95%, Noncondensing
Vibration
2g
Shock, Operating
30 g
Shock, Nonoperating
50 g
Dielectric Withstand
UL61010, EN61010
Installation Location
Indoor use only
Altitude
Max 2000 m (6560 ft.)
The PowerMonitor 5000 unit adheres to the following certifications and
approvals.
UL/CUL
UL 61010 listed, File E345550, for Measuring, Testing and Signal-generation
Equipment and CUL Certified.
CE Certification
If this product bears the CE marking, it is approved for installation within the
European Union and EEA regions. It has been designed to meet the following
directives.
400
Rockwell Automation Publication 1426-UM001G-EN-P - November 2014
Technical Specifications
Appendix B
EMC Directive
This product is tested to meet Council Directive 2004/108/EC Electromagnetic
Compatibility (EMC) and the following standards, in whole, documented in a
technical construction file.
EN 61326-1:2006
WARNING: This is a class A product that is intended for use in an industrial
environment. In a residential, commercial, or light industrial environment, it
can cause radio interference. This product is not intended to be installed in a
residential environment. In a commercial and light industrial environment with
connection to the public mains supply, you can take adequate measures to
reduce interference.
Low Voltage Directive
This product is tested to meet Council Directive 2006/95/EC Low Voltage, by
applying the safety requirements of EN61010-1: 2001.
This equipment is classified as open equipment and must be installed (mounted)
in an enclosure during operation as a means of providing safety protection.
International Standard IEC 60529 / NEMA / UL 61010 Degree of Protection
The Bulletin 1426 PowerMonitor 5000 unit is rated as IP10 degree of protection
per International Standard IEC 60529. It is considered an open device per
NEMA and UL 61010 Follow the recommended installation guidelines to
maintain these ratings.
ANSI/IEEE Tested
Meets or exceeds the C37.90 Trip Duty: 2005 for protective relays and relay
systems on all power-connection circuit terminations.
Rockwell Automation Publication 1426-UM001G-EN-P - November 2014
401
Appendix B
Technical Specifications
Notes:
402
Rockwell Automation Publication 1426-UM001G-EN-P - November 2014
Appendix
C
PowerMonitor 5000 Display Module Application
Summary
Introduction
The PowerMonitor 5000 Display Module, catalog number 1426-DM, is a
PanelView Component C400 terminal with factory-installed applications. This
display module displays key information from one, two, or three
PowerMonitor 5000 units. Minimal setup for communication is required.
Refer to the PanelView Component HMI Terminals User Manual, publication
2711C-UM001, for additional information on performing the steps outlined in
this Appendix.
Terminal Setup
IMPORTANT
In order for the C400 terminal application to communicate with a power
monitor, both need their own unique IP address on the same network and
subnet. The computer you use for set-up must also access the same network.
Follow these instructions for setting up the C400 terminal.
1. Obtain an IP address for the C400 terminal and set it as a static IP address
in the C400 terminal.
2. Open a compatible web browser and type the terminal IP address into the
address bar.
The PanelView Explorer Startup window appears.
3. Disable the web browser pop-up blocker, if necessary.
Rockwell Automation Publication 1426-UM001G-EN-P - November 2014
403
Appendix C
PowerMonitor 5000 Display Module Application Summary
4. Select PM5000DM-# and click Edit.
The # is either 1, 2, or 3 depending on the number of power monitors
being monitored.
5. Once the PanelView Explorer window opens, click the Communication
tab.
On the Communication tab is a Controller Settings heading listing the
power monitors in the application.
404
Rockwell Automation Publication 1426-UM001G-EN-P - November 2014
PowerMonitor 5000 Display Module Application Summary
Appendix C
6. Update the IP addresses and click the Validate Application icon to validate
the application.
7. Once the application has been validated, click the blue floppy disk icon to
save the program.
8. Close the dialog box to return to the PanelView Explorer Startup window.
Rockwell Automation Publication 1426-UM001G-EN-P - November 2014
405
Appendix C
PowerMonitor 5000 Display Module Application Summary
9. In the start-up window, select PM5000DM-l and click Run.
10. Once the Application Mode changes to 'Running', click Sign Off in the
upper right to close the dialog box.
406
Rockwell Automation Publication 1426-UM001G-EN-P - November 2014
PowerMonitor 5000 Display Module Application Summary
Appendix C
Navigation
This section describes the navigation for the PowerMonitor 5000 Display
Module application. All screen captures in this section are for the application that
uses three power monitors. The Main screen is displayed on startup. From this
screen, you can select any of the five other screens.
• Press Overview to display the Overview screen. This screen is unique as it
displays values for up to three power monitors simultaneously.
Rockwell Automation Publication 1426-UM001G-EN-P - November 2014
407
Appendix C
PowerMonitor 5000 Display Module Application Summary
• Press V,I,F to open the following screen.
By default, pressing any button displays data from the power monitor
whose IP address was entered first. The buttons along the bottom select
another power monitor. Any button highlighted in blue indicates the
selected screen and power monitor. The VIF screen for PM#2 is shown
below.
408
Rockwell Automation Publication 1426-UM001G-EN-P - November 2014
PowerMonitor 5000 Display Module Application Summary
Appendix C
• This is the Power screen.
• This is the Power Quality screen.
Rockwell Automation Publication 1426-UM001G-EN-P - November 2014
409
Appendix C
PowerMonitor 5000 Display Module Application Summary
• This is the Energy Demand screen.
410
Rockwell Automation Publication 1426-UM001G-EN-P - November 2014
Appendix
D
PowerMonitor 5000 Waveform Capture and
Compression
Waveform recordings in the power monitor consist of a series of cycle-by-cycle
magnitude and angle data for each spectral component (harmonic) from DC
through the 127th harmonic. To reduce the size of waveform records without
losing significant resolution, the data is compressed before writing to the
waveform file. To display the record as a waveform, the file data must be
decompressed, and then an inverse FFT performed to obtain a series of timedomain voltage and current data that can then be plotted in a graphic format.
Compression Algorithm
Three types of floating point number representations are used, with 32, 16 and
12 bits. The formats are summarized in the table.
Type
Total bits
Bits
precision
Sign bits
Exponent
bits
Significand
bits
Exponent
bias
IEEE 754
Single
32
24
1
8
23
127
16 bit
encoded
16
12
1
4
11
TBD
12 bit
encoded
12
8
1
4
7
TBD
The table below defines how compression is applied to magnitude and angle
values of specific harmonic orders.
Data / encoding
32-bit
16-bit
12-bit
Magnitude
DC thru 15th
-
16th thru 127th
Angle
-
DC thru 15th
16th thru 127th
The various number encodings are packed into the file in the following way:
Table 218 - 32-bit (IEEE 754)
Byte offset 0
Byte offset 1
Low byte
Next lowest byte
Byte offset 2
Next highest byte
Byte offset 3
High byte
Table 219 - 16-bit Encoding
Byte offset 0
Low byte
Byte offset 1
High byte
Rockwell Automation Publication 1426-UM001G-EN-P - November 2014
411
Appendix D
PowerMonitor 5000 Waveform Capture and Compression
Table 220 - 12-bit Encoding
Byte offset 0
Byte offset 1
Low 8 bits of X(h)
Byte offset 3
High 4 bits of X(h)
Low 4 bits of X(h+1)
High eight bits of
X(h+1)
Where X(h) is the value (magnitude or angle) of the harmonic at order h.
Magnitude Data
Bytes 0…63 contain 32-bit encoded magnitudes V(h) and I(h) for h = DC thru
15. Byte 64 contains the exponent offset for use in the 12-bit encoded data that
follows. The remaining bytes hold the remaining harmonic magnitude values
in12-bit encoding.
Byte offset
0
Data Info
DC
Byte offset
16
Data Info
4th
Byte offset
32
Data Info
8th
Byte offset
48
Data Info
12th
Byte offset
Data Info
1
2
3
5
6
7
1st Harmonics RMS
17
18
19
20
21
33
34
35
36
22
23
51
64
65
66
67
Exp
16th & 17th
Byte offset
80
81
Data Info
26th & 27th
Byte offset
96
Data Info
& 37th
Byte offset
112
113
Data Info
47th
48th & 49th
Byte offset
128
129
Data Info
58th & 59th
52
37
38
39
97
82
53
54
55
69
70
71
84
99
100
38th & 39th
145
114
130
115
144
Data Info
& 69th
146
Byte offset
160
161
132
Data Info
79th
80th & 81st
Byte offset
176
177
Data Info
90th & 91st
147
148
70th & 71st
162
178
101
117
133
163
192
Data Info
& 101st
194
Byte offset
208
209
180
Data Info
111th
112th & 113th
Byte offset
224
225
Data Info
122nd & 123rd
195
196
102nd & 103rd
210
226
102
118
103
212
227
228
134
149
150
165
166
181
72
88
27
41
42
43
120
135
136
151
57
58
59
73
74
75
168
183
184
94th & 95th
197
198
199
213
229
89
90
105
106
121
215
230
231
216
116th & 117th
29
30
31
44
45
46
47
60
61
62
63
76
77
78
79
24th & 25th
92
107
108
123
124
54th & 55th
137
153
169
138
154
201
217
109
139
186
202
140
141
156
157
171
187
126th & 127th
Rockwell Automation Publication 1426-UM001G-EN-P - November 2014
126
142
203
219
111
127
172
143
68th
158
173
174
159
175
88th & 89th
188
189
190
98th & 99th
118th & 119th
232
110
78th &
204
205
108th & 109th
218
36th
66th & 67th
155
95
46th &
125
76th & 77th
170
94
56th & 57th
86th & 87th
185
93
34th & 35th
44th & 45th
122
106th & 107th
214
91
96th & 97th
200
28
22nd & 23rd
74th & 75th
167
15
15th
64th & 65th
152
14
11th
32nd & 33rd
104
13
7th
84th & 85th
182
114th & 115th
124th & 125th
26
42nd & 43rd
119
104th & 105th
211
25
52nd & 53rd
82nd & 83rd
179
87
72nd & 73rd
164
56
62nd & 63rd
92nd & 93rd
Byte offset
86
50th & 51st
131
40
12
3rd
20th & 21st
40th & 41st
116
24
30th & 31st
60th & 61st
Byte offset
193
85
28th & 29th
98
11
14th
18th & 19th
83
10
10th
13th
68
9
6th
9th
50
8
2nd
5th
49
412
4
220
191
100th
206
207
110th &
221
222
120th & 121st
223
PowerMonitor 5000 Waveform Capture and Compression
Appendix D
Angle Data
Byte 0 contains the exponent offset for use in the 16- and 12-bit encoded data
that follows. Bytes 1…32 contain 16-bit encoded magnitudes V(h) and I(h) for
h = DC…15. The remaining bytes hold the remaining harmonic magnitude
values in12-bit encoding.
Byte offset
0
1
Data Info
Exp
DC Ang
Byte offset
16
17
Data Info
Byte offset
2
Data Info
33
18
19
34
35
48
49
50
Data Info
26th & 27th
Byte offset
64
Data Info
& 37th
Byte offset
80
81
Data Info
47th
48th & 49th
Byte offset
96
97
Data Info
58th & 59th
Byte offset
112
Data Info
& 69th
65
20
36
37
51
52
53
67
68
82
98
83
115
Byte offset
128
129
Data Info
79th
80th & 81st
130
Byte offset
144
145
Data Info
90th & 91st
Byte offset
160
Data Info
& 101st
Byte offset
176
177
Data Info
111th
112th & 113th
Byte offset
192
193
Data Info
122nd & 123rd
146
131
85
100
101
116
163
148
164
102nd & 103rd
178
194
179
117
133
149
54
55
70
71
86
181
196
124th & 125th
197
41
56
87
103
118
119
134
151
166
167
182
88
104
199
43
57
58
120
136
152
73
74
89
184
44
121
137
75
76
106
122
169
185
61
77
154
170
91
92
107
93
15th
46
139
155
63
78
79
36th
94
108
109
110
187
118th & 119th
95
124
125
140
111
68th
126
127
78th &
141
142
143
88th & 89th
156
157
158
98th & 99th
171
47
62
66th & 67th
123
31
56th & 57th
172
173
108th & 109th
186
30
46th &
76th & 77th
138
7th
34th & 35th
86th & 87th
153
45
15
24th & 25th
54th & 55th
105
29
44th & 45th
90
14
14th
60
96th & 97th
168
28
59
64th & 65th
116th & 117th
198
42
13
6th
13th
106th & 107th
183
27
32nd & 33rd
72
12
22nd & 23rd
84th & 85th
150
26
74th & 75th
135
11
5th
42nd & 43rd
104th & 105th
180
40
52nd & 53rd
102
10
12th
94th & 95th
165
25
20th & 21st
114th & 115th
195
39
72nd & 73rd
132
24
62nd & 63rd
92nd & 93rd
162
38
9
4th
11th
82nd & 83rd
147
23
40th & 41st
84
8
30th & 31st
69
60th & 61st
114
22
50th & 51st
99
7
3rd Ang
18th & 19th
70th & 71st
161
21
28th & 29th
66
6
10th
38th & 39th
113
5
2nd Ang
9th
16th & 17th
Byte offset
4
1st Ang
8th
32
3
188
159
100th
174
175
110th &
189
190
191
120th & 121st
200
126th & 127th
Rockwell Automation Publication 1426-UM001G-EN-P - November 2014
413
Appendix D
PowerMonitor 5000 Waveform Capture and Compression
Waveform File Format
The tables below illustrate the waveform file format.
Waveform Data Name
Data Type
Description
File ID
char[8]
File ID (Int16)+ Waveform Identifier(Int48)
typedef struct
{
unsigned short sFileID; //this id is used for user selection,1…256
unsigned short sWaveformID; //the Waveform id highest 2 bytes
unsigned long lWaveformID; //the Waveform id Lowest 4 bytes
}WAVEFORM_ID;
Revision
unsigned short
Waveform format revision
Compressed
char
Compressed or not
Compression Type
char
Compression type
Metering Mode
char
Metering mode is used to check the channels in each cycle in the future, currently, the
channels is fixed in 8 channels
Mac Address
char[6]
Mac Address of the device where the waveform is retrieved
Reserved
char[45]
Reserved for future use
Cycle #1 Data
char[3484]
The first cycle data
Cycle #2 Data
char[3484]
The second cycle data
Cycle #3 Data
char[3484]
The third cycle data
…
…
…
Cycle #N Data
char[3484]
The Nth cycle data
The Cycle 1 through n data format is shown in this table.
Waveform Data Name
Data Type
Description
Timestamp Seconds
unsigned long
Seconds of the first sample data timestamp
Timestamp Nanoseconds
unsigned long
Nanoseconds of the first sample data timestamp
Frequency
float
The average frequency of the current cycle
V1 Magnitude Data
char[233]
The compressed V1 magnitude harmonics data
V2 Magnitude Data
char[233]
The compressed V2 magnitude harmonics data
V3 Magnitude Data
char[233]
The compressed V3 magnitude harmonics data
VN Magnitude Data
char[233]
The compressed VN magnitude harmonics data
I1 Magnitude Data
char[233]
The compressed I1 magnitude harmonics data
I2 Magnitude Data
char[233]
The compressed I2 magnitude harmonics data
I3 Magnitude Data
char[233]
The compressed I3 magnitude harmonics data
I4 Magnitude Data
char[233]
The compressed I4 magnitude harmonics data
V1 Phase Data
char[201]
The compressed V1 phase harmonics data
V2 Phase Data
char[201]
The compressed V2 phase harmonics data
V3 Phase Data
char[201]
The compressed V3 phase harmonics data
VN Phase Data
char[201]
The compressed VN phase harmonics data
I1 Phase Data
char[201]
The compressed I1 phase harmonics data
I2 Phase Data
char[201]
The compressed I2 phase harmonics data
I3 Phase Data
char[201]
The compressed I3 phase harmonics data
I4 Phase Data
char[201]
The compressed I4 phase harmonics data
414
Rockwell Automation Publication 1426-UM001G-EN-P - November 2014
Appendix
E
IEEE 519 Pass/Fail and TDD
IEEE 519 Pass/Fail Capability
(M6 and M8 models)
IEEE 519-1992, the standard for Recommended Practices and Requirements for
Harmonic Control in Electrical Power Systems, provides recommended limits for
the level of harmonics in a circuit. The standard applies these limits to current
and voltage harmonics up to the 40th order present at the Point of Common
Coupling (PCC) between your electric power supplier and your facility, typically
where utility meters are connected. The standard recommends limits for
individual harmonic components as well as limits for Total Demand Distortion
(TDD).
TDD is similar to THD except it is based on the maximum, rather than
measured, fundamental load current.
The standard specifies distortion limits for long term conditions, greater than
one hour. In the short term, these limits can be exceeded by 50%. The
PowerMonitor 5000 unit provides these results:
• Short Term: the 1 minute rolling average, updated at a 10 second rate.
• Long Term: the 1 hour rolling average, updated at a 10 minute rate.
The recommended limits for current and voltage harmonic distortion, expressed
as a percentage of the fundamental, are listed in the tables below.
Table 221 - IEEE 519 Current Distortion Limits (120 V…69 kV)
Ratio of MAX_Isc
to MAX_IL
Individual Harmonic Order
Less than 20
20…49.99
50…99.99
100…999.99
1000 and higher
1 … 10
11 …16
17 … 22
23 … 34
35 … 40
TDD
Odd
4.0
2.0
1.5
0.6
0.3
5.0
Even
1.0
0.5
0.4
0.2
0.1
Odd
7.0
3.5
2.5
1.0
0.5
Even
1.8
0.9
0.6
0.3
0.1
Odd
10.0
4.5
4.0
1.5
0.7
Even
2.5
1.1
1.0
0.4
0.2
Odd
12.0
5.5
5.0
2.0
1.0
Even
3.0
1.4
1.3
0.5
0.3
Odd
15.0
7.0
6.0
2.5
1.5
Even
3.8
1.8
1.5
0.6
0.4
Rockwell Automation Publication 1426-UM001G-EN-P - November 2014
8.0
12.0
15.0
20.0
415
Appendix E
IEEE 519 Pass/Fail and TDD
Table 222 - IEEE 519 Voltage Distortion Limits (0 … 69 kV)
Individual voltage distortion, %
Total voltage THD, %
3.0
5.0
Application
This applies to the M6 and M8 models.
Setup
Basic Metering setup is required. Three configuration parameters required for
calculating the IEEE 519 Pass/Fail requirements are found in the
Configuration.PowerQuality tab.
• IEEE519_Compliance_Parameter - Selects 0 = current (default) or 1 =
voltage as the compliance parameter.
• IEEE519_MAX_Isc_Amps - Short circuit current available at the PCC,
in Amps. Default = 0
• IEEE519_MAX_IL_Amps - Average current related to the maximum
demand for the preceding 12 months. Default = 0
IMPORTANT
IEEE 519 Pass/Fail Results
Zero values for Max Isc and IL disable the calculation.
The PowerMonitor 5000 reports the IEEE 519 pass/fail status for short term and
long term conditions in the Status.Alarms table in the tags listed below. If the
values of IEEE519_MAX_Isc_Amps = 0 or IEEE519_MAX_IL_Amps = 0,
then the first row in Table 221 IEEE 519 Current Distortion Limits is used to
measure compliance. If the value of IEEE519_MAX_IL_Amps = 0, then current
THD rather than TDD is used to measure compliance.
IEEE519_Overall_Status
This bitfield reports overall status.
•
•
•
•
•
•
•
416
0 = PASS
1 = FAIL
Bit0 - ShortTerm_TDD_THD_PASS_FAIL
Bit1 - LongTerm_TDD_THD_PASS_FAIL
Bit2 - ShortTerm_Individual_Harmonic_PASS_FAIL
Bit3 - LongTerm_Individual_Harmonic_PASS_FAIL
Bit4 … 15 - Future Use
ShortTerm_2nd_To_17th_Harmonic_Status
LongTerm_2nd_To_17th_Harmonic_Status
Rockwell Automation Publication 1426-UM001G-EN-P - November 2014
IEEE 519 Pass/Fail and TDD
Appendix E
These bitfields reports the short-term or long-term status of harmonics of order
2…17.
•
•
•
•
•
•
0 = PASS
1 = FAIL
Bit0 - 2nd_Harmonic_PASS_FAIL
Bit1 - 3rd_Harmonic_PASS_FAIL
…
Bit15 - 17th_Harmonic_PASS_FAIL
ShortTerm_18th_To_33rd_Harmonic_Status
LongTerm_18th_To_33rd_Harmonic_Status
These bitfields reports the short-term or long-term status of harmonics of order
18…33.
•
•
•
•
•
•
0 = PASS
1 = FAIL
Bit0 - 18th_Harmonic_PASS_FAIL
Bit1 - 19th_Harmonic_PASS_FAIL
…
Bit15 - 33rd_Harmonic_PASS_FAIL
ShortTerm_34th_To_40th_Harmonic_Status
LongTerm_34th_To_40th_Harmonic_Status
These bitfields reports the short-term or long-term status of harmonics of order
34…40.
•
•
•
•
•
IEEE 519 Short Term and Long
Term Harmonic Results
0 = PASS
1 = FAIL
Bit0 - 34th_Harmonic_PASS_FAIL
Bit1 - 35th_Harmonic_PASS_FAIL
…
Bit6 - 40th_Harmonic_PASS_FAIL
Bit 7 … Bit 15 - Reserved, always = 0
The six data tables listed below provide an indication of individual current
harmonic distortion and TDD (Total Demand Distortion). If the user has
selected voltage as the output parameter the tables list voltage distortions and
THD (Total Harmonic Distortion).
• PowerQuality.IEEE519_CH1_ShortTerm_Results
• PowerQuality.IEEE519_CH2_ShortTerm_Results
• PowerQuality.IEEE519_CH3_ShortTerm_Results
• PowerQuality.IEEE519_CH1_LongTerm_Results
• PowerQuality.IEEE519_CH2_LongTerm_Results
• PowerQuality.IEEE519_CH3_LongTerm_Results
Rockwell Automation Publication 1426-UM001G-EN-P - November 2014
417
Appendix E
IEEE 519 Pass/Fail and TDD
Each table provides the following:
• Timestamp of the most recent results
• Fundamental magnitude
• Individual harmonic distortion as a percentage of the fundamental
magnitude
• Overall distortion
– With current selected as the compliance parameter (default), if the
IEEE519_MAX_Isc and IEEE519_MAX_IL parameter values are
non-zero, then TDD is returned. Otherwise, THD is returned.
Refer to the PowerMonitor 5000 Unit Data Tables on page 231 for further
details on these data tables.
Related Functions
• Harmonic Analysis
• Alarm Log
418
Rockwell Automation Publication 1426-UM001G-EN-P - November 2014
Appendix
F
IEEE 1159 Power Quality Event Classification
Power Quality Event
Classification per IEEE 11592009
IEEE 1159-2009, Recommended Practice for Monitoring Electric Power
Quality, categorizes various power quality events based on the parameters of the
event such as voltage change, frequency content, rise time, event duration, etc.
The table below, excerpted from the standard, summarizes the classifications in
the recommended practice, and indicates which PowerMonitor 5000 models
support monitoring of each category of phenomena.
IMPORTANT
Table 223 is adapted from standard IEEE 1159-2009 and is used with
permission.
Table 223 - Categories and Typical Characteristics of Power System Electromagnetic Phenomena(1)
Categories
Typical Spectral Content
Typical Duration
Typical Voltage
Magnitude
1426-M6
1426-M8
1.0 Transients
•
1.1 Impulsive
•
1.1.1 Nanosecond
5 ns rise
< 50 ns
1.1.2 Microsecond
1 μs rise
50…1 ms
1.1.3 Millisecond
0.1 ms rise
> 1 ms
•
1.2 Oscillatory
•
1.2.1 Low frequency
< 5 kHz
0.3…50 ms
0…4 pu(2)
1.2.2 Medium frequency
5…500 kHz
20 μs
0…8 pu
1.2.3 High frequency
0.5…5 MHz
5 μs
0…4 pu
•
2.0 Short-duration root-mean-square
(rms) variations
•
•
2.1 Instantaneous
•
•
2.1.1 Sag
0.5…30 cycles
0.1…0.9 pu
•
•
2.1.2 Swell
0.5…30 cycles
1.1…1.8 pu
•
•
•
•
2.2 Momentary
2.2.1 Interruption
0.5 cycles - 3 s
< 0.1 pu
•
•
2.2.2 Sag
30 cycles - 3 s
0.1…0.9 pu
•
•
2.2.3 Swell
30 cycles - 3 s
1.1…1.4 pu
•
•
•
•
2.3 Temporary
2.3.1 Interruption
>3 s…1 min
< 0.1 pu
•
•
2.3.2 Sag
>3 s …1 min
0.1…0.9 pu
•
•
2.3.3 Swell
>3 s…1 min
1.1…1.2 pu
•
•
•
•
3.0 Long duration rms variations
Rockwell Automation Publication 1426-UM001G-EN-P - November 2014
419
Appendix F
IEEE 1159 Power Quality Event Classification
Table 223 - Categories and Typical Characteristics of Power System Electromagnetic Phenomena(1)
Categories
Typical Spectral Content
Typical Duration
Typical Voltage
Magnitude
1426-M6
3.1 Interruption, sustained
> 1 min
0.0 pu
•
•
3.2 Undervoltages
> 1 min
0.8…0.9 pu
•
•
3.3 Overvoltages
> 1 min
1.1…1.2 pu
•
•
3.4 Current overload
> 1 min
4.0 Imbalance
1426-M8
•
•
4.1 Voltage
steady state
0.5…2%
•
•
4.2 Current
steady state
1.0…30%
•
•
•
•
•
•
•
•
5.0 Waveform distortion
5.1 DC offset
steady state
5.2 Harmonics
0…9 kHz steady state
0…20%
5.3 Interharmonics
0…9 kHz steady state
0…2%
5.4 Notching
0…0.1%
•
steady state
5.5 Noise
broadband
steady state
0…1%
6.0 Voltage fluctuations
< 25 Hz
intermittent
0.1…7%
0.2…2 Pstb
7.0 Power frequency variations
< 10 s
± 0.10 Hz
•
•
•
•
•
•
(1) These terms and categories apply to power quality measurements and are not to be confused with similar terms defined in IEEE Std 1366™-2003 [B27] and other reliability-related standards,
recommended practices, and guides.
(2) The quantity pu refers to per unit, which is dimensionless. The quantity 1.0 pu corresponds to 100%. The nominal condition is often considered to be 1.0 pu. In this table, the nominal peak value is used as
the base for transients and the nominal rms value is used as the base for rms variations.
The power monitor classifies power quality events it detects according to the
table. The M6 model does not detect events in categories 1, 5.3, 5.4, 5.5, or 6.
Transients (Category 1.1.3,
1.2.1)(M8 model)
The PowerMonitor 5000 detects and records transient voltage events as
described in IEEE 1159, Category 1.1.3, Impulsive, Millisecond and 1.2.1,
Oscillatory, Low Frequency. The PowerMonitor 5000 does not detect events in
Categories 1.1.1, 1.1.2, 1.2.2, and 1.2.3.
Setup
Basic metering setup is required. The configuration parameter for transient
detection is found in the Configuration.PowerQuality table.
• Transient_Detection_Threshold_% - Percentage of the RMS value of the
present cycle voltage, range 0 … 50%, default 4%
420
Rockwell Automation Publication 1426-UM001G-EN-P - November 2014
IEEE 1159 Power Quality Event Classification
Appendix F
Operation
The power monitor detects a transient when the RMS value of the transient
voltage is greater than a configurable sensitivity threshold.
When a transient is detected, the power monitor captures a waveform record.
The number of cycles captured is equal to the configured Pre Event and Post
Event cycles plus the transient waveform. The Power Quality Log records the
event details, including date and time, the waveform reference, the transient
threshold, and the RMS value of the transient voltage in the present cycle.
Status
The Status.Alarms data table provides the following tag for monitoring of
transient events.
• Transient_Indication - sets when a transient has occurred; clears 90
seconds after the transient event has ended.
Related Functions
• Waveform Recording
• Power Quality Log
Short Duration RMS
Variations (Category 2.0 Sags, Swells, and
Interruptions) (M6 and M8
model)
The power monitor detects and records instantaneous, momentary and
temporary variations in the RMS voltage.
Setup
Basic metering configuration is required.
Operation
A sag event begins when the rms value of the voltage dips to less than 90% of the
system nominal voltage and ends when the voltage exceeds 92 % of nominal.
A swell event is activated when the rms value of the voltage rises to greater than
110% of the nominal system voltage and released when the voltage drops back to
108% of nominal. An interruption event is recorded where the residual voltage is
less than 10% of nominal.
Rockwell Automation Publication 1426-UM001G-EN-P - November 2014
421
Appendix F
IEEE 1159 Power Quality Event Classification
The power monitor records each detected power quality event, date and time
stamp, trip point, min or max value, and associated waveform record, as
applicable, in the Power Quality Log with an event code of ‘IEEE1159
_Voltage_Sag’, ‘IEEE1159_Voltage_Swell’ or ‘IEEE1159 _Voltage_Interruption’.
Related Functions
• Long Duration RMS Variations
• Waveform Recording
• Power Quality Log
Long Duration RMS
Variations (Category 3.0 Undervoltage, Overvoltage,
Sustained Interruptions)
(M6 and M8 model)
A sag or swell with a duration that exceeds one minute is classified as an
undervoltage or overvoltage, respectively. An interruption with a duration that
exceeds one minute is classified as a sustained interruption.
Setup
The Sag and Swell thresholds described in the Short Duration RMS Variations
section on page 421 also determine the operation of undervoltage and
overvoltage detection.
Operation
When the duration of a sag or swell event exceeds 60 seconds, the new
classification is recorded in the power quality log with the time stamp of the
original sag or swell event, and the original sag or swell record in the power
quality log is updated with a duration of 60 seconds and its associated waveform
recording.
Status
The Status.Alarms Data Table provides the following tags for monitoring of long
duration rms variations.
• IEEE1159_Over_Voltage
• IEEE1159_Over_Voltage_V1
• IEEE1159_Over_Voltage_V2
• IEEE1159_Over_Voltage_V3
• IEEE1159_Under_Voltage
• IEEE1159_Under_Voltage_V1
• IEEE1159_Under_Voltage_V2
• IEEE1159_Under_Voltage_V3
422
Rockwell Automation Publication 1426-UM001G-EN-P - November 2014
IEEE 1159 Power Quality Event Classification
Appendix F
The alarm flags are released when the condition no longer exists.
Voltage and Current
Imbalance (Category 4.0)
The power monitor includes long-term voltage and current unbalance in its
metering results. The power monitor reports voltage and current imbalance as
power quality events.
Setup
Basic metering setup is required. These configuration parameters are found in the
Configuration.PowerQuality tab:
• IEEE1159_Imbalance_Averaging_Intvl_m - rolling average interval for
Imbalance, default 15 minutes
• IEEE1159_Voltage_Imbalance_Limit_% - percent of voltage imbalance
to report an event, default 3 per cent.
• IEEE1159_Current_Imbalance_Limit_% - percent of current imbalance
to report an event, default 25 per cent
Operation
The power monitor calculates voltage and current imbalance over a rolling
average with a configurable range of 15 minutes (default) to 60 minutes. The
rolling average is updated at a rate of 10 seconds per minute of the specified
interval.
When the rolling average value of voltage or current imbalance exceeds the
configured limit an event is recorded in the power quality log.
Status
The Status.Alarms table provides the following tags for monitoring of unbalance
events:
• IEEE1159_Imbalance_Condition_Volts - 1 = unbalance is above the limit
• IEEE1159_Imbalance_Condition_Current - 1 = unbalance is above the
limit
Rockwell Automation Publication 1426-UM001G-EN-P - November 2014
423
Appendix F
IEEE 1159 Power Quality Event Classification
Waveform Distortion
(Categories 5.1 - DC Offset,
5.2 - Harmonics, and 5.3 Interharmonics)
The power monitor detects and reports long-term waveform distortion in excess
of configured limits. Table 14 on page 89 indicates which phenomena are
supported by the PowerMonitor 5000 models.
Setup
Basic metering setup required. These configuration parameters are found in the
Configuration.PowerQuality tab:
• IEEE1159_DCOffsetAndHarmonics_Averaging_Intvl_m - rolling
average interval for DC offset and harmonics, range = 1…15 minutes,
default = 5 minutes
• IEEE1159_Voltage_DCOffset_Limit_% - DC offset alarm threshold,
range = 0.00…1.00 per cent of fundamental, default = 0.1 per cent
• IEEE1159_Voltage_THD_Limit_% - voltage THD alarm threshold,
range = 0.00… 20.00 per cent of fundamental, default = 5 per cent
• IEEE1159_Current_THD_Limit_% -current THD alarm threshold,
range = 0.00…20.00 per cent of fundamental, default = 10 per cent
• IEEE1159_Voltage_TID_Limit_% - voltage TID (total interhamonic
distortion) alarm threshold, range = 0.00…20.00 per cent of fundamental,
default = 5 per cent (M8 only)
• IEEE1159_Current_TID_Limit_% - voltage TID (total interhamonic
distortion) alarm threshold, range = 0.00…20.00 per cent of fundamental,
default = 10 per cent (M8 only)
Operation
The power monitor measures voltage and current THD (and the M8 model
measures TID), over the specified rolling average interval and annunciates if
these values exceed the specified thresholds. The rolling average is updated at a
rate of 10 seconds per minute of the specified interval.
The PowerMonitor 5000 unit does not measure current DC offset because CTs
do not pass DC. DC offset is measured on directly-connected voltage channels
and is tracked in the power quality log.
Status
These status bits annunciate over limit conditions and remain asserted until the
parameter is no longer over the threshold. A value of 1 indicates over limit. They
are found in the Status.Alarms tab.
• IEEE1159_DCOffset_Condition_V1
• IEEE1159_DCOffset_Condition_V2
• IEEE1159_DCOffset_Condition_V3
• IEEE1159_Voltage_THD_Condition_V1
424
Rockwell Automation Publication 1426-UM001G-EN-P - November 2014
IEEE 1159 Power Quality Event Classification
•
•
•
•
•
•
•
•
•
•
•
•
•
Appendix F
IEEE1159_Voltage_THD_Condition_V2
IEEE1159_Voltage_THD_Condition_V3
IEEE1159_Current_THD_Condition_ I1
IEEE1159_Current_THD_Condition_ I2
IEEE1159_Current_THD_Condition_ I3
IEEE1159_Current_THD_Condition_ I4
IEEE1159_Voltage_TID_Condition_V1
IEEE1159_Voltage_TID_Condition_V2
IEEE1159_Voltage_TID_Condition_V3
IEEE1159_Current_TID_Condition_ I1
IEEE1159_Current_TID_Condition_ I2
IEEE1159_Current_TID_Condition_ I3
IEEE1159_Current_TID_Condition_ I4
Related Functions
• Harmonic Analysis
• Power Quality Log
Flicker (Voltage Fluctuations,
Category 6.0)
Random or repetitive voltage fluctuations that typically do not exceed the normal
range of system voltage can be caused by the switching of large loads at random
times. The human effects of lamp flicker caused by such voltage fluctuations can
vary from annoyance to epileptic seizures in sensitive individuals. The flicker
severity index is proportional to the magnitude of voltage changes and, to a lesser
degree, the frequency at which they occur.
IEEE 1159 addresses the short-term flicker severity index Pst. The power monitor
also calculates the long-term index, Plt.
Setup
Basic metering setup is required. One configuration parameter for flicker is found
in the Configuration.PowerQuality table.
• IEEE1159_ShortTerm_Severity - alarm threshold for flicker;
range 0.2…4 Pst, default 1
Operation
The power monitor calculates the flicker severity index. When the configured
limit is exceeded an alarm status is set and a record is added to the Power Quality
log. The values of Pst and Plt are also tracked in the Min/Max log.
Rockwell Automation Publication 1426-UM001G-EN-P - November 2014
425
Appendix F
IEEE 1159 Power Quality Event Classification
Status
The Status.Alarms data table provides the following tag for monitoring of shortterm flicker events.
• IEEE1159_ShortTerm_Flicker_Condition, set when Pst exceeds the alarm
threshold, clears when Pst returns to normal
Related Functions
• Min/Max Log
• Power Quality Log
Power Frequency Variations
(Category 7.0)
The power monitor detects and reports short-term power frequency variations in
excess of configured limits.
Setup
Basic metering setup is required. These configuration parameters are found in the
Configuration.PowerQuality tab:
• IEEE1159_PowerFrequency_Averaging_Intvl_s - rolling average interval
for power frequency , range = 1 (default)…10 seconds
• IEEE1159_PowerFrequency_Limit_Hz - power frequency variation alarm
threshold, range = 0.1 (default)…0.2 Hz
• IEEE1159_PowerFrequency_Hysteresis_Hz -power frequency hysteresis,
range = 0.01…0.05 Hz, default = 0.02 Hz
Operation
The power monitor measures frequency variation over the specified rolling
average interval and annunciates if the value exceed the specified threshold. The
rolling average updates once per second. The hysteresis parameter is taken into
account when the alarm condition is released.
Status
This status bit annunciates an over limit condition and remains asserted until the
parameter is under the threshold less hysteresis. A value of 1 indicates over limit.
It is found in the Status.Alarms tab:
• IEEE1159_PowerFrequency_Condition
426
Rockwell Automation Publication 1426-UM001G-EN-P - November 2014
IEEE 1159 Power Quality Event Classification
Appendix F
Related Functions
• Basic Metering
• Power Quality Log
Rockwell Automation Publication 1426-UM001G-EN-P - November 2014
427
Appendix F
IEEE 1159 Power Quality Event Classification
Notes:
428
Rockwell Automation Publication 1426-UM001G-EN-P - November 2014
Appendix
G
EN 50160 Conformance Tracking
Introduction
EN 50160-2010 is a European standard that defines, describes and specifies
characteristics of voltage supplied in public power supply networks. It specifies
limits on various attributes of the supply voltage, such as magnitude, frequency,
and waveform quality, during normal operation. The PowerMonitor 5000 M8
model measures and stores data that track conformance to the requirements
defined in the standard, for low-voltage (1000V or less) and medium-voltage
(1…36 kV) systems.
EN 50160 conformance tracking data is measured according to requirements set
forth in the accompanying standard EN 61000-4-30, further described in
Appendix H.
The power monitor tracks the following voltage supply parameters over defined
intervals and reports each as described. Invalid intervals, in which a voltage
interruption occurs, are flagged and excluded from the conformance results.
Compliance criteria can differ depending on whether the system is low or
medium voltage and whether the system has a synchronous connection to an
interconnected system (the grid) or not (islanded). The compliance record lists
each parameter and records the number of valid intervals where the parameter
measured exceeded the specified compliance criteria.
Setup
Basic metering setup is required. The power monitor selects EN 50160
conformance criteria based on the value of the Nominal_System_LL_Voltage
parameter in the Configuration.Metering.Basic table.
The Configuration.PowerQuality table includes another parameter that affects
the selection of conformance criteria.
The PowerFrequency_Synchronization tag indicates the synchronization status
of the metering system. The choices include the following:
• 0 = Synchronous connection to an interconnected system default
• 1 = Not synchronous to an interconnected system (islanded)
Rockwell Automation Publication 1426-UM001G-EN-P - November 2014
429
Appendix G
EN 50160 Conformance Tracking
Operation
This ssection describes how the power monitor measures EN 50160
conformance.
Power Frequency
The mean fundamental frequency is measured in each valid 10 second interval.
The following are the conforming ranges for these measurements in low- and
medium-voltage systems:
Synchronously Connected
• Range 1: 50 Hz ± 1% during 99.5% of a year
• Range 2: 50 Hz + 4% / - 6% during 100% of the time
Not Synchronously Connected
• Range 1: 50 Hz ± 2% during 95% of each week
• Range 2: 50 Hz ± 15% during 100% of the time
Supply Voltage Variations (low-voltage systems)
The mean rms supply voltage is measured in each valid 10 minute interval. The
following are the confirming ranges for these measurements in low- voltage
systems:
Synchronously Connected
• Range 1: within ± 10% of nominal during 95% of each week
• Range 2: within + 10% / - 15% of nominal during 100% of the time
Not Synchronously Connected
• Within + 10% / - 15% of nominal during 100% of the time
Supply Voltage Variations (medium-voltage systems)
The following are the conforming ranges for these measurements in mediumvoltage systems:
Synchronously Connected
• Range 1: within ± 10% of nominal during 99% of each week
• Range 2: within + 15% / - 15% of nominal during 100% of the time
Not Synchronously Connected
• Within + 10% / - 15% of nominal during 100% of the time
430
Rockwell Automation Publication 1426-UM001G-EN-P - November 2014
EN 50160 Conformance Tracking
Appendix G
Rapid Voltage Changes
Long-time flicker severity Plt is measured over each 2-hour interval. The
following is the conformance specification for these measurements in low- and
medium-voltage systems:
• Plt must be less than or equal to 1 for 95% of each week
Supply Voltage Unbalance
Mean rms values of fundamental positive and negative sequence voltages are
measured each valid 10 minute interval. The following is the conformance
specification for these measurements in low- and medium-voltage systems:
• Negative sequence voltage within the range 0…2% of the positive sequence
voltage for 95% of each week
Harmonic Voltage
Mean rms values of each harmonic voltage are measured each valid 10 minute
interval. The following is the conformance specification for these measurements
in low-voltage systems:
• Harmonic voltage is less than or equal to the values listed in Table 224
(low-voltage) or Table 225 (medium-voltage) for 95% of each week
• Voltage THD including harmonics up to the 40th order is less than or
equal to 8%
Table 224 - Values of Individual Harmonic Voltages at the Supply Terminals for Orders up to 25(1) Given in Percent of the Fundamental Voltage u1,
Low-voltage Systems
Odd Harmonics
Even Harmonics
Not Multiples of 3
Multiples of 3
Order h
Relative Amplitude Uh
Order h
Relative Amplitude Uh
Order h
Relative Amplitude Uh
5
6.0 %
3
5.0%
2
2.0%
7
5.0 %
9
1.5 %
4
1.0 %
11
3.5 %
15
0.5 %
6…24
0.5 %
13
3.0%
21
0.5 %
17
2.0 %
19
1.5 %
23
1.5 %
25
1.5 %
(1) No values are given for harmonics of order higher than 25, as they are usually small, but largely unpredictable due to resonance effects.
Rockwell Automation Publication 1426-UM001G-EN-P - November 2014
431
Appendix G
EN 50160 Conformance Tracking
Table 225 - Values of Individual Harmonic Voltages at the Supply Terminals for Orders up to 25(1) Given in Percent of the Fundamental Voltage u1,
Medium-voltage Systems
Odd Harmonics
Even Harmonics
Not Multiples of 3
Order h
Multiples of 3
Relative Amplitude Uh
Order h
Relative Amplitude Uh
Order h
Relative Amplitude Uh
2
2.0%
5
6.0 %
3
5.0 %(2)
7
5.0 %
9
1.5 %
4
1.0 %
11
3.5 %
15
0.5 %
6…24
0.5 %
13
3.0%
21
0.5 %
17
2.0 %
19
1.5 %
23
1.5 %
25
1.5 %
(1) No values are given for harmonics of order higher than 25, as they are usually small, but largely unpredictable due to resonance effects.
(2) Depending on the network design, the value for the third harmonic order can be substantially lower.
Interharmonic Voltages
Conformance criteria for interharmonic voltages are under consideration by the
standards development organization.
Mains Signaling Voltages
The mean value of mains signaling voltage at the user-configured frequency is
measured in each 3 second interval. The following is the conformance
specification for these measurements:
• Signal voltage is less than or equal to the values shown in Figure 32 for 99
percent of each day
432
Rockwell Automation Publication 1426-UM001G-EN-P - November 2014
EN 50160 Conformance Tracking
Appendix G
Figure 32 - Voltage Levels of Signal Frequencies in Percent of Nominal Voltage Un Used in Public
Networks
Voltage Dips (sags)
The power monitor records voltage dips when the line-to-neutral voltage (for
Wye and split-phase metering modes) or line-to-line voltage (for Delta systems)
drops below 90% of its nominal value. The duration and residual voltage (the
minimum value during the event) are used to classify voltage dips by using the
categories shown in Table 226.
Table 226 - Classification of Dips According to Residual Voltage and Duration
Residual Voltage, u %
Duration, t ms
10 ≤ t ≤ 200
200 < t ≤ 500
500 < t ≤ 1000
1000 < t ≤ 5000
5000 < t ≤ 60,000
90 > u ≥ 80
Cell A1
Cell A2
Cell A3
Cell A4
Cell A5
80 > u ≥ 70
Cell B1
Cell B2
Cell B3
Cell B4
Cell B5
70 > u ≥ 40
Cell C1
Cell C2
Cell C3
Cell C4
Cell C5
40 > u ≥ 5
Cell D1
Cell D2
Cell D3
Cell D4
Cell D5
5>u
Cell X1
Cell X2
Cell X3
Cell X4
Cell X5
Rockwell Automation Publication 1426-UM001G-EN-P - November 2014
433
Appendix G
EN 50160 Conformance Tracking
Voltage Swells
The power monitor records voltage swells when the line-to-neutral voltage (for
Wye and split-phase metering modes) or line-to-line voltage (for Delta systems)
exceeds 110% of its nominal value. The duration and swell voltage (the maximum
value during the event) are used to classify voltage swells by using the categories
shown in Table 227.
Table 227 - Classification of Swells According to Maximum Voltage and Duration
Swell Voltage, u %
Duration, t ms
10 ≤ t ≤ 500
500 < t ≤ 5000
500 < t ≤ 60,000
u ≥ 120
Cell S1
Cell S2
Cell S3
120 > u >110
Cell T1
Cell T2
Cell T3
Transient Overvoltages
Conformance criteria for transient overvoltages are not specified in the standard.
Results
This section explains the results of EN 50160 conformance tracking.
EN 50160 Compliance Record
The PowerQuality.EN50160_Compliance_Results Data Table contains a
summary of conformance with EN 50160 compliance criteria. This table
aggregates the data logged in completed records in the EN 50160 weekly and
yearly logs. No in-process weekly or yearly log records are aggregated into the
compliance record. The content of the compliance record is shown in Table 228.
Table 228 - EN50160_Compliance_Results Table
Tag Name
Description
Mains Signaling Voltage
Updated once per day from previous day's data
Supply Voltage Range 1
Aggregated result from weekly log
Supply Voltage Range 2
Flicker Severity Plt
Supply Voltage Unbalance
Individual Harmonic Voltage
Voltage THD
Power Frequency Range 1
Synchronous is yearly aggregation;
Non-synchronous is weekly aggregation
Power Frequency Range 2
434
Sag 90 %u…80 % u, 10…200 mS Duration
Aggregated from yearly log: Number of sag events, cell A1 (1)
Sag 90…80 % u, 200…500 mS Duration
Cell A2
Rockwell Automation Publication 1426-UM001G-EN-P - November 2014
EN 50160 Conformance Tracking
Appendix G
Table 228 - EN50160_Compliance_Results Table
Tag Name
Description
Sag 90…80 % u, 500…1000 mS Duration
Cell A3
Sag 90…80 % u, 1000…5000 mS Duration
Cell A4
Sag 90…80 % u, 5000…60000 mS Duration
Cell A5
Sag 80…70 % u, 10…200 mS Duration
Cell B1
Sag 80…70 % u, 200…500 mS Duration
Cell B2
Sag 80…70 % u, 500…1000 mS Duration
Cell B3
Sag 80…70 % u, 1000…5000 mS Duration
Cell B4
Sag 80…70 % u, 5000…60000 mS Duration
Cell B5
Sag 70…40 % u, 10…200 mS Duration
Cell C1
Sag 70…40 % u, 200…500 mS Duration
Cell C2
Sag 70…40 % u, 500…1000 mS Duration
Cell C3
Sag 70…40 % u, 1000… 5000 mS Duration
Cell C4
Sag 70…40 % u , 5000…60000 mS Duration
Cell C5
Sag 40…5 % u, 10…200 mS Duration
Cell D1
Sag 40…5 % u, 200…500 mS Duration
Cell D2
Sag 40…5 % u, 500…1000 mS Duration
Cell D3
Sag 40…5 % u,1000…5000 mS Duration
Cell D4
Sag 40…5 % u, 5000…60000 mS Duration
Cell D5
Sag less than 5 % u,10…200 mS Duration
Cell X1
Sag less than 5 % u, 200…500 mS Duration
Cell X2
Sag less than 5 % u, 50…1000 mS Duration
Cell X3
Sag less than 5 % u,1000…5000 mS Duration
Cell X4
Sag less than 5 % u,5000…60000 mS Duration
Cell X5
Swell 120 % u or greater, 10…500 mS Duration
Number of swell events, Cell S1
Swell 120 % u or greater, 500…5000 mS Duration
Cell S2
Swell 120 % u or greater, 5000…60000 mS Duration
Cell S3
Swell 120…110 % u, 10…500 mS Duration
Cell T1
Swell 120…110 % u, 500…5000 mS Duration
Cell T2
Swell 120…110 % u, 5000…60000 mS Duration
Cell T3
(1) Cell numbers refer to Table 226 and Table 227.
Rockwell Automation Publication 1426-UM001G-EN-P - November 2014
435
Appendix G
EN 50160 Conformance Tracking
Weekly Conformance Log
The power monitor logs the following parameters in a weekly log. The
parameters and their conformance criteria are described in Operation on
page 430. The log contains eight records; record 1 being the current in-process
day and records 2…8 the completed records for the previous week. Records roll
over at midnight local time each day, at which time the oldest record is discarded
and the completed records are aggregated and written to the compliance record.
The records in the EN 50160 weekly log are expressed in percent of valid
intervals that are compliant with the conformance specifications. The number of
valid intervals of each duration, is also listed.
Table 229 - EN50160 Weekly Log
Tag Name
Description
Unit
Record_Number
Record 1 is the current in-process record; 2 …8 are the completed records from the prior
week.
#
Log_Date
The date this record was started.
YYMMDD
Supply Voltage Range 1
Percent of valid intervals during which the parameter was within the specified range.
%
Supply Voltage Range 2
%
Flicker Severity Plt
%
Supply Voltage Unbalance
%
Individual Harmonic Voltage
%
Voltage THD
Non Synchronous Power Freq. Range 1
%
(1)
Non Synchronous Power Freq. Range 2
10_Minutes_Valid_Data_Counts
2_Hours_Valid_Data_Counts
%
%
Number of valid intervals during 1 day. Valid interval is one without a voltage dip, swell ,or
interruption.
10_Seconds_Valid_Data_Counts
#
#
#
(1) Synchronous Power Frequency is assigned the value of zero if the PowerFrequency_Synchronization tag value = 0, synchronized.
Yearly Conformance Log
The power monitor logs the following parameters in a yearly log. The parameters
and their conformance criteria are described in Operation on page 430. The log
contains thirteen records; record 1 being an in-process record for the current
month and records 2…13 the completed records for the previous year. Records
roll over at midnight local time the last day of each month, at which time the
oldest record is discarded and the completed records are aggregated and written
to the compliance record. The records in the EN 50160 yearly log are expressed
in percent of valid intervals that are compliant with the conformance
specifications or as counts of events. The number of valid 10 second intervals is
also listed.
436
Rockwell Automation Publication 1426-UM001G-EN-P - November 2014
EN 50160 Conformance Tracking
Appendix G
Table 230 - EN50160 Yearly Log
Tag Name
Description
Unit
Record_Number
Record 1 is the current in-process record; 2…13 are the prior 12 months
#
Log_Start_Date
The Date this record was started
YYMMDD
Log_End_Date
The Date this record was ended
YYMMDD
Synchronous Power Frequency Range 1
Percent of valid intervals during which the parameter was within the specified range(1)
%
Synchronous Power Frequency Range 2
Sag 90…80 % u, 10…200 mS Duration
%
Number of sag events, cell A1(2)
#
Sag 90…80 % u, 200…500 mS Duration
Cell A2
#
Sag 90…80 % u, 500…1000 mS Duration
Cell A3
#
Sag 90…80 % u, 1000…5000 mS Duration
Cell A4
#
Sag 90…80 % u, 5000…60000 mS Duration
Cell A5
#
Sag 80…70 % u, 10…200 mS Duration
Cell B1
#
Sag 80…70 % u, 200…500 mS Duration
Cell B2
#
Sag 80…70 % u, 500…1000 mS Duration
Cell B3
#
Sag 80…70 % u, 1000…5000 mS Duration
Cell B4
#
Sag 80…70 % u, 5000…60000 mS Duration
Cell B5
#
Sag 70…40 % u, 10…200 mS Duration
Cell C1
#
Sag 70…40 % u, 200…500 mS Duration
Cell C2
#
Sag 70…40 % u, 500…1000 mS Duration
Cell C3
#
Sag 70…40 % u, 1000…5000 mS Duration
Cell C4
#
Sag 70…40 % u, 5000…60000 mS Duration
Cell C5
#
Sag 40…5 % u, 10…200 mS Duration
Cell D1
#
Sag 40…5 % u, 200…500 mS Duration
Cell D2
#
Sag 40… 5 % u, 500…1000 mS Duration
Cell D3
#
Sag 40…5 % u, 1000…5000 mS Duration
Cell D4
#
Sag 40…5 % u, 5000…60000 mS Duration
Cell D5
#
Sag less than 5 % u, 10…200 mS Duration
Cell X1
#
Sag less than 5 % u, 200…500 mS Duration
Cell X2
#
Sag less than 5 % u, 50…1000 mS Duration
Cell X3
#
Sag less than 5 % u, 1000…5000 mS Duration
Cell X4
#
Sag less than 5 % u, 5000…60000 mS Duration
Cell X5
#
Swell 120 % u or greater, 10…500 mS Duration
Number of swell events, Cell S1
#
Swell 120 % u or greater, 500…5000 mS Duration
Cell S2
#
Swell 120 % u or greater, 5000… 60000 mS Duration
Cell S3
#
Swell 120…110 % u, 10…500 mS Duration
Cell T1
#
Swell 120…110 % u, 500…5000 mS Duration
Cell T2
#
Swell 120…110 % u, 5000…60000 mS Duration
Cell T3
#
10_Seconds_Valid_Data_Counts
Number of valid 10 second intervals(1)
#
(1) Synchronous Power Frequency and 10 second valid data counts are assigned the value of zero if the PowerFrequency_Synchronization tag value = 1, islanded.
(2) Cell numbers refer to Table 226 and Table 227.
Rockwell Automation Publication 1426-UM001G-EN-P - November 2014
437
Appendix G
EN 50160 Conformance Tracking
Notes:
438
Rockwell Automation Publication 1426-UM001G-EN-P - November 2014
Appendix
H
EN 61000-4-30 Metering and Aggregation
Introduction
EN 61000-4-30 is an international standard that defines methods for
measurement and interpretation of results for power quality parameters in AC
power systems.
Class A defines requirements for precise measurements of power quality
parameters. Measurement methods are defined for each identified power quality
parameter so that measurements of parameters by different instruments agree
within the specified uncertainty. Class S defines a less rigorous set of
requirements, typically used for surveys or power quality assessment. Class B is
also included in the standard to permit legacy instruments from becoming
obsolete.
The standard also defines requirements for time aggregation of measurements.
The basic interval of measurement is 10 cycles for 50 Hz and 12 cycles for 60 Hz,
or 200 mS. Measurements made at the basic 10/12 Hz rate can then be
aggregated into 150/180 Hz (3 second), 10 minute, and 2 hour times, depending
on the parameter. Class A and class S requirements for aggregation differ in how
intervals of different lengths are kept in synchronization and whether gaps in the
basic 10/12 cycle data are permitted.
Metering Class Designation
The PowerMonitor 5000 M8 model conforms to class A and class S requirements
as indicated in Table 231.
Table 231 - EN 61000-4-30 Class Designations (M8 model only)
61000-4-30 Section Power Quality
Parameter
PM5000 Class Designation
Metering
Aggregation
5.1 Power frequency
A
S
5.2 Magnitude of the supply voltage
A
S
5.3 Flicker
A
S
5.4 Supply voltage dips and swells
A
5.5 Voltage interruptions
A
5.7 Supply voltage unbalance
A
S
5.8 Voltage harmonics
A
S
5.9 Voltage interharmonics
A
S
5.10 Mains signaling voltage
A
5.12 Underdeviation and overdeviation
A
Rockwell Automation Publication 1426-UM001G-EN-P - November 2014
Remarks
Pst range 0.1…12
S
439
Appendix H
EN 61000-4-30 Metering and Aggregation
Table 231 - EN 61000-4-30 Class Designations (M8 model only)
61000-4-30 Section Power Quality
Parameter
PM5000 Class Designation
Metering
4.4 Measurement aggregation intervals
Remarks
Aggregation
S
4.6 Real-time-clock uncertainty
A w/external sync, S with
internal RTC
4.7 Flagging
Yes
6.1 Transient influence quantities
Yes
Measurements can be made in accordance to EN 61000-4-30 requirements on
AC 50 or 60 Hz power systems in any metering mode supported by the power
monitor. Line-to-neutral voltage measurements are only reported in Wye, Splitphase, and Delta hi-leg metering modes.
Data Flagging
Data flagging is performed to avoid unreliable measurements being produced
during a metering interval in which a voltage dip, swell, or interruption occurs
and to avoid counting a single event in more than one category as a result. Data
flagging applies to individual basic metering intervals as well as to intervals into
which the flagged basic interval is aggregated. Data flagging is used in the
reporting of results in EN 50160 conformance tracking, Appendix G.
Power Quality Parameters
The following sections summarize the measurement, accuracy, and time
aggregation of each power quality parameter addressed by the standard. Accuracy
is expressed as ‘measurement uncertainty’ in the standard.
Measurement uncertainty is specified over a measuring range expressed as a
function of Udin, the declared input voltage, and in the presence of influence
quantities that can vary within a specified range. The power monitor has a Udin
of 690V rms line-to line. Table 232 lists the influence quantities and their
permitted ranges.
Table 232 - Influence Quantity Range(1) (2)
Section and Parameter
Class
Influence Quantity Range
5.1 Frequency
A
42.5…57.5 Hz, 51…69 Hz
S
42.5…57.5 Hz, 51…69 Hz
B
42.5…57.5 Hz, 51…69 Hz
A
10…200 % Udin
S
10…150 % Udin
B
10…150 % Udin
A
0…20 Pst
S
0…10 Pst
B
Not applicable
5.2 Magnitude of the supply
5.3 Flicker
440
Rockwell Automation Publication 1426-UM001G-EN-P - November 2014
EN 61000-4-30 Metering and Aggregation
Appendix H
Table 232 - Influence Quantity Range(1) (2)
Section and Parameter
Class
Influence Quantity Range
5.4 Dips and swells
A
N/A
S
N/A
5.5 Interruptions
5.7 Unbalance
5.8 Voltage harmonics
5.9 Voltage interharmonics
5.10 Mains signalling voltage
5.12 Under/overdeviation
Transient voltages IEC 61180
Fast transients IEC 61000-4-4
B
N/A
A
N/A
S
N/A
B
N/A
A
0…5 % U2 , 0…5 % U0
S
0…5 % U2
B
Specified by manufacturer
A
200 % of class 3 of IEC 61000-2-4
S
200 % of class 3 of IEC 61000-2-4
B
200 % of class 3 of IEC 61000-2-4
A
200 % of class 3 of IEC 61000-2-4
S
200 % of class 3 of IEC 61000-2-4
B
200 % of class 3 of IEC 61000-2-4
A
0…15 % Udin
S
0…15 % Udin
B
0…15 % Udin
A
N/A
S
N/A
B
N/A
A
6 kV peak
S
N/A
B
N/A
A
4 kV peak
S
N/A
B
N/A
(1) Copyright by IEC. Used with permission.
(2) For safety requirements, EMC requirements, or climatic requirements, see product standards, for example, IEC 61557-12.
In general, only basic metering setup is required, except as noted otherwise in the
sections that follow.
Rockwell Automation Publication 1426-UM001G-EN-P - November 2014
441
Appendix H
EN 61000-4-30 Metering and Aggregation
Power Frequency
The fundamental power frequency is measured at 10 second intervals.
Measurement uncertainty must not exceed ±50 mHz over the measuring ranges
42.5…57.5 Hz / 51…69 Hz. Frequency is detected on any voltage or current
channel with a signal higher than the channel metering threshold, selected in the
following order: V1, V2, V3, VN, I1, I2, I3, and I4. Results are reported in the
PowerQuality.EN61000_4_30_Aggregation Data Table.
Magnitude of the Supply Voltage
Voltage is measured at the basic 10/12 Hz metering rate and is time aggregated
into 3 second, 10 minute, and 2 hour times. Measurement uncertainty must not
exceed ±0.1% of Udin, over the range of 10…150 % of Udin. The 10/12 Hz results
are reported in the MeteringResults.EN61000_4_30_VIP table, and aggregated
results in the PowerQuality.EN61000_4_30_Aggregation Data Table.
Flicker
Flicker related to voltage fluctuations is measured in accordance with
IEC 61000-4-15. Measurement uncertainty (accuracy required by IEC 61000-415 : ±8% of one unit of perceptibility) must be met over the measuring range of
0.2…10 Pst. Flicker is measured on voltage channels 1, 2, and 3. Short term Pst
results aggregated over 10 minutes, and long term Plt results aggregated over
2 hours, are reported in the PowerQuality.EN61000_4_30_Aggregation Data
Table.
Supply Voltage Dips
Voltage dips, or sags, are detected for each voltage channel when the ½ cycle rms
voltage falls below the dip threshold. Dips are characterized by their threshold,
duration, and residual voltage.
• The power monitor uses a fixed dip threshold of 90% of nominal system
voltage for EN 61000-4-30 voltage dip detection.
• The duration of a dip begins when the ½ cycle rms voltage falls below the
dip threshold and ends when the rms voltage is equal to or greater than the
dip threshold plus the hysteresis voltage, fixed at 2% of nominal system
voltage.
• The residual voltage is the minimum rms voltage measured during the
event and its measurement uncertainty must not exceed ±0.2% of Udin.
The start date/time, duration, and residual voltage of voltage dips are logged in
the Power Quality log and tracked in the EN 50160 yearly log and compliance
record. Time aggregation is not applicable to voltage dips.
442
Rockwell Automation Publication 1426-UM001G-EN-P - November 2014
EN 61000-4-30 Metering and Aggregation
Appendix H
Supply Voltage Swells
Voltage swells are detected for each voltage channel when the ½ cycle rms voltage
rises above the swell threshold. Swells are characterized by their threshold,
duration, and swell voltage.
• The power monitor uses a fixed swell threshold of 110% of nominal
system voltage for EN 61000-4-30 voltage swell detection.
• The duration of a swell begins when the ½ cycle rms voltage rises above the
swell threshold and ends when the rms voltage is equal to or less than the
swell threshold less the hysteresis voltage, fixed at 2% of nominal system
voltage. The measurement uncertainty of the duration shall not exceed the
length of one cycle.
• The swell voltage is the maximum rms voltage measured during the event
and its measurement uncertainty must not exceed ±0.2% of Udin.
The start date/time, duration and swell voltage of voltage swells are logged in the
Power Quality log and tracked in the EN 50160 yearly log and compliance
record. Time aggregation is not applicable to voltage swells.
TIP
You can also set up user-configurable sag and swell detection in the
PowerMonitor 5000 M6 and M8 models. Refer to Refer to Sag and Swell
Detection on page 88.
TIP
EN 61000-4-30 also provides for a sliding reference voltage for sags and swells.
The PowerMonitor 5000 M6 and M8 models provide for this in their setpoint
functionality. Refer to Setpoints on page 159.
Voltage Interruptions
Voltage interruptions are detected for each voltage channel when the ½ cycle rms
voltage on all voltage channels falls below the interruption threshold. Voltage
interruptions are characterized by their threshold and duration.
• The power monitor utilizes a fixed interruption threshold of 5% of
nominal system voltage for EN 61000-4-30 voltage dip detection.
• The duration of a dip begins when the ½ cycle rms voltage on all voltage
channels falls below the dip threshold and ends when any channel's rms
voltage is equal to or greater than the interruption threshold plus the
hysteresis voltage, fixed at 2% of nominal system voltage.
Provided that the power monitor has a separate source of control power, the start
date/time and duration voltage interruptions are logged in the Power Quality log
and tracked in the EN 50160 yearly log and compliance record. Time aggregation
is not applicable to voltage interruptions.
Rockwell Automation Publication 1426-UM001G-EN-P - November 2014
443
Appendix H
EN 61000-4-30 Metering and Aggregation
TIP
You can also set up user-configurable voltage interruption detection in the
PowerMonitor 5000 M6 and M8 models. Refer to Refer to Sag and Swell
Detection on page 88.
Supply Voltage Unbalance
Supply voltage unbalance is evaluated by using the method of symmetrical
components, at the basic 10/12 cycle metering rate, and by using filtering to
minimize the effects of harmonics. Measurement uncertainty must be less than
±0.15% of both negative sequence ratio and zero-sequence ratio.
The 10/12 cycle results of positive, negative, and zero-sequence component
values on all voltage and current channels, and the 10/12 cycle results of voltage
and current percent unbalance, are returned in the
PowerQuality.EN61000_4_30_Sequence Data Table. Three-second, 10-minute,
and 2-hour time aggregations of voltage unbalance are returned in the
PowerQuality.EN61000_4_30_Aggregation Data Table.
Voltage Harmonics and Interharmonics
Harmonic and Interharmonic groups are measured by using the requirements of
IEC 61000-4-7, at the basic 10/12 cycle metering rate. Measurement accuracy is
specified as follows:
• For voltage and current harmonics, the measurement uncertainty is no
greater than ±1% of the measured fundamental voltage or current.
• The phase shift between individual channels must be less than h * 1°.
The PowerMonitor 5000 M8 model provides the following sets of harmonic
measurements in accordance with EN 61000-4-30.
• 10/12 cycle voltage and current IEEE and IEC THD, crest factor and Kfactor, in the following data table:
– PowerQuality.EN61000_4_30_THD (M8 only)
• 10/12 cycle THD voltage THD of harmonic (THDS) and interhamonic
(TIHDS) subgroups, in the following data table:
– PowerQuality.EN61000_4_30_HSG (M8 only)
• Harmonic subgroup up to the 50th harmonic for voltage and current
updated every 10/12 cycles (200 mS). These results are reported in the
following data tables:
– PowerQuality.200mS_V1_N_Volts_RMS_HDS
– PowerQuality.200mS_V2_N_Volts_RMS_HDS
– PowerQuality.200mS_V3_N_Volts_RMS_HDS
– PowerQuality.200mS_VN_G_Volts_RMS_HDS
– PowerQuality.200mS_V1_V2_Volts_RMS_HDS
– PowerQuality.200mS_V2_V3_Volts_RMS_HDS
444
Rockwell Automation Publication 1426-UM001G-EN-P - November 2014
EN 61000-4-30 Metering and Aggregation
Appendix H
– PowerQuality.200mS_V3_V1_Volts_RMS_HDS
– PowerQuality.200mS_I1_Amps_RMS_HDS
– PowerQuality.200mS_I2_Amps_RMS_HDS
– PowerQuality.200mS_I3_Amps_RMS_HDS
– PowerQuality.200mS_I4_Amps_RMS_HDS
• Interharmonic centered subgroup up to the 50th harmonic for voltage and
current updated every 10/12 cycles (200mS). These results are reported in
the following data tables:
– PowerQuality.200mS_V1_N_Volts_RMS_IHDS
– PowerQuality.200mS_V2_N_Volts_RMS_IHDS
– PowerQuality.200mS_V3_N_Volts_RMS_IHDS
– PowerQuality.200mS_VN_G_Volts_RMS_IHDS
– PowerQuality.200mS_V1_V2_Volts_RMS_IHDS
– PowerQuality.200mS_V2_V3_Volts_RMS_IHDS
– PowerQuality.200mS_V3_V1_Volts_RMS_IHDS
– PowerQuality.200mS_I1_Amps_RMS_IHDS
– PowerQuality.200mS_I2_Amps_RMS_IHDS
– PowerQuality.200mS_I3_Amps_RMS_IHDS
– PowerQuality.200mS_I4_Amps_RMS_IHDS
• Harmonic subgroup up to the 50th harmonic for voltage aggregated over 3
seconds (150/180 cycles). These results are reported in the following data
tables:
– PowerQuality.3s_V1_N_Volts_RMS_HDS
– PowerQuality.3s_V2_N_Volts_RMS_HDS
– PowerQuality.3s_V3_N_Volts_RMS_HDS
– PowerQuality.3s_VN_G_Volts_RMS_HDS
– PowerQuality.3s_V1_V2_Volts_RMS_HDS
– PowerQuality.3s_V2_V3_Volts_RMS_HDS
– PowerQuality.3s_V3_V1_Volts_RMS_HDS
• Interharmonic centered subgroup up to the 50th harmonic for voltage
aggregated over 3 seconds (150/180 cycles). These results are reported in
the following data tables:
– PowerQuality.3s_V1_N_Volts_RMS_IHDS
– PowerQuality.3s_V2_N_Volts_RMS_IHDS
– PowerQuality.3s_V3_N_Volts_RMS_IHDS
– PowerQuality.3s_VN_G_Volts_RMS_IHDS
– PowerQuality.3s_V1_V2_Volts_RMS_IHDS
– PowerQuality.3s_V2_V3_Volts_RMS_IHDS
– PowerQuality.3s_V3_V1_Volts_RMS_IHDS
Rockwell Automation Publication 1426-UM001G-EN-P - November 2014
445
Appendix H
EN 61000-4-30 Metering and Aggregation
• Harmonic subgroup up to the 50th harmonic for voltage aggregated over
10 minutes. These results are reported in the following data tables:
– PowerQuality.10m_V1_N_Volts_RMS_HDS
– PowerQuality.10m_V2_N_Volts_RMS_HDS
– PowerQuality.10m_V3_N_Volts_RMS_HDS
– PowerQuality.10m_VN_G_Volts_RMS_HDS
– PowerQuality.10m_V1_V2_Volts_RMS_HDS
– PowerQuality.10m_V2_V3_Volts_RMS_HDS
– PowerQuality.10m_V3_V1_Volts_RMS_HDS
• Interharmonic centered subgroup up to the 50th harmonic for voltage
aggregated over 10 minutes. These results are reported in the following
data tables:
– PowerQuality.10m_V1_N_Volts_RMS_IHDS
– PowerQuality.10m_V2_N_Volts_RMS_IHDS
– PowerQuality.10m_V3_N_Volts_RMS_IHDS
– PowerQuality.10m_VN_G_Volts_RMS_IHDS
– PowerQuality.10m_V1_V2_Volts_RMS_IHDS
– PowerQuality.10m_V2_V3_Volts_RMS_IHDS
– PowerQuality.10m_V3_V1_Volts_RMS_IHDS
• Harmonic subgroup up to the 50th harmonic for voltage aggregated over 2
hours. These results are reported in the following data tables:
– PowerQuality.2h_V1_N_Volts_RMS_HDS
– PowerQuality.2h_V2_N_Volts_RMS_HDS
– PowerQuality.2h_V3_N_Volts_RMS_HDS
– PowerQuality.2h_VN_G_Volts_RMS_HDS
– PowerQuality.2h_V1_V2_Volts_RMS_HDS
– PowerQuality.2h_V2_V3_Volts_RMS_HDS
– PowerQuality.2h_V3_V1_Volts_RMS_HDS
• Interharmonic centered subgroup up to the 50th harmonic for voltage
aggregated over 2 hours. These results are reported in the following data
tables:
– PowerQuality.2h_V1_N_Volts_RMS_IHDS
– PowerQuality.2h_V2_N_Volts_RMS_IHDS
– PowerQuality.2h_V3_N_Volts_RMS_IHDS
– PowerQuality.2h_VN_G_Volts_RMS_IHDS
– PowerQuality.2h_V1_V2_Volts_RMS_IHDS
– PowerQuality.2h_V2_V3_Volts_RMS_IHDS
– PowerQuality.2h_V3_V1_Volts_RMS_IHDS
• Interharmonics in 5 Hz increments up to the 50th harmonic for voltage,
current and power updated every 10/12 cycles (200 mS). These results are
reported in the MeteringData snapshot, Group 2.
446
Rockwell Automation Publication 1426-UM001G-EN-P - November 2014
EN 61000-4-30 Metering and Aggregation
Appendix H
Figure 33 - Illustration of a Harmonic Subgroup, an Interharmonic Centered Subgroup and 5 Hz
Increments of Interharmonics (FFT output)(1)
(1) Adapted from IEC 61000-4-7-2002, Copyright by IEC, used with permission
Mains Signaling Voltage on the Supply Voltage
Mains signaling voltage, also called ripple control signal, is made up of bursts of
signals at a particular frequency that energy providers can use to control meters,
load controllers, and other devices. The PowerMonitor 5000 M8 model measures
mains signaling voltage by using the configuration made by the user. Results are
aggregated over 3 seconds, and reported in the
PowerQuality.EN61000_4_30_Aggregation Data Table. Over-threshold values
are tracked in the PowerQuality.EN50160_Compliance_Results Data Table and
reporded in the Alarm and Power Quality logs. Measurement uncertainty must
not exceed ±5% of the measured value or ±0.15% of the nominal system voltage,
whichever is greater.
Setup
In addition to basic metering setup, these configuration parameters are found in
the Configuration.PowerQuality tab:
• Mains_Signaling_Frequency_Hz - The monitoring frequency of the
control signal in Hz. Range: 5…3000, default 500
• Mains_Signaling_Recording_Length - The maximimun recording length
in seconds. Range: 1…120 (default)
• Mains_Signaling_Threshold_% - The threshold in percent of signal level
to the mains voltage. Range 0 (default)…15, 0 disables
Rockwell Automation Publication 1426-UM001G-EN-P - November 2014
447
Appendix H
EN 61000-4-30 Metering and Aggregation
Rapid Voltage Changes
A rapid voltage change is a fast transition between two steady-state rms voltage
values. In general, the voltage after a rapid voltage change remains within the
voltage dip (sag) and swell thresholds. Rapid voltage changes are recorded in the
Alarm log and the Power Quality log with the date/time stamp of their
occurrence.
Setup
One configuration parameter can be found in the Configuration.PowerQuality
tab.
• Under_Over_Voltage_Deviation_Threshold_% - The percent under
voltage or overvoltage of the mains connection to start recording
deviation. Range: 0…15, default = 5, 0 disables
448
Rockwell Automation Publication 1426-UM001G-EN-P - November 2014
Glossary
The following terms and abbreviations are used throughout this manual. For
definitions of terms not listed here, refer to the Allen-Bradley Industrial
Automation Glossary, publication AG-7.1.
Aggregation In power quality measurement, the process of computing a single value from
multiple measurements over a defined time interval. The value is computed by
taking the square root of the arithmetic mean of the squared input values over a
defined time interval (that is,180 cycles, 10 minutes, etc). See EN 61000-4-30
standard for more information.
Amperes (A) The units of electrical current or rate of flow of electrons. One volt across one
ohm of resistance causes a current flow of one ampere. A flow of one coulomb per
second equals one amp.
Apparent Power The product of voltage magnitude and current magnitude in a circuit. Units are
VA or some multiple thereof.
Balanced Load An alternating, current power system consisting of more than two current
carrying conductors in which these current carrying conductors all carry the same
current.
Billing Demand The demand level that a utility uses to calculate the demand charges on the
current month's bill. Various methods can be used to determine the value, such as
minimum demand, peak demand or a ratchet clause. It can be based on Watt
Demand, VA Demand, VAR Demand or some combination of these. A rate at
which a transmission occurs, where one baud equals one bit per second.
Burden The electrical load placed on source of VA or the load an instrument or meter
places on a current or potential transformer. All current and potential
transformers have a rated burden that cannot be exceeded or else transformer
transformation accuracy deteriorates.
Capacitor A device consisting essentially of two conducting surfaces separated by an
insulating material or dielectric. A capacitor stores electrical energy, blocks the
flow of direct current, and permits the flow of alternating current to a degree
dependent upon the capacitance and frequency. Capacitors can also be used to
adjust the power factor in a system.
Connected Load The total load that a customer can impose on the electrical system if everything
was connected at one time. Connected loads can be measured in horsepower,
watts or volt-amperes. Some rate schedules establish a minimum demand charge
by imposing a fee per unit of connected load.
Crest Factor A measure of the amount of distortion present in a waveform. It can also be used
to express the dynamic range of a measurement device. Crest Factor is the ratio of
the peak to the RMS. For a pure sinusoidal waveform, Crest Factor equals the
square root of 2 (1.414).
Rockwell Automation Publication 1426-UM001G-EN-P - November 2014
449
Glossary
Current (I) The flow of electrons through a conductor, measured in amperes.
Current Overload An higher than normal flow of current through a conductor or device that
exceeds the rating of the conductor or device.
Current Transformer (CT) A transformer, intended for measuring or control purposes, designed to have its
primary winding connected in series with a conductor carrying the current to be
measured or controlled. CT's step down high currents to lower values that can be
used by measuring instruments.
Current Transformer Ratio The ratio of primary amperes divided by secondary amperes.
Data Flagging Marking a measured data parameter as potentially inaccurate because the
measurement was made during a power quality event.
Data Table Power monitor data is organized in data tables similar to those found in an
SLC 5/03 Programmable Controller. The detailed data table definitions are
covered in Appendix A.
DC Offset DC offset occurs when an AC waveform has been distorted in a manner that
results in a non-zero sum of the waveform values over a one cycle interval.
Demand Hours The equivalent number of hours in a month during which the peak demand is
fully utilized. In other words, if energy consumption for the current month is X
kwhr and the peak demand is Y kW, then the demand hours is equal to X/Y
hours. The higher the number of demand hours, the better the demand leveling
situation, and the more effectively demand is being used.
Demand Interval Demand charges are based on peak demand over a utility specified time interval,
not on the instantaneous demand (or connected load) at any given moment.
Typical demand intervals are 15, 20, and 30 minutes.
Dip See Sag.
Duration For purposes of power quality measurement this is the elapsed time from the
beginning of a power quality event to the end of than event.
EN 50160 European standard for "Voltage characteristics of electricity supplied by public
electricity networks". Defines acceptable variations in the utility supplied voltage.
EN 61000-4-7 European standard for Testing and measurement techniques - General guide on
harmonics and interharmonics measurements and instrumentation, for power
supply systems and equipment connected thereto.
EN 61000-4-15 European standard for Testing and measurement techniques - Flickermeter Functional and design specifications.
EN 61000-4-30 European standard that defines testing and measurement techniques for power
quality measurement methods.
450
Rockwell Automation Publication 1426-UM001G-EN-P - November 2014
Glossary
FFT Fast Fourier Transform A mathematical technique for decomposing an AC waveform consisting of a
fundamental frequency and one or more harmonics into separate components
that represent the magnitude and phase angle of the fundamental and each of the
harmonics present. The bandwidth of the input signal must be limited according
to the capability of the measuring device.
Flicker Low frequency variation in lighting intensity, caused by voltage fluctuations, that
may cause discomfort or neurological effects in sensitive individuals. See also
Voltage Fluctuation.
Frequency The number of recurrences of a periodic phenomenon in a unit of time. In
electrical terms, frequency is specified as so many Hertz (Hz) where one Hz
equals one cycle per second.
Fundamental Frequency In regards to an electrical power system, this is the nominal frequency of the
system, that is, 50 or 60 Hz.
Harmonic Group The RMS value obtained for a given harmonic by combining the harmonic RMS
magnitude with a defined number of adjacent interharmonic RMS values. See
EN 61000-4-7 for more details.
Harmonics AC frequency components that are interger multiples of the fundamental
frequency. For example, 180 Hz is the third harmonic in a 60 Hz system.
Horsepower (hp) A unit of power, or the capacity of a mechanism to do work. It is equivalent to
raising 33,000 pounds one foot in one minute. One horsepower equals 746 watts.
IEC 61000-4-30 See EN 61000-4-30.
IEC 61000-4-7 See EN 61000-4-7.
IEC 61000-4-15 See EN 61000-4-15.
IEEE 1159 The IEEE recommended practice for monitoring electric power quality.
IEEE 519 The IEEE recommended practices and requirements for harmonic control in
electrical power systems.
Imbalance In a three phase system, imbalance is a measure of the extent to which the
magnitudes of the three phase voltages (or currents) are not equal in magnitude
and/or the phase angle between the phases is not 120 degrees. Computed as the
ratio of the negative sequence component to the positive sequence component.
Imbalance results in unwanted losses in the power system and can result in
excessive heating of rotating equipment.
Impedance The total opposition (that is, resistance and reactance) a circuit offers to the flow
of alternating current at a given frequency. It is measured in ohms.
Induction Motor An alternating current motor in which the primary winding (usually the stator) is
connected to the power source and induces a current into a secondary (usually
the rotor).
Rockwell Automation Publication 1426-UM001G-EN-P - November 2014
451
Glossary
Inductor A device consisting of one or more windings with or without a magnetic core.
Motors are largely inductive.
Influence Quantity Any external quantity, such as temperature or electo-magnetic interference, that
may affect the accuracy of a measured parameter.
Initiator Pulses Electrical impulses generated by pulse-initiator mechanisms installed in utility
revenue meters. Each pulse indicates the consumption of a specific number of
watts. These pulses can be used to measure energy consumption and demand.
Interharmonics Any external quantity, such as temperature or electo-magnetic interference, that
may affect the accuracy of a measured parameter.
Interharmonic Group The RMS value obtained by combining the RMS value of the measured
interharmonic values between two adjacent harmonic frequencies. See EN
61000-4-7 for more details.
K-factor A measure that indicates heating in a power transformer due to harmonics in the
power signal. These harmonics cause additional heating due to increased core
losses that occur at higher frequencies.
Lagging Current The current flowing in an AC circuit that is mostly inductive. If a circuit contains
only inductance, the current lags the applied voltage by 90°. Lagging current
means lagging power.
Leading Current The current flowing in a circuit that is mostly capacitive. If a circuit contains only
capacitance, the current leads the applied voltage by 90°. Leading current means
leading power factor.
Load Any device or circuit consuming power in an electrical system.
Load Shedding The removal of load from the line to limit load and control demand level.
Load Restoring The energizing of loads that were previously removed from the line to limit load
and control demand level.
Mains Signaling Voltage A burst of signals usually applied to a power circuit at an interharmonic
frequency. Used to remotely control industrial equipment, revenue meters, and
other devices.
Measurement Uncertainty The range of possible error in a measurement as a percent of the ideal value.
Neutral The conductor chosen as the return path for the current from the load to the
source. It is also a voltage reference point in a power system.
Noise, Electrical Undesired broadband electrical signals superimposed on the power system
voltage.
Notching Periodic voltage distortion created by three-phase power electronic devices when
current is commutated from one phase to another.
452
Rockwell Automation Publication 1426-UM001G-EN-P - November 2014
Glossary
Ohm The unit of electrical resistance. One ohm is the value of resistance through
which a potential difference of one volt maintains a current flow of one ampere.
Overvoltage An increase in the RMS voltage greater than 110% of nominal for more than 1
minute.
Peak Demand The highest average load over a utility specified time interval during a billing
period. If there is no ratchet clause in the rate schedule, then the peak demand is
also the billing demand.
Phasor Diagram A vector diagram that shows the magnitude and phase relationship of the
voltages and currents in a three-phase system.
Polyphase Having or utilizing several phases. A polyphase power circuit has several
(typically three) phases of alternating current with a fixed phase angle between
phases.
Potential Transformer (PT) An transformer with the primary winding connected in parallel with the circuit
whose voltage is to be measured or controlled. PT's are normally used to step
down high-voltage potentials to lower levels acceptable to measuring
instruments. Also known as voltage transformer (VT).
Potential Transformer Ratio The ratio of primary voltage divided by secondary voltage.
Power Factor The ratio of real power in watts of an alternating current circuit to the apparent
power in volt-amperes. Also expressed as the cosine of the phase angle between
the fundamental voltage applied to a load and the current passing through it.
Power Factor Correction Steps taken to raise the power factor by closely aligning the current to be in phase
with the applied voltage. Most frequently this consists of added capacitance to
increase the lagging power factor of inductive circuits.
Power Factor Penalty The charge utilities impose for operating at power factor below some rate
schedule-specified level. This level ranges from a lagging power factor of 0.80 to
unity. There are innumerable ways by which utilities calculate power factor
penalties.
Power Quality Qualitatively, the fitness of electrical voltage to supply power to consuming
devices. Quantitatively, the observed set of electrical characteristics at a given
point on an electrical system as compared to a set of reference conditions.
Rapid Voltage Changes A rapid change is RMS value between two steady-state conditions. The
magnitude in the change is less than the sag or swell thresholds.
Rockwell Automation Publication 1426-UM001G-EN-P - November 2014
453
Glossary
Ratchet Clause A rate schedule clause that states that billing demand can be based on current
month peak demand or on historical peak demand, depending on relative
magnitude. Usually the historical period is the past eleven months, although it
can be for the life of the contract. Billing demand is either the current month
peak demand or some percentage (75% is typical) of the highest historical peak
demand, depending on which is largest. It is designed to compensate the electric
utility for maintaining equipment not fully utilized.
Reactance The opposition to the flow of alternating current. Capacitive reactance is the
opposition offered by capacitors and inductive reactance is the opposition offered
by an inductive load. Both reactances are measured in ohms.
Real Power The component of apparent power that represents real work in an alternating
current circuit. It is expressed in watts and is equal to the apparent power times
the power factor.
Residual Voltage The minimum remaining voltage during a votage sag or interruption.
Resistance The property of a substance that impedes current flow and results in the
dissipation of power in the form of heat. The unit of resistance is the ohm. One
ohm is the resistance through which a difference of potential of one volt produces
a current of one ampere.
Revenue Meter A meter used by a utility to generate billing information. Many types of meters
fall in this category depending on the rate structure.
Root Mean Square (RMS) The effective value of alternating current or voltage. The RMS values of voltage
and current can be used for the accurate computation of power in watts. The
RMS value is the same value as if continuous direct current were applied to a pure
resistance.
Sag Temporary reduction in RMS voltage magnitude below a preset threshold,
typically 90% of nominal.
Sequence Currents The result of symmetrical component analysis performed on a set of three-phase
current vectors. The analysis results in three sets of balanced sequence current
vectors: positive sequence, negative sequence, and zero sequence. The positive
sequence current rotates in the same direction as the original set of vectors, the
negative sequence rotates in the opposite direction, and the zero zequence has no
rotation. See also Imbalance.
Sequence Voltages The result of symmetrical component analysis performed on a set of three-phase
voltage vectors. The analysis results in three sets of balanced sequence voltage
vectors: positive sequence, negative sequence, and zero sequence. The positive
sequence voltage rotates in the same direction as the original set of vectors, the
negative sequence rotates in the opposite direction, and the zero zequence has no
rotation. See also Imbalance.
454
Rockwell Automation Publication 1426-UM001G-EN-P - November 2014
Glossary
Sliding Demand Interval A method of calculating average demand by averaging the average demand over
several successive short time intervals, advancing one short time interval each
time. Updating average demand at short time intervals gives the utility a much
better measure of true demand and makes it difficult for the customer to obscure
high short-term loads.
Subharmonics AC waveform components at frequencies less than the fundamental frequency.
Swell Temporary increase in RMS voltage magnitude above a preset threshold,
typically 110% of nominal.
Swell Voltage The maximum RMS voltage during a voltage swell.
TDD Total Demand Distortion, the ratio of the total RMS harmonic content
expressed as a percent of the maximum demand current RMS value. The
maximum demand current is the average of the maximum demand over the
previous 12 months.
THD Total Harmonic Distortion, the ratio of the total RMS harmonic content (either
voltage or current) expressed as a percent of the fundamental RMS value.
Threshold A limit, either fixed or configurable, used to trigger an action when a measured
parameter is greater than (i.e. a swell condition) or less than (i.e. a sag condition)
the limit.
TID Total Interharmonic Distortion, the ratio of the total interharmonic RMS
content (excluding any harmonic content) to the fundamental RMS value.
Transient A waveform distortion with a duration of less than one cycle, may be either
impulsive or oscillatory. Typically caused by lightning or power device switching.
Unbalanced Load A situation existing in a three-phase alternating current system using more than
two current carrying conductors where the current is not due to uneven loading
of the phases.
Undervoltage Voltage sag with a duration greater than one minute.
Volt-Ampere (VA) The unit of apparent power. It equals volts times amperes regardless of power
factor.
Volt-Ampere Demand Where peak average demand is measured in volt-amperes rather than watts. The
average VA during a predefined interval. The highest average, for example, Peak
VA demand, is sometimes used for billing.
Volt Ampere Reactive Hours The number of VARs used in one hour. Because the value of this parameter
(VARH) varies, it is necessary to integrate it over time. VARs can be either forward or
reverse.
Voltage (V) The force that causes current to flow through a conductor. One volt equals the
force required to produce a current flow of one ampere through a resistance of
one ohm.
Rockwell Automation Publication 1426-UM001G-EN-P - November 2014
455
Glossary
Voltage Fluctuation A series of RMS voltage magnitude changes or a low frequency, less than 40 Hz,
periodic variation of the nominal voltage envelop. The variations can result in
modulation of the luminence of light sources connected to the power system.
The modulation or "flicker" can cause discomfort in individuals exposed to the
flickering light. See EN 61000-4-15 for more details. See also Flicker.
Voltage Interruption Voltage sag with a residual voltage less than 10% of nominal.
Voltage Over Deviation The ratio of the measured RMS voltage to the nominal voltage expressed as a
percent when the measured voltage is greater that the nominal voltage. See also
Rapid Voltage Changes.
Voltage Under Deviation The ratio of the measured RMS voltage to the nominal voltage expressed as a
percent when the measured voltage is less than the nominal voltage. See also
Rapid Voltage Changes.
Watt (W) A measure of real power. The unit of electrical power required to do work at the
rate of one joule per second. It is the power expended when one ampere of direct
current flows through a resistance of one ohm. Equal to apparent power VA times
the power factor.
Watt Demand Power during a predetermined interval. The highest average, for example, Peak
demand is commonly used for billing.
Watt Hour (Whr) The number of watts used in one hour. Because the power usage varies, it is
necessary to integrate this parameter over time. Power flow can be either forward
or reverse.
Wattmeter An instrument for measuring the real power in an electric circuit. Its scale is
usually graduated in watts, kilowatts, or megawatts.
Waveform Numerical representation of the instantaneous value of a measured parameter
(that is, voltage or current) as a function of time. Can be presented graphically or
in a tabular form.
Wiring Correction In reference to the PowerMonitor 5000 unit, this is a virtual correction
performed by the device to correct the effect of physical wiring errors without
actually accessing the device or moving any of the connected wires.
Wiring Diagnostics In reference to the PowerMonitor 5000 unit, this is an analysis performed by the
device to ensure it is properly connected. In the event connection errors are
present, they are identified for the user. The user then has the option of physically
correcting the errors or of using the ‘virtual’ wiring correction capability of the
device to allow the device to correct the errors through appropriate internal
adjustments. See also Wiring Correction.
456
Rockwell Automation Publication 1426-UM001G-EN-P - November 2014
Index
A
accessory kit 21
overcurrent protection 33
account classes and privileges 178
admin 178
application 178
USB admin 178
user 178
accuracy and range 397
adding optional communcation 229
additional resources 10
addressing
CIP 191
CSP 191
symbolic 191
alarm log 88
codes and descriptions 137
logged parameters 136
results 136
angle data 413
auto return data order 101
automatic virtual wiring correction 58
averaging of metering results 57
B
basic metering 55
set-up parameters 56
billing 12
C
calendar 179
catalog number explanation 9
CE 400
CIP addressing 191
CIP object 222
base energy 223
electrical energy 224
message configuration 225
class 1 connection 208
commands 186
communication
ControlNet 42
ControlNet setup 49
DeviceNet 40
DeviceNet setup 49
USB port 33
communication command
ControlNet 192
DeviceNet 192
EtherNet/IP 192
communication path
explicit message
197
communication rate
DeviceNet 189
communication setup
ControlNet 189
DeviceNet 188
configuration
EDS 219
configuration lock input 76
configuration lockswitch 13
connection
DeviceNet 41
control power
disconnecting means 33
source 33
control power wiring terminal 14
control relay 399
control relay terminal 14
ControlNet
communication 42, 189
communication command 192
communication setup 49
I/O connection 214
object model 194
cost allocation 12
crest factor 82
CSP addressing 191
CT transformation ratios 56
current
THD 424
current input mapping 62
current metering 74
current sensing 14
phasing 30
polarity 30
wiring 21
wiring diagrams 29-31
current transformer
wiring 29
current transformer safety 11
current transformer secondary wiring 29
ring lugs 29
current unbalance formula 74
D
data log
date and time 179
logged parameters 117
parameters 110
results 116
setup 110
single record retrieval 118
types 96
data log parameters 110
data retrieval 194
data table interface 99
data table summary index 231
Rockwell Automation Publication 1426-UM001G-EN-P - November 2014
457
Index
data types
DINT 191
DWORD 191
INT 191
INT16 191
INT32 191
REAL 191
SINT 191
string 191
daylight saving time 179, 180
demand calculation formula 67
demand metering 66
date and time 179
delay 70
end-of-interval signal 69
number of periods 70
period length 70
setup 69
demand power factor formula 67
demand response 12
detection of power quality events 56
device indicator 14
DeviceNet
communication 40, 188
communication command 192
communication rate 189
communication setup 49
connection 41
I/O connection 209
mac id 189
object model 194
dimensions 18
DINT 191
disconnecting means 33
display module 403
navigation 407
display terminal 76
download logging results 99
download logging results FTP 99
driver configuration
Ethernet devices 202
EtherNet/IP 203
RSLinx Classic 202
DWORD 191
E
EDS 190
EDS add on profile
RSLogix 5000 219
electronic data sheet 190
electrostatic discharge 17
EMC 401
EN 50160 88
conformance tracking 429
weekly 101
weekly log 152, 436
yearly 101
yearly log 152, 436
EN 50160 compliance record 434
458
EN 50160 conformance tracking
results 434
EN 61000-4-30
class designations 439
data flagging 440
metering and aggregation 439
enclosure 17
energy log 106
file name 106
logged parameters 107
results 106
single record retrieval 108
energy metering 65
Energy_Log_Interval 96
Energy_Log_Mode 97
Ethernet
cable 39
communication 39
connections 39
port 13
Ethernet communication parameters 187
EtherNet/IP
communicatin command 192
object model 193
evaluation types 160
magnitude 160
percent of reference 160
percent of sliding reference 160
state 160
event codes 131
event log
event codes 131
general codes 131
information codes 131
logged parameters 130
results 130
Event_Log_Mode 98
exclusive owner connection 179, 219
input only 221
listen only 220
explicit message
CIP messaging 198
communication path 197
PLC-5 typed read 195
PLC-5 typed read/write 200
PLC-5 typed write 197
SLC typed read 195
SLC typed read/write 200
SLC typed write 197
F
feature
KYZ output 14
Rockwell Automation Publication 1426-UM001G-EN-P - November 2014
Index
features 13
configuration lockswitch 13
control power wiring 14
control relay 14
current sensing 14
Ethernet port 13
ground wiring 14
KYZ output 32
relay outputs 32
status indicators 14
status inputs 14
USB device port 13
USB host port 13
virtual wiring indicator 14
voltage sensing 14
flicker 425, 442
severity 431
floating point number types 411
frequency metering 74
FTP logging results 99
functions 15
logging 15
other 16
G
general codes 131
general specifications 400
generic Ethernet connection
version 19 and earlier 208
glossary terms 449
ground the unit 20
ground wiring terminal 14
grounding
mounting surface 20
wire connection 20
H
harmonic analysis
82
IEC DIN 82
IEEE THD 82
total harmonic distortion 82
harmonic distortion
crest factor 82
harmonic analysis results 83, 85
harmonic magnitude and angle 84
harmonic power 84
k-factor 83
harmonic magnitude 84
harmonic power 84
harmonic voltage
RMS values 431
IEEE 1159 88, 425
IEEE 1159-2009 419
IEEE 519-1992
long term harmonic results 417
pass fail capability 415
pass fail results 416
pass fail status 416
short term harmonic results 417
IEEE THD 82
information codes 131
input and output ratings 398
input only connection 221
inserting communcation card 40, 42
install the unit 17
substation 17
switchgear 17
instantaneous demand formula 69
INT 191
INT16 191
Int32 191
interharmonic voltages 432
interharmonics 444
internal clock 179
IP address 37
default 37
K
k-factor 83
KYZ output 14, 32, 153
Setup 154
L
line voltage monitoring 88
load factor log 126
logged parameters 127
results 126
load profiling 12
Load_Factor_Auto_Log_Setting 97
logged parameters
energy log 107
logging functions 15
logging results 98, 99
using FTP 99
logging setup 96
logic gates 162
setup 165
login
USB connection 38
web page 38
Logix Designer application 195
I
I/O connection
ControlNet 214
DeviceNet 209
IEC DIN 82
M
magnitude and direction power quantities
chart 73
magnitude data 412
Rockwell Automation Publication 1426-UM001G-EN-P - November 2014
459
Index
magnitudes 61
mains signaling voltage 432, 447
mean fundamental frequency 430
mean rms supply voltage 430
measurements 64
memory organization 190
metering
current 74
frequency 74
voltage 74
metering accuracy 56
metering results 55
averaging 57
update rate 57
viewing on display terminal 76
viewing on web page 75
voltage and current unbalance 423
metering snapshot log
results 151
min/max log 120
logged parameters 120
results 120
mount the unit
dimensions 18
enclosure 17
panel mounting 19
ventilation 18
N
navigation
display module 407
network communicaiton
waveform log 102
network indicator 14
nominal system frequency 56
nominal system voltage 56
O
object model
object class list 193, 194
Off_Peak_Days 97
OPC server 203
test 205
other functions 16
overcurrent protection 33
overview 11
P
panel mounting 19
PanelView C400, terminal set-up 403
parameter configuration 194
peak hours 97
phase angle 58, 61
Point of Common Coupling (PCC) 415
power factor
phase angle 58
460
power factor ranges 58
power frequency variations 426
power indicator 14
power metering 72
power quality 12
80
accuracy 440
capabilities 80
classification 80
magnitude of the supply voltage 442
measurement 440
measurement and reporting 80
power frequency 442
recording 80
time aggregation 440
power quality events 419
power quality log 142
event codes 144
logged parameters 143
record 142
results 146
power quantities chart 73
power system control 12
power system monitoring 12
PowerMonitor 5000
description 11
functions 15
web page 38
PowerMonitor 5000 input only connection 179
PowerMonitor 5000 unit
safety 11
PowerQuality_Log_Mode 97
precision time protocol 181
product description 11
product disposal 16
PT transformation ratios 56
R
rapid voltage change 448
rapid voltage changes 431
read logging records 99
REAL 191
relay outputs 32
removing communication card 40, 42
retrieve logging results 98
ripple control signal 447
RMS variations
long duration 422
operation 421
setup 421
short duration 421
RSLinx Enterprise 206
run time errors 184
S
safe disposal of product 16
safe mode 185
Rockwell Automation Publication 1426-UM001G-EN-P - November 2014
Index
safety 11
current transformer 11
sag and swell
88
operation 89
setup 88
status 89
thresholds 88
SCADA 202
security 177
account classes and privileges 178
deleted accounts 179
login 195
lost login 179
servicing connect equipment
shorting switch 29
shorting terminal block 29
test block 29
wiring 29
setpoint and logic gate
statistics 174
status 174
setpoint log
logged parameters 134
results 134
setpoint operation 159
equal to 162
evaluation types 160
greater than 161
less than 161
logic gates 162
setpoint output action list 173
setpoint parameter list 166
Setpoint_Log_Mode 97
set-up parameters 56
simple network time protocol 181
single record retrieval
data log 118
energy log 108
SINT 191
snapshot log 150
content 150
data table interface 152
web interface 152
specifications
Accuracy and range 397
general 400
input and output ratings 398, 399
status indicators
device 14
network 14
power 14
status inputs 14, 157
features
status inputs 32
Setup 157
string 191
Studio 5000 Engineering and Design
Environment 195
sub-billing 12
subnet mask
default 37
supply voltage unbalance 444
supply voltage variations 430
symbolic tag addressing 190, 191
symmetrical component analysis 75
system clock synchronize 181
T
terminal 403
terminal block layout 20
THD 82
current 424
voltage 424
time of use log
logged parameters 128
results 128
time zones 182
Time_Of_Use_AutoStore 97
Total Demand Distortion (TDD) 415
total harmonic distortion 82
transient overvoltages 434
transients
category 1.1.3 420
category 1.2.1 420
trigger data log
147
parameter selection 147
record retrieval 148
results 148
U
UDT files 213
UL/CUL 400
unit reset 185
update rate of metering results 57
upgrading model 229
USB
configure connection 36
USB cable type 33
USB connection
login 38
web page 38
USB device port 13, 33
USB drivers 34
USB host port 13
V
ventilation 18
virtual wiring correction 61
virtual wiring indicator 14
voltage
THD 424
voltage and current unbalance 423
voltage dips 433, 442
Rockwell Automation Publication 1426-UM001G-EN-P - November 2014
461
Index
voltage harmonics 444
voltage input mapping 62
voltage interruptions 443
voltage metering 74
voltage sensing
wiring 21
wiring diagrams 22-28
voltage sensing wiring terminal 14
voltage swells 434, 443
voltage unbalance
RMS values 431
voltage unbalance formula 74
VT transformation ratios 56
W
waveform
capture 91, 411
compression 411
data records 104
distortion 424
file format 414
files 93
header 105
recording 90, 91
recordings 411
retrieving 93
waveform log 102
retrieve records 102
web page logging results 98
wire requirements 20
wire the unit
accessory kit 21
ground 20
requirements 20
terminal block layout 20
wiring corrections
command 61
status 62
wiring diagnostic results 59
wiring diagnostics 57
command word 59
power factor ranges 58
462
Rockwell Automation Publication 1426-UM001G-EN-P - November 2014
Rockwell Automation Support
Rockwell Automation provides technical information on the Web to assist you in using its products.
At http://www.rockwellautomation.com/support you can find technical and application notes, sample code, and links to
software service packs. You can also visit our Support Center at https://rockwellautomation.custhelp.com/ for software
updates, support chats and forums, technical information, FAQs, and to sign up for product notification updates.
In addition, we offer multiple support programs for installation, configuration, and troubleshooting. For more
information, contact your local distributor or Rockwell Automation representative, or visit
http://www.rockwellautomation.com/services/online-phone.
Installation Assistance
If you experience a problem within the first 24 hours of installation, review the information that is contained in this
manual. You can contact Customer Support for initial help in getting your product up and running.
United States or Canada
1.440.646.3434
Outside United States or Canada
Use the Worldwide Locator at http://www.rockwellautomation.com/rockwellautomation/support/overview.page, or contact your local
Rockwell Automation representative.
New Product Satisfaction Return
Rockwell Automation tests all of its products to help ensure that they are fully operational when shipped from the
manufacturing facility. However, if your product is not functioning and needs to be returned, follow these procedures.
United States
Contact your distributor. You must provide a Customer Support case number (call the phone number above to obtain one) to your
distributor to complete the return process.
Outside United States
Please contact your local Rockwell Automation representative for the return procedure.
Documentation Feedback
Your comments will help us serve your documentation needs better. If you have any suggestions on how to improve this
document, complete this form, publication RA-DU002, available at http://www.rockwellautomation.com/literature/.
Rockwell Automation maintains current product environmental information on its website at
http://www.rockwellautomation.com/rockwellautomation/about-us/sustainability-ethics/product-environmental-compliance.page.
Rockwell Otomasyon Ticaret A.Ş., Kar Plaza İş Merkezi E Blok Kat:6 34752 İçerenköy, İstanbul, Tel: +90 (216) 5698400
Publication 1426-UM001G-EN-P - November 2014
Supersedes Publication 1426-UM001F-EN-P - November 2013
Copyright © 2014 Rockwell Automation, Inc. All rights reserved. Printed in the U.S.A.