1
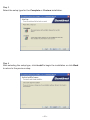
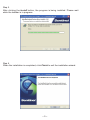
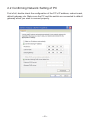
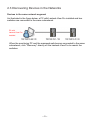
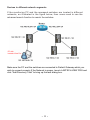
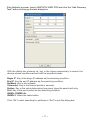
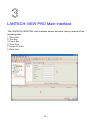
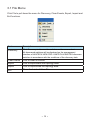
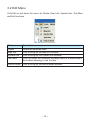
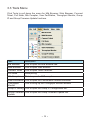
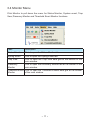
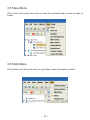
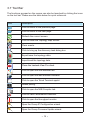
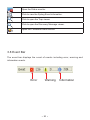
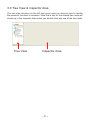
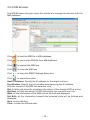
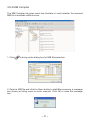
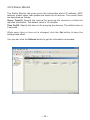
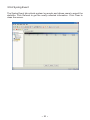
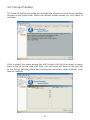
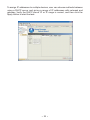
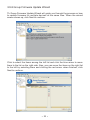
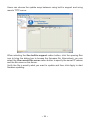
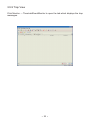
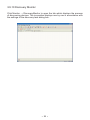
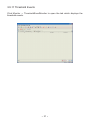
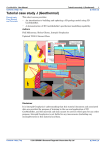
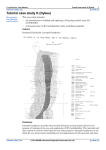
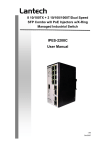
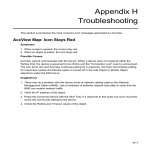
Lantech-View Pro
User's Manual
This page is intentionally left blank.
Contents
1. Getting to Know Your switch .......................................1
1.1 About the Lantech Switch ......................................................... 1
1.2 Installing Java Machine ..............................................................2
1.3 System Requirements ................................................................2
1.4 Preparing to Install LlantechL-view pro ........................................ 3
2. Applying lantech-view pro to Switch Connection ....... 7
2.1 Getting Started with lantech-view pro ...................................... 7
2.2 Confirming Network Setting of PC .............................................8
2.3 Discovering Devices in the Networks .........................................9
3. lantech-view pro Main Interface ...............................13
3.1 File Menu .................................................................................14
3.2 Edit Menu .................................................................................15
3.3 Tools Menu ...............................................................................16
3.4 Monitor Menu ...........................................................................17
3.5 View Menu ...............................................................................18
3.6 Help Menu ................................................................................18
3.7 Tool Bar ....................................................................................19
3.8 Event Bar .................................................................................20
3.9 Tree View & Inspector Area......................................................21
3.9.1 TopoMap .................................................................................. 22
3.9.2 User Management.................................................................... 25
3.9.3 MIB Browser............................................................................. 26
3.9.4 MIB Compiler ........................................................................... 27
3.9.5 Status Monitor .......................................................................... 29
3.9.6 Syslog Event ............................................................................ 30
3.9.7 Group IP Setting ....................................................................... 31
3.9.8 Group Firmware Update Wizard .............................................. 33
3.9.9 Trap View ................................................................................. 35
3.9.10 Discovery Monitor .................................................................. 36
3.9.11 Threshold Events.................................................................... 37
-I-
This page is intentionally left blank.
- II -
Getting to Know Your switch
1.1 About the Lantech Switch
The Lantech Switches can be managed by a powerful utility-LANTECH-VIEW PRO.
With Lantech-View Pro installed, which provides a powerful interface for users to manage
all switches in the network, users can set parameters to multiple switches at the same time.
LANTECH-VIEW PRO is not only a powerful utility for users to configure but also a useful
utility to administrate and monitor the connected switches. When the monitored
switches fail, the failure information will be displayed on the LANTECH-VIEW PRO interface
-1-
1.2 Installing Java Machine
Please make sure you have installed Java Runtime Environment (JRE) on your
computer. If not, you can download JRE Version 6 Update 3 from SUN website:
http://java.sun.com/javase/downloads/index.jsp.
1.3 System Requirements
Operating System:
Microsoft Windows XP, or 2000
Screen Resolution:
1024 x 768, 16-bit color or above
Processor:
Pentium 3/800 MHz, or AMD Athlon 1000, or above
Memory:
512 MB RAM (1 GB or above is recommended)
Hard Disk Space:
200 MB at least
CD/DVD Burning Device:
The CD or DVD recorder (CD-R/RW, DVD+R/RW or DVD–R/RW) is
required to burn VCD/DVD/SVCD/Mini-DVD titles.
-2-
1.4 Preparing to Install Lantech-View Pro
Before using Lantech-View Pro, users need to install the driver for the security key first.
Double click on the Sentinel System Driver Installer icon to start the
installation process.
Step 1
After the execution of Lantech-View Pro.exe, the Lantech-View Pro installation wizard starts.
Step 2
Select the I accept the items in the license agreement radio button and click Next.
-3-
Step 3
Select the setup type for the Complete or Custom installation.
Step 4
After selecting the setup type, click Install to begin the installation or click Back
to return to the previous step.
-4-
Step 5
After clicking the Install button, the program is being installed. Please wait
while the taskbar is in progress.
Step 6
When the installation is completed, click Finish to exit the installation wizard.
-5-
-6-
Applying LANTECH-VIEW PRO to Switch Connection
2.1 Getting Started with LANTECH-VIEW PRO
Select "Start"→ "All Programs" →"LANTECH-VIEW PRO"
to launch LANTECH-VIEW PRO.
-7-
2.2 Confirming Network Setting of PC
First of all, double check the configuration of the PC’s IP address, subnet mask,
default gateway, etc. Make sure the PC and the switch are connected to default
gateway which you wish to connect properly.
-8-
2.3 Discovering Devices in the Networks
Devices in the same network segment
As illustrated in the figure below, a PC with Lantech-View Pro installed and two
switches are connected to the same subnetwork.
PC with
Lantech-View Pro
installed
When the monitoring PC and the managed switches are connected to the same
subnetwork, click "Discovery" directly on the Lantech-View Pro to search the
switches
-9-
Devices in different network segments
If the monitoring PC and the managed switches are located in different
networks, as illustrated in the figure below, then users need to use the
advanced search function to search the switches.
PC with
Lantech-View Pro
Make sure the PC and the switches are connected to Default Gateway which you
wish to connect properly.If the Network is proper, launch LANTECH-VIEW PRO and
click "Add Discovery Task" to bring up the task dialog box.
- 10 -
If the Network is proper, launch LANTECH-VIEW PRO and click the "Add Discovery
Task" button to bring up the task dialog box.
With the dialog box showing up, key in the values respectively to search the
devices whose conditions accord with the specified values.
Begin IP: Key in the begin IP address as the searching condition.
End IP: Key the end IP address as the searching condition.
NetMask: Key in the netmask.
Timeout(s): Key in the timeout period in seconds.
Retries: Key in the value determining how many times the search will retry.
Port: Key in the port number as the searching condition.
SNMPv1/SNMPv2c:
SNMPv3: Select the radio button
Click “OK” to start searching for switches or “Exit” to quit the dialog box.
- 11 -
- 12 -
LANTECH-VIEW PRO Main Interface
The LANTECH-VIEW PRO main interface shown as below mainly consists of the
following parts:
1. Menu Bar
2. Tool Bar
3. Event Bar
4. Tree View
5. Inspector Area
6. Data Grid
- 13 -
3.1 File Menu
Click File to pull down the menu for Discovery, Clear Events, Export, Import and
Exit functions.
Task
Description
Discovery
Click Discovery to discover the switches on the same subnet.
All discovered switches will be displayed on the management
interface of LANTECH-VIEW PRO. LANTECH-VIEW PRO discovers
switches in accordance with the conditions of the discovery task.
Clear Events
Click to clear all events.
Export
Click to export/save the topology data.
Import
Click to import/read the topology data.
Exit
Close the Lantech-View Pro.
- 14 -
3.2 Edit Menu
Click Edit to pull down the menu for Delete, Map Info, Symbol Info, Tool Bars
and Exit functions.
Task
Description
Delete
Delete the selected node.
Map Info
Click to bring up the Map Info window.
System Info
Click to bring up the System Info window.
Tool Bars
Click to extend the submenu allowing users to enable/disable
the buttons showing on the tool bar.
Device Detail
Click to bring up the device detail window.
- 15 -
3.3 Tools Menu
Click Tools to pull down the menu for Mib Browser, Web Browser, Connect
Telnet, Poll Node, Mib Compiler, View PerfStatics, Throughput Monitor, Group
IP and Group Firmware Update functions.
Task
Description
Mib Browser
Click to open the MIB Browser tab.
Web Browser
Click to open Web Browser.
Connect Telnet
Click to open Telnet Terminal.
Poll Node
Node polling.
Mib Compiler
Click to open the MIB compiler.
View PerfStatics Click to open the Performance Statistics window.
Throughput
Monitor
Click to bring up the Throughput Monitor window.
Group IP Setting Click to open the Group IP Configuration tab.
Group Firmware Click to open the Group Firmware Update tab.
Update
- 16 -
3.4 Monitor Menu
Click Monitor to pull down the menu for Status Monitor, System event, Trap
View, Discovery Monitor and Threshold Event Monitor functions.
Task
Description
Status Monitor
Click to open the Status Monitor tab.
Syslog Event
Click to open the Syslog Event tab.
Trap View
Click to open the Trap View data grid at the bottom of the
main window.
Discovery
Monitor
Click to open the Discovery Monitor tab at the bottom of the
main window.
Threshold Event Click to open the Threshold Events data grid at the bottom
Monitor
of the main window.
- 17 -
3.5 View Menu
Click View to pull down the menu to close the particular tab or close all tabs at
a time.
3.6 Help Menu
Click Help to pull down the menu to get help or read information related.
- 18 -
3.7 Tool Bar
The functions grouped on the menus can also be launched by clicking the icons
on the tool bar. Please see the table below for quick reference.
Icon
Description
Click to return to the previous page.
Click to return to the next page.
Refresh the current screen.
Click to show the Topology Map screen.
Clear events.
Click to bring up the discovery task dialog box.
Export/save the topology data.
Import/read the topology data.
Close the Lantech-View Pro client.
Click to open the MIB Browser tab.
Click to open the web browser interface.
Click to open the Telnet Terminal applet.
Nodes polling.
Click to open the MIB Compiler tab.
Click to view Performance Statistics.
Click to open the throughput monitor.
Open the Group IP Configuration wizard.
Open the Group Firmware Update wizard.
- 19 -
Open the Status monitor.
Click to view the Syslog Event information.
Click to open the Trap viewer.
Click to open the Discovery Message viewer.
Open the Threshold Event monitor.
3.8 Event Bar
The event bar displays the count of events including error, warning and
information events.
Error
Warning
- 20 -
Information
3.9 Tree View & Inspector Area
The tree view structure on the left side gives users an obvious view to handle
the powerful functions in advance. Note that a tab for the related tree node will
shows up in the Inspector Area when you double click any one of the tree node.
Tree View
Inspector Area
- 21 -
3.9.1 TopoMap
1. Double click the tree node of TopoMap to open the topomap tab.
2. Click the discovered network segment(s) to view the devices located in the
network. And the topology map will display on the topomap tab.
A. Pop-up Panel
Double click on any of the devices to pop up the window of panel of the clicked
device, which displays the ports layout and status concerning the device.
The pop-up window gives users the powerful interface to manage the device
by selecting the functions on the menu bar. The functions may differ among
models. Please consult user's manuals for web-based management for the
respective models.
- 22 -
B. Pop-up Menu of the Device
Right click on any of the discovered devices to show the pop-up menu.
View Details
Click to bring up a dialog box showing the device details. You can modify
the Timeout, Retries, Port, SNMP version and click the Change I... button to
change the icon for the device.
View Connection
Click to bring up a dialog box showing the connection information.
- 23 -
View PerfStatics
Click to bring up a dialog box showing the performance statistics information.
Throughput Monitor
Click to bring up the dialog box that users can tick checkboxes to select ports
and their frame size. And the click the Monitor button to show the throughput
monitor window.
Click the up/down arrows to increase/decrease the number in seconds to
specify the interval between information collections.
Click
or
to stop/start collecting information.
Remove
Click to delete the device discovered.
Refresh Link
Click to refresh the topology map.
- 24 -
3.9.2 User Management
The User Management tab allows you to add new user accounts, modify and
remove the user accounts.
Add
Click the Add button to bring up the Add New User dialog box. And fill the data
in the fields respectively.
Modify/Remove
Double click the user account to change the data field by field, and click Modify
for account modification. Double click the user account and click Remove to
delete the user account.
- 25 -
3.9.3 MIB Browser
The MIB Browser tab gives users the interface to manage the devices with the
MIB database.
Click
to load the MIB file to MIB database.
Click
to remove the MIB file from MIB database.
Click
to expand the MIB tree.
Click
to close the MIB tree.
Click
to bring the SNMP Settings dialog box.
Click
to export/save data.
Host IP Address: Specify the IP address for the target machine.
Port Number: Specify the port number accompanying the IP address.
With the content of the MIB tree selected, click
Get: to fetch and show the complete information of the selected OID at a time.
Get Next: to fetch and show the OID information one row with one click.
Walk: all the information of the MIBs will be fetched and displayed.
Get Bulk: all the information beneath the selected node will be fetched and
displayed.
Stop: to stop fetching.
Clear: to clear the fetched data.
- 26 -
3.9.4 MIB Compiler
The MIB Compiler tab gives users the interface to verify whether the scanned
MIB file is available without errors.
1. Click
to bring up the dialog box for MIB files selection.
2. Select a MIB file and click the Open button to startAfter scanning, a message
box shows up telling users no error scanned. Click OK to close the message
box.
- 27 -
Click
to load the MIB file for scanning.
Click
to remove the MIB file from MIB database.
Click
to expand the MIB tree.
Click
to close the MIB tree.
Click
to clear the listed contents.
- 28 -
3.9.5 Status Monitor
The Status Monitor tab gives users the information about IP address, MAC
address, model name, last update and status for all devices. The control items
are described as follows:
Query Time(S): Specify the interval for querying the devices to collect the
required information. The default value is 10 seconds.
Time Out(S): Specify the time out for querying the devices. The default value is
5 seconds.
When query time or time out is changed, click the Set button to have the
settings take effect.
You can also click the Refresh button to get the information as needed.
IPES-2208C
- 29 -
3.9.6 Syslog Event
The Syslog Event tab collects system log events and allows users to export the
statistics. Click Refresh to get the newly collected information. Click Clear to
clean the screen.
- 30 -
3.9.7 Group IP Setting
Th Group IP Setting will guide you through the process on how to set multiple
devices at the same time. When the wizard screen shows up, click Next to
continue.
Click to select the items among the left list and click the blue arrow to move
them to the list on the right side. Also, you can move the items on the right list
to the left by selecting them and clicking the red arrow. when finished, click
Next to continue.
IPES-220...
- 31 -
To assign IP addresses to multiple devices, user can choose methods between
using a DHCP server and giving a range of IP addresses with netmask and
gateway. Verify the DHCP server IP or IP range is correct, and then click the
Apply button to start the task.
IPES-220...
- 32 -
3.9.8 Group Firmware Update Wizard
Th Group Firmware Update Wizard will guide you through the process on how
to update firmware for multiple devices at the same time. When the wizard
screen shows up, click Next to continue.
Click to select the items among the left list and click the blue arrow to move
them to the list on the right side. Also, you can move the items on the right list
to the left by selecting them and clicking the red arrow. when finished, click
Next to continue.
IPES-220...
- 33 -
Users can choose the update ways between using built-in support and using
remote TFTP server.
IPES-220...
When selecting the Use built-in support radion button, click the opening files
icon to bring the dialog box to browse the firmware file. Alternatively, you can
select the Use remote tftp server radion button to specify the server IP adress
and the file name on the server.
Verify the file is exactly what you want to update and then click Apply to start
firmware updating.
- 34 -
3.9.9 Trap View
Click Monitor → ThresholdEventMonitor to open the tab which displays the trap
messages.
- 35 -
3.9.10 Discovery Monitor
Click Monitor → DiscoveryMonitor to open the tab which displays the process
of discovering devices. The inromation displays row by row in accordance with
the settings of the discovery task dialog box.
- 36 -
3.9.11 Threshold Events
Click Monitor → ThresholdEventMonitor to open the tab which displays the
threshold events.
- 37 -
This page is intentionally left blank.
- 38 -