1
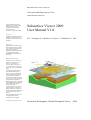
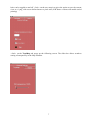
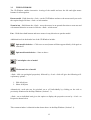
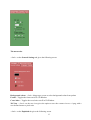
Subsurface Viewer 2009:
User Manual V1.0
Geological Modelling Systems Team
Open Report OR/09/027
BRITISH GEOLOGICAL SURVEY
Geological Modelling Systems Team
OPEN REPORT OR/09/027
The National Grid and other
Ordnance Survey data are used
with the permission of the
Controller of Her Majesty’s
Stationery Office.
Licence No: 100017897/ 2009.
Subsurface Viewer 2009:
User Manual V1.0
Keywords
3 dimensional geological models
Subsurface, Viewer, Geology,
Synthetic cross-sections, slices &
boreholes
R. L. Terrington, S. J. Mathers, H. Kessler, V. Hulland & S. J. Price
Front cover
Snapshots of Subsurface Viewer
model outputs showing synthetic
cross-sections in 3D with water
strikes, sewerage pipes
embedded in till and buildings on
top of bedrock in London.
Exploded Chichester Model as
front piece.
Bibliographical reference
TERRINGTON, R, L, MAHTERS, S.
J. KESSLER, H. HULLAND, V.
PRICE. S. J, SUBSURFACE
VIEWER 2009: USER MANUAL
V1_0.2009. British Geological
Survey Open Report, OR/09/027.
23pp.
Copyright in materials derived
from the British Geological
Survey’s work is owned by the
Natural Environment Research
Council (NERC) and/or the
authority that commissioned the
work. You may not copy or adapt
this publication without first
obtaining permission. Contact the
BGS Intellectual Property Rights
Section, British Geological
Survey, Keyworth,
e-mail [email protected]. You may
quote extracts of a reasonable
length without prior permission,
provided a full acknowledgement
is given of the source of the
extract.
Maps and diagrams in this book
use topography based on
Ordnance Survey mapping.
© NERC 2009. All rights reserved
Keyworth, Nottingham British Geological Survey 2009
BRITISH GEOLOGICAL SURVEY
The full range of our publications is available from BGS shops at
Nottingham, Edinburgh, London and Cardiff (Welsh publications
only) see contact details below or shop online at
www.geologyshop.com
The London Information Office also maintains a reference
collection of BGS publications, including maps, for consultation.
We publish an annual catalogue of our maps and other
publications; this catalogue is available online or from any of the
BGS shops.
The British Geological Survey carries out the geological survey of
Great Britain and Northern Ireland (the latter as an agency
service for the government of Northern Ireland), and of the
surrounding continental shelf, as well as basic research projects.
It also undertakes programmes of technical aid in geology in
developing countries.
The British Geological Survey is a component body of the Natural
Environment Research Council.
British Geological Survey offices
BGS Central Enquiries Desk
Tel 0115 936 3143
email [email protected]
Fax 0115 936 3276
Kingsley Dunham Centre, Keyworth, Nottingham NG12 5GG
Tel 0115 936 3241
Fax 0115 936 3488
email [email protected]
Murchison House, West Mains Road, Edinburgh EH9 3LA
Tel 0131 667 1000
email [email protected]
Fax 0131 668 2683
Natural History Museum, Cromwell Road, London SW7 5BD
Tel 020 7589 4090
Fax 020 7584 8270
Tel 020 7942 5344/45
email [email protected]
Columbus House, Greenmeadow Springs, Tongwynlais,
Cardiff CF15 7NE
Tel 029 2052 1962
Fax 029 2052 1963
Forde House, Park Five Business Centre, Harrier Way,
Sowton EX2 7HU
Tel 01392 445271
Fax 01392 445371
Maclean Building, Crowmarsh Gifford, Wallingford
OX10 8BB
Tel 01491 838800
Fax 01491 692345
Geological Survey of Northern Ireland, Colby House,
Stranmillis Court, Belfast BT9 5BF
Tel 028 9038 8462
Fax 028 9038 8461
www.bgs.ac.uk/gsni/
Parent Body
Natural Environment Research Council, Polaris House,
North Star Avenue, Swindon SN2 1EU
Tel 01793 411500
Fax 01793 411501
www.nerc.ac.uk
Website www.bgs.ac.uk
Shop online at www.geologyshop.com
Foreword
This user manual is the published product by the British Geological Survey (BGS) for the
instruction of using the Subsurface Viewer.
Acknowledgements
This user-manual has been written by Ricky Terrington in collaboration with Steve Mathers and
Holger Kessler. The Subsurface Viewer was developed by INSIGHT Geologische
Softwaresysteme GmbH in 2004/2005 for the visualisation and analysis of digital geoscientific
spatial models. To date over 20 geological models have been packaged in the Subsurface
Viewer. These geological models have been published through the GSI3D Geological Surveying
and Investigation in 3D (GSI3D) software also developed by INSIGHT.
We would also like to thank Camilla Taylor for testing the usability of the Subsurface Viewer
and the improvements made on the manual.
This user-guide is intended for geoscientists and geological enthusiasts in BGS, and elsewhere,
for using the software and methodology to view 3D geological models in the Subsurface Viewer.
i
Contents
Foreword .............................................................................................. i
Acknowledgements.............................................................................. i
Contents............................................................................................... ii
Summary ............................................................................................. ii
1
Introduction ..................................................................................1
2
Installation and use of the Subsurface Viewer ..........................1
2.1 Technical Specification for use of the Subsurface Viewer...2
3
Viewer Interface ...........................................................................3
3.1 The Map Window:................................................................5
3.2 The Synthetic-section Window: .........................................10
3.3 The 3D Window: ................................................................12
3.4 The Synthetic-borehole log window: .................................16
References ..........................................................................................17
Glossary..............................................................................................17
Summary
This user guide describes the tools and methodology for investigating and analysing 3D
geological models using the Subsurface Viewer.
ii
1 Introduction
The Subsurface Viewer is an exciting new package developed by INSIGHT Geologische
Softwaresysteme GmbH for the visualisation and analysis of digital geoscientific spatial models.
This Viewer has been developed following the popularity of INSIGHT’s Geological Surveying
and Investigation in 3D (GSI3D) software tool that BGS uses extensively for the construction of
systematic near surface models (Kessler and Mathers, 2004; Kessler et al, 2005; Kessler et al,
2009).
Geological Models are embedded within the Subsurface Viewer as the means of publication. In
this way the constructed model can be examined and analysed to produce:
•
•
•
•
•
Models displaying the geology or other pre-selected applied themes (e.g.
hydrogeological properties)
Geological maps (at surface and uncovered)
User defined synthetic borehole logs
User defined horizontal slices and vertical sections
Visualisation of the geometry of single and combined units
Please note that the models supplied with the Subsurface Viewer are encrypted and cannot be
altered, nor can users add additional data.
2 Installation and use of the Subsurface Viewer
The model and the necessary Java software and extensions will be delivered to the client on a
CD-ROM or via a secure FTP site.
The executable file will install java software onto the PC if the minimum Java Runtime is
not found, so administrative permissions must be set accordingly.
To load the Subsurface Viewer onto your computer, double click the executable (setup.exe) with
the following icon
The executable will have a prefix of the model contained within the Subsurface Viewer. Follow
the instructions that will include
•
•
•
Licence Agreement
Location of the folder for which the Subsurface Viewer will be installed
ReadMe file which contains important information about the setup and how to get
support
1
Press ‘Finish’ to complete the process and load the Subsurface Viewer on your computer.
Once installed, the “model”.exe will appear as a short cut on your desktop view and will have
the following icon.
The model can also be run from Start>Programs>Subsurface Viewer>“Model Name” and
clicking the “model”.exe if preferred.
To un-install or change installation settings of the Subsurface Viewer, click on the original
setup.exe with the
icon and follow the instructions.
Each unique model is supplied with its own inbuilt version of the Subsurface Viewer and a
licence. This means that the software is not a stand-alone package but is an integral part of each
published model.
2.1
TECHNICAL SPECIFICATION FOR USE OF THE SUBSURFACE VIEWER
The following are the recommended minimum hardware requirements for using the
Subsurface Viewer
•
•
•
•
•
PC running Microsoft Windows 2000/XP or Windows XP 32-bit editions only
Either Intel Pentium family 32/64 bit processor 1GHz+ or AMD Athlon family 32/64 bit
Processor 1GHz+
Minimum of 256Mb of system RAM. Larger models will need 512Mb or more.
A PC desktop graphics card using either Nvidia Geforce, Nvidia Quadro or ATI Radeon
chipsets with minimum of 64Mb video RAM (Other makes of card may be supported
including those in laptops).
120Mb of Hard disk for the Java + Viewer installation. (1 Mb required for Viewer only
installation)
If you have any queries or problems installing or using the Subsurface Viewer please
contact our enquiry team on [email protected] or Tel: 0115 9363143
2
3 Viewer Interface
Note in this manual <Lmb> and <Rmb> are used for left and right mouse button clicks
respectively
The Subsurface Viewer contains 4 windows for the visualisation of the model as shown below.
These are clockwise from top left the Map, 3D, Synthetic borehole log, and Synthetic section
windows
On loading the model is automatically displayed in the Map Window and the 3D Window. The
Synthetic-section Window is empty until a synthetic section is drawn. The Synthetic-borehole
log Window needs to be activated separately by clicking on the borehole icon (shown below) in
the top left corner of the header bar and then resized.
3
Information Tool. <Lmb> provides information about the software owner
The NAME menu indicates what attribute of the model is being displayed. By simply toggling
the up and down
arrows and clicking once on the attribute, a new attribute will be defined
in the Map, 3D and Synthetic-section windows.
The Explorer tab in all windows opens the table of contents whereas the Legend tab reveals the
colour key to the geological units in each of the three main windows.
•
The layers that make up the model can be viewed by double clicking the left mouse
button <Lmb> on
.
Use
to drill down the layers and the
to zip the layers back up.
•
X and Y coordinates can be viewed in the bottom left of the interface when the cursor is
placed in the Map (Note – coordinates only appear when all maps in both the Map
and 3D windows have been turned off). Additionally, a Z (depth in metres) value can
be obtained when a synthetic cross-section has been drawn and the cursor is placed in the
Synthetic-section Window.
Dragging the border or using the arrows shown below can resize all the windows and tab
boxes.
4
3.1
THE MAP WINDOW:
The Map Window enables the view of geological units in 2D, individually or collectively, from
above or below, as coverage’s or contoured bases and tops. The Map Window can also display
topographic raster maps for reference, or maps indicating the uncertainty of the model.
In the Map Window the user can specify the alignment of synthetic cross-sections and the
location of synthetic boreholes.
Tools include:
Zoom to full extent. <Lmb> click once on tool to use.
Zoom in. <Lmb> click on tool. Hold down <Lmb> and stretch over an area of
interesting the Map Window. Release <Lmb> once area has been defined.
Zoom out. Click on tool once with <Lmb> to zoom out. Continue clicking until a
desired view is obtained.
Pan. <Lmb> click on tool. Hold down <Lmb> in Map Window to drag map/model
across screen. Release <Lmb> to reveal new position of map/model.
Information tool. <Lmb> click. Provides information about software owner.
Previous View. <Lmb> click to go back to previous view.
Synthetic borehole. Use <Lmb> on tool. Click once with <Lmb> at location in the Map
Window where the synthetic borehole is required. Go to the Synthetic borehole log
window (Section 3.4) for further details about viewing the synthetic borehole.
Synthetic cross-section. Use <Lmb> on tool. Click once with <Lmb> on Map Window.
A line will appear from where the mouse was clicked on the Map Window. This will
show where the cross-section will be drawn. A double-click on the <Lmb> will complete
the cross-section and red line will appear showing the location. A synthetic section can be
constructed by using as many points as required, providing there are at least two. A
window will also materialize asking for the new cross-section to be named. Once named
the section appears in the Synthetic-section Window. Go to the Synthetic-section
Window (Section 3.2) for further details.
5
Synthetic Horizontal Slice. <Lmb> click will bring up a message box asking the user
for a depth at which the 3D model will be sliced to relative to Ordnance Datum (OD). For
example, if the user specified a depth of 5m, the model in the map window would have
the ground above this height removed, leaving only geological units that occur at this OD
in the map window view. (Note - As the 3D model incorporates ground above and
below sea level, the depth of the slice will be an absolute value, where mean sea level
is taken as 0).
This map, created from taking the horizontal slice, is held in the “maps” drop down menu
under “View” in the “Explorer” tab. To return to the original view un-tick the box for the
slice, as shown below.
The map currently selected (HS-0) refers to a horizontal slice
cut at 0m above mean sea level. (HS-10 and HS--10 refer to
slices 10m above and 10m below the mean sea level,
respectively).
In the side menu bar, under the “Explorer” tab <Lmb> click on “View” to display the geological
units, cross-sections or maps and this will reveal the following self-explanatory options:
Then, having drilled down the options using the + button, <Rmb> click on any individual
geological unit, cross-section or map to reveal two self-explanatory “send to” options plus
Properties – <Lmb> click on Properties to reveal the Object tab discussed below.
<Lmb> on the General Settings tab reveals the screen below. Here the user can define the
background colour from a palette by <Lmb> on the white rectangle. Also the frame and cross6
hairs can be toggled on and off. <Lmb> on the save map icon gives the option to save the current
view as a *.png, with a user defined metre to pixel ratio (N/B future versions will enable scaled
printing)
<Lmb> on the TopoMap tab opens up the following screen. The slider bar allows seamless
setting of transparency in the Map Window.
7
Properties of other maps (not named TopoMap in the “maps” drill down menu) need to be
controlled by <Rmb> on the map and then transparency can be adjusted in the “Object” tab, as
shown below.
8
<Rmb> on a Geological Unit>Properties reveals the Object tab shown right. The name or code
of the selected unit is displayed in bold at the top. Select whether to contour the base or top of
the unit and set the preferred contouring interval in metres. The unit is shown in its predetermined colour when the extent of unit is ticked on. The slider bar immediately below varies
the transparency. The 3D view settings give the option to display the geological units in one or
more ways. These can be floating contours, a triangulated mesh or colour shaded objects. The
bottom slider bar varies the transparency of the 3D colour shaded object.
9
3.2
THE SYNTHETIC-SECTION WINDOW:
Note – The Synthetic-section Window is only active once synthetic cross-sections have been
selected in the Map Window using the synthetic cross-section tool.
The tool icons on the header bar of the Synthetic-section Window are identical to the Map
Window.
There is one additional option, which is to specify the vertical exaggeration by typing the value
in the box shown here:
The vertical exaggeration has to be selected by the user to display each model. Typical values
however are between 5 and 25.
As for the Map Window, the Explorer tab reveals the Table of Contents whilst the Legend tab
displays the units present in the section(s).
<Rmb> click on the General Settings tab reveals the screen below. Here the user can define the
background colour from a palette by <Lmb> on the white rectangle. Also ticking the scale box
creates a scaled frame surrounding the synthetic section.
<Lmb> on the save map icon gives the option to save the current view as a *.png, with a user
defined metre to pixel ratio
10
<Rmb> click on any synthetic section in the table of contents enables the user to set the
properties of the section using the screen below. The name of the section is shown in bold at the
top of the screen. By ticking the labelling box the section can be labelled with the names of the
geological units. The slider bar varies the transparency of the section in the 3D window.
Note: To view multiple synthetic cross-sections at the same
time go to the 3D Window (Section 3.3)
11
3.3
THE 3D WINDOW:
The 3D Window enables interactive viewing of the model and uses the left and right mouse
buttons for all navigation.
Rotate model - Hold down the <Lmb> on the 3D Window and move the mouse until you reach
the required angle. Release <Lmb> to halt rotation.
Zoom in/out – Hold down the <Rmb>, move the mouse in an upward direction to zoom out and
a downward direction to zoom in. Release <Rmb> to halt zoom.
Pan – Hold down both buttons and move mouse in any direction to pan the model.
Additional tools in the header bar of the 3D Window include:
Spin model clockwise – Click once to start (button will then appear black), click again to
switch off.
Spin model anticlockwise – Same as above
Vertical/plan view of model
Horizontal view of model
<Rmb> click (on geological properties) followed by <Lmb> click will give the following selfexplanatory options: –
1. Hide all objects
2. Show all objects
Alternatively, each unit can be switched on or off individually by clicking on the tick as
previously mentioned in the Map Window (Section 3.1).
<Rmb> on an individual unit gives the option to display the properties screen by <Lmb> on
Properties shown below
This content window is identical to that shown above in the Map Window (Section 3.1).
12
The menu tabs
<Lmb> on the General Settings tab gives the following screen
Background colour– <Lmb> brings up a screen to select background colour from palette
Frame – Toggles the frame on/off in 3D Window
Cross-hairs – Toggles the cross hairs on/off in 3D Window
3D-View – <Lmb> on the save icon gives the option to save the current view as a *.png, with a
user defined metre to pixel ratio
<Lmb> on the Exploded tab gives the following screen
13
Exploded view on/off toggles the explosion of model on/off, i.e. the separation of individual
geological units from other geological units.
NS-transposition – use slider bar to explode model in a north/south direction.
EW- transposition – use slider bar to explode model in an east/west direction.
Z- transposition – use slider bar to explode model in a vertical direction.
<Lmb> on the Section tab gives the following screen
14
Note - Hide all geological objects to view vertical slices. Adjusting the transparency of the
topological map also aids visualisation of these slices.
Section in NS-direction– tick on and then move mouse across Map Window screen to view
vertical slices of the model in a north/south direction
Section in EW-direction– tick on and then move mouse across Map Window to view vertical
slices of the model in an east/west direction
<Lmb> on the TopoMap tab to open the following screen
bottom Position top – Sets topographical position relative to model using slide bar.
Transparency – use slide bar to set transparency of topographical map.
<Lmb> on the Stereo effect on/off tab gives the following screen
Stereoeffect on/off – View model in 3D stereo.
color of glasses – sets colours to match colour of 3D glasses.
eye distance – use slider bar to adjust
15
3.4
THE SYNTHETIC-BOREHOLE LOG WINDOW:
Once the synthetic borehole viewer tool has been used on the Map Window,
click on
(shown below).
in the top right hand corner which will open up the borehole viewer screen
The tools in the borehole viewer screen carry the same functionality as the tools in the Map and
Section windows. However, to pan hold down the <Lmb> to drag the borehole stick to the
desired location in the display.
The borehole viewer display also shows:
•
•
•
The depth to the base of each geological unit relative to OD.
The OD and name of the synthetic borehole at top
The name of each of the units modelled is attached to their base.
16
References
Kessler, H. & S.J. Mathers. 2004. Maps to Models. Geoscientist, 14/10, pp. 4-6.
http://www.bgs.ac.uk/science/3Dmodelling/mapstomodels.html
Kessler, H. et al. 2005. 3D geoscience models and their delivery to customers. In: Three
dimensional geologic mapping for groundwater applications, Workshop extended abstracts, Salt
Lake City, Utah, 15 October 2005. Geological Survey of Canada, 2005. p. 39-42.
http://crystal.isgs.uiuc.edu/research/3DWorkshop/2005/pdf-files/kessler2005.pdf
Kessler, H., Mathers, S.J. & H.-G. Sobisch. 2009. The capture and dissemination of integrated
3D geospatial knowledge at the British Geological Survey using GSI3D software and
methodology. Computers & Geosciences, 35, 1311–1321.
http://dx.doi.org/10.1016/j.cageo.2008.04.005
Glossary
Borehole Log
data.
A synthetic borehole drilled in a Z direction through the 3D geological model
Cross-section
model data
A vertical slice defined by a start and end point through the 3D geological
Horizontal Slice A horizontal slice given at a Z depth level through the 3D geological model
data
Synthetic Cross-sections, boreholes or horizontal slices which are constructed using data from
the triangulated surfaces stored in the Subsurface Viewer.
Topomap A map showing topographical features and landmarks of the Earth’s surface.
17