1
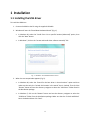
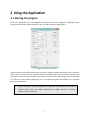
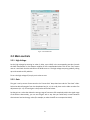
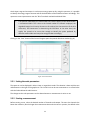
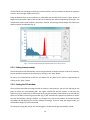
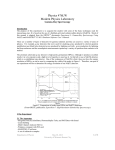
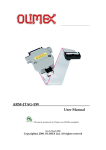
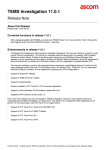
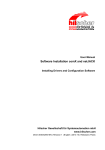
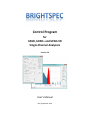
Control Program for bPAD, bPAD+ and bPAD-VR Single-Channel Analyzers Version 2.0 User’s Manual Niel, September 2014 2 Table of Contents 1 2 Installation ............................................................................................................................................ 4 1.1 Installing the USB driver................................................................................................................ 4 1.2 Installing the Application .............................................................................................................. 5 Using the Application ............................................................................................................................ 7 2.1 Starting the program..................................................................................................................... 7 2.2 Main controls ................................................................................................................................ 8 2.2.1 High Voltage .......................................................................................................................... 8 2.2.2 Gain ....................................................................................................................................... 8 2.2.3 Discriminator settings ........................................................................................................... 9 2.2.4 TTL output settings ............................................................................................................... 9 2.2.5 Analog output settings (bPAD-VR only) ................................................................................ 9 2.2.6 CPS value ............................................................................................................................. 10 2.2.7 Device information.............................................................................................................. 10 2.2.8 Saving settings..................................................................................................................... 10 2.3 The Scan window ........................................................................................................................ 10 2.3.1 Setting the scale parameters .............................................................................................. 11 2.3.2 Starting a measurement ..................................................................................................... 11 2.3.3 Ending a measurement ....................................................................................................... 12 2.3.4 Setting the SCA window ...................................................................................................... 12 3 1 Installation 1.1 Installing the USB driver To install the USB driver: 1. Connect the bPAD to the PC using the supplied USB cable. 2. Windows will start the “Found New Hardware Wizard” (Fig. 1): • In Windows XP, select the “Install from a list or specific location (Advanced)” option, then click the “Next” button. • In Windows 7, click on the “Locate and Install driver software manually” link. Fig. 1 – Windows’ “Found New Hardware” wizard 3. When the next step window appears (Fig. 2): • In Windows XP, select the “Search for the best driver in these locations” option and then make sure that only the “Include this location in the search” box is checked. Then click the “Browse” button and use the directory navigator to select the “USB Driver” folder found in the distribution package. • In Windows 7, click on the “Browse” button and use the directory navigator to select the “USB Driver” folder from the distribution package. Make sure that the “Include subfolders” box is checked and then click “Next”. 4 Fig. 2 – Browse to the distribution driver folder 4. Windows will proceed to copy the USB driver. 5. In Windows XP, if the installation asks for the libusb0.dll proceed as before, but this time select the “x86” folder under the “USB Driver”. 6. When the installation is complete, click "Finish" to close the Wizard. 1.2 Installing the Application To install the bPAD+ Control Program application: 1. Go to the bPADCP distribution directory and run the “Setup.exe” program. When the main setup screen appears (Fig. 3), click on the “OK” button. Fig. 3 – bPAD Control Program Setup screen 5 2. In the next window that appears (Fig. 4), click on the computer icon to start the installation. Then follow the instructions on the screen. Fig. 4 – Starting the installation 6 2 Using the Application 2.1 Starting the program To start the application click on the Windows' Start button, then go to “Programs”, “BrightSpec” folder and click on the “bPAD+ Control Program” entry. The main screen will appear (Fig. 5). Fig. 5 – bPAD Control Program main window Attach a detector to the bPAD and connect it to the PC using the supplied USB cable, wait for the green LED to turn on and click on the “Connect” button of the application. Upon successful connection, the status bar will show the serial number of the device and the controls (high voltage, gain, LLD and ULD) will reflect the current device settings (Fig. 6). On the bPAD, the green LED should stay on and flash during communications. Make sure there is only one bPAD device connected to the computer, as the current software version does not support selecting from multiple devices. If necessary, disconnect the unused ones. 7 Fig. 6 – Connected status 2.2 Main controls 2.2.1 High Voltage Set the high voltage by entering its value (in Volts, up to 1500) in the corresponding text box. Consult the PMT manufacturer or the detector supplier for the recommended value. Click on the “Set” button next to it and check that the red LED on the bPAD turns on. The high voltage ramps up gradually, taking up to 10 seconds to fully stabilize. To turn the high voltage off, simply set its value to zero. 2.2.2 Gain The gain is set by means of two controls: the “Coarse Gain” drop-down box and the “Fine Gain” slider. Select the desired base gain from the drop-down box (x1, x2, x4 or x8), then use the slider to make fine adjustments (x1...x2). The total gain is the product of the two values. Set the gain to a value that allows the energy range of interest to fall completely within the signal range of the device. Alternatively, you can set the gain such a way that you could easily convert between discriminator level and energy value (for example, to make the 100% to correspond to 1MeV). 8 Sometimes it may be necessary to change the high voltage of the PMT a few volts above and/or below the manufacturer's recommended value, as it also affects the tube gain. Just be sure not to exceed the PMT limits. 2.2.3 Discriminator settings Use the “LLD” (Lower Level Discriminator) and “ULD” (Upper Level Discriminator) sliders to set the desired energy window. They both range from 0 to 100%, representing the full signal span. The bPAD outputs a TTL pulse for every detector pulse whose amplitude is greater than the LLD setting, but lower than the ULD setting. Click on a slider and use the mouse wheel to make fine adjustments to the corresponding discriminator level. If the “Integral mode” option is checked, the ULD control is defeated and the bPAD will simply output a TTL pulse for every detector pulse that crosses the LLD threshold. 2.2.4 TTL output settings Here the duration of the TTL pulse can be set from the drop-down box, values range from 0.25µs to 20µs in 14 steps. Set the pulse duration to the shortest value that allows reliable operation of the external counter system, as too long a pulse length will have a detrimental effect on the maximum achievable count rate. This function is available only to devices with hardware revision 1.4 and up (produced after July 2014, firmware 2.0.1 and later); the corresponding UI controls will appear disabled if the device does not support the functionality. 2.2.5 Analog output settings (bPAD-VR only) Use the radio buttons to select which signal to output via the additional analog connector: • Select “Amplifier pulse” to output the shaped detector pulse, e.g. when feeding an external Multi-Channel Analyzer • Select “CPS Level” to output a voltage level (0 to 2.5V) proportional to the count rate, e.g. when connected to the recorder of a High-Performance Liquid Chromatography (HPLC) system. 9 When “CPS Level” is selected, the “Range” drop-down box allows setting the sensitivity of the voltage output; the value represents the count rate corresponding to the max scale. Likewise, the “Response time” drop-down box allows selecting the reaction time of the instrument to count rate variations. This function is supported only by bPAD-VR devices; the corresponding UI controls will appear disabled otherwise. Also, bPAD-VR devices with firmware version earlier than 1.2.4 do not support adjusting the response time and have a reduced set of CPS sensitivity ranges (a firmware upgrade for such devices exist). 2.2.6 CPS value The main window also shows the estimated CPS value, which is refreshed continuously while the device is connected. For better accuracy, a counter or rate meter should be connected to the TTL output of the bPAD. 2.2.7 Device information Clicking on the “Device Info” button brings up a window with information about the connected device (Fig. 7). Fig. 7 – Device information dialog 2.2.8 Saving settings Once you have setup the bPAD parameters to match your measurement requirements, you can save them into the device’s permanent memory using the “Save” button. That way they will be automatically restored the next time the power is applied, without having to use a PC again. Otherwise, the changes made to the settings will remain active only while the power is applied to the device and will be lost once the power is removed. 2.3 The Scan window The Control Program includes a pseudo-PHA mode to aid in setting the bPAD parameters, especially the gain and discriminator levels. In this mode, the software slides the single-channel window across the 10 whole input range and constructs in such way an energy spectrum. By using this spectrum, it is possible to identify the energy range of interest and set the boundaries of the SCA discriminator accordingly. This represents a vast improvement over the “blind” methods used with traditional SCAs. The spectrum obtained by this method does not have the quality of one obtained with a conventional MCA. This is due to the limited number of channels employed, the degraded integral non-linearity inherent to this method, the characteristics of the SCA electronics, and inaccuracies in determining the CPS value. In the other hand, the quality has proved to be more than enough to identify the peaks produced by different radionuclides and setup the energy window accordingly. Clicking on the “Scan” button of the Control Program opens the pseudo-PHA Scan window (Fig. 8). Fig. 8 – The Scan window 2.3.1 Setting the scale parameters The spectrum can be displayed in either Linear or Logarithmic mode. The selection is done with the two radio buttons to the right of the graph area. The Y scale limit can be set to automatic or to a fixed value with the listbox below the radio buttons. The changes to the scale parameters can be done whenever a measurement is active or not. 2.3.2 Starting a measurement Before starting a scan, select the desired number of channels and sweeps. The more the channels the better the resolution, but the longer the measurement time and vice versa. In practice, the default value 11 of 128 channels will already give satisfactory results. Similarly, the more sweeps the better the spectrum accuracy, but the longer measurement time. Bring the detector close to your reference or calibration source and then click on the “Start” button to begin the measurement. After a few seconds you should see the spectrum appearing left to right. The measurement time is fixed to about 2 seconds per channel, and running several sweeps will improve the spectrum quality considerably (Fig. 9). Fig. 9 – The Scan window showing the collected spectrum of a Cs-137 source 2.3.3 Ending a measurement The measurement ends automatically once the target number of sweeps has been reached. If necessary, you can end the measurement prematurely by clicking on the “Stop” button. To start a new measurement, make sure you delete first any data from a previous measurement by clicking on the “Clear” button. 2.3.4 Setting the SCA window Once you have identified the energy window of interest in the spectrum, you can click and drag on the graph to create the corresponding ROI. The region created that way will appear in red color (the spectrum in Fig. 9 shows such an ROI around the Cs-137 gamma peak). Simultaneously, the LLD and ULD sliders on the Main Control Program window (Fig. 5) will automatically reposition themselves to reflect the new discriminators settings. Likewise, any changes to the LLD and ULD sliders of the Main window will update the ROI displayed in the Scan window accordingly. If you are using the integral mode, you will be able to drag only the LLD threshold. To change an existing ROI, simply click and drag again; the old one will get automatically erased. 12