1
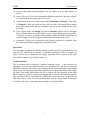
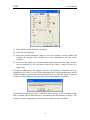
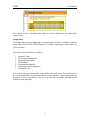
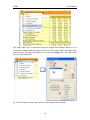
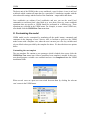
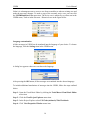
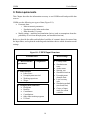
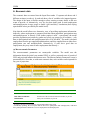
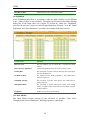
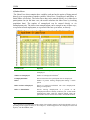
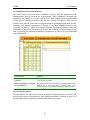
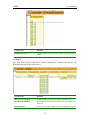
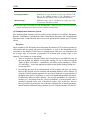
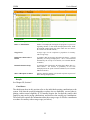
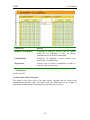
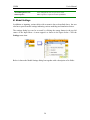
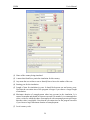
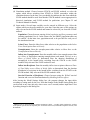
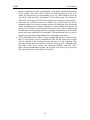
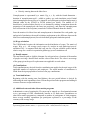
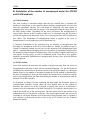
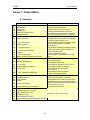
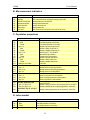
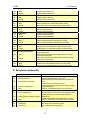
Unemployment Insurance Simulation
Model (UISIM)
USER’S MANUAL
The World Bank
Human Development Network
Social Protection Unit
August, 2004
UISIM
User's Manual
Table of Contents
INTRODUCTION ........................................................................................................................................ 3
I. MODEL OPERATION ............................................................................................................................ 4
A. INSTALLING UISIM ............................................................................................................................... 4
B. STARTING THE MODEL............................................................................................................................ 5
C. SAVING THE MODEL............................................................................................................................... 5
D. MOVING AROUND THE MODEL .............................................................................................................. 5
E. RUNNING THE MODEL ........................................................................................................................... 13
F. MANAGING CASES ................................................................................................................................ 14
G. CUSTOMIZING THE MODEL ................................................................................................................... 15
II. DATA REQUIREMENTS.................................................................................................................... 18
A. ECONOMIC DATA ................................................................................................................................. 19
B. MODEL SETTINGS ................................................................................................................................ 28
C. SOURCES OF DATA ............................................................................................................................... 31
III. DATA ENTRY ..................................................................................................................................... 32
A. MOVING BETWEEN SECTIONS OF DATA ................................................................................................ 32
B. ENTERING AND MODIFYING INPUT VARIABLES ..................................................................................... 33
C. ENTERING BENEFIT AND CONTRIBUTION RULES.................................................................................... 35
D. TIPS ON ENTERING DATA ...................................................................................................................... 38
IV. SIMULATION METHODOLOGY ................................................................................................... 40
A. DESCRIPTION OF MODULES .................................................................................................................. 41
B. CALCULATION OF THE NUMBER OF UNEMPLOYED UNDER THE STOCK AND FLOW METHODS ............ 43
ANNEX 1: OUTPUT TABLES ................................................................................................................. 44
A. SUMMARY............................................................................................................................................ 44
B. MACROECONOMIC INDICATORS ........................................................................................................... 45
C. POPULATION PROJECTIONS ................................................................................................................... 45
D. LABOR MARKET ................................................................................................................................... 45
E. RECIPIENTS AND BENEFITS ................................................................................................................... 46
F. CONTRIBUTORS AND CONTRIBUTIONS .................................................................................................. 47
G. FINANCIAL FLOWS ............................................................................................................................... 48
2
UISIM
User's Manual
Introduction
The Unemployment Insurance Simulation Model (UISIM) was constructed to assist
policymakers in developing countries to make projections of Unemployment Insurance
(UI) benefit costs, contributions, and trust fund balances.
The model is written in Visual Basic in an Excel Spreadsheet platform. It is constructed
to fit the UI system of almost any country, and to be powerful enough to provide accurate
estimates for numerous UI variables. The procedures are user-friendly and the program
can save considerable time compared to building an individual spreadsheet model.
Users are asked to complete the beginning period input data sheets in an Excel
workbook, and the model then performs calculations in Visual Basic to produce output
tables and charts. The model projects the primary variables of interest – the UI system’s
revenues and expenditures. The model’s main advantage is the ability to quickly evaluate
the quantitative impact of a proposed change in one or more of the UI system parameters
or economic variables. For example, the implications of changes in any of the following
parameters and variables on UI system’s revenues and expenditures can be analyzed:
•
•
•
•
•
•
•
initial UI eligibility,
the length of potential eligibility,
benefit level, including minimum and maximum benefits,
indexation of UI benefits,
the strictness of monitoring of continuing UI eligibility,
financing of UI: contribution rate, compliance with paying the contribution,
coverage rate;
economic conditions: GDP growth, inflation, interest rate.
This manual provides the necessary background to understand and operate the model. It
is divided into four chapters. Chapter I describes how to install, operate and run the
model. Chapter II provides guidance about the preparation of data required by the model,
both the economic data and model settings – the modeling and simulation choices the
user must provide. Chapter III explains how data and other information are entered into
the model. Chapter IV summarizes the model’s methodology, that is, explains how the
model calculates its outputs, and Annex 1 provides definitions of variables calculated by
the model.
3
UISIM
User's Manual
I. Model operation
This Chapter describes how to install and run the model, how to move around the model
to input or change modeling parameters as well as to view the results of the model, and
how to generate and manage simulation cases (model runs) representing different
scenarios of user’s interest.
A. Installing UISIM
System Requirements
• Hardware: It is highly recommended for the user to run UISIM on a Pentiumbased computer with at least 128 MB of RAM and a processor speed no lower than
400 MHz.
• Software: Microsoft Office 2000 or Microsoft Office XP is needed to run UISIM.
Users are advised to ensure that the correct version of Excel is being used.
You will be getting a diskette with the file uisim.zip on it. Perform the following steps to
install UISIM on your computer:
Step 1: Create a new folder on your hard disk.
Step 2: Unzip the contents of uisim.zip to this folder. Three files will appear: uisim.xls,
template.xlt and uisim.dll.
Step 3: Move the uisim.dll file to the system32 folder of your Windows installation.
Usually this is the c:\windows\system32 folder. On Windows NT, Windows
2000 and Windows XP systems you may need administrator privileges to
perform this step.
Step 4: Start Excel and click Tools/Add-ins. Then click the Browse button and move to
the folder that contains UISIM files. Select the uisim.xls file and click the OK
button. An additional item named “The world bank UISIM” should appear in the
list of add-ins. Press the OK button.
Step 5: Adjust security level:
(a) If using Excel XP, open the Tools/Options dialog box and click the Security
tab. Click the Macro Security button and check that the Low option is
selected in the Security Level tab. Check also that both Trust all installed
add-ins and templates and Trust access to Visual Basic Project options are
selected under the Trusted Sources tab.
(b) If using Excel 2000, open the Tools/Macro/Security dialog box and choose
Low Security level. Check also that Trust all installed add-ins and
templates option is selected under the Trusted Sources tab.
4
UISIM
User's Manual
Step 6:Make sure that the dot (.) is the decimal separator in your Windows system. If not,
change the decimal separator accordingly in the Control Panel (for example,
under Windows 2000, go to Start/Settings/Control Panel/Regional
Options/Numbers, and change the Decimal Symbol if necessary).
Note that by installing the usim.xls as an add-in, the UISIM model becomes a part of
Excel. That means that when woking with the UISIM model, you can use all
standard Excel functions as well.
B. Starting the model
Once the model is installed, there are several options to start it:
(1) Click on UISIM in the main Excel menu and choose New Case.
When creating new cases or opening existing case workbooks, Excel asks whether to
update the links contained in the workbook. User should click the Don’t Update
button as shown below.
(2) Move to the folder with an existing case workbook and double click on it (when
opening a case workbook, again choose the Don’t Update option when asked whether
to update the links contained in the workbook).
C. Saving the Model
To save changes you made to the model, save the case workbook by applying standard
Excel commands (Save or Save As, from the File menu).
D. Moving Around the Model
The UISIM model comes as a workbook: it contains several parts (called “sheets,”
because they are displayed in an Excel spreadsheet), each of them performing a separate
function. As explained below, the task of simulating the UI system typically requires the
creation of several model cases corresponding to different scenarios, with each of the
cases (scenarios) being recorded a separate workbook.
Each workbook consists of the following five sheets:
1. Title Sheet
2. Input Sheet
5
UISIM
User's Manual
3. Verification Sheet
4. Output Sheet
5. Chart Sheet
A sheet is visually equivalent to a separate Excel page. Except for the Title Sheet, all
others sheets consist of several sub-sheets. After opening a case workbook, the sheet
names appear as tabs at the bottom left of the screen (see below). As in Excel, select the
desired sheet by clicking at its tab. If a sheet tab does not appear on the screen, use the
arrows at the bottom left corner to scroll between the sheet tabs.
Below we describe the function and the content of each sheet.
Title Sheet
The Title sheet contains the basic description and reports the current status of the case.
This is also the starting point to run simulation after any changes have been made to the
input data. Items appearing on the sheet are explained below.
6
UISIM
User's Manual
(1) Name of the country being simulated. You can change it in the Input Sheet (see
below).
(2) Name of the case. It is used to distinguish different scenarios for the same country.
You can change it in the Input Sheet (see below).
(3) Current status of the case, which can be either Calculated or Changed. If the status
is Changed, at least one input has been altered or the Verification Sheet settings
have been changed after the last simulation was run (or the simulation has never
been run).
(4) If the current status is Changed, the button Calculate appears next to the status
field. Click this button to run the model, or rerun it after changing input data. When
“Calculate” is chosen, the name of the month for which the model calculations are
currently being executed will appear in the bottom-left corner of the screen.
(5) Comments – here the user can provide notes about the scenario as a reminder about
the particular modeling assumptions used in this scenario.
Input Sheet
Key data inputs, pertaining to both labor market outcomes and UI system parameters, are
entered to the Input Sheet. It contains 12 individual input pages under 4 categories of
inputs. Because of its complexity and lengthy exposition, the description of the input
sheet and its variables is provided in Chapter II.
Verification Sheet
The Verification Sheet is primarily a problem diagnostic device – it gives the user an
opportunity to review the inputted data in every possible detail, and, by moving to the
Input Sheet, change it if necessary. In contrast to the information presented in the Output
Sheet which is of summary nature and emphasizes the economic meaning of the results,
the Input Verification Sheet allows the user to inspect the data generated in the Input
Sheet variable by variable, in the most disaggregated way and for all simulation periods.
The Verification Sheet is controlled by a dialog box where the users can describe the
table they want to verify. To access the dialog box, click the orange button in the upper
left corner of the sheet. Verification Sheet settings are explained below.
7
UISIM
User's Manual
(1) Select which variable should be calculated.
(2) Select the row dimension.
(3) Select the column dimension. Both for rows and columns, selecting None will
calculate the average of the variable (or its sum, depending on the type of the
variable).
(4) For each of the gender, age, duration and time dimensions select the range of values
you are interested in. You can choose either all the values, a range of values or a
single value.
Clicking the OK button, the program will ask you whether to recalculate the case
immediately (see below). If you click the Yes button, the Verification Sheet table will be
calculated. Otherwise, the results will be presented later. Use the latter option if you need
to make any other changes to the input data before performing the calculations.
The information appearing on the Verification Sheet consists of the description of the
table’s contents and the data themselves, presented in the table format (see below). The
averages (or sums, if appropriate for the selected variable) are also calculated.
8
UISIM
User's Manual
The contents of the Verification Sheet table can also be plotted. See the Chart Sheet
chapter below.
Output Sheet
The Output Sheet presents aggregated or averaged values for the key variables of interest
in the form of Excel tables. The definitions of variables appearing in output tables are
given in Annex 1.
The outputs are presented in seven tables:
1. Summary Table
2. Macroeconomic Indicators
3. Population Projections
4. Labor Market
5. Recipients and Benefits
6. Contributors and Contributions
7. Financial Flows
It is not necessary to go through the output tables in the order listed. To switch between
the seven output tables, use the Output Sheet menu (see below). Since output tables are
generated as Excel spreadsheets, you can copy the data to another spreadsheet and
combine it with other data.
9
UISIM
User's Manual
The output tables can be customized using the Output Sheet Settings dialog box. By
clicking the orange button in the upper left cornet of the Output Sheet, the Output Sheet
menu is shown. The dialog box appears if you click the Setting menu. The items of this
menu are explained below.
(1) Select this option to show the results for each month of the simulation.
10
UISIM
User's Manual
(2) With this option, you can control for which months the results are presented. Use
items (3) to (7) to select the months.
(3) The program will present the results for the month selected here, for each year within
the simulation horizon.
(4) This list shows additional months selected.
(5) Here you can choose additional months.
(6) Click the Add button to add the month selected in (5) to the list presented in (4).
(7) Click the Remove button to remove the selected month from the list presented in (4).
(8) Select this option to show yearly aggregates and averages instead of monthly results.
(9) Choose the units in output tables here. In the left column choose the quantity
(number of persons, economy wide amounts or individual amounts). In the right
column either choose the unit or select the Automatic option. In the later case, the
program itself chooses the units to be presented.
Chart Sheet
To enable quick and easy inspection, more than ten selected graphs presenting simulation
results (and also input data) can be displayed through the Chart Sheet. The menu appears
when user clicks at the orange button in the upper left corner of the Sheet. Items on the
menu are explained below.
(1) There are three types of charts: Output charts, presenting simulation results; –
Verification charts, displaying input data; and Comparison charts, comparing
different scenarios.
(2) The lower part of the Chart Sheet menu depends on the type of chart selected under
(1). Below the charts corresponding to the Output option are shown. Selecting one
of the options generates the corresponding chart in the Chart Sheet.
11
UISIM
User's Manual
(a) Output option. This option allows user to plot various variables from the Output
Sheet, choosing from the menu shown in the figure above.
(b) Verification option. Under this option, a separate dialog box appears controlling the
rows and columns of the Verification Sheet table to be plotted:
12
UISIM
User's Manual
(1) The variable presented in the Verification Sheet is shown here, together with ranges
of some of the variables.
(2) The legend shows the choice of the colors for each displayed variable.
(3) This dialog box allows user to choose which part of the Verification Sheet table
should be plotted.
(4) Select whether rows or columns of the Verification Sheet table should be plotted.
(5) Choose which rows (or columns) of the Verification Sheet table should be plotted.
The red and blue lines may be switched off and on. The rows (or columns) chosen
can be read in the chart legend (2).
(c) Comparison option. This option allows the user to display and compare the results of
different simulation runs – cases, selecting variables of interest from the Chart Sheet
menu (see the “Managing cases“ subsection below for methods to generate different
cases). The following figure shows such a comparison chart. Below the chart there is a
legend showing to which cases various colors and symbols correspond.
E. Running the model
Once the user has supplied the necessary input data and chosen model settings, the model
can be simulated. Similarly, if modifications have been made to the Input Sheet or model
settings, the case has to be recalculated to update the results. To run the model, the user
can either press the Calculate button in the Title Sheet (see above), or move to the Output
Sheet, Chart Sheet, or Verification Sheet directly. In the latter case, the program prompts
the user to perform calculations by the following dialog box:
13
UISIM
User's Manual
By selecting Yes, the case will be recalculated. By selecting No, the results of the latest
run will be shown, or no results if the model has not been run yet.
Before running the simulation, the program checks that there are no errors in the input
data. If errors are found, the program reports them:
(1) Uncheck this option if you don’t want warnings to be reported.
(2) Uncheck this option to remove the errors user has already corrected.
(3) Use this slider to move between errors.
(4) Description of the error. Shows the name of the table containing the error, the wrong
value and a hint of what went wrong.
(5) Click the Show button to open the Input Sheet section containing the error.
(6) Click this button to mark the error as corrected.
F. Managing cases
When simulating a particular UI system, users are typically interested in the comparison
of different scenarios. Often the benchmark scenario (the scenario which simply
extrapolates economic trends and retains the baseline values of UI system) is compared
to scenarios under changed economic conditions and modifications of the UI system.
Therefore, the UISIM model of a country will typically consist of several cases (model
runs) representing different scenarios, with each of the cases (scenarios) being recorded
in a separate case workbook.
14
UISIM
User's Manual
The basic unit of the UISIM is thus a case workbook, a case for short. A case is an Excel
workbook which contains all input data for a particular UI simulation, together with the
selected models settings and the results of the simulation – output tables and charts.
Case workbooks are ordinary Excel workbooks and user can use the usual Excel
commands to read them from a hard disk or to save them. However, some workbook
operations that are specific to UISIM should be performed in a different way. These
operations are collected in the UISIM menu. For example, to create a new UISIM case,
user should click the UISIM/New Case menu item.
G. Customizing the model
UISIM model can be customized by translating all the model menus, commands and
comments in the language of user’s choice. Also, to facilitate a quick use, the UISIM
model comes with a template case, where the user can enter just a few key variables and
rely on default values provided by the template for others. We describe these two options
below.
Customizing the case template
The case template file contains a case prototype which is loaded when a user clicks the
UISIM/New Case menu item. Often a customized case template is needed. In this case,
user should prepare a suitable case workbook and save it as template.xlt into the UISIM
installation folder.
When several cases are open user can switch between them by clicking the relevant
case’s name in the UISIM menu.
15
UISIM
User's Manual
Often it is advantageous not to create a case from scratch but to take an existing case and
make the necessary changes. To make a copy of the currently active case, user can click
the UISIM/Duplicate Case menu item. The active case is marked by a yellow star in the
UISIM menu, such as in the Slovenia – Historical case in the figure below:
Language customization
All the messages in UISIM can be translated into the language of your choice. To choose
the language, click the Settings item in the UISIM menu.
A dialog box appears where one can choose the language.
After pressing the OK button, all the messages are translated into the chosen language.
To include additional translations of messages into the UISIM, follow the steps outlined
below:
Step 1: Open the Visual Basic Editor by clicking the Tools/Macro/Visual Basic Editor
menu item.
Step 2: Click the View/Project Explorer menu item.
Step 3: In the Project Explorer select UIS Code (uisim.xls)/This Workbook.
Step 4: Click View/Properties Window menu item.
16
UISIM
User's Manual
Step 5: Double-click the IsAddin item in the Properties Window (value False should
appear).
Step 6: Return to Excel and select the Text worksheet of the uisim.xls workbook.
Translate the English messages of the second column into your language and put
them into the leftmost empty column. Put the name of the language into the first
row of this column.
Step 7: Return to Visual Basic and double-click the IsAddin item in the Properties
Window (value True should appear).
Step 8: Save the uisim.xls file by clicking the File/Save menu items.
17
UISIM
User's Manual
II. Data requirements
This Chapter describes the information necessary to run UISIM model and possible data
sources.
UISIM uses the following two types of data (Figure II.1):
• Economic data:
o Macroeconomic parameters
o Population and/or labor market data
o Data about the UI system
• Model settings – modeling and simulation choices (such as assumptions about the
probability of exit from unemployment, and simulation horizon)
Below we describe the tables and individual variables of economic data to be entered into
the Input Sheet, and explain the modeling and simulation choices which determine model
settings.
Figure II.1: UISIM Input Structure
Economic data
1. Macroeconomic
parameters
Model settings
2. Population
•
•
•
•
•
•
3. Labor Market
• Labor Force
• Unemployment survival
• Working experience
• Wages
•
4. Unemployment Insurance
• Recipients
• Benefits
• Contributors
• Contributions
• Other labor market programs
• UI Fund
18
•
•
Country name
Simulation run
name
Author name
Starting year
Simulation horizon
Unemployment
duration limit
Local currency
code
Simulation method
(stock and flow)
Choice of input
mode for certain
variables
UISIM
User's Manual
A. Economic data
The economic data are entered into the Input Sheet under 13 separate sub-sheets and 4
different sections (see above). In each sub-sheet a list of variables to be inputted appears.
The design of the input is flexible enough to allow entering as many details as the user
wants to provide, or, alternatively, very few key data items (such as total employment
and unemployment, average wage) to enable “quick and dirty” simulations (thus relying
upon default values provided by the model itself).
Note that the model allows two alternative ways of providing employment information:
indirectly, where employment is computed from data about population, participation rates
and unemployment, or directly. If the indirect option is used – conveniently, the model
provides population projections by gender and yearly age groups for all countries – only
data on participation rate and unemployment have to be provided.1 The model calculates
employment from the pre-supplied population data, and user-supplied data on labor force
participation rate and unemployment. Alternatively, if users have good data on
employment, they may want to enter employment data directly. 2
(a) Macroeconomic Parameters
The macroeconomic parameters are countrywide variables. The model uses the
information about the initial year nominal GDP, as well as projected rates of growth of
GDP, and projected inflation and interest rates. The Macroeconomic Parameters screen is
presented below. Note that, as with most economic data, each variable can be inputted for
any year of projection.
Variable Name
Definition
Base Year GDP
Total Gross Domestic Product, nominal value for the base year
Real GDP Growth Rate
Growth rate of the real Gross Domestic Product, in percent
Inflation Rate
Yearly rate of inflation, in percent
1
Of course, the users can provide their own population data if they wish.
Technically speaking, the user inputs data on labor force participation and unemployment, with labor
force participation data obtained as a sum of employment and unemployment.
2
19
UISIM
Real Interest Rate
User's Manual
Nominal Interest Rate minus Inflation Rate
(b) Population
In the Population sheet there is an option to enter the input variables in two different
ways – either via flow or stock method. The option can be found in the Model Settings
dialog box of the Input sheet (see Chapter II, Section B). Under the “Population”
selection, the user has a choice to enter the population data “Directly” or as the “Initial
Population” and “Flow Parameters” (see below an example of the latter choice).
Variable Name
Definition
Reference Year
The last complete year for which data is available and being
entered.
Reference Year Population
Actual total population at the end of the reference period.
Fertility Rate
The percentage of people at the specified age who are having at
least one child that year.
Sex Ratio at Birth
The number of male births compared to 100 female births,
entered as a percent.
Probability of Dying
The percentage of people in the specific age cohort who are
dying in that year.
Immigration Ratio
The percentage of people entering the country from another
country. A negative value means there is a net outflow of people
to other countries.
Population
Number of persons by gender and age.
(c) Labor Market
The Labor Market section consists of four sub-sheets of variables: Labor Force,
Unemployment Survival Parameters, Working Experience, and Wages.
20
UISIM
User's Manual
(i) Labor Force
The Labor Force sheet contains three variables each one has the option of being entered
directly or as a proportion of another variable: Labor Force, Unemployed, and Inflow vs.
Initial Inflow (see below). The Labor Force data can be entered directly or via labor force
participation rate (in the latter case, the model calculates the labor force by invoking
population data). The number of unemployed can be entered directly or via
unemployment rate. The inflow into unemployment can be entered in one of three ways,
as a percent of total employment, as a percent of the base year inflow, or directly.
Variable Name
Definition
Labor Force
Persons of working age who are either employed or
unemployed.
Number of Unemployed
Number of unemployed individuals.3
Unemployment Rate
Percent of the labor force participants who are unemployed.
Inflow
Number of persons entering unemployment during a certain
period.
Inflow as Share of Employed
Percent of employed individuals who enter unemployment
during a certain period.
Inflow vs. Initial Inflow
Persons entering unemployment as a percent of the
unemployment inflow of January of the base year (or last month
unemployment inflow under the STOCK method, under the
option where the user chooses the switch to the FLOW method).
3
For a discussion of unemployment in the context of developing countries, and for the alternative ways of
providing income support to them, see M. Vodopivec, “Income Support for the Unemployed: Issues and
Options,” The World Bank, 2004.
21
UISIM
User's Manual
(ii) Unemployment Survival Parameters
The second table in the Labor Force worksheet is used to input the parameters of the
unemployment survival function for non-recipients. These parameters determine the
probability (the hazard, as it is often called) of exit from unemployment to employment
or inactivity of unemployed workers who are not receiving UI benefits. There are two
variables to be entered on this sheet: average duration of the unemployment spell for nonrecipients, and duration dependence of hazard of exit from unemployment for nonrecipients (see below). Allowing a separate duration dependence parameter makes the
formulation of the hazard function more flexible, but assuming a constant hazard of exit
(that is, choosing the Duration Dependence parameter to be equal to 0) is recommended
as an initial option.
Variable Name
Definition
Non-
Average duration of the unemployment spell of non-recipients
of UI benefits, in months.
Duration Dependence of Hazard
for Non-Recipients
This parameter determines the shape of the Weibull function and
alters the rate at which individuals exit unemployment. (The
default value is 0; see the technical manual for choosing values.)
Average Duration
recipients
for
(iii) Working Experience
The third sheet in the Labor Force section pertains to working experience for each of the
specified age cohorts. The number of years working experience is entered for ages 15 to
65 and can be entered separately for males and females (see below).
22
UISIM
User's Manual
Variable Name
Definition
Working Experience
Average number of years of work experience for a specified age
cohort.
(iv) Wages
The final sheet in the Labor Force section contains the variables that involve the
distribution of total wages (see below).
Variable Name
Definition
Base year Average Wage
Average monthly gross wage for January of the base year.
Real Wage Growth Rate
The average increase in the real wage of a 20-year old male in a
given year.
Earnings Profile
Average gross earnings relative to a 20-year old male in a given
23
UISIM
User's Manual
year for each age cohort.
Earnings Distribution
Distribution of wages about the average wage. Entered as the
ratio of the standard deviation of the distribution of the
logarithm of wages and the average of the same distribution.
Minimum Wage
Minimum average wage as a proportion of average gross wage
in a given year enter data in percent.
Note: the terms wages and earnings are used interchangeably – both terms refer to total work incomes of
workers which form a base which is used to calculate UI contributions.
(d) Unemployment Insurance System
The Unemployment Insurance section consists of six sub-sheets of variables: Recipients,
Benefits, Contributors, Contributions, Other Labor Market Programs, and Unemployment
Insurance Fund. Under Benefits, there are several options about introducing a UI system
reform.
Recipients
Input variables in the Recipients sheet determine the number of UI benefit recipients for
each gender and age group and period of simulation, as well as the distribution of the
recipients by the duration of their stay in unemployment. Moreover, the information on
the average wage of recipients as proportion of economy-wide average wage is also
inputted. Two features are worth noting:
• There is an option to input the inflow into UI recipiency in two different ways. In
the first method, the number of recipients entering UI can be entered using the
“Share of Base Year Inflow”; alternatively, the inflow can be entered as a “Share
of Total Inflow” (select the appropriate option in the Model Settings dialog box –
see Section II.B).
• In modeling the survival in unemployment of UI recipients, the user can choose
between the Weibull survival function and modeling behavior effects directly. If
using the Weibull function approach, the user has to input the average duration of
unemployment spells of recipients, as well as the duration dependence parameter.
If addressing behavior effects directly, the survival probability of recipients is
modeled as a deviation from the survival probability of non-recipients and is
assumed to depend on the ratio of benefits to wages. Also in this case, the user
has to provide two parameters: the reduction of hazard due to benefit parameter,
and the benefit exhaustion jump parameter (see the Technical manual for details).
24
UISIM
User's Manual
Variable Name
Definition
Share of Unemployment
Percentage of unemployed workers receiving UI benefits.
Inflow vs. Initial Inflow
Number of unemployed entering the UI program as a percent of
beginning entrants (or last month unemployment inflow under
the STOCK method, under the option where the user chooses
the switch to the FLOW method).
Wage Factor
Average wage of to-be recipients as proportion of economywide average wage.
Reduction of hazard due to
Benefit
A parameter that incorporates the behavioral change – reduced
probability of leaving unemployment – due to a moral hazard
introduced by the receipt of UI benefits (see Technical Manual
for details.)
Benefit Exhaustion Jump
A parameter that incorporates the behavioral change due to a
moral hazard – the increase of probability of exit from
unemployment at the point of benefit exhaustion (see Technical
Manual for details.)
Share of Recipients in Inflow
Option to input the number of UI benefit recipients as percent of
those entering unemployment.
Benefits
See Chapter III, Section C.
Contributors
The third input sheet in this section refers to the individuals paying contributions to the
system. Note that the model distinguishes workers who are nominally covered (that is,
gaining credits toward eligibility of UI benefits) despite the fact that they and/or their
employers may not be paying contributions, and workers who actually pay contributions.
The model also requires the information about the average wage of effective contributors
as a share of economy-wide average wage (see below).
25
UISIM
User's Manual
Variable Name
Definition
Nominal Coverage Rate
Percentage of employed workers who are earning
credits for UI (regardless if they are paying
contributions or not) in total employment.
Collection Rate
Percentage of nominally covered workers who
actually pay UI contributions.
Wage Factor
Average wage of effective contributors as share of
economy-wide average wage.
Contributions
See Section III.C.
(v) Other Labor Market Programs
The inputs in this sheet refer to any labor market programs that are funded from
unemployment insurance fund. The model needs the information on the number of
participants and the amount of expenditures per participant (see below).
26
UISIM
User's Manual
+
Variable Name
Definition
Participants
Percentage of unemployed workers who participate in
other labor market programs funded by the UI fund.
Expenditures per
Participant
Average expenditure per participant as a percent of
the average wage.
(vi) Unemployment Insurance Fund
The model requires data on initial reserves of the UI fund, non-contributory sources of
revenues (unconditional budget transfers, if there are any, other income) as well as
expenditures on non-benefits (administrative costs, asset management costs, other
expenses). Each of these can be entered either in local currency or as a percentage of
GDP, total contributions, total benefits or assets of the UI fund (see below).
Variable Name
Definition
Initial Reserves
UI trust fund reserves at the beginning of the base year (in local
currency).
Unconditional Budget Transfers
Amount of unconditional budget transfers to the UI trust fund as
a percent of GDP.
Other Income
Other income received by the UI trust fund as a percent of total
contributions.
Administrative Costs
Administrative costs as a percent of total contributions.
27
UISIM
User's Manual
Asset Management Costs
Asset management costs as a percent of assets.
Other Expenses
Other expenses as a percent of total expenditures.
B. Model Settings
In addition to inputting various tables with economic data as described above, the user
also has to provide model settings indicating various modeling and simulation choices.
The settings dialog box can be accessed by clicking the orange button in the top left
corner of the Input Sheet. A menu appears as shown in the figure below. Click the
Settings menu item:
Below is shown the Model Settings dialog box together with a description of its fields:
28
UISIM
User's Manual
(1) Name of the country being simulated.
(2) A name that identifies a particular simulation for this country.
(3) Any name the user wishes to use to identify him or her as the author of the case.
(4) Starting year for the simulation.
(5) Length of time for simulation in years. It should be between one and twenty years.
Note that the execution time of the program is longer if you choose a longer length
of simulation.
(6) Maximum duration of unemployment taken into account in the simulation. It is
entered in months and should be between one and 120 months. It is recommended to
select a value for which the share of unemployed with an unemployment spell longer
than that value is negligible. Note that the execution time for the program increases
if you choose a larger maximum duration of unemployment.
(7) Local currency code.
29
UISIM
User's Manual
(8) Simulation method. Choose between STOCK and FLOW methods, or select the
option which allows switching from STOCK to FLOW somewhere within the
simulation horizon. In the later case you should also indicate the date from which the
FLOW method should be used. Note that the STOCK method is more appropriate for
historical simulations, and FLOW method for predictions (see Chapter IV and
Technical Manual for details).
(9) Input modes. Several input variables can be entered in different ways. Select the
options which are the most suitable for your data. Note that some of the options are
only relevant for the FLOW method and cannot be selected if you chose the STOCK
method.
Population: Choose between entering Initial population and flow parameters and
entering population Directly. In the former case, the PROST population tables can
be entered. 4 In the latter case, population needs to be provided for each year of
the simulation horizon.
Labor Force: Enter the labor force either relative to the population as the Labor
Force Participation Rate or Directly.
Unemployment: Enter the unemployment either relative to labor force as the
Unemployment Rate or Directly.
Inflow into Unemployment: Enter the monthly inflow into unemployment either
as a Share of Employment entering unemployment each month, Directly or as a
Share of Initial Inflow as determined from the duration distribution of
unemployed in the month before switching from the STOCK to the FLOW
method. Only relevant if the FLOW method is used.
Inflow into Recipients: Enter the monthly inflow into recipients either as a Share
of Total Inflow or as a Share of Initial Inflow as determined from the duration
distribution of recipients in the month before switching from the STOCK to the
FLOW method. Only relevant if the FLOW method is used.
Survival Function of Recipients: Choose between using the Weibull survival
function and a survival function obtained by Modeling behavior effects.
After leaving the Model Settings dialog box, the program changes the input tables
according to setting made by the user. Note that changes in the Model Setting dialog box
can be made at any time (not only when a new case is created) and no input data is lost
by making changes to this dialog box.
4
PROST refers to “Pension Reform Options Simulation Toolkit” – a model which simulates the working
of the pension systems also developed by the Social Protection Team, Human Development Network, The
World Bank.
30
UISIM
User's Manual
C. Sources of data
To prepare the data required for running the UISIM model, two main types of sources are
recommended: labor market surveys and administrative records. Both sources typically
exist in all countries.
Labor market surveys (or perhaps living standard measurement surveys) are a good
source of providing labor market data about employment, unemployment, and wages.
Note that employment data should preferably include both formal and informal sector
workers (although only workers covered by the UI system are taken into account in the
sections of the model pertaining to the UI system).
Other key data source are records of government agencies administrating the UI (or other
social insurance) system, such as National Employment Office and National Pension
Fund. These agencies can provide data about the participants in the UI system – the
number, structure and wages of workers covered by (and/or complying with) the system,
as well as the number and structure of the recipients of unemployment benefits.
Alternatively, National Pension Fund can provide data about the contributors to the social
security scheme, the data which can be fruitfully used for the likely contributors of the UI
system. National Employment Office can also provide information about the parameters
and rules of the UI system.
31
UISIM
User's Manual
III. Data entry
Once the data sources are accessed and data are prepared, they need to be entered into the
model. This section explains how this is done. We describe how the user can:
• Move between sections of data
• Enter and modify input variables
• Enter benefit and contribution rules
We also provide some tips for entering data.
A. Moving between sections of data
As explained above, input tables are grouped into several sections. User can switch
between the sections using the menu accessible through the orange button in the top left
corner of the worksheet. The name of the current section is written in the orange strip at
the top of the worksheet:
Each section contains several input tables for separate variables. In the top row of each
table there is the title of the table and the orange button to access the table’s menu.
Sometimes cells have a red triangle in the upper right hand corner, indicating a comment.
The comment appears when the mouse cursor is placed over a cell that contains a
comment:
32
UISIM
User's Manual
B. Entering and modifying input variables
The input table’s menu has several options. One of them, located to the left of the title of
the variable, is a button that can be used to alter the format of the variable, or the amount
of information to be inputted. Clicking on this button allows the user to choose between
Edit, Fit, and Interpolate options. These options are described below.
(a) Edit option. As an example, we show how this option is used to enter separate data
for men and women, when only aggregated data was entered previously:
(1) Select Edit by clicking on the button in the cell with the name of the variable which
data you want to modify.
(2) In the pop-out menu, check the window “Gander Dependence” and click the Apply
button to apply the change. If you remove the gender dependence of input data, you
will be asked to confirm the choice (note that some data will be lost in this
operation).
(2) Select this option if you want to enter age specific data. If so, select the age interval
for which data is available. If this interval does not start with zero and finishes with
the age of 99, two additional lines will be added to the table, one for ages below the
33
UISIM
User's Manual
minimum age and one for ages above the maximum age. Click Apply button to
confirm the changes made.
(3) A list of dates for which you want to enter data. For instructions how to change this
list see items (4) – (8) below.
(4) Select a date here.
(5) This option determines how the data for dates missing in the input table are obtained.
If you choose the Keep Constant option, the model keeps the data entered for a
specific date constant for subsequent months until new data is available in the input
table. Use this option if you know that the variable changed abruptly. Otherwise,
leave this option unchecked and the program will linearly interpolate the missing
data between the two points.
(6) Add a column to input table, corresponding to the date chosen in item (4). The
program fills the column added with values obtained by linear interpolation of data
that already exists in the table.
(7) Change the date selected in list (3) to the date chosen in item (4).
(8) Remove the column corresponding to the date selected in list (3). Note that at least
one date must be present.
Not all of the options listed above are relevant to each of the input tables. Such options
are disabled in the dialog box.
(b) Fit and Interpolate options. The menu for modifying input of variables has two
additional options.
• Use the Fit option to adjust the column width so that the data entered are
completely visable. This has to be done if the columns of the table are set too
narrowly for the data you entered.
• Use the Interpolate option to interpolate data outside the inputted range. This is
useful if data are not available for the whole variable range (for example, for each
yearly age interval). In this case you can fill in the values that are available, select
a range of ages, and click the Interpolate option. The program will fill in the
missing values using linear interpolation:
34
UISIM
User's Manual
C. Entering benefit and contribution rules
The method of entering benefit and contribution rules is different from the method of
entering other variables. Both the Benefits and the Contributions sections consist of three
sections: the rules before reform, the reform date, and the rules after the reform. This is
how these sections are filled:
35
UISIM
User's Manual
(1) Click this button to enter the dialog box which allows you to enter or change benefit
and contribution rules before the reform.
(2) Click this button to change the reform date.
(3) Click this button to enter the dialog box allowing you to change benefit and
contribution rules after reform.
(4) The description of a benefit and contribution rules consists of a title, criteria for
selecting persons to whom the rule applies, variables determining the benefit level,
and indexation rules. The rules are shown so that the first rule has the highest
priority.
(5) Reform date is shown here.
The benefit and contribution rules dialog box is described below:
(1) Benefit or contribution rules are listed here. The uppermost rule has the highest
priority.
(2) Adding a new rule.
(3) Increasing the priority of the rule selected in list (1).
(4) Decreasing the priority of the rule selected in list (1).
(5) Removing the rule selected in list (1).
(6) Changing the name of the rule.
36
UISIM
User's Manual
(7) Entering or changing the parameters of the selected rule. Detailed description of
each of the four tabs follows.
Criteria:
(1) Check this box if the rule applies to only one of the genders. Check one of the other
boxes if rule applies to a specific age, experience or duration groups.
(2) Select to which gender the rule applies.
(3) Select the age (experience, duration) group to which the rule applies.
(4) Use this field to combine the criterion (3) with another criterion (5), using the logical
and or the logical or operation.
(5) As in (3). Not available if Ignore is selected in (4).
Benefit:
(1) Check this box if UI benefit is flat-rate (equal amount is paid to all recipients).
(2) Check this box if UI benefit is variable (for example, the UI level depends on the
individual’s wage level in the previous job).
(3) Select one of the possible input modes of a flat-rate benefit.
(4) Enter the relevant numerical data.
37
UISIM
User's Manual
Constraints:
(1) Check this box if UI system rules stipulate a minimum level of the UI benefit.
(2) Check this box if UI system rules stipulate a maximum level of the UI benefit.
(3) Describe the minimum level of the UI benefit here.
(4) Describe the maximum level of the UI benefit here.
Indexation:
Use this tab to describe the indexation rules. Select the variable(s) to which the
indexation is bases by clicking one or more of the check boxes on the left. Then enter the
indexation rate(s) on the right.
D. Tips on entering data
•
If, for a particular variable, data is not available for each yearly cohort,
interpolation option of the Input Sheet provides a convenient way to fill the
missing cells. For example, if the data for the number of unemployed is available
only for 5-year cohorts, user should divide the numbers by five to get the average
38
UISIM
•
•
User's Manual
number of unemployed in the corresponding 1-year cohorts and input this number
for the middle year of the cohort (if there are 5000 unemployed in the 20-24
cohort, put 1000 in the cell corresponding to age 22). When finished, select the
cells of the table and click ”Interpolate” in the table’s menu (see Chapter II,
Section B). The program will fill in the missing values using linear interpolation.
Often data for a particular table are available only for the initial year of the
simulation and the user needs to impute the data for subsequent years by making
certain assumptions (for example, assuming a certain monthly growth rate). In
such cases it is useful to copy the initial year data to a new Excel workbook and
to obtain data for subsequent periods by performing transformations on the initial
period data using standard Excel commands. The transformed data can also be
copied to the input table using standard Excel commands (copy/paste).
If the transformation to be made is just to multiply the data by a constant factor,
there is also an easier way to accomplish the task. Put the factor into an empty
cell (for example in the Comment section) and copy it to the clipboard. Then
select the relevant part of the table and click the “Paste Special” command in the
Edit menu. Select “Paste Values” and “Operation Multiply” and click “OK”.
Other simple transformations of data can be made in the same way by selection
other operations in the “Paste Special” dialog box.
39
UISIM
User's Manual
IV. Simulation methodology
The costs of providing UI benefits in any country are determined by two considerations –
legislative and economic. First, these costs are affected by the statutory provisions of the
country’s law relating to the level of benefits, the duration of benefits, eligibility
requirements, disqualifications, and a number of other provisions. The second factor
which has a direct and immediate effect on benefit costs are the economic conditions of
the country as reflected by such indicators as the magnitude of unemployment, the wage
level, interest rates, seasonal patterns, industrial structure, and size of the formal sector.
The UISIM model thus takes into account economic variables as well as the legislated
statue variables, and calculates the projected costs, revenues, and reserves of the
country’s UI program.
Total UI benefit expenditures depends on three factors: the number of people receiving a
benefit check, the duration in time of receipt, and the amount they receive per check. In
determining the number of UI beneficiaries who receive benefits every month, the model
distinguishes a stock and flow method. The stock method estimates this number directly
as a fixed number of persons at each point in time, without considering the duration of
their in unemployment spells. The flow method relies on assumptions about the duration
of unemployment of UI benefit recipients to determine the number of UI beneficiaries
(below STOCK and FLOF methods are explained more in detail).
Two time-related characteristics of the UISIM model are worth mentioning. First, UISIM
is a monthly model, that is, it uses a month as a period to which calculations are
performed. This practice is adopted because many UI laws are stipulated on a monthly
basis or have inter-year triggers. When a country has a benefit period that is less than a
month, or a trigger that is weekly, an interpolation will have to be done by the user.
Second, the maximum time horizon for the simulation is twenty years. This is seen as
sufficient to go through any economic cycle, and long enough for one generation to reach
an age of eligibility for UI.
Below is a general description of the formulations and computational relationships
programmed in the UISIM (the Technical Manual contains the precise equations used in
the programming code of the model.)
40
UISIM
User's Manual
A. Description of modules
UISIM Structure
Total Population
Total Labor Force
Employment
Stock Method
Flow Method
Unemployment
Unemployment
Non-UI Recipients
Total Wages
UI Recipients
UI Recipients
Benefit Criteria
Total UI Benefits
(a) Labor force, employment and unemployment
Labor force in the model is represented by a labor force projection matrix LF(g, a, t),
where g representing gender (females, males), a – age (0 to 99), and t – month (from base
to end year). It is generated in two alternatives ways:
• Using population as a starting point.5 Together with labor force participation data,
population data allows determination of the labor force.
5
A projected population matrix is obtained from the base input data and is determined as a function of the
fertility rate, death rate, infant sex ratio, and immigration rate. The population is divided into cohorts of
41
UISIM
•
User's Manual
Directly entering data on the labor force.
Unemployment is represented by a matrix U(g, a, t, d), with the fourth dimension –
duration of unemployment spell – added to gender, age, and simulation period. Initial
period unemployment must always be inputted, and subsequent period unemployment is
obtained either by the STOCK or FLOW method (see below). The number of UI
beneficiaries is entered either directly or it is obtained by making assumptions about the
proportion of the unemployed who enter into recipiency, and about the unemployment
survival function of the recipients (consult the Technical Manual about the details).
Once the matrices for labor force and unemployment is determined for each gender, age
and period of simulation, the model calculates employment as the difference between the
labor force and unemployment (for each individual group and simulation period).
(b) Wage calculation
The UISIM model requires the information on the distribution of wages. The matrix of
wages, W(g, a, t) – the average yearly wages of a worker in each gender/age/year-ofsimulation cell – is computed from the wage rate for a 20-year old male worker and the
relative wage for a worker in a particular gender/age/year-of-simulation cell.
(c) Benefit amount
The total benefits paid to eligible claimants for each period are a function of the number
of people receiving a benefit check and the value of that check. The value is an average
of the group given the specific replacement rate applicable to each cohort.
(d) Contributions
Total contributions are derived from the contribution rate applied to the total wages of the
applicable number of employers and employees. The actual number of contributors is
found from the input proportion of workers who pay contributions.
(e) Trust fund balance
Beginning with the starting trust fund balance, the next period balance is derived by
subtracting the total expenditures from UI benefits paid and other programs and adding in
revenues from tax receipts and interest.
(f) Additional costs and other labor market programs
Administrative costs of running the UI system can be entered as a fixed nominal amount
or as a percentage of GDP, contributions, benefits or UI fund assets. Expenditures on
other labor market programs are computed as number of participants of such programs,
times average monthly expenditure per participant expressed as a percentage of the
economy-wide average wage.
gender and age for each month of the simulation. The output is a population projection matrix P(g, a, t), g
representing gender (females, males), a – age (0 to 99), and t – month (from base to end year).
42
UISIM
User's Manual
B. Calculation of the number of unemployed under the STOCK
and FLOW methods
(a) STOCK method
The stock method is somewhat simpler than the flow method since it estimates the
number of unemployed at each period without invoking unemployment survival rates
from the exponential function. For each month of simulation, the total number of
unemployed in each gender and age group is first determined using the input data from
the labor market matrix. Depending on the user's preferences the unemployment is
entered either directly in the Unemployed table or it is calculated using the Population
section data together with data in the Labor Force Participation Rate and Unemployment
Rate tables. The distribution of unemployment matrix is applied to the stock of
unemployment, for each gender/age/year-of-simulation cell.
A frequency distribution of the unemployed by the duration of unemployment (the
percentage of unemployed in the first, second, third, etc. month), by gender and age, is
created by assuming constant survival rate over the duration of the unemployment spell
(that is, assuming that the unemployment survival function is exponential), and based on
the inputted average duration of unemployment. This procedure is applied separately for
each gender and age group, as well as simulation period. Note that it may produce
internally inconsistent distributions of unemployment, because flows between different
cells are ignored.
(b) FLOW method
In the flow method, the derivation for number of people surviving from one period of
unemployment to the next is done with an exponential function. For the first month of
simulation, the calculations are identical to those of the STOCK method. For subsequent
months, however, the number of unemployed under the FLOW method is determined by
the stock of unemployed in the previous month, the assumed survival function, and the
inflow into unemployment (the latter determining the number of unemployment with the
duration of less than a month).
As mentioned in Chapter II when explaining the input under the Recipients option of
Unemployment Insurance System, under the flow method there are two options to
determine the survival rate of the UI benefit recipients. One option is to determine a
separate survival (exponential or Weibull) function for UI recipients, and the other is to
modify the hazard rate of the non-recipients. The first option calls for the creation of an
independent survival function for recipients. The second option models the survival of
recipients as a deviation from the survival function of non-recipients, that is, it models it
as a reduction in the hazard rate due to the receipt of UI benefits (see the Technical
Manual for details).
43
UISIM
User's Manual
Annex 1: Output tables
A. Summary
A1
A2
A3
A4
A5
A6
Variable name
Population
Adult Population
Employment
Unemployment
Labor Force Participation Rate
Unemployment Rate
A7
Nominal Contributors
A8
A9
As % of Employment
Effective Contributors
A10
As % of Employment
A11
As % of Nominal Contributors
A12
A13
A14
A15
Recipients
As % of Unemployment
Number of Effective Contributors per Recipient
GDP
A16
Wage Bill of all Employees
A17
A18
As % of GDP
Wage Bill of Effective Contributors
A19
As % of GDP
A20
As % of Wage Bill of all Employees
A21
A22
A23
A24
Total Revenue
Contribution Revenue
Total Expenditure
Benefits
A25
Current Account Balance
A26
A27
A28
A29
A30
A31
A32
Unemployment Insurance Fund Reserve
Total Revenue as % of GDP
Contribution Revenue as % of GDP
Total Expenditure as % of GDP
Benefits as % of GDP
Current Balance as % of GDP
Unemployment Insurance Fund Reserve as % of GDP
44
Definition
Total population of the country.
Population of persons older than 15.
Number of employed workers in the country.
Number of unemployed workers in the country.
Share of labor force in adult population: (A3+A4)/A2.
Share of unemployment in labor force: A4/(A3+A4).
Number of employed workers who earn credits
for unemployment insurance contributions regardless
of whether they pay contributions or not.
Share of nominal contributors in employment: A7/A3.
Number of employed workers who actually
pay contributions.
Share of effective contributors in employment: A9/A3.
Collection rate (share of effective contributors in
nominal contributors): A9/A7.
Number of recipients of UI benefits.
Share of recipients in total unemployment: A12/A4.
A9/A12.
Gross domestic product of the country.
Sum of wages earned by
all the employees of the country.
Share of wages of all employees in GDP: A16/A15.
Sum of wages of all effective contributors.
Share of wages of effective contributors
in GDP: A18/A15.
Share of wages of effective contributors
in wages of all employees: A18/A16.
Total revenue of the UI fund in the current month.
Revenue of the UI fund due to contributions.
Total expenditure of the UI fund in the current month.
Expenditure of UI fund incurred by benefit payments.
Difference between the revenues and the expenditures
in the current month: A21-A23.
Current reserve of the UI fund.
Share of A21 – A26 in country’s GDP.
UISIM
User's Manual
B. Macroeconomic indicators
B1
B2
B3
B4
B5
B6
B7
Variable name
Nominal GDP
Real GDP
Real GDP Growth Rate
Nominal Interest Rate
Real Interest Rate
Inflation Rate
Price Index
Definition
Gross domestic product in the current month.
GDP in the current month, in base year January prices: B1/B7.
Monthly growth rate of the real GDP.
Monthly nominal interest rate.
Monthly real interest rate.
Monthly inflation rate.
Ratio of the current month prices to base year January prices.
C. Population projections
C1
C2
C3
C4
C5
C6
C7
C8
C9
C10
C11
C12
C13
C14
C15
C16
C17
C18
C19
C20
C21
Variable name
Total Population
Male
Female
Age < 15
Male
Female
Age 15 - 64
Male
Female
Age > 64
Male
Female
Males per 100 Females
Growth Rate
Age < 15
Age 15 - 64
Age > 64
Share
Age < 15
Age 15 - 64
Age > 64
C22
Population Dependency Rate
C23
C24
Age < 15 / Age 15 - 64
Age > 64 / Age 15 - 64
Support Ratio: Age 15 - 64 / Age >
64
C25
Definition
Total population of the country.
Total male population of the country.
Total female population of the country.
Number of persons younger than 15.
Number of males younger than 15.
Number of females younger then 15.
Working age (15 – 64) population.
Male working age population.
Female working age population.
Number of persons older than 64.
Number of males older than 64.
Number of females older than 64.
100*C2/C3.
Monthly growth rate of population.
Monthly growth rate of young population.
Monthly growth rate of working age population.
Monthly growth rate of old population.
Share of young persons in total population.
Share of working age persons in total population.
Share of old persons in total population.
Number of young and old persons per 100 working age persons:
100*(C4+C10)/C7.
Number of young persons per 100 working age persons: 100*C4/C7.
Number of old persons per 100 working age persons: 100*C10/C7.
Number of working age persons per 100 old persons: 100*C7/C10.
D. Labor market
D1
D2
D3
D4
Variable name
Population
Male
Female
Adult Population
Definition
Total population of the country.
Total male population of the country.
Total female population of the country.
Number of persons older than 15.
45
UISIM
User's Manual
D5
D6
D7
D8
D9
D10
D11
D12
D13
D14
D15
D16
D17
D18
D19
D20
D21
D22
D23
D24
Male
Female
Labor Force
Male
Female
Labor Force Participation Rate
Male
Female
Employment
Male
Female
Unemployment
Male
Female
Unemployment Rate
Male
Female
Average Duration (in Months)
Male
Female
D25
Long Term Unemployment
D26
Male
D27
Female
D28
D29
D30
Inflow Into Unemployment
Male
Female
Number of males older than 15.
Number of females older than 15.
Sum of all employed and unemployed workers of the country.
Number of males in labor force.
Number of females in labor force.
Share of labor force in adult population: D7/D4.
Share of male labor force in male adult population: D8/D5.
Share of female labor force in female adult population: D9/D6.
Number of employed workers.
Number of employed males.
Number of employed females.
Number of unemployed workers.
Number of unemployed males.
Number of unemployed females.
Share of unemployed workers in total labor force: D16/D7.
Share of unemployed males in male labor force: D17/D8.
Share of unemployed females in female labor force: D18/D9.
Average duration of an unemployment spell in months.
Average duration of an unemployment spell in months for males.
Average duration of an unemployment spell in months for females.
Share of workers being unemployed for more than 12 months
in total unemployment.
Share of male workers being unemployed for more than 12 months
in total male unemployment.
Share of female workers being unemployed for more than 12 months
in total female unemployment.
Number of new unemployed workers in the current month.
Number of new male unemployed workers in the current month.
Number of new female unemployed workers in the current month.
E. Recipients and benefits
E1
E2
Variable name
Unemployment
Unemployment Rate
E3
Average Duration (in Months)
E4
Long Term Unemployment
E5
E6
E7
E8
E9
E10
E11
E12
Inflow
Recipients
As % of Unemployment
Average Duration of Receipt (in Months)
Inflow
Benefits
Total Benefits
As % of GDP
Definition
Number of unemployed workers in the country.
Share of unemployed workers in labor force.
Average duration of an unemployment spell (calculated from
spells
completed in the current month), in months.
Share of workers being unemployed for more than 12 months
in total unemployment.
Number of new unemployed workers in the current month.
Number of recipients of UI benefits.
Share of recipients of UI benefits in total unemployment: E6/E1.
Average duration of the receipt of UI benefits (based on
individuals who
stopped receiving benefits in the current month), in months.
Number of new recipients of UI benefits in the current month.
Total benefits paid to recipients by UI fund.
Ratio of total benefits to country’s GDP.
46
UISIM
E13
E14
E15
E16
E17
E18
E19
E20
E21
E22
E23
User's Manual
Average Benefit
As % of Average Wage
% of Recipients with Minimum Benefit
% of Recipients with Maximum Benefit
Other Programs Participants
As % of Unemployment
Other Programs Expenditures
Total Expenditures
As % of GDP
Average Expenditure
As % of Average Wage
Average UI benefit: E11/E6.
Ratio of average benefit to economy wide average wage.
Share of recipients receiving the mandated minimum benefit.
Share of recipients receiving the mandated maximum benefit.
Total number of participants in other programs of the UI fund.
Share of unemployed workers participating
in other programs of the UI fund.
Total expenditures due to other programs of the UI fund.
Ratio of other programs expenditures to country’s GDP.
Average expenditure per other programs’ participant: E20/E17.
Ratio of average expenditure per other programs’ participant to
economy-wide average wage.
F. Contributors and contributions
F1
F2
F3
F4
Variable name
All Employees
Wage Bill: All Employees
As % of GDP
Average Wage
F5
Nominal Contributors
F6
F7
F8
As % of All Employees
Wage Bill: Nominal Contributors
As % of GDP
F9
F10
F11
F12
As % of Employees' Bill
Average Wage
Effective Contributors
As % of All Employees
F13
As % of Nominal Contributors
F14
F15
Wage Bill: Effective Contributors
As % of GDP
F16
As % of All Employees' Bill
F17
As % of Nominal Contributor's Bill
F18
F19
F20
F21
F22
F23
Average Wage
Contributions Due
Average Contribution Rate
Contributions Collected
Effective Average Contribution Rate
% of Contributions Collected
Definition
Total number of employed workers in the country.
Sum of wages of all employed workers.
Ratio of the wage bill of all employees to country’s GDP.
Economy wide average wage: F2/F1.
Number of employed workers who earn credits for unemployment
insurance contributions regardless of whether they pay
contributions or not.
Share of nominal contributors in employment: F5/F1.
Sum of wages of nominal contributors.
Ratio of wage bill of nominal contributors to country’s GDP.
Ratio of wage bill of nominal contributors to wage bill
of all employees: F7/F2.
Average wage of nominal contributors: F7/F5.
Number of employed workers who actually pay contributions.
Share of effective contributors in employment: F11/F1.
Collection rate (share of effective contributors
in nominal contributors): F11/F5.
Sum of wages of effective contributors.
Ratio of wage bill of effective contributors to country’s GDP.
Ratio of wage bill of effective contributors to wage bill
of all employees: F14/F2.
Ratio of wage bill of effective contributors to wage bill
of nominal contributors: F14/F7.
Average wage of effective contributors: F14/F11.
Total contributions if all nominal contributors would pay them.
Average contribution rate if all nominal contributors
would pay contributions: F19/F7.
Total contributions as collected from effective contributors.
Average contribution rate of effective contributors: F21/F14.
Share of contributions due that are indeed collected: F21/F19.
47
UISIM
User's Manual
G. Financial flows
G1
G2
G3
G4
G5
G6
G7
Variable name
Total Revenue
Contributions
Government Transfers
Investment Returns
Other Revenue
Total Expenditure
Benefits
G8
Other Programs
G9
Administrative Costs
G10
Assets Management Costs
G11
Other Expenditure
G12
Current Balance
G13
Fund Reserve
G14
Government Obligations
G15
Aggregate Fund Reserve
G16
Reserves Divided by Expenditure
G17
G18
G19
G20
G21
G22
G23
G24
G25
G26
G27
G28
G29
G30
G31
G32
G33
G34
G35
G36
G37
G38
G39
G40
G41
G42
G43
As % of GDP
Total Revenue
Contributions
Total Expenditure
Benefits
Current Balance
Fund Reserve
Government Obligations
Aggregate Fund Reserve
As % of Contributors' Wage Bill
Total Revenue
Contributions
Total Expenditure
Benefits
Current Balance
Fund Reserve
Government Obligations
Aggregate Fund Reserve
Net Present Value
Total Revenue
Contributions
Total Expenditure
Benefits
Current Balance
Fund Reserve
Government Obligations
Aggregate Fund Reserve
Definition
Total revenue of the UI fund in the current month.
Revenue of the UI fund due to contributions.
Revenue of the UI fund due to unconditional government transfers.
Revenue of the UI fund due to investment of fund reserves.
Other revenue of the UI fund.
Total expenditure of the UI fund in the current month.
Expenditures of the UI fund incurred by benefit payments.
Expenditures of the UI fund related to other (non-UI) programs funded
by the fund.
Expenditure of the UI fund for administrative costs.
Expenditure of the UI fund paying management costs
of fund’s reserves.
Other expenditure of the UI fund.
Current balance of the fund, i.e., the difference between
revenues and expenditures in the current month: G1-G6.
UI fund reserves at the end of the current month.
The government transfer needed to prevent
the fund from going into negative.
UI fund reserves if there were no government transfers (G14).
Number of months the UI fund could finance expenditures
if there were no revenues: G13/G6.
Ratio of G1, G2, G6, G7, and G12 – G15 to
country’s GDP.
Ratio of G1, G2, G6, G7, and G12 – G15 to
effective contributors wage bill.
G1, G2, G6, G7, and G12 – G15 in base year January prices.
48
UISIM
G44
Contributions Required Index
G45
Benefits Affordable Index
User's Manual
Share of current contributions required to finance
current expenditures of the UI fund (in percent).
Share of current benefits the UI fund could afford using
all current revenues of the fund (in percent).
49