1
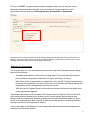
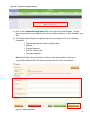
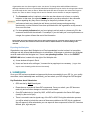
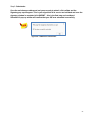
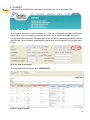
QIP NAVIGATOR User Guide Nov.10, 2015 v. 8 Contents 1. INTRODUCTION TO QIP NAVIGATOR:.................................................................................................. 3 2. QIP NAVIGATOR - INTERFACE AT A GLANCE: .................................................................................. 4 Left-Hand Navigation Menu ............................................................................................................................ 4 Top Navigation Menu....................................................................................................................................... 5 Sector QIPs ....................................................................................................................................................... 6 3. OUR QIPS: .................................................................................................................................................... 7 The Progress Report ....................................................................................................................................... 8 Exporting the Progress Report ................................................................................................................. 10 Uploading Organization Logo ................................................................................................................... 13 Exporting the Narrative .............................................................................................................................. 14 The Workplan.................................................................................................................................................. 16 Adding Data and Information to the Priority Indicators ......................................................................... 16 NEW: Adding Survey Data for Auto Calculation (Primary Care sector only): ................................... 18 Adding Data to Additional Indicators ....................................................................................................... 20 Adding NEW Indicator: .............................................................................................................................. 20 To Add Change Ideas with the Workplan: .............................................................................................. 22 Exporting the Workplan ............................................................................................................................. 25 4. SUBMISSION: ............................................................................................................................................ 25 How to Submit your QIP: a 2 Step Process: .............................................................................................. 26 5. QUERIES..................................................................................................................................................... 28 6. TROUBLESHOOTING TIPS: ................................................................................................................... 29 2 1. INTRODUCTION TO QIP NAVIGATOR: Quality Improvement Plans (QIPs) are submitted using Health Quality Ontario’s convenient online tool, the QIP Navigator. The Navigator is designed to streamline QIP development and submission and act as a collaborative space for quality improvement team members. The QIP Navigator also allows organizations to search their peers’ submissions to learn, identify change ideas for improvement and for comparison. The tool includes assistance in the form of guides, videos, and access to numerous tools and resources designed to help Ontario’s health care organizations create, maintain and implement their annual QIPs. This manual describes the basic functions and how to use the Navigator. For Ontario health care organizations, the QIP Navigator: Serves as a collaborative quality improvement planning tool to enter data, and share plans with your colleagues, and revise the QIP; Is the online submission tool for QIPs; Contains historical QIP submissions for longitudinal comparison; Provides a secure online space that only your team can access; Allows users to export QIPs as Excel spreadsheets for distribution; and Minimizes errors to improve data quality (i.e. won’t accept blank cells; forces numerical data and includes pre-populated data wherever available) Figure 1 - Common Acronyms Common Acronyms used in QIP Navigator User Manual HQO Health Quality Ontario MOHLTC Ministry of Health and Long-Term Care ECFAA Excellent Care for All Act QIP Quality Improvement Plan LTC Long Term Care PC Primary Care CCAC Community Care Access Centre 3 2. QIP NAVIGATOR - INTERFACE AT A GLANCE: Left-Hand Navigation Menu The QIP Navigator public interface displays a panel on the left-hand side for easy access to information about the QIP Navigator, Quality Improvement Plans (QIPs) and Health Quality Ontario (HQO). This is also where organizations will log in using their unique user names and passwords. Figure 2 – Login Note: The “Forgot Password?” function will only work if the organization has an active email address entered in their unique user PROFILE. The person primarily responsible for the QIP should be listed in the user profile. The profile is also where passwords can be changed or updated, however please remember to share new passwords with your team accordingly. 4 Top Navigation Menu The top QIP Navigator menu includes HOME, RESOURCES, SECTOR QIPs and QUERY QIPS tabs. All of these tabs are publically accessible, so even staff who are not responsible for QIP data entry can access quality improvement resources or view other organization’s QIPs. Figure 3 – Navigator Menu Once organizations login to their individual accounts, the OUR QIPS tab will appear. Figure 4 – Our QIPs Tab 5 Resources This section houses QIP-related resources, including: the QIP Guidance Document, Indicator Technical Specifications, and HQO’s annual QIP analyses. There are sector-specific resources available for hospitals, primary care organizations, community care access centres (CCACs), and long-term care as well as frequently asked questions (FAQs). Figure 5 – Resources Sector QIPs The SECTOR QIPs tab contains all of the QIPs submitted to HQO. Users can easily search and sort by organization name, year, sector, LHIN, and organizational type/model. They can also search by organization name. It is anticipated that by providing access to all QIPs, system-wide learning and capacity building will be possible with respect to setting targets, identifying new indicators and measures, and identifying effective change ideas. Figure 6 – Sector QIPs 6 Once a search or sort function is performed, users should hit the RESET button, located on righthand side of screen, prior to performing another search. This will reset the pool of QIP records to ensure they are all included in the next search or sort. All organizations that submit a QIP to HQO will have their QIPs posted on this page. This policy aligns with the Ministry of Health & Long-Term Care’s QIP policy and the principles of the Excellent Care for All Act, 2010. 3. OUR QIPS: To access your QIP, you must login to the Navigator. a) Click OUR QIPS from the navigation menu on the top of the page. b) From the dashboard view, select the desired ACTION; EDIT, VALIDATE OR VIEW. Figure 7 – Our QIPs Dashboard View c) To begin working on your current QIP select EDIT. Once selected, the three components of a QIP (Progress Report, Narrative, and Workplan) will be accessible. The PROGRESS REPORT will be displayed first as this should be your starting point when developing your current QIP. By reviewing your progress from last year, including reflecting on change ideas and lessons learned – you have a great starting point for determining priority areas for improvement and to help guide the development of your current QIP. Figure 8 – Our QIPs Component Tabs d) Once your QIP is complete and is ready for submission to HQO, select the ACTIONS > VALIDATE button. The validate button will run the omission list and provide users with a print out of the omissions or errors that may be prohibiting submission. (The submission process will be covered more fully in Section 4: Submission). 7 The Progress Report We encourage you to complete this component first. This will allow you to review the plan from the previous year, reflect on challenges and achievements, and build on your previous QIP. Please note that the Progress Report will only be pre-populated for those organizations that have submitted a QIP via the QIP Navigator the previous year. To access the Progress Report, click on the PROGRESS REPORT tab, located beside the Narrative tab (see Figure 9). Figure 9 – Progress Report Tab Your Progress Report will open and the indicators and data from your previous QIP will be pulled into the report for comment. Your Performance and Target, as stated in your previous QIP, will be auto-populated into the Progress Report. You are expected to enter your Current Performance and Comments, which can be done by clicking on the EDIT button. In February, HQO will pre-populate the current performance with administrative data for some indicators and this will simultaneously update the current performance field on the Progress Report. Figure 10 – Edit, to add Current Performance and Comments 8 Once you click EDIT, a progress pop-up window will appear, where you can add your current performance information and comments. If you do not have a numerical value for current performance, then you may click Collecting Baseline, Not Available or Suppressed. Figure 11 – Enter Current Performance Please Note: Your current performance on the Progress Report should match the Current Performance as stated on your current QIP. If these values do not match at the time of submission, you will receive an error message, which will prohibit you from a successful submission. Reflection on Change Ideas The Progress Report is a tool that organizations can use to help identify linkages between change ideas and improvement. - It enables organizations to reflect on their change ideas. The tool automatically makes all priority indicator change ideas visible within the report. (See figure 12 below) - Most of this section is generated by an organization’s previous QIP. Therefore less data entry is required and organizations can focus on the exercise of reflection and lessons learned, and incorporate them into existing quality improvement activities. - HQO will use the Progress Report to share effective change initiatives and help guide future quality improvement supports. Organizations are asked to indicate whether their change ideas, as pulled from their previous QIP, were implemented as intended and to include any key lessons learned. Was the change idea adopted, altered or abandoned? What key challenges were faced? What advice would you give to others? Not implementing an idea, or having an idea not succeed should be considered important learnings and should not be regarded as a failure. There is also space to add additional or new change ideas that may have been developed and/or tested after the QIP was submitted. 9 Once you have completed this window, please click Save & Close. Figure 12 – Reflect on Change Ideas Please Note: If your change ideas state “please see above” in the previous year’s Workplan, this is an indication to HQO that you are using the same change ideas for multiple indicators. However with this new Progress Report, “same as above” will not be clear to HQO or the end-user of the QIP. Exporting the Progress Report Figure 13 – Exporting Progress Report Organizations will have two choices when exporting the Progress Report. They can choose to export a copy of the Progress Report with Change Ideas included or without Change Ideas. The version with Change Ideas will be posted on the sector QIPs page in order to share and build capacity around change ideas. (This is the version that will be used for the report queries). If your organization would like to publically post the version without change ideas on your website, please 10 download that version immediately after you have submitted your QIP. The export function will be disabled once the QIP submissions are officially closed in April and the QIP will become read-only. The Narrative The Narrative should highlight the main points of your organization’s QIP and describe how it aligns with other planning processes within your organization and with other initiatives underway across the province. Please refer to the Quality Improvement Plan (QIP) Guidance Document for Ontario’s Health Care Organizations for more information on how to complete the QIP Narrative. Figure 14 – Data Entry – Narrative Headings a) Click on the title of each heading (i.e., Overview, or the box with the plus sign (see Figure 14) to add information to each of the headings. b) Each Heading will have a pop-up box in which you can add your information 11 c) Under each heading there is an “upload image” button where organizations can upload a graphic or diagram to visually help narrate their story. Once you click “upload image” a select file pop up window will appear, and then upload that file. You can upload more than one image (up to a limit of five images per Narrative section), and move the image(s) up and down in order. There is a file size limit of 2MB per image. Note: all images will remain at the bottom of the text paragraph when exported Figure 15 – Selecting file then uploading images. d) There is no rich text formatting available. Therefore, for posting purposes or for internal organizational use, all formatting for the Narrative should be done after you have exported it into Microsoft Word. To format or resize the graphics you have uploaded into the Narrative, please ensure you click ‘enable editing’ on your word document. e) Any changes to the exported Word document cannot be uploaded back into QIP Navigator all revisions must be made in the tool. f) Once you have entered your information, click SAVE to save your information and continue working, or SAVE & CLOSE to save your information and close the box. Figure 16- Data Entry – View Narrative Headings window. (No Formatting available) 12 Hover Help in the QIP Narrative Hover help is the term HQO uses to describe the question mark icon. Each question mark icon provides guidance, examples, or references to help users complete their QIPs. If there is a lot of information in the hover help box, a scroll bar will appear on the right hand side. However, the text box will need to be locked or it will disappear as you move your mouse. You can lock the text box by clicking on the question mark icon, then moving your cursor to the top of the text box and clicking again. You will see the quad arrow icon appear. You have now locked the text box and can move it around the screen. To copy the hover help text, you must lock the text box and them move the cursor inside the box and highlight the text you want to copy. Use ‘Ctrl C’ to copy and ‘Ctrl V’ to paste the copied text. Figure 9a – Quad Arrow Icon To close the text box, click the blue “x” at the top right corner. Figure 10b – Hover Help text Uploading Organization Logo To upload your organization’s logo, click UPLOAD ORGANIZATION LOGO. Figure 11 – Upload Logo 13 a) An Upload Logo box will appear. Click Select. A second window will appear, which will allow you to browse your files for your organization’s logo. Figure 19 – Upload Box Figure 12 – Browse Files Box b) File images can be jpg, jpeg, png or gif and should not exceed 500KB. Click Open. c) From Figure 19, click the Upload button. d) Click Close once your logo has been uploaded successfully. The logo will be automatically inserted onto the front page of your QIP narrative template. Exporting the Narrative a) To export your QIP Narrative to Word, click on the EXPORT NARRATIVE button, found on the top right-hand side of the Narrative page (under the QIP Status bar). 14 Figure 21 – Export Narrative b) Your Narrative will export to a Word document that you can save as a draft and share with your colleagues, quality committee, and board. c) As previously mentioned, there is no rich text formatting available in the QIP Navigator (to reduce the risk of bugs and compatibility issues), so all formatting will need to be completed in Word. *We do caution users to wait until they are sharing later versions of the QIP document before they spend too much time on formatting – as all formatting will need to be re-done following each export. Therefore if formatting is not imperative to your reviewing audience, it is advised that you wait until the final version. d) All formatting, revisions, changes made to the exported Word document cannot be uploaded back into the QIP Navigator. All updates and changes must be completed within the QIP Navigator. NOTE: If you are using Google Chrome, the export function will create a large blank window. You will find your Word document on the lower left corner. Click on the Word icon and your narrative will open into the Narrative template. Figure 22 – Word Download Box in Chrome 15 The Workplan The Workplan is the main portion of your QIP. It describes the improvement targets and initiatives that your organization is committing to for the fiscal year. A set of priority indicators have been predefined to support a common language of quality across all organizations and sectors. Organizations are expected to review the priority indicators for their sector and determine which are relevant for their organization. Please note that if an organization chooses not to focus on a priority indicator, the organization is expected to provide a rationale for this decision in the comments section (This will be further addressed in the section on Change Ideas, pg. 24). Additional indicators can also be included in your QIP, as per your organization’s quality improvement goals. The Workplan has been designed to align with the Model for Improvement, with three essential questions driving the improvement process: 1. What are we trying to accomplish? (Red - AIM - Quality Dimension & Objective is populated) 2. How will we know that a change is an improvement? (Blue - MEASURE - the indicator is already populated. Organizations just need to fill in their current performance (may be subject to pre-population in Feb), target, and target justification) 3. What changes can we makes that will result in improvement? (Green - CHANGE - Change Ideas, Methods, Process Measures, Goals for Change Ideas & Comments) Figure 23 – Workplan Headings There is hover help available for all Workplan headings. Simply scroll over the heading. To access the Workplan, click on the WORKPLAN tab, which is located beside the NARRATIVE tab. You access this tab from the HOME menu or from OUR QIPs. Figure 24 – Workplan Tab Adding Data and Information to the Priority Indicators a) Move your cursor over the Measures area (a light blue filter will indicate which indicator you are about to work on). Click in the Measures area. b) A Measures pop-up box will appear. 16 Figure 25 – Measures Pop Up Box c) The priority indicators are pre-defined and users only need to fill in the Current Performance*, Absolute Target and Target Justification, (see red square in Figure 25). (*Current Performance will be pre-populated in February of each year with administrative data, where possible). d) A ‘direction for improvement’ visual reminder has been added to pre-defined indicators to indicate the direction that targets should be set in relation to the current performance. If a retrograde target, or target that is worse than current performance, is entered the system will notify users ONCE that a retrograde target has been set, and will remind users to ensure rationale is included in the target justification field. e) If your current performance has not been pre-populated, or you do not know your current performance because you are currently collecting baseline data, you can click on the Collecting Baseline button. Likewise, if your data set is very small and, due to privacy reasons, you would like to suppress your data, you can click the Suppressed button. (see purple oval in Figure 25). As per CIHI and MOHLTC guidelines, the suppression rule is applied to all indicators where the numerator was less than 5 and greater than O, or the denominator was less than 29. An ‘x’ will be populated in that field to indicate that your data has been suppressed. f) Even if you are collecting baseline, you can still provide an Absolute Target, which can be based on benchmarks where they exist, past performance, literature or matching targets that 17 have been set by your peers. Alternatively, if you are collecting baseline, you can set a target to collect baseline. (this is the only scenario where collecting baseline is accepted as a target). g) The Relative Target is automatically calculated. It is the difference between your current performance and your absolute target, and is expressed as a percentage. It is included to help organizations easily/visually determine the strength or weakness of the target they set. The Percentage Change Calculator will quantify the change from one number to the other and express the change as a percentage increase or decrease. For example: From 10 apples to 20 apples is a 100% increase in apples. This calculator is most commonly used when there is an “old” and “new” number or an “initial” (current performance) and “final” (target) value. A positive change is expressed as an increased amount of the percentage value while a negative change is expressed as a decrease amount of the absolute value of the percentage value (see blue oval in Figure 25). h) Once you have filled in the Current Performance, Absolute Target and Target Justification, click on the Save & Close button. i) OTHER: DELETE THIS MEASURE, is used when organizations decide that they don’t want to include an indicator that they previously created in the QIP and want to erase the indicator all together. It removes the indicator from your QIP. Please note that Priority indicators cannot be deleted from the QIP Workplan. CLEAR ALL FIELDS, will clear the applicable fields that were entered by the user. It will not clear the pre-defined, greyed out fields or remove the indicator from the QIP. This function simply clears the fields and allows the user to start again. NEW: Adding Survey Data for Auto Calculation (Primary Care sector only): The Primary Care QIP includes five priority indicators. Four of the five indicators are survey based. To assist organizations in calculating their survey questions in a consistent manner, we have created an auto-calculation feature. Organizations are encouraged to use the exact wording identified in the technical specifications document in order to allow their data and information to be compared at a provincial level. When entering current performance for the indicator, primary care organizations will have three choices: 1. To add data by clicking on the Survey button. This will trigger a pop up window to enter the survey responses for auto-calculation, (see figure 26). 2. If collecting baseline survey data: click Collecting Baseline. (please note: primary care organizations should no longer be collecting baseline data, due to the fact that they are going into year three of QIP development. The only organizations collecting baseline would be newly established organizations required to create a QIP for the first time). 18 3. If data is suppressed: click suppressed (as mentioned above, data is normally suppressed if it reflects a numerator less than 5 or a denominator less than 29. In most cases the surveys are anonymous so there isn’t a need for suppression). Once a user clicks on the Survey button, the following pop-up window will appear. Figure 136 – Survey Calculation Window [Applicable For Primary Care only at this time] Users must fill in all the response fields in order for the calculation to work properly. Zero is a value and should only be entered if the response is truly zero. All ‘not applicable’ or unknown responses should be captured in the ‘n/a’ field. Once all data has been entered click Save, and the calculation will automatically appear in the current performance field. If your survey data should change before you submit your QIP, you can enter your data again by clicking on the Survey button to begin the process again, or by clicking on Clear All Fields which will clear all the fields that you previously entered (including target and target justification). The Auto calculation is based on the following calculation as per the Technical Specifications: For Access The last time you were sick or were concerned you had a health problem, how many days did it take from when you first tried to see your doctor or nurse practitioner to when you actually saw him/her or someone else in their office? a) Same day b) Next day c) 2-19 days (enter number of days: ______ ) d) 20 or more days e) Not applicable (Don’t know/ refused) To calculate the indicator result, add the number of respondents who responded “same day” and “next day”, divide by the number of respondents who registered an answer for this question (do not include non-respondents or respondents who answered “not applicable/ Don’t know/ refused”). *************************************************************************************************** Patient Experience indicator calculation Percent of respondents who responded positively, using the scale “always, often, sometimes, rarely, never, not applicable (Don’t know/ refused)”: To calculate the indicator result, add the number of respondents who responded “always” and “often”, divide by the number of respondents who registered an answer for this question (do not include non-respondents or respondents who answered “not applicable/ Don’t know/ refused”). 19 Adding Data to Additional Indicators Most sectors have additional indicators with standard definitions that have been pre-built into the QIP Navigator. These additional indicators have been placed in a drop-down menu. Figure 147 – Additional Indicators Button By clicking on the Indicators button, the additional indicators are visible. In order to make the additional indicator an active indicator that will remain visible on your QIP, simply add target data. Note: Before submission can successfully occur, all fields for that indicator must be filled out in full. The additional indicators are in purple font and not the red, priority indicator font. Figure 158 – Additional Indicators, Expanded View Adding NEW Indicator: While organizations are encouraged to focus on the priority indicators, they are also encouraged to include any indicators that are relevant to their organization and the patients/clients/residents that they serve. Therefore, the QIP Navigator allows organizations to create a new custom indicator. 20 Figure 169 – Add New Measure Button a) By clicking on the +Add New Measure box, located at the bottom of each quality domain, organizations can create a new indicator. b) A New Measure dialog box will appear and users may create the new measure by including the pertinent attributes of an indicator. The Measures box is virtually a blank slate where users can complete the following, mandatory fields: Objective Measure/Indicator Unit of Measure Population Data Source Period 21 . Figure 30 – Mandatory Fields c) There is a drop-down list of common attributes included, however if the attribute you seek is not included (e.g., a particular unit or clinical program) then please leave as ‘Other’, and to the right you will be able to specify what ‘Other” means. Figure 31 – Other Attribute d) When you fill out the Period attribute, you must specify what period you are measuring. i. ie. Period = Quarter Please specify * = Q2 e) Once you have filled in the Measures box, click Save or Save & Close. f) Should you wish to remove this custom indicator from your QIP at a later time, you can simply click on the indicator to bring up this measures box and then the Delete This Measure button. To Add Change Ideas with the Workplan: Based on the Model for Improvement, the right side of the QIP, or Change Ideas Section, is where organizations will include details about the change ideas that they will test in order to achieve the improvements that they seek. 22 Figure 32 – +Add New Change Idea Button a) Click on the + Add New Change Idea button, on the right side of the Workplan. Change ideas are required for every indicator that you are actively working on, or have included in your QIP. b) The Change Ideas dialog box will appear and users are expected to fill out the following information: Planned Improvement Initiative (Change Idea) Methods Process Measures Goal For Change Idea Comment (optional) Note: Not all fields need to be filled out in order to save the information, however, to successfully submit the QIP, all fields must be filled out at the time of submission. Figure 33 – New Change Ideas 23 c) The Change Number (#) will automatically be filled in by the tool, and will re-sequence if change ideas are deleted. d) The Go to Change # will automatically take you to the Change Ideas window related to the Change Idea #. e) Once a change idea has been added, hit Save, then + Add New Change Idea; or hit Save & Close if you are done adding change ideas for that indicator. If you do not click Save after filling out the change ideas box and click +Add New Change Idea it will override your idea and add a new idea without saving the work you just entered (see reminder message below in Figure 34). Figure 34 – Reminder Message e) Organizations should include one change idea, method, process measure and goal per Change Idea #, then add a new change idea. Please do not put 1) change idea, 2) change idea,… in the same field box. Figure 35 – One Idea per Change Number 24 Organizations are also discouraged to enter “see above” for change ideas within different indicators. Although indicators that focus on patient/resident/client satisfaction may be similar, the change ideas should not necessarily be the “same as above”. When HQO pulls QIP data for analysis and reviews the Progress Report, the “same as above” change idea is hard to evaluate as each indicator is analyzed separately. f) The Comments section is optional, unless the user has chosen not to focus on a priority indicator. In that case, the organization is expected to provide a rationale in the comments section regarding why they are not focusing on that priority indicator this year - i.e. performance levels may already be well above provincial average and approaching benchmarks; or other indicators have been prioritized within the organization as key areas to focus on at this time. g) For those priority indicators that you’re not going to actively work on, please only fill in the comments section with the rationale. For example, if you also add your current performance or a target, the system will want the rest of the information. Please Note: the priority indicators that have no data included and only a rationale will not export to the excel document. However, the comments section will be visible to HQO and allow for an understanding of the rationale. Exporting the Workplan Organizations can export their Workplan to an Excel spreadsheet in order to share it at committee meetings and with internal stakeholders prior to submission. All changes or revisions to the Workplan must be made within the Navigator tool – there is no uploading function. Click on the EXPORT WORKPLAN button, located at the top right of the Workplan tab. a) A new window will open in Excel. b) Users can format cells, add logos*, increase font or page layout as necessary. (*Logos often require some formatting within the excel document). 4. SUBMISSION: Once your QIP has been reviewed and approved by those accountable for your QIP (i.e. your quality committee, senior leadership team and board), you can submit your QIP through the QIP Navigator. Key Reminders about Submission: QIPs are due by April 1 each year. Please be sure to review all three QIP components. Once you submit, your QIP becomes read-only and no further changes or revisions can be made. Once QIP submission is ‘closed’ by HQO, all QIPs will be posted to the Sector QIPs page (usually by the end of April). There is no need to send a signed copy of the QIP to HQO. During the submission process you will be asked to include the names of those accountable on the QIP (this is considered sign-off approval). After submission you can export all three components of the QIP, format as desired, print, sign and post. 25 How to Submit your QIP: a 2 Step Process: Step 1: Validation From the OUR QIPs tab you will click on the Validate button (see Figure 36). Figure 36 – Validate Button If your QIP has no blank cells or omissions and essentially passes validation, a pop-up Signatory window will appear and prompt you to add the names of those accountable for your QIP. If you are ready to submit then simply fill in the appropriate names and click SUBMIT, if you are not quite ready, just hit CANCEL. Figure 37 – Sign off window If there is missing information in your QIP, a pop-up window will appear with a list of omissions that you can print out for easy reference. This list identifies which indicator is missing information, and what piece of information is missing. Once you have printed the list, click CLOSE and return to your QIP by clicking EDIT from the dashboard. Fill in the omissions as required and revalidate by following the steps above. Figure 38 – Omissions Report 26 Step 2: Submission Once the omissions are addressed and you are ready to submit, click validate and the Signatory pop-up will appear. This is your signal that all is correct and validated and once the signatory window is completed click SUBMIT – this is the final step and considered Submitted. A pop up window will confirm that your QIP was submitted successfully. Figure 39 – Submission confirmation. 27 5. QUERIES There are 5 new QUERIES that organizations or the public can run on submitted QIPs. Figure 40 – Query QIPS tab Query Reports can be run on either Indicators or on Text from the Narrative, Workplan and Progress Report. When running the reports, it is strongly advised to be as specific as possible and avoid running reports that encompass “All” parameters as this will result in potentially thousands of records to go through. The more specific and detailed the parameters, the more specific the outcome report will be. Figure 41 – How to View Report Once the parameters are chosen, click VIEW REPORT. Figure 42 – Report Outcome 28 A report is generated that can be exported in a number of formats including excel and word. The report will provide the organization demographics, aim, measure and change ideas. These reports allow users to query submitted QIPs to search for data on specific indicators or keyword search, enabling uses to compare their own data with other organizations of similar type or within the same LHIN. The report includes the Parameters Selected, number of pages, and ability to export. Figure 43 – Report Pages, Export 6. TROUBLESHOOTING TIPS: a) While all the fields do not need to be filled in at once (users can start to fill in the measures or change ideas sections and go back in later once they have more information or time), users must fill in all fields in order to successfully submit their QIPs. The reason for this is that if you’re including an indicator on your QIP, then you should be actively working to improve it. This means you should have a target, target justification, and at least one change idea planned for that indicator (including the method, process measure, goal for that change idea). b) For those priority indicators that you are not going to actively work on – please only fill in the comments section with a rationale. For example if you also add your current performance or a target, the system will want the rest of the information. c) To view images in the Narrative that have been uploaded, please ensure the ‘enable editing’ is activated in the Word export. This will also allow you to resize or format the images. 29 d) To increase the size of boxes in the Reports window – pull down the right corner of the box. Figure 44 – How to Increase parameter window e) To zoom or increase the font size: In Google Chrome: at the top right Customize button, click open the window and adjust the zoom. Figure 45a – Google Chrome Zoom location 30 In Internet Explorer: At the top right Tools Button, click open window and adjust the Zoom. Figure 45b – Internet Explorer Zoom location 31